

Technical Note: Downscaling RCM precipitation to the station scale using statistical transformations—A comparison of methods
Open accessPublished version of a preprint
The DOI matches its Crossref record; 41 of the 41 references it cites were found in a registry or an index.
Abstract
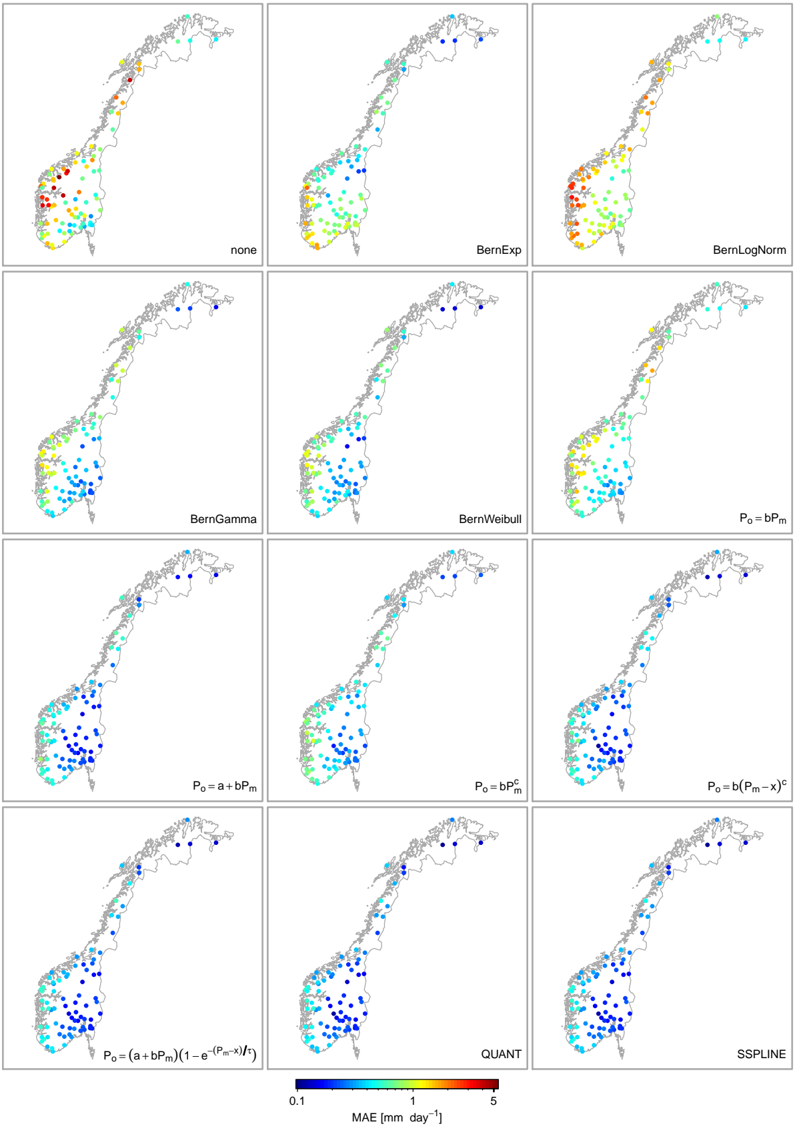
The impact of climate change on water resources is usually assessed at the local scale. However, regional climate models (RCMs) are known to exhibit systematic biases in precipitation. Hence, RCM simulations need to be post-processed in order to produce reliable estimates of local scale climate. Popular post-processing approaches are based on statistical transformations, which attempt to adjust the distribution of modelled data such that it closely resembles the observed climatology. However, the diversity of suggested methods renders the selection of optimal techniques difficult and therefore there is a need for clarification. In this paper, statistical transformations for post-processing RCM output are reviewed and classified into (1) distribution derived transformations, (2) parametric transformations and (3) nonparametric transformations, each differing with respect to their underlying assumptions. A real world application, using observations of 82 precipitation stations in Norway, showed that nonparametric transformations have the highest skill in systematically reducing biases in RCM precipitation.
Overview
The claims and statistics of this paper haven’t been checked yet.
Free: it reads the open-access text and checks the first 5 claims that cite a source we can check. Create a free account to check every claim.
Integrity signals
Registry
Cites
Statistics
Figures



Verification
Claims the paper makes
The claims and statistics of this paper haven’t been checked yet.
Free: it reads the open-access text and checks the first 5 claims that cite a source we can check. Create a free account to check every claim.
Claims other papers make about this one
Each is checked against this paper’s own text: does it say what the citing paper says it does?
The source backs part of the claim, not all of it — or backs it for a different population, condition or comparison.
In the citing paper
“Quantile mapping is the most used bias correction technique due to its ease of handling large amounts of data and its computational efficiency [58,59].”
From Climate Change Impacts on Streamflow in the Krishna River Basin, India: Uncertainty and Multi-Site Analysis (2022) · cites this paper as [58]
Experimental — accuracy not yet measured
Self-check
Percentages, sums and reported differences re-computed from the paper’s own numbers.
The self-check needs the paper’s full text.
Citations
Cites
The Elements of Statistical Learning
Hastie, T., Friedman, J., & Tibshirani, R. (2001) · Springer Series in Statistics · doi:10.1007/978-0-387-21606-5 · Cited by 24,162
Uppala, S. M., KÅllberg, P. W., Simmons, A. J., Andrae, U., Bechtold, V. D. C., Fiorino, M., Gibson, J. K., Haseler, J., Hernandez, A., Kelly, G. A., et al. (2005) · Quarterly Journal of the Royal Meteorological Society · doi:10.1256/qj.04.176 · Cited by 6,804 · cited 1×
“Modelled precipitation was extracted from a HIRHAM RCM simulation with 25 km resolution (Førland et al., 2009, 2011) forced with the ERA40 reanalysis (Uppala et al., 2005) on a model domain covering Norway and the Nordic Arctic.”
MethodTeutschbein, C., & Seibert, J. (2012) · Journal of Hydrology · doi:10.1016/j.jhydrol.2012.05.052 · Cited by 2,214 · cited 13×
“, 2011; Teutschbein and Seibert, 2012), the standard deviation (Engen-Skaugen, 2007; Li et al., 2010; Themeßl et al., 2011; Teutschbein and Seibert, 2012) and the skewness (Li et al.”
BackgroundMethodResultInfluentialHydrologic Implications of Dynamical and Statistical Approaches to Downscaling Climate Model Outputs
Wood, A. W., Leung, L. R., Sridhar, V., & Lettenmaier, D. P. (2004) · Climatic Change · doi:10.1023/b:clim.0000013685.99609.9e · Cited by 1,886 · cited 3×
“(2) using the empirical CDF of observed and modelled values instead of assuming parametric distributions (e.g.Panofsky and Brier, 1968; Wood et al., 2004; Reichle and Koster, 2004; Boé et al., 2007; Themeßl et al., 2011, 2012).”
BackgroundMethodMaraun, D., Wetterhall, F., Ireson, A. M., Chandler, R. E., Kendon, E. J., Widmann, M., Brienen, S., Rust, H. W., Sauter, T., Themeßl, M., et al. (2010) · Reviews of Geophysics · doi:10.1029/2009rg000314 · Cited by 1,805 · cited 3×
“Further, “statistical bias correction” (Piani et al., 2010a,b), “direct error correction methods” (Themeßl et al., 2011) and “model output statistics (MOS)” (Maraun et al., 2010) have been used to refer to the methods under investigation.”
MethodStatistical bias correction for daily precipitation in regional climate models over Europe
Piani, C., Haerter, J. O., & Coppola, E. (2010) · Theoretical and Applied Climatology · doi:10.1007/s00704-009-0134-9 · Cited by 1,154 · cited 9×
“…a set of scores is needed that quantifies the similarity of the observed and the (corrected) modelled empirical CDF. Previously used scores include overall measures, such as the root mean square error (Piani et al., 2010b) or the Kolmogorov-Smirnov two sample statistic (Dosio and Paruolo, 2011).”
BackgroundMethodInfluentialSome applications of statistics to meteorology
Panofsky, H. A., Brier, G. W., & Best, W. H. (1958) · University of Michigan Library Repository · Cited by 1,083
Li, H., Sheffield, J., & Wood, E. F. (2010) · Journal of Geophysical Research: Atmospheres · doi:10.1029/2009jd012882 · Cited by 901 · cited 6×
“Other suggested scores assess specific moments of the distribution including the mean (Engen-Skaugen, 2007; Li et al., 2010; Dosio and Paruolo, 2011; Themeßl et al., 2011; Turco et al., 2011; Teutschbein and Seibert, 2012), the standard deviation (Engen-Skaugen, 2007; Li et al., 2010; Themeßl et…”
BackgroundMethodInfluentialHow Well Do Coupled Models Simulate Today's Climate?
Reichler, T., & Kim, J. (2008) · Bulletin of the American Meteorological Society · doi:10.1175/bams-89-3-303 · Cited by 881
Piani, C., Weedon, G. P., Best, M., Gomes, S. M., Viterbo, P., Hagemann, S., & Haerter, J. O. (2010) · Journal of Hydrology · doi:10.1016/j.jhydrol.2010.10.024 · Cited by 868 · cited 9×
“…a set of scores is needed that quantifies the similarity of the observed and the (corrected) modelled empirical CDF. Previously used scores include overall measures, such as the root mean square error (Piani et al., 2010b) or the Kolmogorov-Smirnov two sample statistic (Dosio and Paruolo, 2011).”
BackgroundMethodInfluential
Cited by
Items 501–600 of 1,001
Beza, M., & Moshe, A. (2024) · Journal of Water and Climate Change · doi:10.2166/wcc.2024.591 · Cited by 21
Ghimire, U., Babel, M. S., Shrestha, S., & Srinivasan, G. (2019) · Climatic Change · doi:10.1007/s10584-019-02444-3 · Cited by 21
“The “Qmap” package available in R was used in this study to map the quantiles of GCMs with those of observed rainfall at daily time step (Gudmundsson et al. 2012).”
MethodEvaluation of global ensemble prediction models for forecasting medium to heavy precipitations
Abdolmanafi, A., Saghafian, B., & Aminyavari, S. (2020) · Meteorology and Atmospheric Physics · doi:10.1007/s00703-020-00731-8 · Cited by 22
Torma, C. Z., Kis, A., & Pongrácz, R. (2020) · Időjárás · doi:10.28974/idojaras.2020.1.2 · Cited by 21
“In principle, the quantile mapping method is easy to implement, which makes this method attractive among the climate research community (e.g., Gudmundsson et al., 2012; Fang et al., 2015).”
MethodSun, C., Xiao, Z., & Nguyen, M. N. (2021) · Advances in Climate Change Research · doi:10.1016/j.accre.2021.03.001 · Cited by 21
Validation of a Simulation Chain to Assess Climate Change Impact on Precipitation Induced Landslides
Zollo, A. L., Rianna, G., Mercogliano, P., Tommasi, P., & Comegna, L. (2014) · Springer eBooks · doi:10.1007/978-3-319-04999-1_39 · Cited by 21
“In the literature, other QM approaches using empirical distribution functions exist and have the advantage of being used without specific assumptions about rainfall frequency distribution (Lafon et al. 2013; Gudmundsson et al. 2012).”
BackgroundPatagoniaMet: A multi-source hydrometeorological dataset for Western Patagonia
Aguayo, R., León‐Muñoz, J., Aguayo, M., Villanueva, O. M. B., Zambrano‐Bigiarini, M., Fernández, A., & Jacques‐Coper, M. (2024) · Scientific Data · doi:10.1038/s41597-023-02828-2 · Cited by 30
“In this case, the transfer function was based on a linear parametric transformation 81,82 (Eq.”
MethodRahimi, L., Hoque, M., Ahmadisharaf, E., Alamdari, N., Misra, V., Maran, C., Kao, S., AghaKouchak, A., & Talchabhadel, R. (2024) · Earth s Future · doi:10.1029/2024ef004531 · Cited by 27
“0 mmday , (Gudmundsson et al., 2012; Polade et al., 2014) supposed to distinguish between wet and dry days.”
InfluentialByun, K., & Hamlet, A. F. (2024) · Environmental Research Letters · doi:10.1088/1748-9326/ad9b3d · Cited by 23
“These problems have been discussed in previous studies (Gudmundsson et al 2012, Gutjahr and Heinemann 2013, Salathé et al 2014, Ivanov and Kotlarski 2017, Switanek et al 2017).”
Bagiliko, J., Stern, D., Ndanguza, D., & Torgbor, F. F. (2025) · Theoretical and Applied Climatology · doi:10.1007/s00704-025-05462-7 · Cited by 24
“Numerous studies have demonstrated effective bias-correction techniques for REs (e.g., Gudmundsson et al. 2012; Schmidli et al. 2006), which could be adapted for this purpose.”
Smith, P. L., Heinrich, G., Suklitsch, M., Gobiet, A., Stoffel, M., & Fuhrer, J. (2014) · Climatic Change · doi:10.1007/s10584-014-1263-4 · Cited by 21
“However, Themessl et al. (2011a, b) compared several bias correction methods and identified QM as being superior, and Gudmundsson et al. 2012 showed that the parameter-free implementation of QM used here outperforms other implementations.”
Agbazo, M. N., & Grenier, P. (2019) · International Journal of Climatology · doi:10.1002/joc.6432 · Cited by 20
“This technique is commonly used in climate services under different variants and names (e.g., Piani et al., 2010; Haerter et al., 2011; Gudmundsson et al., 2012; Räty et al., 2014; Lehtonen et al., 2016; Gagnon et al., 2019).”
MethodZhang, C., Wu, S., & Leng, G. (2020) · Journal of Geographical Sciences · doi:10.1007/s11442-020-1778-8 · Cited by 20
On the verification of ensemble precipitation forecasts over the Godavari River basin
Manikanta, V., Teja, K. N., Das, J., & Umamahesh, N. V. (2022) · Journal of Hydrology · doi:10.1016/j.jhydrol.2022.128794 · Cited by 21
Méndez-Morales, M., Calvo-Valverde, L.-A., Imbach, P., Maathuis, B. H. P., Hein‐Griggs, D., Hidalgo-Madriz, J.-A., & Alvarado-Gamboa, L.-F. (2022) · Sustainability · doi:10.3390/su142416938 · Cited by 21
Kern, A., Dobor, L., Hollós, R., Marjanović, H., Torma, C. Z., Kis, A., Fodor, N., & Barcza, Z. (2023) · Climate Services · doi:10.1016/j.cliser.2023.100443 · Cited by 23
Epstein, G., Fuller, S., Hingmire, D., Myers, P. G., Peña, M. A., Pennelly, C., & Baum, J. K. (2024) · Earth system science data · doi:10.5194/essd-16-2165-2024 · Cited by 22
Kamruzzaman, M., Islam, H. M. T., Rahman, M. S., Ahmed, S., Lipi, L. F., Khan, M. A. R., Tran, L. P., & Hossain, A. M. K. Z. (2024) · Theoretical and Applied Climatology · doi:10.1007/s00704-024-05270-5 · Cited by 21
Improving Hydro-Climatic Projections with Bias-Correction in Sahelian Niger Basin, West Africa
Oyerinde, G. T., Hountondji, F. C. C., Lawin, A. E., Odofin, A. J., Afouda, A. A., & Diekkrüger, B. (2017) · Climate · doi:10.3390/cli5010008 · Cited by 22
Future changes in five extreme precipitation indices in the lowlands of Romania
Harpa, G. V., Croitoru, A., Djurdjević, V., & Horváth, C. (2019) · International Journal of Climatology · doi:10.1002/joc.6183 · Cited by 20
“There are many studies using the same or a similar approach (Engen-Skaugen, 2007; Gudmundsson et al., 2012; Ruml et al., 2012; Wang et al., 2014; Fang et al., 2015; D'Oria et al., 2018).”
Passow, C., & Donner, R. V. (2019) · Stochastic Environmental Research and Risk Assessment · doi:10.1007/s00477-019-01750-7 · Cited by 26
Climate Change Impacts on Agricultural Drought with Consideration of Uncertainty in CMIP5 Scenarios
Cho, J., Ko, G., Kim, K., & Oh, C. (2016) · Irrigation and Drainage · doi:10.1002/ird.2035 · Cited by 20
Bias Correction in CMIP6 Models Simulations and Projections for Brazil’s Climate Assessment
Brumatti, L. M., Commar, L. F. S., Neumann, N. D. O., Pires, G. F., & Ávila-Díaz, A. (2024) · Earth Systems and Environment · doi:10.1007/s41748-023-00368-8 · Cited by 23
“Other studies found the same behavior for PREC in other countries (Gudmundsson et al. 2012; Enayati et al. 2021), with the QUANT and RQUANT methods standing out as the suitable bias-correction methods.”
Carvalho‐Santos, C., Marcos, B., Nunes, J. P., Regos, A., Palazzi, E., Terzago, S., Monteiro, A. T., & Honrado, J. P. (2019) · Remote Sensing · doi:10.3390/rs11232832 · Cited by 25
“Future DSR values for 2020–2049 were calculated for all climate scenarios, and bias-corrected using an empirical quantile mapping approach [40].”
MethodZhang, Q., Gan, Y., Zhang, L., She, D., Wang, G., & Wang, S. (2022) · International Journal of Climatology · doi:10.1002/joc.7687 · Cited by 21
“First, the CDFs are constructed for modelling historical data and observed data, respectively.”
BackgroundMethodInfluentialMarin, M., Clinciu, I., Tudose, N. C., Ungurean, C., Mihalache, A. L., Martoiu, N. E., & Tudose, O. N. (2022) · Water · doi:10.3390/w14182860 · Cited by 24
Schmidt, L. K., Francke, T., Grosse, P. M., & Bronstert, A. (2024) · Hydrology and earth system sciences · doi:10.5194/hess-28-139-2024 · Cited by 21
“For consistency, we applied the same bias-correction as Hanzer et al., i.e. quantile mapping, using the methodology by (Gudmundsson et al., 2012) as implemented in the R package qmap (Gudmundsson, 2016).”
Global Future Climate Signal by Latitudes Using CMIP6 GCMs
Song, Y. H., Chung, ., & Shahid, S. (2024) · Earth s Future · doi:10.1029/2022ef003183 · Cited by 26
“Nevertheless, GCM outputs show a large range of performances in different regions and continents (Fang et al., 2015; Gudmundsson et al., 2012; Song et al., 2020).”
BackgroundTariq, M., Rohith, A. N., Cibin, R., Aruffo, E., Abouzied, G. A. A., & Carlo, P. D. (2024) · Environmental Challenges · doi:10.1016/j.envc.2024.100899 · Cited by 19
Vineyard Microclimatic Zoning as a Tool to Promote Sustainable Viticulture under Climate Change
Fonseca, A., Cruz, J., Fraga, H., Andrade, C. M. M., Valente, J., Alves, F., Neto, A. C., Flores, R., & Santos, J. A. (2024) · Sustainability · doi:10.3390/su16083477 · Cited by 21
“Climate data operators (CDOs) [60] allow the analysis and manipulation of climate data to calculate climatic indices, which are crucial tools for analysing and understanding climate patterns.”
BackgroundUnfolding cascading impacts of changing South Asia monsoon on a Hindu Kush Himalayas basin
Maharjan, S., Li, W., Fazli, S., Ansari, A., Tiwari, S., Thakurathi, R., Thomas, R., & El-Askary, H. M. (2024) · Journal of Hydrology Regional Studies · doi:10.1016/j.ejrh.2024.102155 · Cited by 24
Grenier, P. (2017) · Journal of Applied Meteorology and Climatology · doi:10.1175/jamc-d-17-0177.1 · Cited by 21
Yaghoubi, F., Bannayan, M., & Asadi, G. A. (2020) · International Journal of Biometeorology · doi:10.1007/s00484-020-01931-y · Cited by 20
Reducing the Statistical Distribution Error in Gridded Precipitation Data for the Tibetan Plateau
Ma, J., Li, H., Wang, J., Hao, X., Shao, D., & Lei, H. (2020) · Journal of Hydrometeorology · doi:10.1175/jhm-d-20-0096.1 · Cited by 20
Climate Change Impact on Hydropower Resources in Gauged and Ungauged Lithuanian River Catchments
Jakimavičius, D., Adžgauskas, G., Šarauskienė, D., & Kriaučiūnienė, J. (2020) · Water · doi:10.3390/w12113265 · Cited by 19
“The nonparametric empirical quantile method is based on the concept that there is a transformation h, described by the following equation [21,22]:”
MethodSchmith, T., Thejll, P. A., Berg, P., Boberg, F., Christensen, O. B., Christiansen, B., Christensen, J. H., Steger, C., & Madsen, M. S. (2021) · Hydrology and earth system sciences · doi:10.5194/hess-25-273-2021 · Cited by 21
“In split-sample testing, the observations are divided into calibration and validation parts, often in the form of a crossvalidation (e.g. Gudmundsson et al., 2012; Li et al., 2017a, b; Refsgaard et al., 2014; Themeßl et al., 2011).”
MethodImpacts of changing watershed conditions in the assessment of future groundwater contamination risk
Persaud, E. M., & Levison, J. K. (2021) · Journal of Hydrology · doi:10.1016/j.jhydrol.2021.127142 · Cited by 19
Climate Services Toolbox (CSTools) v4.0: from climate forecasts to climate forecast information
Pérez‐Zanón, N., Caron, L., Terzago, S., Schaeybroeck, B. V., Lledó, L., Manubens, N., Roulin, E., Álvarez-Castro, M. C., Batté, L., Bretonnière, P.-A., et al. (2022) · Geoscientific model development · doi:10.5194/gmd-15-6115-2022 · Cited by 23
“Adaptation to CSTools Gudmundsson et al. (2012), Gudmundsson (2016) CST_DynBiasCorrection Applies a bias correction between the model and the observations using the division into terciles of the local dimension “dim” or inverse of the persistence “theta”.”
MethodSachindra, D. A., Huang, F., Barton, A., & Perera, B. J. C. (2014) · Journal of Water and Climate Change · doi:10.2166/wcc.2014.056 · Cited by 19
Weidemann, S. S., NETO, J. A., Jaña, R., Netto, G. T., González, I., Gino Casassa, R., & Schneider, C. (2020) · Geosciences · doi:10.3390/geosciences10070272 · Cited by 18
RoCliB – bias‐corrected CORDEX RCM dataset over Romania
Dumitrescu, A., Amihăesei, V.-A., & Cheval, S. (2022) · Geoscience Data Journal · doi:10.1002/gdj3.161 · Cited by 21
“QMAP is an univariate bias correction based on the quantile mapping algorithm (Boé et al., 2007; Gudmundsson et al., 2012).”
MethodInfluentialNested hydrological modeling for flood prediction using CMIP6 inputs around Lake Tana, Ethiopia
Alaminie, A. A., Amarnath, G., Padhee, S. K., Ghosh, S., Tilahun, S. A., Mekonnen, M. A., Assefa, G., Seid, A. H., Zimale, F. A., & Jury, M. R. (2023) · Journal of Hydrology Regional Studies · doi:10.1016/j.ejrh.2023.101343 · Cited by 18
Assessment of projected climate change impact on agro‐climatic indicators in Poland
Marcinkowski, P., Piniewski, M., & Jefimow, M. (2023) · International Journal of Climatology · doi:10.1002/joc.8185 · Cited by 15
“Systematic bias was reduced for each model by performing a statistical correction using a nonparametric quantile mapping method (Gudmundsson et al., 2012).”
MethodReliability of Ensemble Climatological Forecasts
Huang, Z., Zhao, T., Tian, Y., Chen, X., Duan, Q., & Wang, H. E. (2023) · Water Resources Research · doi:10.1029/2023wr034942 · Cited by 20
“The statistical distributions in Table 2 are combined with the Bernoulli distribution to consider the censoring characteristic (Gudmundsson et al., 2012; Huang et al., 2022; Papalexiou & Serinaldi, 2020): where CDF M (•) represents the CDF of mixed distributions; p , which is the parameter of the…”
MethodShafeeque, M., & Bibi, A. (2023) · Frontiers in Earth Science · doi:10.3389/feart.2023.1283171 · Cited by 18
Matiu, M., Napoli, A., Kotlarski, S., Zardi, D., Bellin, A., & Majone, B. (2024) · Climate Dynamics · doi:10.1007/s00382-024-07376-y · Cited by 18
“Simple and frequently used methods consist of the application of parametric and non-parametric adjustments to match modeled and observed variables (Gudmundsson et al 2012; Gutiérrez et al 2019).”
Lee, Y., Shin, Y., Boo, K., & Park, J. (2020) · Atmospheric Science Letters · doi:10.1002/asl.954 · Cited by 17
“Among the various statistical BC methods available (Maraun and Widmann, 2018), we employed the regression-type transfer function (TF) approach by Piani et al. (2010), using the R package, “qmap”, developed by Gudmundsson et al., 2012.”
MethodA new view on the risk of typhoon occurrence in the western North Pacific
Ng, K. S., & Leckebusch, G. C. (2021) · Natural hazards and earth system sciences · doi:10.5194/nhess-21-663-2021 · Cited by 20
Fathian, F., Ghadami, M., & Dehghan, Z. (2022) · Theoretical and Applied Climatology · doi:10.1007/s00704-022-04066-9 · Cited by 20
A 258-year-long data set of temperature and precipitation fields for Switzerland since 1763
Imfeld, N., Pfister, L., Brugnara, Y., & Brönnimann, S. (2023) · Climate of the past · doi:10.5194/cp-19-703-2023 · Cited by 25
Lee, T., & Park, T. (2017) · Journal of Hydrology · doi:10.1016/j.jhydrol.2017.01.049 · Cited by 18
Analysis of low flow indices under varying climatic conditions in Poland
Osuch, M., Romanowicz, R. J., & Wong, W. K. (2017) · Hydrology research · doi:10.2166/nh.2017.021 · Cited by 22
Uzielli, M., Rianna, G., Ciervo, F., Mercogliano, P., & Eidsvig, U. (2018) · Natural hazards and earth system sciences · doi:10.5194/nhess-18-3019-2018 · Cited by 18
“Climate simulations are adjusted for bias through an empirical quantile mapping approach (Gudmundsson et al., 2012) using data from Nocera Inferiore weather stations from the period 1981–2010.”
MethodExploring machine learning approaches for precipitation downscaling
Zhu, H., Zhou, Q., & Krisp, J. M. (2025) · Geo-spatial Information Science · doi:10.1080/10095020.2025.2477547 · Cited by 17
“RF is demonstrated to effectively downscale precipitation data from global climate models and achieve higher accuracy than traditional statistical downscaling methods (Gudmundsson et al. 2012).”
Schmidt, L. S., Langen, P. L., Ađalgeirsdóttir, G., Pálsson, F., Guðmundsson, S., & Gunnarsson, A. (2018) · Atmosphere · doi:10.3390/atmos9110450 · Cited by 20
Rößler, O., Kotlarski, S., Fischer, A. M., Keller, D., Liniger, M. A., & Weingartner, R. (2019) · Climate Services · doi:10.1016/j.cliser.2019.01.001 · Cited by 21
“According to Gudmundsson et al. (2012) , three di ff erent types of quantile – quantile transformations exist: transformations based on theoretical distributions (e.g., Piani et al. 2010a), parametric transformations (Piani et al. 2010b), and non-parametric transformations that use the full…”
Wei, X., Wang, G., Feng, D., Duan, Z., Hagan, D. F. T., Tao, L., Miao, L., Su, B., & Jiang, T. (2022) · International Journal of Climatology · doi:10.1002/joc.7926 · Cited by 19
Temme, F., Farías-Barahona, D., Seehaus, T., Jaña, R., NETO, J. A., González, I., Arndt, A., Sauter, T., Schneider, C., & Fürst, J. J. (2023) · The Cryosphere · doi:10.5194/tc-17-2343-2023 · Cited by 22
Selection and downscaling of CMIP6 climate models in Northern Nigeria
Muhammad, W. I., Usman, H. S., Nwankwegu, A. S., Usman, M. N., & Gebresellase, S. H. (2023) · Theoretical and Applied Climatology · doi:10.1007/s00704-023-04534-w · Cited by 18
“f5 local impact studies, RCM output needs to be bias-corrected (Gudmundsson et al., 2012; Piani et al., 2009).”
BackgroundGao, T., Li, J., Tang, Y., Jiang, X., & Huo, J. (2024) · Hydrological Processes · doi:10.1002/hyp.15180 · Cited by 17
“The main calculation formula is as follows: where The QM method is a typical frequency revision method and has been the mainstream method for bias correction of precipitation data internationally in recent years (Cannon et al., 2015; Gudmundsson et al., 2012).”
MethodMaxwell, J. T., Au, T. F., Kannenberg, S. A., Harley, G. L., Dannenberg, M. P., Ficklin, D. L., Robeson, S. M., Férriz, M., Benson, M., Lockwood, B. R., et al. (2024) · Global Change Biology · doi:10.1111/gcb.17474 · Cited by 16
Chae, S. T., & Chung, . (2024) · Journal of Hydrology Regional Studies · doi:10.1016/j.ejrh.2024.101973 · Cited by 27
Mou, S., Shi, P., Qu, S., Feng, Y., Chen, C., & Dong, F. (2020) · Atmospheric Research · doi:10.1016/j.atmosres.2020.104942 · Cited by 17
Song, J., Her, Y., Shin, S., Cho, J., Paudel, R., Khare, Y. P., Obeysekera, J. T. B., & Martinez, C. J. (2020) · Hydrological Sciences Journal · doi:10.1080/02626667.2020.1750616 · Cited by 18
Hydro-climatic extremes in the Himalayan watersheds: a case of the Marshyangdi Watershed, Nepal
Singh, R., Pandey, V. P., & Kayastha, S. P. (2020) · Theoretical and Applied Climatology · doi:10.1007/s00704-020-03401-2 · Cited by 17
“RCM projections can further be downscaled using approaches such as linear scaling (Teutschbein and Seibert 2012), quantile mapping (Gudmundsson et al. 2012), local intensity scaling (Fang et al. 2015), power transformation (Fang et al. 2015), variance scaling (Teutschbein and Seibert 2012; Fang et…”
MethodGallotti, G., Santo, M. A., Apostolidou, I., Alessandri, J., Armigliato, A., Basu, B., Debele, S. E., Domeneghetti, A., Ollauri, A. G., Kumar, P., et al. (2021) · Resources · doi:10.3390/resources10040036 · Cited by 18
“5 emission scenario, downscaled by regional model RCA4, and bias-corrected [45,46].”
MethodWatanabe, T., Takenaka, H., & Nohara, D. (2021) · Solar Energy · doi:10.1016/j.solener.2021.05.055 · Cited by 19
Torma, C. Z., & Kis, A. (2022) · International Journal of Climatology · doi:10.1002/joc.7654 · Cited by 20
AN OVERVIEW OF COUPLED GCM BIASES IN THE TROPICS
Richter, I., Doi, T., Chang, P., Xu, Z. L., Kataoka, T., Tozuka, T., Nagura, M., Oettli, P., & de Szoeke, S. P. (2015) · World Scientific series on Asia-Pacific weather and climate · doi:10.1142/9789814696623_0008 · Cited by 21
Uncertainty of annual runoff projections in Lithuanian rivers under a future climate
Akstinas, V., Jakimavičius, D., Meilutytė-Lukauskienė, D., Kriaučiūnienė, J., & Šarauskienė, D. (2019) · Hydrology research · doi:10.2166/nh.2019.004 · Cited by 17
Yang, L., Feng, Q., Yin, Z., Wen, X., Deo, R. C., Si, J., & Li, C. (2018) · Theoretical and Applied Climatology · doi:10.1007/s00704-018-2598-y · Cited by 21
A Norwegian Approach to DownscalingPreprint
Benestad, R. E. (2021) · doi:10.5194/gmd-2021-176 · Cited by 17
“Bias-adjustment doesn’t involve the dependency between spatial scales (Gudmundsson et al., 2012), and some will say it gives the right answers for the wrong reasons.”
BackgroundGao, Y., Zhou, M., Yu, Z., Ju, Q., Jin, J., & Zhang, D. (2024) · Journal of Hydrology · doi:10.1016/j.jhydrol.2024.132132 · Cited by 16
Influence of climate change on the ice conditions of the Curonian Lagoon
Jakimavičius, D., Šarauskienė, D., & Kriaučiūnienė, J. (2019) · Oceanologia · doi:10.1016/j.oceano.2019.10.003 · Cited by 17
Is time a variable like the others in multivariate statistical downscaling and bias correction?
Robin, Y., & Vrac, M. (2021) · Earth System Dynamics · doi:10.5194/esd-12-1253-2021 · Cited by 19
Swarna, S. T., & Hossain, K. (2022) · Road Materials and Pavement Design · doi:10.1080/14680629.2021.2019093 · Cited by 18
“BCCAQ is a hybrid method that associations with both Bias Correction/Constructed Analogues (BCCA) (Maurer et al., 2010) and quantile mapping (QMAP) (Gudmundsson et al., 2012).”
MethodMengistu, A. G., Woldesenbet, T. A., Dile, Y. T., & Bayabil, H. K. (2022) · Acta Geophysica · doi:10.1007/s11600-022-00956-8 · Cited by 18
“The distribution mapping approach fits the distribution of rainfall and temperature of RCMs with observational data using the Gamma distribution (Gudmundsson et al. 2012) and the Gaussian distributions (Cramér 1999).”
BackgroundMethodJi, X., Dong, W., Wang, W., Dai, X., & Huang, H. (2023) · Natural Hazards Review · doi:10.1061/nhrefo.nheng-1889 · Cited by 16
Land use and climate change-induced soil erosion mapping in a sub-tropical environment
Pal, S. C., Chakrabortty, R., Islam, A. R. M. T., Roy, P., Chowdhuri, I., Saha, A., Islam, A., Costache, R. D., & Alam, E. (2023) · Geomatics Natural Hazards and Risk · doi:10.1080/19475705.2023.2270129 · Cited by 18
“FX and FO can be derived either parametrically (Gudmundsson et al. 2012) or nonparametrically (Bennett et al. 2014) using a ‘lookup table’, ‘empirical distribution function’, or ‘kernel density estimation’.”
MethodQuilcaille, Y., Gudmundsson, L., & Seneviratne, S. I. (2023) · Earth System Dynamics · doi:10.5194/esd-14-1333-2023 · Cited by 21
Self-citationPadua, V. M. N. D., & Ahn, K. (2024) · Journal of Hydrology · doi:10.1016/j.jhydrol.2024.132102 · Cited by 15
Maurer, E. P., Ficklin, D. L., & Wang, W. (2016) · Hydrology and earth system sciences · doi:10.5194/hess-20-685-2016 · Cited by 20
“…by Ehret et al. (2012), and there is the promise of recent advances in bias correction, it remains that quantile mapping is widely used and generally effective at removing biases (Gudmundsson et al., 2012), even in the presence of some non-stationarity (Lafon et al., 2012;Maurer et al., 2013).”
Park, J., Kang, M. S., & Song, I. (2012) · Journal of The Korean Society of Agricultural Engineers · doi:10.5389/ksae.2012.54.6.133 · Cited by 16
Zaman, M. A., Anjum, M. N., Usman, M., Ahmad, I., Saifullah, M., Yuan, S., & Liu, S. (2018) · Water · doi:10.3390/w10101296 · Cited by 17
Adera, A. G., & Alfredsen, K. T. (2019) · Journal of Water and Climate Change · doi:10.2166/wcc.2019.203 · Cited by 16
Projection of temperature change and extreme temperature events in the Lancang–Mekong River basin
Sun, C., Xiao, Z., Sun, J., & Yu, E. (2019) · Atmospheric and Oceanic Science Letters · doi:10.1080/16742834.2020.1696143 · Cited by 16
“The calculation in this paper uses the R package named qmap (Gudmundsson et al. 2012).”
MethodFuture distribution of early life stages of small pelagic fishes in the northwestern Mediterranean
Maynou, F., Sabatés, A., Ramírez‐Romero, E., Catalán, I. A., & Raya, V. (2020) · Climatic Change · doi:10.1007/s10584-020-02723-4 · Cited by 17
What Can We Learn from Comparing Glacio-Hydrological Models?
Stoll, E., Hanzer, F., Oesterle, F., Nemec, J., Schöber, J., Huttenlau, M., & Förster, K. (2020) · Atmosphere · doi:10.3390/atmos11090981 · Cited by 16
“The spatial resolution of the initial EURO-CORDEX data is too coarse for our model application in rugged terrain, therefore a spatial downscaling of the data was applied by using a quantile mapping approach according to Gudmundsson et al. and Thrasher et al. [45,46], respectively.”
MethodA Bernoulli-Gamma hierarchical Bayesian model for daily rainfall forecasts
Lima, C., Kwon, H., & Kim, Y. (2021) · Journal of Hydrology · doi:10.1016/j.jhydrol.2021.126317 · Cited by 16
Buri, E. S., Keesara, V. R., Loukika, K. N., & Sridhar, V. (2022) · Sustainability · doi:10.3390/su14031715 · Cited by 19
The Development of a Hydrological Drought Index for Lithuania
Nazarenko, S., Kriaučiūnienė, J., Šarauskienė, D., & Povilaitis, A. (2023) · Water · doi:10.3390/w15081512 · Cited by 18
Evaluating the necessity of post-processing techniques on d4PDF data for extreme climate assessment
Maneechot, L., Wong, Y. J., Try, S., Shimizu, Y., Bharambe, K. P., Hanittinan, P., Ram‐Indra, T., & Usman, M. N. (2023) · Environmental Science and Pollution Research · doi:10.1007/s11356-023-29572-9 · Cited by 17
“Thus, the future values could not be assessed if the variables exceed the range of observed values (Gudmundsson et al. 2012).”
BackgroundCho, J., Oh, C., Choi, J., & Cho, Y. (2016) · Irrigation and Drainage · doi:10.1002/ird.2036 · Cited by 16
“…that the non-parametric quantile mapping method is better than the parametric method for correcting system biases because the former method directly uses the actual distribution of the observed and simulated data without estimating a probability distribution function (Gudmundsson et al., 2012).”
MethodShen, G., Chen, N., Wang, W., & Chen, Z. (2019) · Earth system science data · doi:10.5194/essd-11-1711-2019 · Cited by 17
Devi, U., Shekhar, M. S., Singh, G. P., Rao, N. N., & Bhatt, U. S. (2019) · International Journal of Climatology · doi:10.1002/joc.6008 · Cited by 15
Future Climate Extremes in Bangladesh: Insights from a Multi-Model Ensemble of CMIP6 Simulations
Nazrul, F. B., Karim, M. R., Pavan, W., & Kamruzzaman, M. (2025) · Earth Systems and Environment · doi:10.1007/s41748-025-00681-4 · Cited by 17
Intercomparison of bias correction methods for precipitation of multiple GCMs across six continents
Song, Y. H., & Chung, . (2025) · Geoscientific model development · doi:10.5194/gmd-18-8017-2025 · Cited by 19
He, Q., Kuang, X., Chen, J., Hao, Y., Feng, Y., Wu, P., & Zheng, C. (2023) · Journal of Hydrology Regional Studies · doi:10.1016/j.ejrh.2023.101368 · Cited by 15
Assessment and Projections of Marine Heatwaves in the Northwest Pacific Based on CMIP6 Models
Xue, J., Shan, H., Liang, J., & Dong, C. (2023) · Remote Sensing · doi:10.3390/rs15122957 · Cited by 17
Improving near-real-time satellite precipitation products through multistage modified schemes
Meng, C., Mo, X., Liu, S., & Hu, S. (2023) · Atmospheric Research · doi:10.1016/j.atmosres.2023.106875 · Cited by 16
Metadata
- Authors
- Gudmundsson, L., Bremnes, J. B., Haugen, J. E., & Engen-Skaugen, T.
- Affiliations
- Norwegian Meteorological Institute (NO)
- Venue
- Hydrology and Earth System Sciences
- Publisher
- Copernicus GmbH
- Published
- 2012-09-21
- Volume
- 16
- Issue
- 9
- Pages
- 3383-3390
- ISSN
- 1027-5606 (ISSN-L)
- 1607-7938
- OpenAlex
- W2166535858
- Cited by
- 1,318
- References
- 41
- Citations by year
- 2026: 132 · 2025: 134 · 2024: 124 · 2023: 136 · 2022: 137 · 2021: 172 · 2020: 116 · 2019: 85 · 2018: 76 · 2017: 68 · 2016: 63 · 2015: 35 · 2014: 20 · 2013: 17 · 2012: 3
- FWCI
- 20.14
- Type
- journal article
- Language
- en
- Open access
- gold
- doi.org
- Licence
- Locations
- Hydrology and earth system sciences (publishedVersion, cc-by)
- DOAJ (DOAJ: Directory of Open Access Journals) (submittedVersion)
- Repository for Publications and Research Data (ETH Zurich) (submittedVersion, cc-by)
- ETH Zürich Research Collection (cc-by)
- Topics
- Physical Sciences › Environmental Science › Global and Planetary Change › Climate variability and models
- Physical Sciences › Earth and Planetary Sciences › Atmospheric Science › Precipitation Measurement and Analysis
- Physical Sciences › Environmental Science › Water Science and Technology › Hydrology and Watershed Management Studies
- Keywords
- dynamical downscaling, precipitation bias correction, statistical post-processing, parametric transformation, climate change impacts on water resources
About these checks
Registry, retraction, Cites and statistics results are computed, not judged, with one exception: a printed reference that no index lists is read once by a model before it counts as a citation error. Claims are extracted by a model and kept only when their quote appears verbatim in the text; each cited source is then checked, with a model’s help, for whether it says what the claim relies on. Those verdicts can be wrong — read the claim’s quote and the cited source before relying on one.
Statistics and arithmetic are recomputed, not judged.
Confidence bands are shown only for fields calibrated on our annotated test set. None is calibrated yet, so no band is shown.
What counts as a claim ›How we measure confidence ›How we check this ›
Are you an author, or do you see a problem with this page? Request a review
Data sources
Bibliographic data: Semantic Scholar, OpenAlex, Crossref.
Contains information from the Semantic Scholar Academic Graph Datasets, made available under the ODC Attribution License (ODC-BY 1.0).
Semantic Scholar’s data is described in: Kinney, R., et al. (2023). The Semantic Scholar Open Data Platform. arXiv:2301.10140.
