

Technical Note: Downscaling RCM precipitation to the station scale using statistical transformations—A comparison of methods
Open accessPublished version of a preprint
The DOI matches its Crossref record; 41 of the 41 references it cites were found in a registry or an index.
Abstract
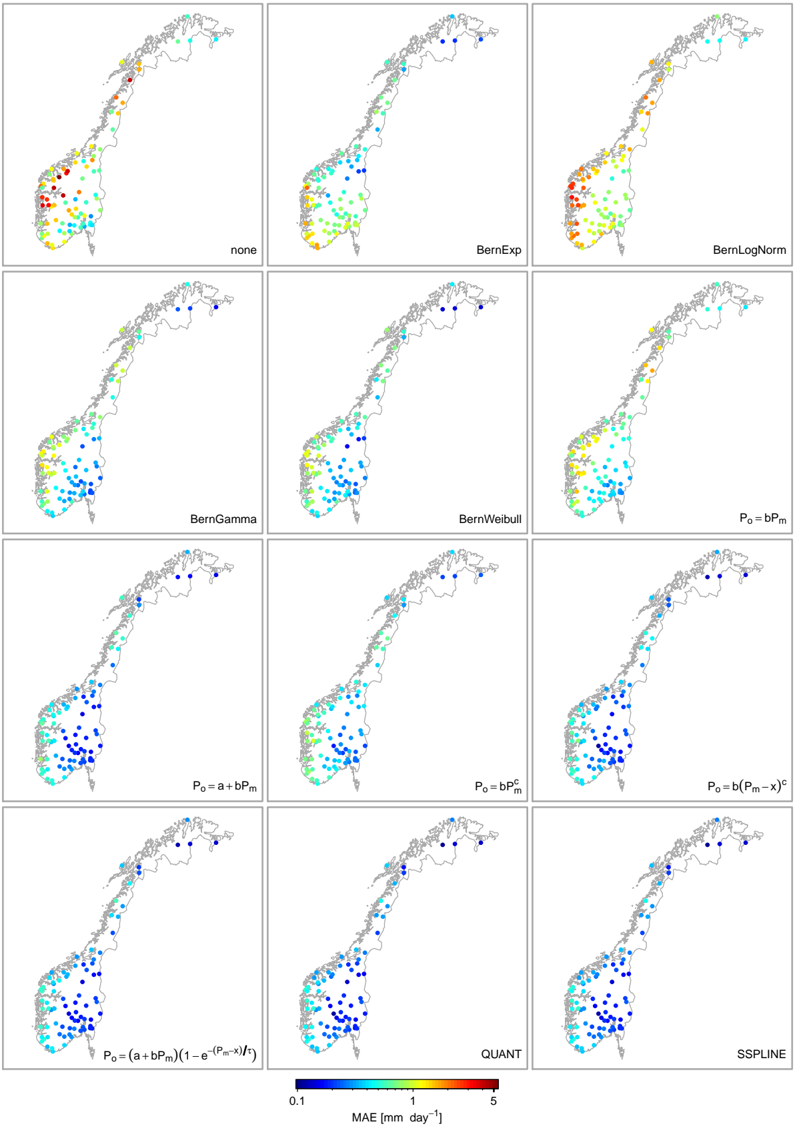
The impact of climate change on water resources is usually assessed at the local scale. However, regional climate models (RCMs) are known to exhibit systematic biases in precipitation. Hence, RCM simulations need to be post-processed in order to produce reliable estimates of local scale climate. Popular post-processing approaches are based on statistical transformations, which attempt to adjust the distribution of modelled data such that it closely resembles the observed climatology. However, the diversity of suggested methods renders the selection of optimal techniques difficult and therefore there is a need for clarification. In this paper, statistical transformations for post-processing RCM output are reviewed and classified into (1) distribution derived transformations, (2) parametric transformations and (3) nonparametric transformations, each differing with respect to their underlying assumptions. A real world application, using observations of 82 precipitation stations in Norway, showed that nonparametric transformations have the highest skill in systematically reducing biases in RCM precipitation.
Overview
The claims and statistics of this paper haven’t been checked yet.
Free: it reads the open-access text and checks the first 5 claims that cite a source we can check. Create a free account to check every claim.
Integrity signals
Registry
Cites
Statistics
Figures



Verification
Claims the paper makes
The claims and statistics of this paper haven’t been checked yet.
Free: it reads the open-access text and checks the first 5 claims that cite a source we can check. Create a free account to check every claim.
Claims other papers make about this one
Each is checked against this paper’s own text: does it say what the citing paper says it does?
The source backs part of the claim, not all of it — or backs it for a different population, condition or comparison.
In the citing paper
“Quantile mapping is the most used bias correction technique due to its ease of handling large amounts of data and its computational efficiency [58,59].”
From Climate Change Impacts on Streamflow in the Krishna River Basin, India: Uncertainty and Multi-Site Analysis (2022) · cites this paper as [58]
Experimental — accuracy not yet measured
Self-check
Percentages, sums and reported differences re-computed from the paper’s own numbers.
The self-check needs the paper’s full text.
Citations
Cites
The Elements of Statistical Learning
Hastie, T., Friedman, J., & Tibshirani, R. (2001) · Springer Series in Statistics · doi:10.1007/978-0-387-21606-5 · Cited by 24,162
Uppala, S. M., KÅllberg, P. W., Simmons, A. J., Andrae, U., Bechtold, V. D. C., Fiorino, M., Gibson, J. K., Haseler, J., Hernandez, A., Kelly, G. A., et al. (2005) · Quarterly Journal of the Royal Meteorological Society · doi:10.1256/qj.04.176 · Cited by 6,804 · cited 1×
“Modelled precipitation was extracted from a HIRHAM RCM simulation with 25 km resolution (Førland et al., 2009, 2011) forced with the ERA40 reanalysis (Uppala et al., 2005) on a model domain covering Norway and the Nordic Arctic.”
MethodTeutschbein, C., & Seibert, J. (2012) · Journal of Hydrology · doi:10.1016/j.jhydrol.2012.05.052 · Cited by 2,214 · cited 13×
“, 2011; Teutschbein and Seibert, 2012), the standard deviation (Engen-Skaugen, 2007; Li et al., 2010; Themeßl et al., 2011; Teutschbein and Seibert, 2012) and the skewness (Li et al.”
BackgroundMethodResultInfluentialHydrologic Implications of Dynamical and Statistical Approaches to Downscaling Climate Model Outputs
Wood, A. W., Leung, L. R., Sridhar, V., & Lettenmaier, D. P. (2004) · Climatic Change · doi:10.1023/b:clim.0000013685.99609.9e · Cited by 1,886 · cited 3×
“(2) using the empirical CDF of observed and modelled values instead of assuming parametric distributions (e.g.Panofsky and Brier, 1968; Wood et al., 2004; Reichle and Koster, 2004; Boé et al., 2007; Themeßl et al., 2011, 2012).”
BackgroundMethodMaraun, D., Wetterhall, F., Ireson, A. M., Chandler, R. E., Kendon, E. J., Widmann, M., Brienen, S., Rust, H. W., Sauter, T., Themeßl, M., et al. (2010) · Reviews of Geophysics · doi:10.1029/2009rg000314 · Cited by 1,805 · cited 3×
“Further, “statistical bias correction” (Piani et al., 2010a,b), “direct error correction methods” (Themeßl et al., 2011) and “model output statistics (MOS)” (Maraun et al., 2010) have been used to refer to the methods under investigation.”
MethodStatistical bias correction for daily precipitation in regional climate models over Europe
Piani, C., Haerter, J. O., & Coppola, E. (2010) · Theoretical and Applied Climatology · doi:10.1007/s00704-009-0134-9 · Cited by 1,154 · cited 9×
“…a set of scores is needed that quantifies the similarity of the observed and the (corrected) modelled empirical CDF. Previously used scores include overall measures, such as the root mean square error (Piani et al., 2010b) or the Kolmogorov-Smirnov two sample statistic (Dosio and Paruolo, 2011).”
BackgroundMethodInfluentialSome applications of statistics to meteorology
Panofsky, H. A., Brier, G. W., & Best, W. H. (1958) · University of Michigan Library Repository · Cited by 1,083
Li, H., Sheffield, J., & Wood, E. F. (2010) · Journal of Geophysical Research: Atmospheres · doi:10.1029/2009jd012882 · Cited by 901 · cited 6×
“Other suggested scores assess specific moments of the distribution including the mean (Engen-Skaugen, 2007; Li et al., 2010; Dosio and Paruolo, 2011; Themeßl et al., 2011; Turco et al., 2011; Teutschbein and Seibert, 2012), the standard deviation (Engen-Skaugen, 2007; Li et al., 2010; Themeßl et…”
BackgroundMethodInfluentialHow Well Do Coupled Models Simulate Today's Climate?
Reichler, T., & Kim, J. (2008) · Bulletin of the American Meteorological Society · doi:10.1175/bams-89-3-303 · Cited by 881
Piani, C., Weedon, G. P., Best, M., Gomes, S. M., Viterbo, P., Hagemann, S., & Haerter, J. O. (2010) · Journal of Hydrology · doi:10.1016/j.jhydrol.2010.10.024 · Cited by 868 · cited 9×
“…a set of scores is needed that quantifies the similarity of the observed and the (corrected) modelled empirical CDF. Previously used scores include overall measures, such as the root mean square error (Piani et al., 2010b) or the Kolmogorov-Smirnov two sample statistic (Dosio and Paruolo, 2011).”
BackgroundMethodInfluential
Cited by
Items 101–200 of 1,001
Projecting changes in regional temperature and precipitation extremes in the United States
Schoof, J. T., & Robeson, S. M. (2015) · Weather and Climate Extremes · doi:10.1016/j.wace.2015.09.004 · Cited by 94
“…regional climate modeling) or statistical, although the increasingly widespread availability of regional climate model output has resulted in an increasing number of studies that apply statistical post-processing to high resolution output from dynamical models (e.g., Gudmundsson et al., 2012).”
BackgroundMethodA novel bias correction methodology for climate impact simulations
Sippel, S., Otto, F. E. L., Forkel, M., Allen, M. R., Guillod, B. P., Heimann, M., Reichstein, M., Seneviratne, S. I., Thonicke, K., & Mahecha, M. D. (2016) · Earth System Dynamics · doi:10.5194/esd-7-71-2016 · Cited by 84
“More sophisticated statistical bias correction schemes (see Gudmundsson et al., 2012, for an overview) that might have an improved skill in rectifying biases in higher statistical moments (such as e.g. asymmetries in simulated distributions) have not been explicitly tested in this study.”
BackgroundMethodInfluentialHertig, E. (2019) · Parasites & Vectors · doi:10.1186/s13071-018-3278-6 · Cited by 100
“The non-parametric empirical quantile method suggested in [21] and implemented in the qmap package in R was used.”
MethodQian, W., & Chang, H. H. (2021) · International Journal of Environmental Research and Public Health · doi:10.3390/ijerph18041992 · Cited by 93
“Assuming the outcome follows a Normal distribution, this approach utilizes the theoretical quantile function to perform bias-correction [23,24].”
MethodTrends in projections of standardized precipitation indices in a future climate in Poland
Osuch, M., Romanowicz, R. J., Lawrence, D., & Wong, W. K. (2016) · Hydrology and earth system sciences · doi:10.5194/hess-20-1947-2016 · Cited by 92
“Quantile mapping methods have a number of advantages over methods that only correct the mean and variance (Sunyer et al., 2015) and have been used in numerous previous studies, e.g. Dosio and Paruolo (2011) and Gudmundsson et al. (2012).”
MethodEnsemble bias correction of climate simulations: preserving internal variability
Ayar, P. V., Vrac, M., & Mailhot, A. (2021) · Scientific Reports · doi:10.1038/s41598-021-82715-1 · Cited by 85
Crop Yield Forecasting by Integrating Data Assimilation, Crop Model, and Machine Learning
Zhuang, H., Zhang, Z., Cheng, F., Han, J., Luo, Y., Zhang, L., Cao, J., Zhang, J., He, B., Xu, J., et al. (2023) · Agricultural and Forest Meteorology · doi:10.1016/j.agrformet.2024.109909 · Cited by 91
Predicted changes in future precipitation and air temperature across Bangladesh using CMIP6 GCMs
Kamruzzaman, M., Wahid, S. M., Shahid, S., Alam, E., Mainuddin, M., Islam, H. M. T., Cho, J., Rahman, M. M., Biswas, J. C., & Thorp, K. R. (2023) · Heliyon · doi:10.1016/j.heliyon.2023.e16274 · Cited by 93
“ERA5 and raw GCM data are used as inputs in an empirical equation that is not parametric because such approaches have been shown to be more effective at minimizing systematic bias than parametric methods [56].”
MethodAmouzou, K. A., Lamers, J. P. A., Naab, J. B., Borgemeister, C., Vlek, P. L. G., & Becker, M. (2019) · Field Crops Research · doi:10.1016/j.fcr.2019.02.021 · Cited by 91
Kim, S., Joo, K., Kim, H., Shin, J., & Heo, J. (2020) · Journal of Hydrology · doi:10.1016/j.jhydrol.2020.125685 · Cited by 86
Recent increases in tropical cyclone precipitation extremes over the US east coast
Maxwell, J. T., Bregy, J. C., Robeson, S. M., Knapp, P., Soulé, P. T., & Trouet, V. M. (2021) · Proceedings of the National Academy of Sciences · doi:10.1073/pnas.2105636118 · Cited by 90
Multisegment statistical bias correction of daily GCM precipitation output
Grillakis, M. G., Koutroulis, A., & Tsanis, I. K. (2013) · Journal of Geophysical Research Atmospheres · doi:10.1002/jgrd.50323 · Cited by 92
What are the impacts of bias correction on future drought projections?
Johnson, F. M., & Sharma, A. (2015) · Journal of Hydrology · doi:10.1016/j.jhydrol.2015.04.002 · Cited by 91
The impact of climate change on extreme precipitation in Sicily, Italy
Forestieri, A., Arnone, E., Blenkinsop, S., Candela, A., Fowler, H. J., & Noto, L. (2018) · Hydrological Processes · doi:10.1002/hyp.11421 · Cited by 91
“The overall performance of the two 340 transformation functions have been assessed by evaluating the mean absolute error (MAE), as 341 suggested by several studies (Gudmundsson et al., 2012; Piani et al., 2010a; Piani et al., 2010b).”
MethodInfluentialNoor, M., Ismail, T., Shahid, S., Ahmed, K., Chung, ., & Nawaz, N. (2019) · Theoretical and Applied Climatology · doi:10.1007/s00704-019-02874-0 · Cited by 82
Adjusting spatial dependence of climate model outputs with cycle-consistent adversarial networks
François, B., Thao, S., & Vrac, M. (2021) · Climate Dynamics · doi:10.1007/s00382-021-05869-8 · Cited by 86
Chen, Y. G., & Tao, F. (2021) · Field Crops Research · doi:10.1016/j.fcr.2021.108398 · Cited by 87
Robust climate scenarios for sites with sparse observations: a two‐step bias correction approach
Rajczak, J., Kotlarski, S., Salzmann, N., & Schär, C. (2015) · International Journal of Climatology · doi:10.1002/joc.4417 · Cited by 97
“Gudmundsson et al. (2012) compared different implementations of QM for daily precipitation data and found that a nonparametric empirical approach outperforms different implementations relying on theoretical distributional assumptions.”
MethodAssessing debris flow activity in a changing climate
Turkington, T., Remaître, A., Ettema, J., Hussin, H. Y., & van Westen, C. J. (2016) · Climatic Change · doi:10.1007/s10584-016-1657-6 · Cited by 86
“For realistic climate change scenarios, both RCM and GCM data have to be corrected for biases (Gudmundsson et al. 2012).”
Karavani, A., Cáceres, M. D., de Aragón, J. M., Bonet, J. A., & de‐Miguel, S. (2017) · Agricultural and Forest Meteorology · doi:10.1016/j.agrformet.2017.10.024 · Cited by 81
Future changes in thermal comfort conditions over China based on multi-RegCM4 simulations
Gao, X., Wu, J., Shi, Y., Jia, W., Han, Z., Zhang, D., Tong, Y., Li, R., Xu, Y., & Giorgi, F. (2018) · Atmospheric and Oceanic Science Letters · doi:10.1080/16742834.2018.1471578 · Cited by 80
“daily mean surface air temperature, relative humidity, and wind speed, were bias corrected using a quantile-mapping method (Gudmundsson et al. 2012; Tong et al. 2017).”
MethodDrought Occurring With Hot Extremes: Changes Under Future Climate Change on Loess Plateau, China
Sun, C., Huang, G., Fan, Y., Zhou, X., Lu, C., & Wang, X. (2019) · Earth s Future · doi:10.1029/2018ef001103 · Cited by 80
“Based on the mean absolute error (MAE; Gudmundsson et al., 2012), a global quantitative evaluation was conducted to further assess the methods' performances with respect to specific properties.”
MethodMultivariate stochastic bias corrections with optimal transport
Robin, Y., Vrac, M., Naveau, P., & Yiou, P. (2019) · Hydrology and earth system sciences · doi:10.5194/hess-23-773-2019 · Cited by 87
“The main goal of bias correction (BC) is to match the statistical features of climate model outputs with observations (see, e.g., Ehret et al., 2012; Gudmundsson et al., 2012).”
MethodYeboah, K. A., Akpoti, K., Kabo-bah, A. T., Ofosu, E. A., Siabi, E. K., Mortey, E. M., & Okyereh, S. A. (2022) · Environmental Challenges · doi:10.1016/j.envc.2021.100439 · Cited by 84
Comparison of BIAS correction techniques for GPCC rainfall data in semi-arid climate
Ajaaj, A. A., Mishra, A. K., & Khan, A. A. (2015) · Stochastic Environmental Research and Risk Assessment · doi:10.1007/s00477-015-1155-9 · Cited by 86
Mao, G., Vogl, S., Laux, P., Wagner, S., & Kunstmann, H. G. (2015) · Hydrology and earth system sciences · doi:10.5194/hess-19-1787-2015 · Cited by 87
“The quantile mapping method is often used in bias correction of RCM derived precipitation (Dosio and Paruolo, 2011; Gudmundsson et al., 2012).”
Yang, Z., Hsu, K., Sorooshian, S., Xu, X., Braithwaite, D. K., & Verbist, K. M. J. (2016) · Journal of Geophysical Research Atmospheres · doi:10.1002/2015jd024540 · Cited by 83
Ivanov, M., & Kotlarski, S. (2016) · International Journal of Climatology · doi:10.1002/joc.4870 · Cited by 82
Striking stationarity of large-scale climate model bias patterns under strong climate change
Krinner, G., & Flanner, M. G. (2018) · Proceedings of the National Academy of Sciences · doi:10.1073/pnas.1807912115 · Cited by 88
Kamruzzaman, M., Jang, M.-W., Cho, J., & Hwang, S. (2019) · Water · doi:10.3390/w11112219 · Cited by 80
Gobiet, A., Suklitsch, M., & Heinrich, G. (2015) · Hydrology and earth system sciences · doi:10.5194/hess-19-4055-2015 · Cited by 82
Water Resources Under Climate Change in Himalayan Basins
Li, H., Xu, C., Beldring, S., Tallaksen, L. M., & Jain, S. K. (2015) · Water Resources Management · doi:10.1007/s11269-015-1194-5 · Cited by 76
“Following the recommendations of Gudmundsson et al. (2012), seven methods are selected, named as M1 to M7 (Table S1) and applied to the data for each month.”
MethodA Bayesian beta distribution model for estimating rainfall IDF curves in a changing climate
Lima, C., Kwon, H., & Kim, J.-Y. (2016) · Journal of Hydrology · doi:10.1016/j.jhydrol.2016.06.062 · Cited by 79
Monhart, S., Spirig, C., Bhend, J., Bogner, K., Schär, C., & Liniger, M. A. (2018) · Journal of Geophysical Research: Atmospheres · doi:10.1029/2017jd027923 · Cited by 75
“The correction can be estimated based on the empirical distribution function (Bennett et al., 2014; Wood et al., 2002, 2004) or based on parametric distributions fitted to the data (Gudmundsson et al., 2012; Piani et al., 2010).”
MethodEtter, S., Addor, N., Huss, M., & Finger, D. C. (2017) · Journal of Hydrology Regional Studies · doi:10.1016/j.ejrh.2017.08.005 · Cited by 80
“For this study, we used the variant of quantile mapping relying on empirical quantiles (Gudmundsson et al., 2012) and applied it to the seven ENSEMBLE models outlined in Table 2 The reference datasets for temperature and precipitation are again the gridded daily temperature and precipitation…”
MethodChanging seasonality of moderate and extreme precipitation events in the Alps
Brönnimann, S., Rajczak, J., Fischer, E. M., Raible, C. C., Rohrer, M., & Schär, C. (2018) · Natural hazards and earth system sciences · doi:10.5194/nhess-18-2047-2018 · Cited by 90
“More specifically, the data are quantile mapped (Themessl et al., 2011; Gudmundsson et al., 2012; Teutschbein and Seibert, 2012; Räty et al., 2014) to observation-based time series representative of the average over the Aare catchment in Switzerland (see Fig.”
MethodBias correction of climate model output for impact models
Cannon, A. J., Piani, C., & Sippel, S. (2019) · Elsevier eBooks · doi:10.1016/b978-0-12-814895-2.00005-7 · Cited by 91
Wang, L., Ranasinghe, R., Maskey, S., van Gelder, P. H. A. J. M., & Vrijling, J. K. (2015) · International Journal of Climatology · doi:10.1002/joc.4334 · Cited by 81
“Here, the commonly used 99-percentile tables were employed (Boé et al., 2007; Deque, 2007) due to the superior performance of empirical CDFs in the previous studies (Themeßl et al., 2011a, 2011b; Gudmundsson et al., 2012; Gutjahr and Heinemann, 2013).”
BackgroundMethodInfluentialDoes applying quantile mapping to subsamples improve the bias correction of daily precipitation?
Reiter, P., Gutjahr, O., Schefczyk, L., Heinemann, G., & Casper, M. (2017) · International Journal of Climatology · doi:10.1002/joc.5283 · Cited by 81
“Quantile mapping (QM) is a well performing (Themeßl et al., 2011; Gudmundsson et al., 2012; Teutschbein and Seibert, 2012; Räty et al., 2014; Fang et al., 2015; Teng et al., 2015) and widely used (Gudmundsson et al., 2012; Maraun, 2013; Wilcke et al., 2013) method for correcting daily precipitation…”
BackgroundMethodInfluentialMamalakis, A., Langousis, A., Deidda, R., & Marrocu, M. (2017) · Water Resources Research · doi:10.1002/2016wr019578 · Cited by 82
Bias correction for hydrological impact studies – beyond the daily perspective
Addor, N., & Seibert, J. (2014) · Hydrological Processes · doi:10.1002/hyp.10238 · Cited by 77
“Bias correction was performed using quantile mapping relying on empirical cumulative distributions, which was found to be the most satisfying method in the comparison led by Gudmundsson et al. (2012).”
MethodCLIMBra - Climate Change Dataset for Brazil
Ballarin, A. S., Sone, J. S., Gesualdo, G. C., Schwamback, D., Reis, A., Almagro, A., & Wendland, E. C. (2023) · Scientific Data · doi:10.1038/s41597-023-01956-z · Cited by 96
Wilczak, J. M., Akish, E., Capotondi, A. M., & Compo, G. P. (2024) · Energies · doi:10.3390/en17071667 · Cited by 88
Tabari, H., Troch, R. D., Giot, O., Hamdi, R., Termonia, P., Saeed, S., Brisson, E., van Lipzig, N. P. M., & Willems, P. (2016) · Hydrology and earth system sciences · doi:10.5194/hess-20-3843-2016 · Cited by 88
Tefera, G. W., Teferi, E., Bantider, A., & Dile, Y. T. (2021) · Climate Risk Management · doi:10.1016/j.crm.2021.100272 · Cited by 81
Seasonal climate forecast can inform the European agricultural sector well in advance of harvesting
Ceglar, A., & Toreti, A. (2021) · npj Climate and Atmospheric Science · doi:10.1038/s41612-021-00198-3 · Cited by 81
Jaiswal, R., Mall, R. K., Singh, N., Kumar, T. V. L., & Niyogi, D. (2022) · Earth and Space Science · doi:10.1029/2021ea001981 · Cited by 84
“Thus both could perform better in skill scores (Chen et al., 2013; Gudmundsson et al., 2012; Maraun, 2013).”
BackgroundCampozano, L., Tenelanda, D., Sanchez, E., Samaniego, E. P., & Feyen, J. (2016) · Advances in Meteorology · doi:10.1155/2016/6526341 · Cited by 72
“To find the parameters a, b, and x 0 , the tool R QMAP was used [18].”
MethodAznarez, C., Jimeno‐Sáez, P., López-Ballesteros, A., Pacheco, J. P., & Senent‐Aparicio, J. (2021) · Remote Sensing · doi:10.3390/rs13102014 · Cited by 78
Future hydrology and hydrological extremes under climate change in Asian river basins
Shrestha, S., Bae, D., Hok, P., Ghimire, S., & POKHREL, Y. N. (2021) · Scientific Reports · doi:10.1038/s41598-021-96656-2 · Cited by 81
Assessment of soil erosion under long-term projections of climate change in Poland
Marcinkowski, P., Szporak-Wasilewska, S., & Kardel, I. (2022) · Journal of Hydrology · doi:10.1016/j.jhydrol.2022.127468 · Cited by 75
Land-surface initialisation improves seasonal climate prediction skill for maize yield forecast
Ceglar, A., Toreti, A., Prodhomme, C., Zampieri, M., Turco, M., & Doblas-Reyes, F. J. (2018) · Scientific Reports · doi:10.1038/s41598-018-19586-6 · Cited by 73
Peterson, C. A., Bell, L. W., Carvalho, P. C. D. F., & Gaudin, A. C. M. (2020) · Frontiers in Sustainable Food Systems · doi:10.3389/fsufs.2020.604099 · Cited by 87
A Bayesian Kriging model applied for spatial downscaling of daily rainfall from GCMs
Lima, C., Kwon, H., & Kim, Y. (2021) · Journal of Hydrology · doi:10.1016/j.jhydrol.2021.126095 · Cited by 72
Müller, M. F., & Thompson, S. (2013) · Advances in Water Resources · doi:10.1016/j.advwatres.2013.08.004 · Cited by 73
Dieng, D., Cannon, A. J., Laux, P., Hald, C., Adeyeri, O. E., Rahimi, J., Srivastava, A. K., Mbaye, M., & Kunstmann, H. G. (2022) · Journal of Geophysical Research Atmospheres · doi:10.1029/2021jd034836 · Cited by 75
“The main goal of bias-correction is to adjust the statistical features (mean, variance) of RCM outputs in the historical period so that they are more similar to the observations (Ehret et al., 2012; Gudmundsson et al., 2012; Maraun, 2016; Teutschbein & Seibert, 2012a).”
BackgroundDuethmann, D., Menz, C., Jiang, T., & Vorogushyn, S. (2016) · Environmental Research Letters · doi:10.1088/1748-9326/11/5/054024 · Cited by 74
“All climate model data were summarised to subcatchments and bias corrected using an empirical quantile mapping approach (Gudmundsson et al 2012), which allowed us to also consider changes in the variability.”
MethodZeng, P., Sun, F., Liu, Y., Wang, Y., Li, G., & Che, Y. (2021) · Weather and Climate Extremes · doi:10.1016/j.wace.2021.100304 · Cited by 75
Lyu, Y., Zhu, S., Zhi, X., Ji, Y., Fan, Y., & Dong, F. (2023) · Geophysical Research Letters · doi:10.1029/2023gl106245 · Cited by 75
Addor, N., Rohrer, M., Furrer, R., & Seibert, J. (2016) · Journal of Geophysical Research Atmospheres · doi:10.1002/2015jd024040 · Cited by 74
“For both setups quantile mapping was implemented using empirical quantiles [Gudmundsson et al., 2012] and was applied on daily Figure 2.”
Trinh‐Tuan, L., Matsumoto, J., Tangang, F., Juneng, L., Cruz, F. A. T., Narisma, G. T., Santisirisomboon, J., Phan‐Van, T., Gunawan, D., Aldrian, E., et al. (2018) · SOLA · doi:10.2151/sola.2019-001 · Cited by 76
Hydrological Modeling of Climate Change Impacts
Hakala, K., Addor, N., Teutschbein, C., Vis, M. J. P., Dakhlaoui, H., & Seibert, J. (2019) · Wiley eBooks · doi:10.1002/9781119300762.wsts0062 · Cited by 74
Assessment of ECMWF SEAS5 Seasonal Forecast Performance over South America
Gubler, S., Sedlmeier, K., Bhend, J., Avalos, G., Coelho, C. A. S., Escajadillo, Y., Jacques‐Coper, M., Martínez, R., Schwierz, C., Skansi, M. D. L. M., et al. (2019) · Weather and Forecasting · doi:10.1175/waf-d-19-0106.1 · Cited by 70
“The closest grid point of the SEAS5 hindcasts was biascorrected at each station by quantile mapping using ‘‘qmap’’ (Gudmundsson et al. 2012) implemented within the ‘‘biascorrection’’ R-package (Bhend 2017).”
MethodHuang, S., Wortmann, M., Duethmann, D., Menz, C., Shi, F., Zhao, C., Su, B., & Krysanova, V. (2018) · Agricultural Water Management · doi:10.1016/j.agwat.2018.03.004 · Cited by 67
Lawrence, D. (2020) · Journal of Hydrology Regional Studies · doi:10.1016/j.ejrh.2020.100675 · Cited by 71
The effects of climate change on historical and future extreme rainfall in Antalya, Turkey
Yilmaz, A. G. (2014) · Hydrological Sciences Journal · doi:10.1080/02626667.2014.945455 · Cited by 67
CHASE-PL Climate Projection dataset over Poland – bias adjustment of EURO-CORDEX simulations
Mezghani, A., Dobler, A., Haugen, J. E., Benestad, R. E., Parding, K. M., Piniewski, M., Kardel, I., & Kundzewicz, Z. W. (2017) · Earth system science data · doi:10.5194/essd-9-905-2017 · Cited by 66
Self-citationAssessing climate change impacts on the reliability of rainwater harvesting systems
Alamdari, N., Sample, D. J., Liu, J., & Ross, A. C. (2018) · Resources Conservation and Recycling · doi:10.1016/j.resconrec.2017.12.013 · Cited by 81
Modelling the water balance of Lake Victoria (East Africa) – Part 2: Future projections
Vanderkelen, I., van Lipzig, N. P. M., & Thiery, W. (2018) · Hydrology and earth system sciences · doi:10.5194/hess-22-5527-2018 · Cited by 67
“Following Gudmundsson et al. (2012) and Boé et al. (2007), this method uses the cumulative density function (CDF) based on the empirical quantiles from the observed variable to transform the modelled variable.”
MethodCross-validation of bias-corrected climate simulations is misleading
Maraun, D., & Widmann, M. (2018) · Hydrology and earth system sciences · doi:10.5194/hess-22-4867-2018 · Cited by 69
“Some authors even apply a full cross-validation, most often by permuting calibration and validation period (a 2-fold cross-validation; Gudmundson et al., 2012).”
Regional projections of temperature and precipitation changes: Robustness and uncertainty aspects.
Piniewski, M., Mezghani, A., Szcześniak, M., & Kundzewicz, Z. W. (2017) · Meteorologische Zeitschrift · doi:10.1127/metz/2017/0813 · Cited by 66
Reliability of the global climate models during 1961–1999 in arid and semiarid regions of China
Yang, Y., Bai, L., Wang, B., Wu, J., & Fu, S. (2019) · The Science of The Total Environment · doi:10.1016/j.scitotenv.2019.02.188 · Cited by 67
Hwang, S., & Graham, W. D. (2013) · Hydrology and earth system sciences · doi:10.5194/hess-17-4481-2013 · Cited by 72
“However nonparametric transformation using empirical distributions has also been used for bias-correction, often with better skill in reducing biases in than parametric distribution mapping approaches (Gudmundsson et al., 2012).”
MethodFuture Changes in Drought Characteristics: Regional Analysis for South Korea under CMIP5 Projections
Rhee, J., & Cho, J. (2015) · Journal of Hydrometeorology · doi:10.1175/jhm-d-15-0027.1 · Cited by 65
“The nonparametric approach is known to be better than the parametric approach for correcting system biases, because it uses the actual distribution of the observed and simulated data, without estimating a probability distribution function (Gudmundsson et al. 2012).”
MethodHydrological Modeling to Evaluate Climate Model Simulations and Their Bias Correction
Hakala, K., Addor, N., & Seibert, J. (2018) · Journal of Hydrometeorology · doi:10.1175/jhm-d-17-0189.1 · Cited by 71
Mehrotra, R., & Sharma, A. (2019) · Water Resources Research · doi:10.1029/2018wr023270 · Cited by 70
“These CDFs can be estimated using parametric, semiparametric, or nonparametric methods (Gudmundsson et al., 2012; Li et al., 2010; Mehrotra & Sharma, 2016).”
MethodAyugi, B. O., Tan, G., Niu, R., Babaousmail, H., Ojara, M., Hanggoro, W., Mumo, L., Nadoya, H., Nooni, I. K., & Ongoma, V. (2020) · Water · doi:10.3390/w12030801 · Cited by 70
Effect of climate change on sowing and harvest dates of spring barley and maize in Poland
Marcinkowski, P., & Piniewski, M. (2018) · International Agrophysics · doi:10.1515/intag-2017-0015 · Cited by 64
Jakimavičius, D., Kriaučiūnienė, J., & Šarauskienė, D. (2018) · Oceanologia · doi:10.1016/j.oceano.2018.02.003 · Cited by 67
A New Distribution Mapping Technique for Climate Model Bias Correction
McGinnis, S., Nychka, D. W., & Mearns, L. O. (2015) · Springer eBooks · doi:10.1007/978-3-319-17220-0_9 · Cited by 74
Historical footprints and future projections of global dust burden from bias-corrected CMIP6 models
Liu, J., Wang, X., Wu, D., Wei, H., Li, Y., & Ji, M. (2024) · npj Climate and Atmospheric Science · doi:10.1038/s41612-023-00550-9 · Cited by 66
An Enhanced Archive Facilitating Climate Impacts and Adaptation Analysis
Maurer, E. P., Brekke, L. D., Pruitt, T., Thrasher, B. L., Long, J. C. S., Duffy, P. B., Dettinger, M. D., Cayan, D. R., & Arnold, J. R. (2013) · Bulletin of the American Meteorological Society · doi:10.1175/bams-d-13-00126.1 · Cited by 69
“…effort in developing shared tools to enable statistical downscaling by impacts modelers and decision makers, some aimed at generating meteorological projections at a point and others formulated to produce finescale gridded regional data (Benestad 2004; Gudmundsson et al. 2012; Wilby et al. 2002).”
BackgroundLudwig, P., Yaping Shao, M., Kehl, M., & Weniger, G. (2018) · Global and Planetary Change · doi:10.1016/j.gloplacha.2018.08.006 · Cited by 63
de Hipt, F. O., Diekkrüger, B., Steup, G., Yira, Y., Hoffmann, T., & Rode, M. (2017) · CATENA · doi:10.1016/j.catena.2017.11.023 · Cited by 68
Xu, L., Chen, N., Zhang, X., Chen, Z., Hu, C., & Wang, C. (2019) · Climate Dynamics · doi:10.1007/s00382-018-04605-z · Cited by 70
Song, Y. H., Chung, ., & Shahid, S. (2022) · The Science of The Total Environment · doi:10.1016/j.scitotenv.2022.153953 · Cited by 69
Babaousmail, H., Hou, R., Ayugi, B. O., Sian, K. T. C. L. K., Ojara, M., Mumo, R., Chehbouni, A., & Ongoma, V. (2022) · International Journal of Climatology · doi:10.1002/joc.7644 · Cited by 64
“The effectiveness of the mentioned technique has been affirmed in previous studies (e.g., Gudmundsson et al., 2012; Teutschbein and Seibert, 2012; Ayugi et al., 2020b; Tabari et al., 2021) that successfully utilized QM to adjust the distribution of various climatic variables such as precipitation…”
MethodLima, C., Kwon, H., & Kim, Y. (2018) · Journal of Hydrology · doi:10.1016/j.jhydrol.2018.08.075 · Cited by 61
Song, Y. H., Chung, E.-S., & Shiru, M. S. (2020) · Sustainability · doi:10.3390/su12187508 · Cited by 58
“For NPT, Robust Linear (RL) and Smoothing Spline (SSPLIN) are frequently used [26,29,30].”
MethodEvaluating skills and issues of quantile-based bias adjustment for climate change scenarios
Lehner, F., Nadeem, I., & Formayer, H. (2023) · Advances in statistical climatology, meteorology and oceanography · doi:10.5194/ascmo-9-29-2023 · Cited by 74
“…et al., 2013), distribution mapping (Teutschbein and Seibert, 2012), statistical bias-correction (Piani et al., 2010), statistical transformation (Gudmundsson et al., 2012), quantile–quantile mapping (Hatchett et al., 2016; Potter et al., 2020; Charles et al., 2020) or quantile mapping (QM)…”
BackgroundInfluentialWagena, M. B., Sommerlot, A. R., Abiy, A. Z., Collick, A. S., Langan, S., Fuka, D. R., & Easton, Z. M. (2016) · Climatic Change · doi:10.1007/s10584-016-1785-z · Cited by 60
“These data were downscaled using bias correction-spatial disaggregation methods adapted to a daily time series in R following Girvetz et al. (2013) using functions from the QMAP R package (Gudmundsson et al. 2012).”
MethodMuñoz‐Mas, R., Lopez‐Nicolas, A., Martínez‐Capel, F., & Pulido-Velázquez, M. (2015) · The Science of The Total Environment · doi:10.1016/j.scitotenv.2015.11.147 · Cited by 67
“However, in order to correct any bias related with the climatemodels, the projected rainfall and temperature data were adjusted in R (R Core Team, 2015) following the quantile–quantile approach (fitQmapRQUANT function) implemented in the package qmap (Gudmundsson et al., 2012).”
MethodAssessment of risks due to climate change for the Upper Tamakoshi Hydropower Project in Nepal
Shrestha, S., Bajracharya, A. R., & Babel, M. S. (2016) · Climate Risk Management · doi:10.1016/j.crm.2016.08.002 · Cited by 59
Robeson, S. M., Maxwell, J. T., & Ficklin, D. L. (2020) · Geophysical Research Letters · doi:10.1029/2019gl086689 · Cited by 60
“When empirical quantiles of the observed and modeled values are used to determine the cdfs and their differences form the basis for adjusting the modeled values, the procedure is referred to as “quantile mapping” (Chen et al., 2013; Gudmundsson et al., 2012; Teutschbein & Seibert, 2012).”
BackgroundMethodInfluentialPool, S., Francés, F., García-Prats, A., Pulido-Velázquez, M., Ibor, C. S., Schirmer, M., Yang, H., & Jiménez‐Martínez, J. (2021) · Earth s Future · doi:10.1029/2020ef001859 · Cited by 58
“Bias adjustment was based on the nonparametric statistical transformation of empirical quantiles (Gudmundsson et al., 2012), and was implemented for each season separately (December-February, March-May, June-August, and September-November).”
MethodJose, D. M., & Dwarakish, G. S. (2021) · Asia-Pacific Journal of Atmospheric Sciences · doi:10.1007/s13143-021-00240-7 · Cited by 59
“Gudmundsson et al. (2012) did a comparison of various bias correction methods and found that these methods differ substantially in their performances and underlying assumptions.”
BackgroundEvaluating large-extent spatial modeling approaches: A case study for soil depth for France
Lacoste, M., Mulder, V. L., Richer-De-Forges, A. C., Martin, M. P., & Arrouays, D. (2016) · Geoderma Regional · doi:10.1016/j.geodrs.2016.02.006 · Cited by 63
Ngô, L. A., Masih, I., Jiang, Y., & Douven, W. (2016) · Climatic Change · doi:10.1007/s10584-016-1875-y · Cited by 59
“The transfer function can be derived by using theoretical distribution, parametric transformation, and nonparametric transformation (e.g., Boé et al. 2007; Gudmundsson et al. 2012).”
MethodMarcinkowski, P., Piniewski, M., Kardel, I., Szcześniak, M., Benestad, R. E., Srinivasan, R., Ignar, S., & Okruszko, T. (2017) · Water · doi:10.3390/w9030156 · Cited by 66
Extreme floods in Europe: going beyond observations using reforecast ensemble pooling
Brunner, M. I., & Slater, L. J. (2022) · Hydrology and earth system sciences · doi:10.5194/hess-26-469-2022 · Cited by 56
Metadata
- Authors
- Gudmundsson, L., Bremnes, J. B., Haugen, J. E., & Engen-Skaugen, T.
- Affiliations
- Norwegian Meteorological Institute (NO)
- Venue
- Hydrology and Earth System Sciences
- Publisher
- Copernicus GmbH
- Published
- 2012-09-21
- Volume
- 16
- Issue
- 9
- Pages
- 3383-3390
- ISSN
- 1027-5606 (ISSN-L)
- 1607-7938
- OpenAlex
- W2166535858
- Cited by
- 1,318
- References
- 41
- Citations by year
- 2026: 132 · 2025: 134 · 2024: 124 · 2023: 136 · 2022: 137 · 2021: 172 · 2020: 116 · 2019: 85 · 2018: 76 · 2017: 68 · 2016: 63 · 2015: 35 · 2014: 20 · 2013: 17 · 2012: 3
- FWCI
- 20.14
- Type
- journal article
- Language
- en
- Open access
- gold
- doi.org
- Licence
- Locations
- Hydrology and earth system sciences (publishedVersion, cc-by)
- DOAJ (DOAJ: Directory of Open Access Journals) (submittedVersion)
- Repository for Publications and Research Data (ETH Zurich) (submittedVersion, cc-by)
- ETH Zürich Research Collection (cc-by)
- Topics
- Physical Sciences › Environmental Science › Global and Planetary Change › Climate variability and models
- Physical Sciences › Earth and Planetary Sciences › Atmospheric Science › Precipitation Measurement and Analysis
- Physical Sciences › Environmental Science › Water Science and Technology › Hydrology and Watershed Management Studies
- Keywords
- dynamical downscaling, precipitation bias correction, statistical post-processing, parametric transformation, climate change impacts on water resources
About these checks
Registry, retraction, Cites and statistics results are computed, not judged, with one exception: a printed reference that no index lists is read once by a model before it counts as a citation error. Claims are extracted by a model and kept only when their quote appears verbatim in the text; each cited source is then checked, with a model’s help, for whether it says what the claim relies on. Those verdicts can be wrong — read the claim’s quote and the cited source before relying on one.
Statistics and arithmetic are recomputed, not judged.
Confidence bands are shown only for fields calibrated on our annotated test set. None is calibrated yet, so no band is shown.
What counts as a claim ›How we measure confidence ›How we check this ›
Are you an author, or do you see a problem with this page? Request a review
Data sources
Bibliographic data: Semantic Scholar, OpenAlex, Crossref.
Contains information from the Semantic Scholar Academic Graph Datasets, made available under the ODC Attribution License (ODC-BY 1.0).
Semantic Scholar’s data is described in: Kinney, R., et al. (2023). The Semantic Scholar Open Data Platform. arXiv:2301.10140.
