

The DOI matches its Crossref record; 67 of the 67 references it cites were found in a registry or an index; none of the 43 sources its claims cite is checked for support yet.
A common mechanism underlies changes of mind about decisions and confidence
Open accessAbstract
Decisions are accompanied by a degree of confidence that a selected option is correct. A sequential sampling framework explains the speed and accuracy of decisions and extends naturally to the confidence that the decision rendered is likely to be correct. However, discrepancies between confidence and accuracy suggest that confidence might be supported by mechanisms dissociated from the decision process. Here we show that this discrepancy can arise naturally because of simple processing delays. When participants were asked to report choice and confidence simultaneously, their confidence, reaction time and a perceptual decision about motion were explained by bounded evidence accumulation. However, we also observed revisions of the initial choice and/or confidence. These changes of mind were explained by a continuation of the mechanism that led to the initial choice. Our findings extend the sequential sampling framework to vacillation about confidence and invites caution in interpreting dissociations between confidence and accuracy.
Overview
AI snapshot
Written from the paper’s full text.
TL;DR
Changes of mind about choice and confidence in a motion-discrimination task are explained by continued bounded evidence accumulation after the initial decision, using the same evidence stream. This post-decision processing can produce an apparent dissociation between confidence and accuracy without invoking separate metacognitive mechanisms.
Key findings
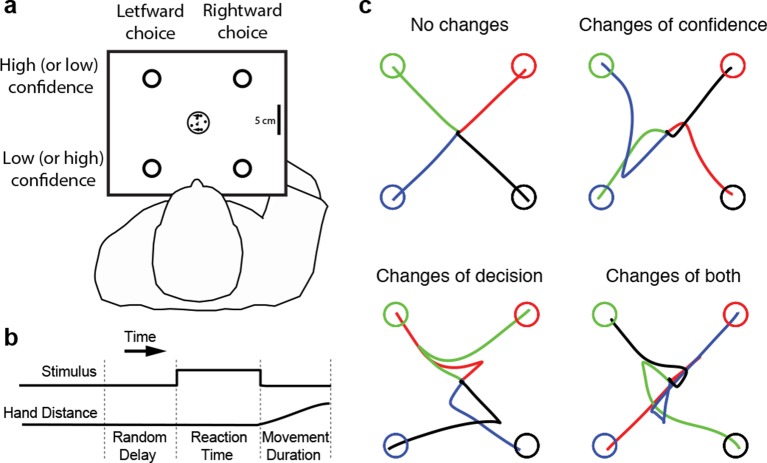
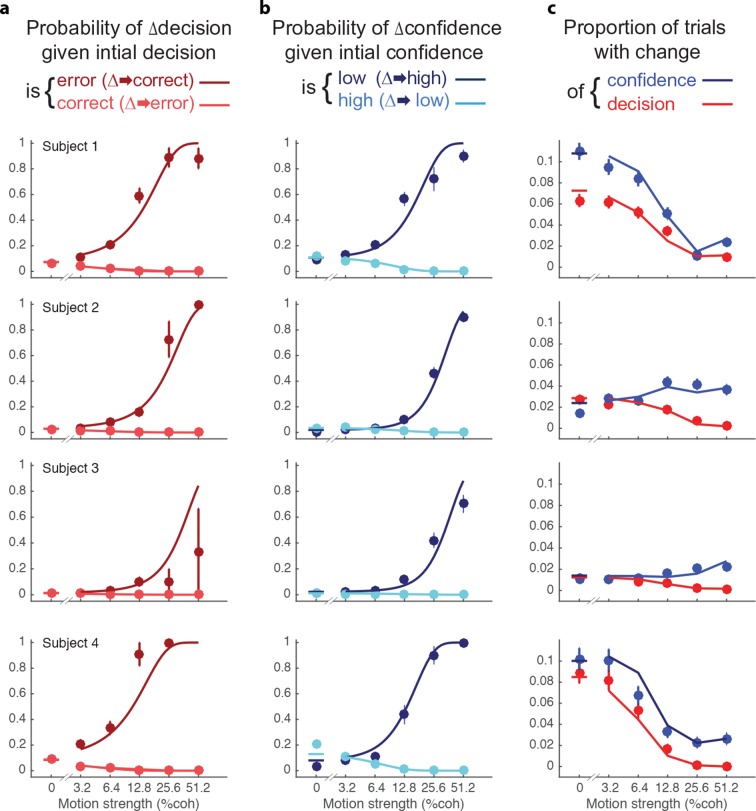
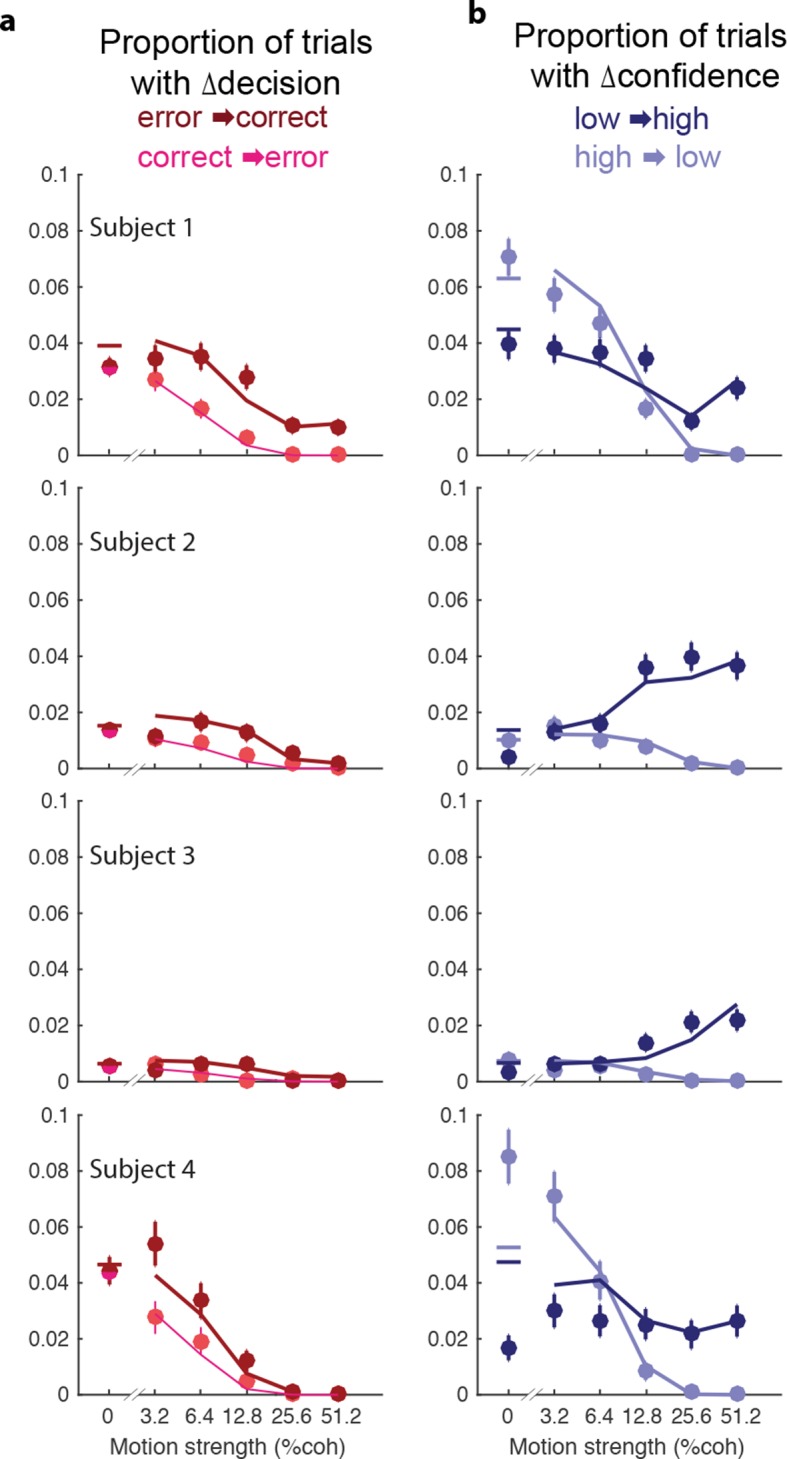
- Four subjects made simultaneous direction and confidence reports by reaching to one of four targets; changes of mind occurred on 2.0–8.8% of trials, and confidence changes were more frequent than decision changes (p<1e-4 for all participants).
- Changes of decision were more likely after errors and with stronger motion; for three of four subjects they corrected an initial error more often than they spoiled a correct choice (P<0.001, P<0.001, P=0.084, P<0.001). Changes of confidence were more likely after low-confidence initial choices, and changes of mind earned 0.72–1.12 additional points per change trial.
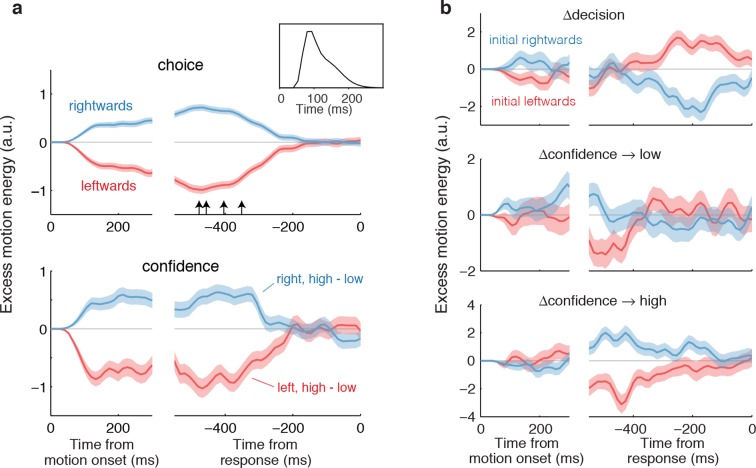
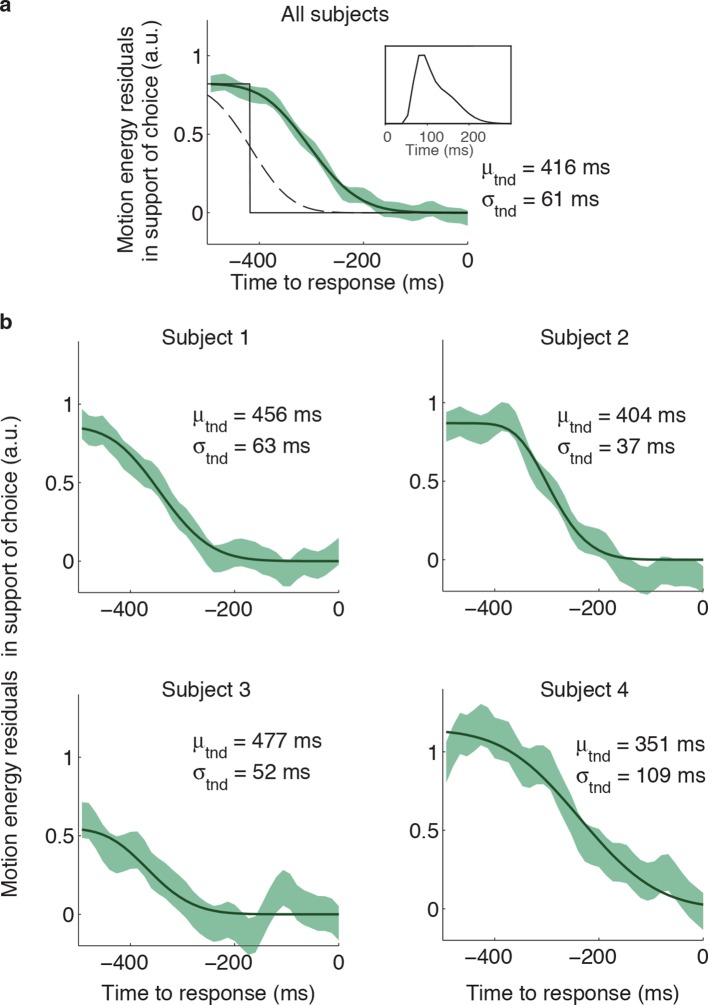
- Motion-energy kernels showed that initial choice and confidence were supported by a common evidence stream, with information used until ~400 ms before movement onset. Post-decision information explained revisions: low-to-high confidence changes were supported by evidence for the initial choice, whereas high-to-low confidence changes were associated with evidence for the opposite direction.
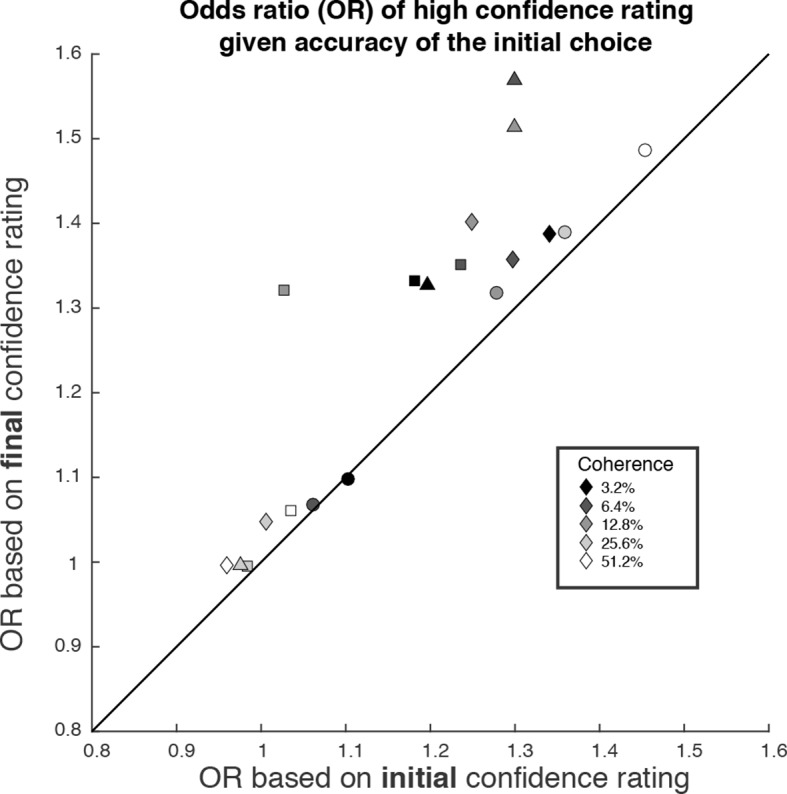
- Comparing odds ratios from initial versus final confidence produced a systematic discrepancy (P<1e-4, sign test; reliable for 13 of 19 points, P<0.05 bootstrap), which the authors argue can arise from continued first-order evidence accumulation rather than a separate second-order confidence process.
Methods
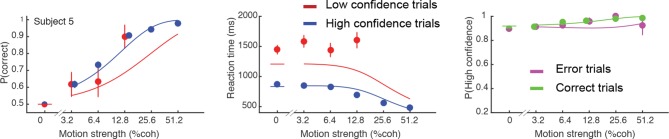
- Six naïve right-handed subjects (ages 21–34) participated; two were excluded, leaving four analyzed. Subjects used a vBOT handle to judge random-dot motion direction and report confidence simultaneously, with coherence levels ±0, ±3.2, ±6.4, ±12.8, ±25.6, and ±51.2%; the stimulus was extinguished at movement onset. Each subject completed 12 sessions (9024–9216 trials), except Subject 4, for whom only the first 5000 trials were analyzed because of nonstationary behavior.
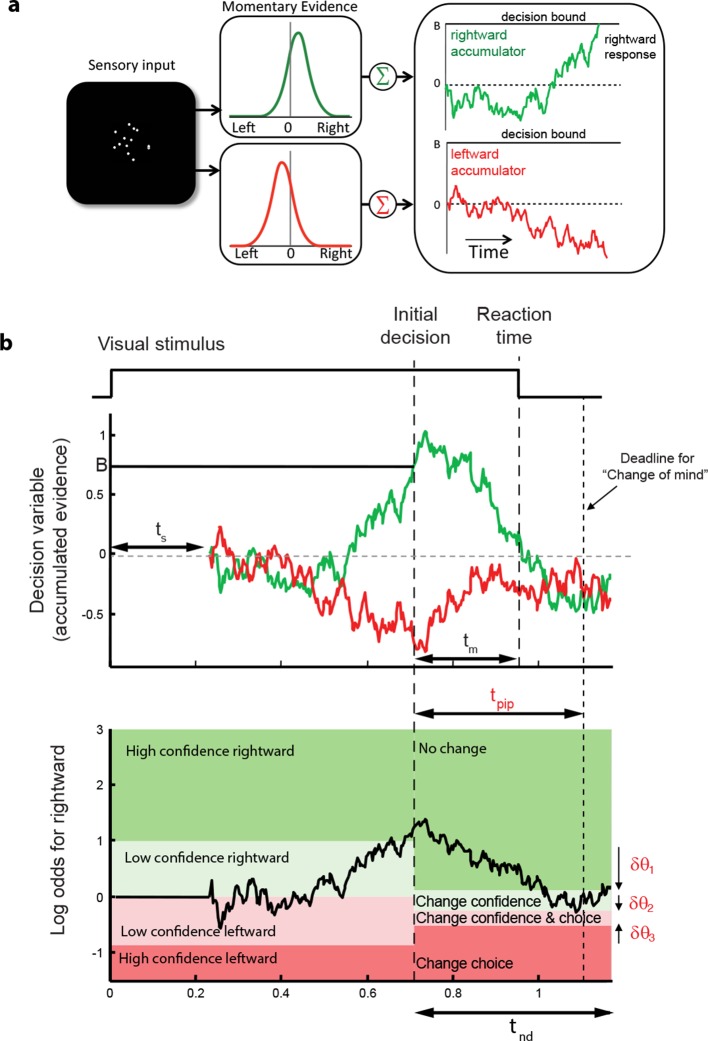
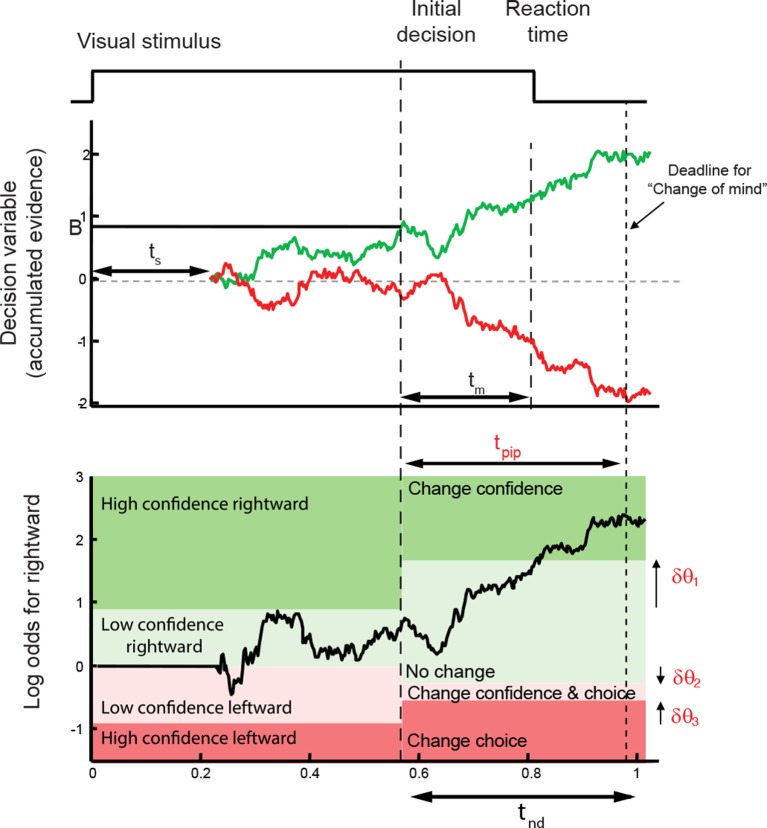
- Behavioral analyses used logistic regressions, ANOVA, Fisher exact tests, and motion-energy psychophysical kernels. The main model was a race between two accumulators receiving bivariate Gaussian evidence, with decision bound B, non-decision time, and a log-odds threshold θ for confidence; changes of mind were modeled by continued accumulation for a post-initiation period tpip with shifted thresholds δθ1–δθ3.
- Model parameters were fit by maximum likelihood to initial choice, confidence, and reaction-time data, then the change-of-mind model was fit with κ and θ carried over from the initial fits.
Limitations
- Stated: the model is imperfect—it overestimates confidence at the lowest motion strength and shows discrepancies at 0% coherence for three of four subjects; the flat bound does not capture RT distributions or mean RT on error trials, so only correct-trial mean RTs and 0% coherence trials were used in the cost function.
- Stated: basing changes of decision on log odds is a simplification, and the frequency of changes of mind was too small to evaluate more flexible post-initiation termination rules.
- Evident: the main conclusions rest on four analyzed subjects in a specific random-dot motion task with stationary evidence samples; the paper notes that other perceptual and memory-based decisions involve less well-characterized evidence streams.
Model-written summary. Check it against the paper before relying on it.
Integrity signals
Registry
Cites
Statistics
Figures
Verification
Claims the paper makes
44 Own result · 25 Not checked yet · 20 Own interpretation · 12 No basis given · 3 Own method
A result the paper reports from its own data — it cites no other source for it, so there is none to check. The quote shows it is in the paper.
In the paper
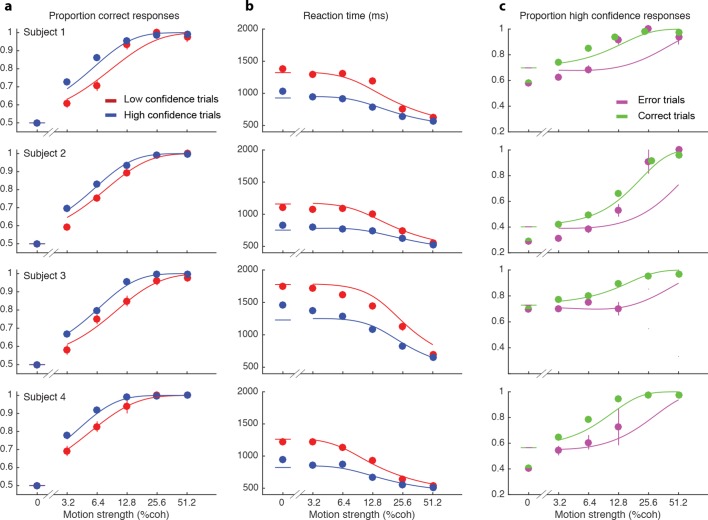
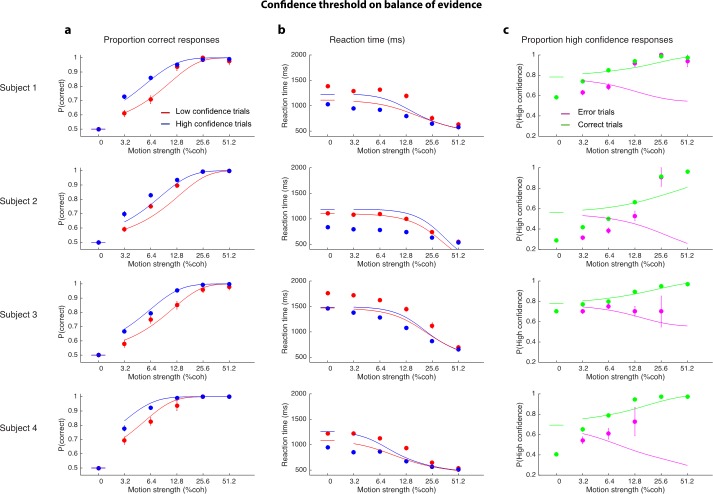
“In addition, subjects reported high confidence more often on correct choices than on errors (Figure 2c), and they tended to be more confident on those errors associated with stronger motion (P<1e-5 for 3 subjects and P = 0.50 for S3).”
§ A common mechanism underlies changes of mind about decisions and confidence > Results > Initial decisions
plaincorrelational- Asserted: passes — The authors put it forward as true.
- Checkable: passes — It can be checked against evidence.
- Load-bearing: unclear — It is unclear whether the paper’s conclusions depend on it.
- Based: passes — The paper gives a reason why it holds.
- The authors state this as an assumption: Subjects adopt a consistent criterion on degree of belief (log odds) to decide in favor of high or low confidence.
A result the paper reports from its own data — it cites no other source for it, so there is none to check. The quote shows it is in the paper.
In the paper
“Not surprisingly, stronger motion supported more accurate (Figure 2a) and faster decisions (Figure 2b), that tended to be assigned the higher confidence (Figure 2c).”
§ A common mechanism underlies changes of mind about decisions and confidence > Results > Initial decisions
plaincorrelational- Asserted: passes — The authors put it forward as true.
- Checkable: passes — It can be checked against evidence.
- Load-bearing: unclear — It is unclear whether the paper’s conclusions depend on it.
- Based: passes — The paper gives a reason why it holds.
A result the paper reports from its own data — it cites no other source for it, so there is none to check. The quote shows it is in the paper.
In the paper
“We show that choice, confidence, and reaction time are explained by a sequential sampling mechanism operating on a common evidence stream.”
- Also stated in: § Abstract · plain
“When participants were asked to report choice and confidence simultaneously, their confidence, reaction time and a perceptual decision about motion were explained by bounded evidence accumulation.”
§ A common mechanism underlies changes of mind about decisions and confidence > Introduction
plaindirect- Asserted: passes — The authors put it forward as true.
- Checkable: passes — It can be checked against evidence.
- Load-bearing: passes — The paper’s conclusions depend on it.
- Based: passes — The paper gives a reason why it holds.
- The authors state this as an assumption: The same information was used to reach an initial choice about direction and confidence.
- Also stated in: § Abstract · plain
A result the paper reports from its own data — it cites no other source for it, so there is none to check. The quote shows it is in the paper.
In the paper
“When subjects were more confident, they tended to be more accurate (Figure 2a; P<0.0001 for all subjects) and faster (Figure 2b; P<0.0001 for all subjects).”
§ A common mechanism underlies changes of mind about decisions and confidence > Results > Initial decisions
plaincorrelational- Asserted: passes — The authors put it forward as true.
- Checkable: passes — It can be checked against evidence.
- Load-bearing: unclear — It is unclear whether the paper’s conclusions depend on it.
- Based: passes — The paper gives a reason why it holds.
- The authors state this as an assumption: Subjects adopt a consistent criterion on degree of belief (log odds) to decide in favor of high or low confidence.
A result the paper reports from its own data — it cites no other source for it, so there is none to check. The quote shows it is in the paper.
In the paper
“Not surprisingly, stronger motion supported more accurate (Figure 2a) and faster decisions (Figure 2b), that tended to be assigned the higher confidence (Figure 2c).”
§ A common mechanism underlies changes of mind about decisions and confidence > Results > Initial decisions
hedgedcorrelational- Asserted: passes — The authors put it forward as true.
- Checkable: passes — It can be checked against evidence.
- Load-bearing: unclear — It is unclear whether the paper’s conclusions depend on it.
- Based: passes — The paper gives a reason why it holds.
- The authors state this as an assumption: Subjects adopt a consistent criterion on degree of belief (log odds) to decide in favor of high or low confidence.
A result the paper reports from its own data — it cites no other source for it, so there is none to check. The quote shows it is in the paper.
In the paper
“In addition, subjects reported high confidence more often on correct choices than on errors (Figure 2c), and they tended to be more confident on those errors associated with stronger motion (P<1e-5 for 3 subjects and P = 0.50 for S3).”
§ A common mechanism underlies changes of mind about decisions and confidence > Results > Initial decisions
hedgedcorrelationaln = 3 ·- Asserted: passes — The authors put it forward as true.
- Checkable: passes — It can be checked against evidence.
- Load-bearing: unclear — It is unclear whether the paper’s conclusions depend on it.
- Based: passes — The paper gives a reason why it holds.
- The authors state this as an assumption: Subjects adopt a consistent criterion on degree of belief (log odds) to decide in favor of high or low confidence.
A result the paper reports from its own data — it cites no other source for it, so there is none to check. The quote shows it is in the paper.
In the paper
“Not surprisingly, stronger motion supported more accurate (Figure 2a) and faster decisions (Figure 2b), that tended to be assigned the higher confidence (Figure 2c).”
§ A common mechanism underlies changes of mind about decisions and confidence > Results > Initial decisions
plaincorrelational- Asserted: passes — The authors put it forward as true.
- Checkable: passes — It can be checked against evidence.
- Load-bearing: unclear — It is unclear whether the paper’s conclusions depend on it.
- Based: passes — The paper gives a reason why it holds.
A result the paper reports from its own data — it cites no other source for it, so there is none to check. The quote shows it is in the paper.
In the paper
“When subjects were more confident, they tended to be more accurate (Figure 2a; P<0.0001 for all subjects) and faster (Figure 2b; P<0.0001 for all subjects).”
§ A common mechanism underlies changes of mind about decisions and confidence > Results > Initial decisions
plaincorrelational- Asserted: passes — The authors put it forward as true.
- Checkable: passes — It can be checked against evidence.
- Load-bearing: unclear — It is unclear whether the paper’s conclusions depend on it.
- Based: passes — The paper gives a reason why it holds.
- The authors state this as an assumption: Subjects adopt a consistent criterion on degree of belief (log odds) to decide in favor of high or low confidence.
None of the sources cited for this claim have been checked yet.
In the paper
“For three of the four subjects, changes of decision corrected an initial error more often than they spoiled an initially correct choice (P<0.001, P<0.001, P = 0.084, P<0.001), consistent with previous reports (Resulaj et al., 2009; Burk et al., 2014).”
§ A common mechanism underlies changes of mind about decisions and confidence > Results > Changes of mind
What the sources say
plaincorrelationaln = 3 ·- Asserted: passes — The authors put it forward as true.
- Checkable: passes — It can be checked against evidence.
- Load-bearing: unclear — It is unclear whether the paper’s conclusions depend on it.
- Based: passes — The paper gives a reason why it holds.
A result the paper reports from its own data — it cites no other source for it, so there is none to check. The quote shows it is in the paper.
In the paper
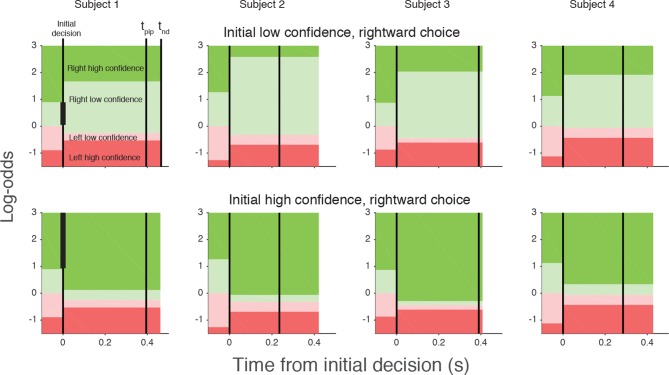
“Similar hysteresis is seen for initial high confidence decisions (Figure 6, bottom row).”
§ A common mechanism underlies changes of mind about decisions and confidence > Results > Changes of mind
plaincorrelational- Asserted: passes — The authors put it forward as true.
- Checkable: passes — It can be checked against evidence.
- Load-bearing: passes — The paper’s conclusions depend on it.
- Based: passes — The paper gives a reason why it holds.
- The authors state this as an assumption: Evidence was accumulated past the point of the initial decision for a fixed amount of time (tpip) that is less than the non-decision time.
- The authors state this as an assumption: The state of the belief at tpip determines the final confidence and choice.
- The authors state this as an assumption: Subjects might not apply identical criteria for confidence and choice in the pre- and post-initiation epoch (δθ parameters).
- The authors state this as an assumption: The model parameterization requires the pink and red regions to be same for both initial high and low confidence decisions.
- Probably not a substantial claim. 32
- It may state two separate claims as one. 26
- The quote only partly states this claim. 1
A result the paper reports from its own data — it cites no other source for it, so there is none to check. The quote shows it is in the paper.
In the paper
“Naturally, subjects differed in their sensitivity, speed/accuracy and confidence which was accounted for by the parameters of the fits (Table 1).”
§ A common mechanism underlies changes of mind about decisions and confidence > Results > Initial decisions
plaincorrelationaln = 4- Asserted: passes — The authors put it forward as true.
- Checkable: passes — It can be checked against evidence.
- Load-bearing: fails — The paper’s conclusions may not depend on it.
- Based: passes — The paper gives a reason why it holds.
Probably not a substantial claim. The paper’s conclusions may not depend on it. It may state two separate claims as one.
- The authors state this as an assumption: Subjects adopt a consistent criterion on degree of belief (log odds) to decide in favor of high or low confidence.
A result the paper reports from its own data — it cites no other source for it, so there is none to check. The quote shows it is in the paper.
In the paper
“They also differed in their criteria for categorizing degree of belief into high and low, which can be appreciated by the separation of choice functions by confidence report.”
§ A common mechanism underlies changes of mind about decisions and confidence > Results > Initial decisions
plainn = 4- Asserted: passes — The authors put it forward as true.
- Checkable: passes — It can be checked against evidence.
- Load-bearing: fails — The paper’s conclusions may not depend on it.
- Based: passes — The paper gives a reason why it holds.
Probably not a substantial claim. The paper’s conclusions may not depend on it.
- The authors state this as an assumption: Subjects adopt a consistent criterion on degree of belief (log odds) to decide in favor of high or low confidence.
A result the paper reports from its own data — it cites no other source for it, so there is none to check. The quote shows it is in the paper.
In the paper
“The smooth curves in Figure 2 are fits of the model (4 parameters; see Materials and methods), which capture the main features of the subjects’ choices.”
§ A common mechanism underlies changes of mind about decisions and confidence > Results > Initial decisions
plaincorrelationaln = 4- Asserted: passes — The authors put it forward as true.
- Checkable: passes — It can be checked against evidence.
- Load-bearing: passes — The paper’s conclusions depend on it.
- Based: passes — The paper gives a reason why it holds.
Probably not a substantial claim.
- The authors state this as an assumption: Subjects adopt a consistent criterion on degree of belief (log odds) to decide in favor of high or low confidence.
A result the paper reports from its own data — it cites no other source for it, so there is none to check. The quote shows it is in the paper.
In the paper
“Interestingly the inferred criteria for all the subjects were close to this optimal criterion, although all subjects were somewhat risk-averse (probability thresholds of 0.71, 0.78, 0.71 and 0.75; thresholds in log-odd units shown in Table 1).”
§ A common mechanism underlies changes of mind about decisions and confidence > Results > Initial decisions
plainn = 4- Asserted: passes — The authors put it forward as true.
- Checkable: passes — It can be checked against evidence.
- Load-bearing: unclear — It is unclear whether the paper’s conclusions depend on it.
- Based: passes — The paper gives a reason why it holds.
It may state two separate claims as one.
- The authors state this as an assumption: Subjects adopt a consistent criterion on degree of belief (log odds) to decide in favor of high or low confidence.
A result the paper reports from its own data — it cites no other source for it, so there is none to check. The quote shows it is in the paper.
In the paper
“There are some noteworthy discrepancies between model and data (e.g., proportion of high confidence choices at 0% coherence for 3 of 4 subjects), but the model captures the trend in the confidence ratings on error trials, mentioned above (3 of 4 subjects; Figure 2c), even though the fits themselves are dominated by the more numerous correct choices.”
§ A common mechanism underlies changes of mind about decisions and confidence > Results > Initial decisions
plaincorrelationaln = 4- Asserted: passes — The authors put it forward as true.
- Checkable: passes — It can be checked against evidence.
- Load-bearing: unclear — It is unclear whether the paper’s conclusions depend on it.
- Based: passes — The paper gives a reason why it holds.
It may state two separate claims as one.
- The authors state this as an assumption: Subjects adopt a consistent criterion on degree of belief (log odds) to decide in favor of high or low confidence.
A result the paper reports from its own data — it cites no other source for it, so there is none to check. The quote shows it is in the paper.
In the paper
“On a small fraction of trials, subjects changed their initial decision about the direction of motion and, more frequently, about their confidence.”
§ A common mechanism underlies changes of mind about decisions and confidence > Introduction
plain- Asserted: passes — The authors put it forward as true.
- Checkable: passes — It can be checked against evidence.
- Load-bearing: passes — The paper’s conclusions depend on it.
- Based: passes — The paper gives a reason why it holds.
It may state two separate claims as one.
A result the paper reports from its own data — it cites no other source for it, so there is none to check. The quote shows it is in the paper.
In the paper
“We show that confidence and choice are informed by the same evidence, both at the initial choice and on any subsequent revision.”
§ A common mechanism underlies changes of mind about decisions and confidence > Introduction
plaincorrelational- Asserted: passes — The authors put it forward as true.
- Checkable: passes — It can be checked against evidence.
- Load-bearing: passes — The paper’s conclusions depend on it.
- Based: passes — The paper gives a reason why it holds.
It may state two separate claims as one.
- The authors state this as an assumption: The same information was used to reach an initial choice about direction and confidence.
- The authors state this as an assumption: There is additional information available to the decision maker after committing to a choice and confidence category, despite the disappearance of the random dot motion upon response initiation.
A result the paper reports from its own data — it cites no other source for it, so there is none to check. The quote shows it is in the paper.
In the paper
“There was a subtle bias for the bottom targets (50.6, 51.9, 52.5 and 51.4%, respectively), possibly due to kinematic factors, but recall that the orientation was balanced across the experiment.”
§ A common mechanism underlies changes of mind about decisions and confidence > Materials and methods > Analysis
hedgedconditional- Asserted: passes — The authors put it forward as true.
- Checkable: passes — It can be checked against evidence.
- Load-bearing: fails — The paper’s conclusions may not depend on it.
- Based: passes — The paper gives a reason why it holds.
Probably not a substantial claim. The paper’s conclusions may not depend on it. It may state two separate claims as one.
A result the paper reports from its own data — it cites no other source for it, so there is none to check. The quote shows it is in the paper.
In the paper
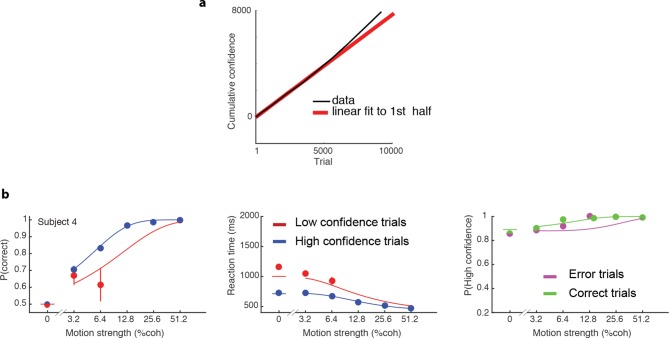
“Subject 4 showed a qualitative change in behavior on the second half of their data (after ~5000 trials; Figure 2—figure supplement 2a), reporting high confidence on nearly all trials.”
§ A common mechanism underlies changes of mind about decisions and confidence > Materials and methods > Procedure
plainSingle case- Asserted: passes — The authors put it forward as true.
- Checkable: passes — It can be checked against evidence.
- Load-bearing: fails — The paper’s conclusions may not depend on it.
- Based: passes — The paper gives a reason why it holds.
Probably not a substantial claim. The paper’s conclusions may not depend on it.
The paper states this without a source or data behind it here, so there is nothing to check it against. The quote shows it is in the paper.
In the paper
“The model is by no means perfect (e.g., it overestimates confidence at the lowest motion strength)”
§ A common mechanism underlies changes of mind about decisions and confidence > Discussion
plaindirect- Asserted: passes — The authors put it forward as true.
- Checkable: passes — It can be checked against evidence.
- Load-bearing: fails — The paper’s conclusions may not depend on it.
- Based: passes — The paper gives a reason why it holds.
Probably not a substantial claim. The paper’s conclusions may not depend on it.
A result the paper reports from its own data — it cites no other source for it, so there is none to check. The quote shows it is in the paper.
In the paper
“Just a few hundred milliseconds of additional evidence led to changes in the confidence associated with the initial choice, ranging from 1.5–6.3% of trials across our subjects, and this was enough to induce a clear departure from the level of confidence that ought to be associated with the evidence available at the time of the initial choice.”
§ A common mechanism underlies changes of mind about decisions and confidence > Discussion
boosteddirect- Asserted: passes — The authors put it forward as true.
- Checkable: passes — It can be checked against evidence.
- Load-bearing: passes — The paper’s conclusions depend on it.
- Based: passes — The paper gives a reason why it holds.
It may state two separate claims as one.
A result the paper reports from its own data — it cites no other source for it, so there is none to check. The quote shows it is in the paper.
In the paper
“Of course, errors were less frequent with stronger motion and less frequent than correct responses (Figure 2a).”
§ A common mechanism underlies changes of mind about decisions and confidence > Results > Changes of mind
plaincorrelational- Asserted: passes — The authors put it forward as true.
- Checkable: passes — It can be checked against evidence.
- Load-bearing: fails — The paper’s conclusions may not depend on it.
- Based: passes — The paper gives a reason why it holds.
Probably not a substantial claim. The paper’s conclusions may not depend on it. It may state two separate claims as one.
A result the paper reports from its own data — it cites no other source for it, so there is none to check. The quote shows it is in the paper.
In the paper
“However, our model could still fit the initial choices for the omitted second half of this participant's data (Figure 2—figure supplement 2b).”
§ A common mechanism underlies changes of mind about decisions and confidence > Materials and methods > Procedure
hedgedSingle case- Asserted: passes — The authors put it forward as true.
- Checkable: passes — It can be checked against evidence.
- Load-bearing: fails — The paper’s conclusions may not depend on it.
- Based: passes — The paper gives a reason why it holds.
Probably not a substantial claim. The paper’s conclusions may not depend on it.
A result the paper reports from its own data — it cites no other source for it, so there is none to check. The quote shows it is in the paper.
In the paper
“The frequency of these changes of mind varied between subjects, from 2.0 to 8.8% of trials.”
§ A common mechanism underlies changes of mind about decisions and confidence > Results > Changes of mind
plain- Asserted: passes — The authors put it forward as true.
- Checkable: passes — It can be checked against evidence.
- Load-bearing: fails — The paper’s conclusions may not depend on it.
- Based: passes — The paper gives a reason why it holds.
Probably not a substantial claim. The paper’s conclusions may not depend on it.
A result the paper reports from its own data — it cites no other source for it, so there is none to check. The quote shows it is in the paper.
In the paper
“We found that despite the idiosyncrasy in this subject’s data, our model can fit their initial choices (Figure 2—figure supplement 1).”
§ A common mechanism underlies changes of mind about decisions and confidence > Materials and methods > Procedure
plainSingle case- Asserted: passes — The authors put it forward as true.
- Checkable: passes — It can be checked against evidence.
- Load-bearing: fails — The paper’s conclusions may not depend on it.
- Based: passes — The paper gives a reason why it holds.
Probably not a substantial claim. The paper’s conclusions may not depend on it.
A result the paper reports from its own data — it cites no other source for it, so there is none to check. The quote shows it is in the paper.
In the paper
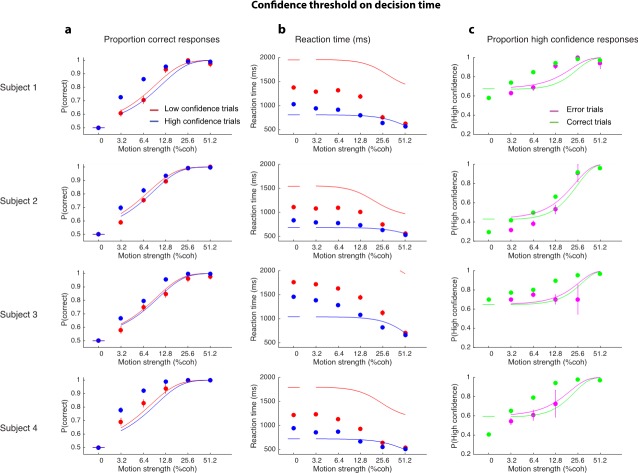
“We have also fit data using time-dependent confidence bounds, which improve the fits for all subjects but does not affect the figures visibly and does not affect our conclusions.”
§ A common mechanism underlies changes of mind about decisions and confidence > Materials and methods > Model
plaindirect- Asserted: passes — The authors put it forward as true.
- Checkable: passes — It can be checked against evidence.
- Load-bearing: fails — The paper’s conclusions may not depend on it.
- Based: passes — The paper gives a reason why it holds.
Probably not a substantial claim. The paper’s conclusions may not depend on it. It may state two separate claims as one.
A conclusion the paper draws from its own results — it cites no other source for it, so there is none to check. The quote shows it is in the paper.
In the paper
“For example, this explains why confidence associated with errors increases with stronger coherences: stronger motion induces faster decision times for correct and errors alike.”
§ A common mechanism underlies changes of mind about decisions and confidence > Results > Initial decisions
plaindirect- Asserted: passes — The authors put it forward as true.
- Checkable: passes — It can be checked against evidence.
- Load-bearing: passes — The paper’s conclusions depend on it.
- Based: passes — The paper gives a reason why it holds.
It may state two separate claims as one.
- The authors state this as an assumption: Subjects adopt a consistent criterion on degree of belief (log odds) to decide in favor of high or low confidence.
None of the sources cited for this claim have been checked yet.
In the paper
“Evidence for such a process was adduced to explain reversals of perceptual decisions in humans and monkeys (Rabbitt, 1966; Rabbitt and Vyas, 1981; McPeek et al., 2000; Caspi and Beutter, 2004; Van Zandt and Maldonado-Molina, 2004; Resulaj et al., 2009; Burk et al., 2014; Kiani et al., 2014b; Moher and Song, 2014).”
§ A common mechanism underlies changes of mind about decisions and confidence > Introduction
What the sources say
plaindirect- Asserted: passes — The authors put it forward as true.
- Checkable: passes — It can be checked against evidence.
- Load-bearing: passes — The paper’s conclusions depend on it.
- Based: passes — The paper gives a reason why it holds.
Probably not a substantial claim.
None of the sources cited for this claim have been checked yet.
In the paper
“This last point remains controversial, however, for there are many instances when the confidence in a decision and the decision itself are dissociable.”
§ A common mechanism underlies changes of mind about decisions and confidence > Introduction
What the sources say
- Not checked yetcites Fischoff et al., 1982
- Not checked yetcites Baranski and Petrusic, 1994
- Not checked yetcites Kunimoto et al., 2001 source
plain- Asserted: passes — The authors put it forward as true.
- Checkable: passes — It can be checked against evidence.
- Load-bearing: passes — The paper’s conclusions depend on it.
- Based: passes — The paper gives a reason why it holds.
Probably not a substantial claim.
In the paper
“This model has been tested in neurophysiology and a previous report in humans (Kiani et al., 2014a) which extends ideas from signal detection theory, race, and Bayesian models (Vickers, 1979; Kepecs et al., 2008; Maniscalco and Lau, 2012; Drugowitsch et al., 2014).”
§ A common mechanism underlies changes of mind about decisions and confidence > Results > Initial decisions
What the sources say
- Not checked yetcites Kiani et al., 2014a
plain- Asserted: passes — The authors put it forward as true.
- Checkable: passes — It can be checked against evidence.
- Load-bearing: fails — The paper’s conclusions may not depend on it.
- Based: passes — The paper gives a reason why it holds.
Probably not a substantial claim. The paper’s conclusions may not depend on it. It may state two separate claims as one.
None of the sources cited for this claim have been checked yet.
In the paper
“The ensuing tradeoff between speed and accuracy is explained by sequential sampling with optional stopping models in which evidence is accumulated to some stopping criterion or bound (Link, 1975; Ratcliff and Rouder, 1998).”
§ A common mechanism underlies changes of mind about decisions and confidence > Introduction
What the sources say
plaindirect- Asserted: passes — The authors put it forward as true.
- Checkable: passes — It can be checked against evidence.
- Load-bearing: passes — The paper’s conclusions depend on it.
- Based: passes — The paper gives a reason why it holds.
Probably not a substantial claim.
The paper states this without a source or data behind it here, so there is nothing to check it against. The quote shows it is in the paper.
In the paper
“To maximize the number of points, given the reward structure (see Materials and methods), subjects should choose high confidence if they believe the probability of a correct choice is greater than two-thirds, which corresponds to a log-odds of 0.69.”
§ A common mechanism underlies changes of mind about decisions and confidence > Results > Initial decisions
plain- Asserted: passes — The authors put it forward as true.
- Checkable: passes — It can be checked against evidence.
- Load-bearing: fails — The paper’s conclusions may not depend on it.
- Based: passes — The paper gives a reason why it holds.
Probably not a substantial claim. The paper’s conclusions may not depend on it.
None of the sources cited for this claim have been checked yet.
In the paper
“This is because the quantity that is accumulated, termed a decision variable (DV), when combined with elapsed decision time, maps to the probability that a decision rendered on its value will be correct (Kiani and Shadlen, 2009; Drugowitsch et al., 2014).”
§ A common mechanism underlies changes of mind about decisions and confidence > Introduction
What the sources say
- Not checked yetcites Kiani and Shadlen, 2009
- Not checked yetcites Drugowitsch et al., 2014 source
plaincorrelational- Asserted: passes — The authors put it forward as true.
- Checkable: passes — It can be checked against evidence.
- Load-bearing: passes — The paper’s conclusions depend on it.
- Based: passes — The paper gives a reason why it holds.
Probably not a substantial claim.
In the paper
“and they can perform above chance level yet report they are guessing (Kunimoto et al., 2001).”
§ A common mechanism underlies changes of mind about decisions and confidence > Introduction
What the sources say
- Not checked yetcites Kunimoto et al., 2001 source
plaincorrelational- Asserted: passes — The authors put it forward as true.
- Checkable: passes — It can be checked against evidence.
- Load-bearing: fails — The paper’s conclusions may not depend on it.
- Based: passes — The paper gives a reason why it holds.
Probably not a substantial claim. The paper’s conclusions may not depend on it.
None of the sources cited for this claim have been checked yet.
In the paper
“For example, human decision makers tend to overestimate their certainty about choices based on truly ambiguous evidence (Fischoff et al., 1982; Baranski and Petrusic, 1994; Erev et al., 1994; Drugowitsch et al., 2014; Kiani et al., 2014a)”
§ A common mechanism underlies changes of mind about decisions and confidence > Introduction
What the sources say
- Not checked yetcites Fischoff et al., 1982
- Not checked yetcites Baranski and Petrusic, 1994
- Not checked yetcites Erev et al., 1994 source
plain- Asserted: passes — The authors put it forward as true.
- Checkable: passes — It can be checked against evidence.
- Load-bearing: fails — The paper’s conclusions may not depend on it.
- Based: passes — The paper gives a reason why it holds.
Probably not a substantial claim. The paper’s conclusions may not depend on it.
In the paper
“To further reduce the degrees of freedom of the model to four we fixed both the covariance ρ to -0.5 ≈ -0.71 and non-decision time standard deviation σtnd to 60 ms (within the normal range from a previous study (Burk et al., 2014) and supported by an analysis of motion energy; see Figure 1—figure supplement 1).”
§ A common mechanism underlies changes of mind about decisions and confidence > Materials and methods > Model
What the sources say
- Not checked yetcites Burk et al., 2014 source
plain- Asserted: passes — The authors put it forward as true.
- Checkable: passes — It can be checked against evidence.
- Load-bearing: fails — The paper’s conclusions may not depend on it.
- Based: passes — The paper gives a reason why it holds.
Probably not a substantial claim. The paper’s conclusions may not depend on it. It may state two separate claims as one.
- The authors state this as an assumption: Reaction time is determined by the time to reach the decision bound plus a non-decision time modeled as a normal distribution with mean μtnd and standard deviation σtnd.
A conclusion the paper draws from its own results — it cites no other source for it, so there is none to check. The quote shows it is in the paper.
In the paper
“The observation supports a parsimonious account of decision confidence which is somewhat at odds with recent literature on meta-cognition (see Discussion).”
§ A common mechanism underlies changes of mind about decisions and confidence > Results > Changes of mind
plainn = 4- Asserted: passes — The authors put it forward as true.
- Checkable: passes — It can be checked against evidence.
- Load-bearing: passes — The paper’s conclusions depend on it.
- Based: passes — The paper gives a reason why it holds.
It may state two separate claims as one.
In the paper
“For analytic simplicity (see below), we used a flat bound (i.e., stationary rather than collapsing), which does not capture the shape of the RT distributions and the mean RT on error trials (Drugowitsch et al., 2012).”
§ A common mechanism underlies changes of mind about decisions and confidence > Materials and methods > Model
What the sources say
- Not checked yetcites Drugowitsch et al., 2012 source
plain- Asserted: passes — The authors put it forward as true.
- Checkable: passes — It can be checked against evidence.
- Load-bearing: passes — The paper’s conclusions depend on it.
- Based: passes — The paper gives a reason why it holds.
Probably not a substantial claim. It may state two separate claims as one.
A conclusion the paper draws from its own results — it cites no other source for it, so there is none to check. The quote shows it is in the paper.
In the paper
“This discrepancy might be regarded as a sign of 2nd-order confidence, whereas it is simply the result of a continuation of the 1st-order process that couples choice and confidence, via bounded evidence accumulation.”
§ A common mechanism underlies changes of mind about decisions and confidence > Results > Changes of mind
hedgeddirectn = 19 ·- Asserted: passes — The authors put it forward as true.
- Checkable: passes — It can be checked against evidence.
- Load-bearing: passes — The paper’s conclusions depend on it.
- Based: passes — The paper gives a reason why it holds.
It may state two separate claims as one.
What the paper did — it cites no source for this, so there is none to check. The quote shows it is in the paper.
In the paper
“The variability across runs was minimal, suggesting that the optimization procedure converged to global maximum.”
§ A common mechanism underlies changes of mind about decisions and confidence > Materials and methods > Model
hedgeddirect- Asserted: passes — The authors put it forward as true.
- Checkable: passes — It can be checked against evidence.
- Load-bearing: fails — The paper’s conclusions may not depend on it.
- Based: passes — The paper gives a reason why it holds.
Probably not a substantial claim. The paper’s conclusions may not depend on it. It may state two separate claims as one.
What the paper did — it cites no source for this, so there is none to check. The quote shows it is in the paper.
In the paper
“We show combined data for the two target configurations (high/low confidence targets at top/bottom), having reassured ourselves that the arrangement had no detectable effects on choice accuracy (p≥0.4; Fisher’s exact test) and only small effects on reaction time (RT) for 2 subjects (magnitudes<3%, p<0.01; t-test).”
§ A common mechanism underlies changes of mind about decisions and confidence > Materials and methods > Analysis
plainn = 2- Asserted: passes — The authors put it forward as true.
- Checkable: passes — It can be checked against evidence.
- Load-bearing: unclear — It is unclear whether the paper’s conclusions depend on it.
- Based: passes — The paper gives a reason why it holds.
It may state two separate claims as one.
None of the sources cited for this claim have been checked yet.
In the paper
“The class of bounded sequential sampling models, including many variants (Wald, 1947; Stone, 1960; Laming, 1968; Link, 1975; Good, 1979; Luce, 1986; Ratcliff and Rouder, 1998) explains the tradeoff between speed and accuracy, and many of the essential steps have correlates in neurophysiology (Romo et al., 2002; Heekeren et al., 2004; Ploran et al., 2007; Heitz and Schall, 2012; White et al., 2012;”
§ A common mechanism underlies changes of mind about decisions and confidence > Discussion
What the sources say
plaincorrelational- Asserted: passes — The authors put it forward as true.
- Checkable: passes — It can be checked against evidence.
- Load-bearing: fails — The paper’s conclusions may not depend on it.
- Based: passes — The paper gives a reason why it holds.
Probably not a substantial claim. The paper’s conclusions may not depend on it. It may state two separate claims as one.
A conclusion the paper draws from its own results — it cites no other source for it, so there is none to check. The quote shows it is in the paper.
In the paper
“This implies that termination has a kind of specificity; it marks the end of deliberation for purposes of response initiation, but it does not actually terminate all deliberation.”
§ A common mechanism underlies changes of mind about decisions and confidence > Discussion
plain- Asserted: passes — The authors put it forward as true.
- Checkable: passes — It can be checked against evidence.
- Load-bearing: passes — The paper’s conclusions depend on it.
- Based: passes — The paper gives a reason why it holds.
It may state two separate claims as one.
None of the sources cited for this claim have been checked yet.
In the paper
“In previous studies, we showed that the motor system receives a continuous updating of the state of the evidence leading to a choice (Gold and Shadlen, 2000; Selen et al., 2012) and can utilize the late arriving information to revise an initial choice by continuing the process of deliberation (Resulaj et al., 2009; Burk et al., 2014).”
§ A common mechanism underlies changes of mind about decisions and confidence > Discussion
What the sources say
plaindirect- Asserted: passes — The authors put it forward as true.
- Checkable: passes — It can be checked against evidence.
- Load-bearing: passes — The paper’s conclusions depend on it.
- Based: passes — The paper gives a reason why it holds.
Probably not a substantial claim. It may state two separate claims as one.
A conclusion the paper draws from its own results — it cites no other source for it, so there is none to check. The quote shows it is in the paper.
In the paper
“The present study establishes that this assessment evolves in time and, like the choice itself, can undergo revision with additional evidence.”
§ A common mechanism underlies changes of mind about decisions and confidence > Discussion
boosteddirect- Asserted: passes — The authors put it forward as true.
- Checkable: passes — It can be checked against evidence.
- Load-bearing: passes — The paper’s conclusions depend on it.
- Based: passes — The paper gives a reason why it holds.
It may state two separate claims as one.
In the paper
“Using this analytic method precluded the use of collapsing decision bounds (and no lower reflecting bounds; cf., Kiani et al., 2014a).”
§ A common mechanism underlies changes of mind about decisions and confidence > Materials and methods > Model
What the sources say
- Not checked yetcites Kiani et al., 2014a
plaindirect- Asserted: passes — The authors put it forward as true.
- Checkable: passes — It can be checked against evidence.
- Load-bearing: fails — The paper’s conclusions may not depend on it.
- Based: passes — The paper gives a reason why it holds.
Probably not a substantial claim. The paper’s conclusions may not depend on it.
In the paper
“Importantly, however, this does not imply a dissociation between confidence and the decision (Pleskac and Busemeyer, 2010), as the latter can also be revised based on the same additional information.”
§ A common mechanism underlies changes of mind about decisions and confidence > Discussion
What the sources say
- Not checked yetcites Pleskac and Busemeyer, 2010
plain- Asserted: passes — The authors put it forward as true.
- Checkable: passes — It can be checked against evidence.
- Load-bearing: passes — The paper’s conclusions depend on it.
- Based: passes — The paper gives a reason why it holds.
It may state two separate claims as one.
What the paper did — it cites no source for this, so there is none to check. The quote shows it is in the paper.
In the paper
“In principle, such a mechanism could terminate post-initiation processing more flexibly, but the frequency of change of mind about choice and confidence is too small to evaluate this possibility.”
§ A common mechanism underlies changes of mind about decisions and confidence > Materials and methods > Model
hedged- Asserted: passes — The authors put it forward as true.
- Checkable: passes — It can be checked against evidence.
- Load-bearing: fails — The paper’s conclusions may not depend on it.
- Based: passes — The paper gives a reason why it holds.
Probably not a substantial claim. The paper’s conclusions may not depend on it. It may state two separate claims as one. The quote only partly states this claim.
- The authors state this as an assumption: Once the initial decision has been made, the accumulators continue to integrate information that was not accessible at the time of the initial decision for a further post-initiation period tpip.
- The authors state this as an assumption: A change in confidence or choice occurs if at the end of the post-initiation period the log odds crosses a confidence or choice threshold.
In the paper
“Yet the operations leading to confidence seem neither mysterious nor dissociable from the decision process (cf. De Martino et al., 2013).”
§ A common mechanism underlies changes of mind about decisions and confidence > Discussion
What the sources say
- Not checked yetcites De Martino et al., 2013 source
hedgedcorrelational- Asserted: passes — The authors put it forward as true.
- Checkable: passes — It can be checked against evidence.
- Load-bearing: passes — The paper’s conclusions depend on it.
- Based: passes — The paper gives a reason why it holds.
It may state two separate claims as one.
None of the sources cited for this claim have been checked yet.
In the paper
“The evaluation of additional evidence may explain why confidence ratings are more strongly correlated with accuracy when they are reported with less time pressure (Yu et al., 2015), and why some individuals appear to be better than others at discriminating correct from incorrect decisions (e.g. Ais et al., 2016).”
§ A common mechanism underlies changes of mind about decisions and confidence > Discussion
What the sources say
- Not checked yetcites Yu et al., 2015
- Not checked yetcites Ais et al., 2016 source
hedgedconditional- Asserted: passes — The authors put it forward as true.
- Checkable: passes — It can be checked against evidence.
- Load-bearing: fails — The paper’s conclusions may not depend on it.
- Based: passes — The paper gives a reason why it holds.
Probably not a substantial claim. The paper’s conclusions may not depend on it. It may state two separate claims as one.
A conclusion the paper draws from its own results — it cites no other source for it, so there is none to check. The quote shows it is in the paper.
In the paper
“The ORs calculated from the initial confidence report establish a baseline: the breakdown of confidence associated with the information that explains the accuracy at each motion strength, analogous to meta-d′ equal to d′ in the SDT framework described above.”
§ A common mechanism underlies changes of mind about decisions and confidence > Materials and methods > Analysis
plaincorrelational- Asserted: passes — The authors put it forward as true.
- Checkable: passes — It can be checked against evidence.
- Load-bearing: fails — The paper’s conclusions may not depend on it.
- Based: passes — The paper gives a reason why it holds.
Probably not a substantial claim. The paper’s conclusions may not depend on it.
The paper states this without a source or data behind it here, so there is nothing to check it against. The quote shows it is in the paper.
In the paper
“The meta-d′ statistic is not well behaved in the sequential sampling framework, but the basic logic remains applicable (see Materials and methods).”
§ A common mechanism underlies changes of mind about decisions and confidence > Results > Changes of mind
plain- Asserted: passes — The authors put it forward as true.
- Checkable: passes — It can be checked against evidence.
- Load-bearing: passes — The paper’s conclusions depend on it.
- Based: passes — The paper gives a reason why it holds.
Probably not a substantial claim. It may state two separate claims as one.
In the paper
“This choice of covariance assumes that about half the noise is shared between the two accumulators (i.e. arises from the stimulus) and is within the normal range of fitted covariances (Kiani et al., 2014a).”
§ A common mechanism underlies changes of mind about decisions and confidence > Materials and methods > Model
What the sources say
- Not checked yetcites Kiani et al., 2014a
plain- Asserted: passes — The authors put it forward as true.
- Checkable: passes — It can be checked against evidence.
- Load-bearing: fails — The paper’s conclusions may not depend on it.
- Based: passes — The paper gives a reason why it holds.
Probably not a substantial claim. The paper’s conclusions may not depend on it.
- The authors state this as an assumption: About half the noise is shared between the two accumulators (arises from the stimulus).
The paper states this without a source or data behind it here, so there is nothing to check it against. The quote shows it is in the paper.
In the paper
“However, the SDT framework must be extended to account for RT and choice.”
§ A common mechanism underlies changes of mind about decisions and confidence > Materials and methods > Analysis
plain- Asserted: passes — The authors put it forward as true.
- Checkable: fails — It may be too vague to check against evidence.
- Load-bearing: passes — The paper’s conclusions depend on it.
- Based: passes — The paper gives a reason why it holds.
Probably not a substantial claim. It may be too vague to check against evidence.
- Rests on an assumption: Under sequential sampling models, meta-d′ ≠ d′ even when choice and confidence are explained by the same decision variable.
None of the sources cited for this claim have been checked yet.
In the paper
“Evidence for a meta-cognitive process is adduced from a dissociation between the signal-to-noise properties of the evidence that would support a level of choice accuracy versus the level associated with a degree of confidence (e.g., meta-d′; see Fleming and Lau, 2014; Maniscalco and Lau, 2012).”
§ A common mechanism underlies changes of mind about decisions and confidence > Results > Changes of mind
What the sources say
- Not checked yetcites Fleming and Lau, 2014 source
- Not checked yetcites Maniscalco and Lau, 2012
plaincorrelational- Asserted: passes — The authors put it forward as true.
- Checkable: passes — It can be checked against evidence.
- Load-bearing: fails — The paper’s conclusions may not depend on it.
- Based: passes — The paper gives a reason why it holds.
Probably not a substantial claim. The paper’s conclusions may not depend on it.
The authors state this as an assumption.
Subjects adopt a consistent criterion on degree of belief (log odds) to decide in favor of high or low confidence.
“For simplicity, we assumed that subjects adopt a consistent criterion on “degree of belief” (log odds, Figure 3b) to decide in favor of high or low confidence.”
The authors state this as an assumption.
The same information was used to reach an initial choice about direction and confidence.
“The critical assumptions are (i) the same information was used to reach an initial choice about direction and confidence, and (ii) there is additional information available to the decision maker after committing to a choice and confidence category, despite the disappearance of the random dot motion upon response initiation.”
The authors state this as an assumption.
There is additional information available to the decision maker after committing to a choice and confidence category, despite the disappearance of the random dot motion upon response initiation.
“The critical assumptions are (i) the same information was used to reach an initial choice about direction and confidence, and (ii) there is additional information available to the decision maker after committing to a choice and confidence category, despite the disappearance of the random dot motion upon response initiation.”
The authors state this as an assumption.
Evidence was accumulated past the point of the initial decision for a fixed amount of time (tpip) that is less than the non-decision time.
“We assumed that evidence was accumulated past the point of the initial decision for a fixed amount of time (a free parameter, tpip) that is less than the non-decision time.”
The authors state this as an assumption.
The state of the belief at tpip determines the final confidence and choice.
“The state of the belief at tpip determines the final confidence and choice (see Materials and methods).”
The authors state this as an assumption.
Subjects might not apply identical criteria for confidence and choice in the pre- and post-initiation epoch (δθ parameters).
“we allowed for the possibility that subjects might not apply the identical criteria for confidence and choice in the pre- and post-initiation epoch (the δθ parameters; see Materials and methods).”
The authors state this as an assumption.
Choice and confidence are related but processed as if separate attributes, via a correspondence between decision variable and belief.
“To explain our findings, we assumed that choice and confidence are related but processed as if separate attributes, via a correspondence between decision variable and belief.”
The authors state this as an assumption.
The model parameterization requires the pink and red regions to be same for both initial high and low confidence decisions.
“Note that the model parameterization requires the pink and red regions to be same for both initial high and low confidence decisions.”
The paper relies on this without support.
Non-decision time typically exceeds 300 ms even in relatively fast perceptual decisions.
“Even in relatively fast perceptual decisions, this so-called non-decision time typically exceeds 300 ms.”
The paper relies on this without support.
The temporal stream of evidence in random dot kinematograms is effectively a sequence of independent, statistically stationary samples.
“the temporal stream of evidence is effectively a sequence of independent, statistically stationary samples.”
The paper relies on this without support.
There are processing delays between the arrival of information from the environment and updating its representation in working memory as a decision variable, and there are delays between commitment to a decision and communicating this decision through the motor system.
“Specifically, there are processing delays between the arrival of information from the environment and updating its representation in working memory as a decision variable bearing on a proposition, and there are delays between commitment to a decision and communicating this decision through the motor system.”
The authors state this as an assumption.
About half the noise is shared between the two accumulators (arises from the stimulus).
“This choice of covariance assumes that about half the noise is shared between the two accumulators (i.e. arises from the stimulus) and is within the normal range of fitted covariances (Kiani et al., 2014a).”
The authors state this as an assumption.
Once the initial decision has been made, the accumulators continue to integrate information that was not accessible at the time of the initial decision for a further post-initiation period tpip.
“To model changes of mind, we assumed that once the initial decision had been made, the accumulators continued to integrate information that was not accessible at the time of the initial decision (due to latencies in the sensory and motor system) for a further post-initiation period tpip (constrained to be less than tnd).”
The authors state this as an assumption.
A change in confidence or choice occurs if at the end of the post-initiation period the log odds crosses a confidence or choice threshold.
“A change in confidence or choice would occur if at the end of this period the log odds crossed a confidence or choice threshold, respectively (Figure 3b).”
The paper relies on this without support.
There are motor costs involved in changes of mind.
“Since there are motor costs involved in changes of mind, we included additional parameters that could move the confidence and choice thresholds away from their initial values in the post-initiation stage by δθ1, δθ2 and δθ3 (Figure 3b).”
The paper relies on this without support.
Under sequential sampling models, meta-d′ ≠ d′ even when choice and confidence are explained by the same decision variable.
“Under sequential sampling (e.g., bounded drift diffusion), meta-d′ ≠ d′, even when the choice and confidence are explained by the same decision variable.”
The authors state this as an assumption.
Momentary evidence is drawn from a bivariate Gaussian with mean (κC, -κC).
“Momentary evidence was modeled as draws from a bivariate Gaussian with a mean that depends on the coherence (C) such that drift rate (/s) is κC for the rightward and -κC for the leftward accumulator, giving a mean of (κC,-κC).”
The authors state this as an assumption.
The two accumulators share noise with negative covariance ρ.
“The bivariate Gaussian has a negative covariance ρ which determines the extent to which the two accumulators share noise (for example arising from fluctuations in the stimulus).”
The authors state this as an assumption.
A decision is made when one of the two races crosses a decision bound B.
“A decision is made when one of the two races crosses a decision bound B.”
The authors state this as an assumption.
Reaction time is determined by the time to reach the decision bound plus a non-decision time modeled as a normal distribution with mean μtnd and standard deviation σtnd.
“The reaction time is determined by the time to reach the decision bound and an additional non-decision time (e.g., due to sensory and motor latencies) which was modeled as a normal distribution with mean μtnd and standard deviation σtnd.”
The authors state this as an assumption.
Confidence is modeled with a log-odds threshold θ separating high from low confidence judgments.
“To model confidence, we included a log-odds threshold θ which separated high from low confidence judgments.”
The authors state this as an assumption.
The confidence threshold is time-invariant.
“For simplicity, we chose a time-invariant threshold.”
The paper relies on this without support.
Fluctuations have a stronger impact when motion is weak.
“Because fluctuations have a stronger impact when motion is weak, only the lowest motion strengths (≤6.4% coh) were included in these analyses.”
The paper relies on this without support.
Due to the stochastic nature of the motion stimuli, the strength of motion varies from trial to trial and within a trial.
“Due to the stochastic nature of the motion stimuli, the strength of motion will vary from trial to trial, and even within a trial.”
Claims other papers make about this one
Each is checked against this paper’s own text: does it say what the citing paper says it does?
The source backs part of the claim, not all of it — or backs it for a different population, condition or comparison.
In the citing paper
“Variation in post-decision confidence predicts how likely the decision is to be revised if an opportunity arises,9”
From Two prefrontal-subcortical circuits estimate controllability and reflect its impact on learning (2026) · cites this paper as [11]
Experimental — accuracy not yet measured
Citations
Cites
The Neural Basis of Decision Making
Gold, J. I., & Shadlen, M. N. (2007) · Annual Review of Neuroscience · doi:10.1146/annurev.neuro.29.051605.113038 · Cited by 3,764
Self-citationSpatiotemporal energy models for the perception of motion
Adelson, E. H., & Bergen, J. R. (1985) · Journal of the Optical Society of America A · doi:10.1364/josaa.2.000284 · Cited by 3,442
The time course of perceptual choice: The leaky, competing accumulator model.
Usher, M., & McClelland, J. L. (2001) · Psychological Review · doi:10.1037/0033-295x.108.3.550 · Cited by 2,152
(1986) · Cited by 2,022
Calibration of probabilities: the state of the art to 1980
Lichtenstein, S., Fischhoff, B., & Phillips, L. D. (1982) · Judgment under Uncertainty · doi:10.1017/cbo9780511809477.023 · Cited by 1,967
The analysis of visual motion: a comparison of neuronal and psychophysical performance
Britten, K., Shadlen, M., Newsome, W., & Movshon, J. (1992) · The Journal of Neuroscience · doi:10.1523/jneurosci.12-12-04745.1992 · Cited by 1,958
Self-citationRoitman, J. D., & Shadlen, M. N. (2002) · The Journal of Neuroscience · doi:10.1523/jneurosci.22-21-09475.2002 · Cited by 1,589
Self-citationModeling Response Times for Two-Choice Decisions
Ratcliff, R., & Rouder, J. N. (1998) · Psychological Science · doi:10.1111/1467-9280.00067 · Cited by 1,478
Fleming, S. M., & Lau, H. C. (2014) · Frontiers in Human Neuroscience · doi:10.3389/fnhum.2014.00443 · Cited by 1,408 · cited 2×
“Nor do we know how a criterion is applied to this mapping to render the categorical 354 choices in our study, or in post-decision wagering decisions (Kiani and Shadlen, 2009), or in 355 confidence ratings (Maniscalco and Lau, 2012; Fleming and Lau, 2014; Kiani et al., 2014a).”
BackgroundMethodRepresentation of Confidence Associated with a Decision by Neurons in the Parietal Cortex
Kiani, R., & Shadlen, M. N. (2009) · Science · doi:10.1126/science.1169405 · Cited by 1,027
Self-citationInformation theory of choice-reaction times
Laming, D. (1968) · Medical Entomology and Zoology · Cited by 945
Maniscalco, B., & Lau, H. (2012) · Consciousness and Cognition · doi:10.1016/j.concog.2011.09.021 · Cited by 883
Neural correlates, computation and behavioural impact of decision confidence
Kepecs, A., Uchida, N., Zariwala, H. A., & Mainen, Z. F. (2008) · Nature · doi:10.1038/nature07200 · Cited by 809
The neural basis of metacognitive ability
Fleming, S. M., & Dolan, R. J. (2012) · Philosophical Transactions of the Royal Society B: Biological Sciences · doi:10.1098/rstb.2011.0417 · Cited by 747 · cited 1×
“DOI: 10.7554/eLife.12192.001”
InfluentialA general mechanism for perceptual decision-making in the human brain
Heekeren, H. R., Marrett, S., Bandettini, P. A., & Ungerleider, L. G. (2004) · Nature · doi:10.1038/nature02966 · Cited by 741
Calibration of Probabilities: The State of the Art
Lichtenstein, S., Fischhoff, B., & Phillips, L. (1977) · Springer eBooks · doi:10.1007/978-94-010-1276-8_19 · Cited by 736
Two-stage dynamic signal detection: A theory of choice, decision time, and confidence.
Pleskac, T. J., & Busemeyer, J. R. (2010) · Psychological Review · doi:10.1037/a0019737 · Cited by 722
Models for choice-reaction time
Stone, M. (1960) · Psychometrika · doi:10.1007/bf02289729 · Cited by 696
Decision Making as a Window on Cognition
Shadlen, M. N., & Kiani, R. (2013) · Neuron · doi:10.1016/j.neuron.2013.10.047 · Cited by 694
Self-citationChanges of mind in decision-making
Resulaj, A., Kiani, R., Wolpert, D. M., & Shadlen, M. N. (2009) · Nature · doi:10.1038/nature08275 · Cited by 678
Self-citationDecision-making with multiple alternatives
Churchland, A. K., Kiani, R., & Shadlen, M. N. (2008) · Nature Neuroscience · doi:10.1038/nn.2123 · Cited by 671
Self-citationSimultaneous over- and underconfidence: the role of error in judgment processes
Erev, I., Wallsten, T. S., & Budescu, D. V. (1994) · Psychological Review · doi:10.1037/0033-295x.101.3.519 · Cited by 644
A role for neural integrators in perceptual decision making
Mazurek, M. E., Roitman, J. D., Ditterich, J., & Shadlen, M. N. (2003) · Cerebral Cortex · doi:10.1093/cercor/bhg097 · Cited by 620
Self-citationRats and Humans Can Optimally Accumulate Evidence for Decision-Making
Brunton, B. W., Botvinick, M., & Brody, C. D. (2013) · Science · doi:10.1126/science.1233912 · Cited by 607
The Cost of Accumulating Evidence in Perceptual Decision Making
Drugowitsch, J., Moreno-Bote, R., Churchland, A. K., Shadlen, M. N., & Pouget, A. (2012) · The Journal of Neuroscience · doi:10.1523/jneurosci.4010-11.2012 · Cited by 577
Self-citationConfidence in value-based choice
De Martino, B., Fleming, S. M., Garrett, N., & Dolan, R. J. (2013) · Nature Neuroscience · doi:10.1038/nn.3279 · Cited by 534
Representation of a perceptual decision in developing oculomotor commands
Gold, J. I., & Shadlen, M. N. (2000) · Nature · doi:10.1038/35006062 · Cited by 515
Self-citationDecision Processes in Visual Perception
(1979) · Elsevier eBooks · doi:10.1016/c2013-0-11654-6 · Cited by 513
Distinct relationships of parietal and prefrontal cortices to evidence accumulation
Hanks, T. D., Kopec, C. D., Brunton, B. W., Duan, C. A., Erlich, J. C., & Brody, C. D. (2015) · Nature · doi:10.1038/nature14066 · Cited by 504
Kiani, R., Hanks, T. D., & Shadlen, M. N. (2008) · The Journal of Neuroscience · doi:10.1523/jneurosci.4761-07.2008 · Cited by 500
Self-citationChoice Certainty Is Informed by Both Evidence and Decision Time
Kiani, R., Corthell, L., & Shadlen, M. N. (2014) · Neuron · doi:10.1016/j.neuron.2014.12.015 · Cited by 470
Self-citationInternal and External Influences on the Rate of Sensory Evidence Accumulation in the Human Brain
Kelly, S. P., & O'Connell, R. G. (2013) · The Journal of Neuroscience · doi:10.1523/jneurosci.3355-13.2013 · Cited by 455 · cited 1×
“…1998) explains the tradeoff between speed and accuracy, and many of the essential steps have correlates in neurophysiology (Romo et al., 2002; Heekeren et al., 2004; Ploran et al., 2007; Heitz and Schall, 2012; White et al., 2012; Kelly and O’Connell, 2013; Hanks et al., 2014; Hanks et al., 2015).”
BackgroundGalvin, S. J., Podd, J. V., Drga, V., & Whitmore, J. (2003) · Psychonomic Bulletin & Review · doi:10.3758/bf03196546 · Cited by 405
Neural Mechanisms of Speed-Accuracy Tradeoff
Heitz, R. P., & Schall, J. D. (2012) · Neuron · doi:10.1016/j.neuron.2012.08.030 · Cited by 387
Elapsed Decision Time Affects the Weighting of Prior Probability in a Perceptual Decision Task
Hanks, T. D., Mazurek, M. E., Kiani, R., Hopp, E., & Shadlen, M. N. (2011) · The Journal of Neuroscience · doi:10.1523/jneurosci.5613-10.2011 · Cited by 378
Self-citationThe calibration and resolution of confidence in perceptual judgments
Baranski, J. V., & Petrusic, W. M. (1994) · Perception & Psychophysics · doi:10.3758/bf03205299 · Cited by 308
A computational framework for the study of confidence in humans and animals
Kepecs, A., & Mainen, Z. F. (2012) · Philosophical Transactions of the Royal Society B: Biological Sciences · doi:10.1098/rstb.2012.0037 · Cited by 305
The construction of confidence in a perceptual decision
Zylberberg, A., Barttfeld, P., & Sigman, M. (2012) · Frontiers in Integrative Neuroscience · doi:10.3389/fnint.2012.00079 · Cited by 297
Self-citationConfidence and accuracy of near-threshold discrimination responses
Kunimoto, C., Miller, J., & Pashler, H. (2001) · Consciousness and Cognition · doi:10.1006/ccog.2000.0494 · Cited by 291
Ploran, E. J., Nelson, S. M., Velanova, K., Donaldson, D. I., Petersen, S. E., & Wheeler, M. E. (2007) · The Journal of Neuroscience · doi:10.1523/jneurosci.3522-07.2007 · Cited by 282
Decision making by urgency gating: theory and experimental support
Thura, D., Beauregard-Racine, J., Fradet, C.-W., & Cisek, P. (2012) · Journal of Neurophysiology · doi:10.1152/jn.01071.2011 · Cited by 279
The relative judgment theory of two choice response time
Link, S. W. (1975) · Journal of Mathematical Psychology · doi:10.1016/0022-2496(75)90053-x · Cited by 251
Concurrent processing of saccades in visual search
McPeek, R. M., Skavenski, A. A., & Nakayama, K. (2000) · Vision Research · doi:10.1016/s0042-6989(00)00102-4 · Cited by 234
A neural mechanism of speed-accuracy tradeoff in macaque area LIP
Hanks, T., Kiani, R., & Shadlen, M. N. (2014) · eLife · doi:10.7554/elife.02260 · Cited by 222
Self-citationError Correction Time without External Error Signals
RABBITT, P. M. A. (1966) · Nature · doi:10.1038/212438a0 · Cited by 213
Deliberation in the Motor System: Reflex Gains Track Evolving Evidence Leading to a Decision
Selen, L. P. J., Shadlen, M. N., & Wolpert, D. M. (2012) · Journal of Neuroscience · doi:10.1523/jneurosci.5273-11.2012 · Cited by 212
Self-citationA modular planar robotic manipulandum with end-point torque control
Howard, I. S., Ingram, J. N., & Wolpert, D. M. (2009) · Journal of Neuroscience Methods · doi:10.1016/j.jneumeth.2009.05.005 · Cited by 211
Self-citationMoran, R., Teodorescu, A. R., & Usher, M. (2015) · Cognitive Psychology · doi:10.1016/j.cogpsych.2015.01.002 · Cited by 201
Effects of cortical microstimulation on confidence in a perceptual decision
Fetsch, C. R., Kiani, R., Newsome, W. T., & Shadlen, M. N. (2014) · Neuron · doi:10.1016/j.neuron.2014.07.011 · Cited by 185
Self-citationGood, I. J. (1979) · Biometrika · doi:10.1093/biomet/66.2.393 · Cited by 184
Two Types of ROC Curves and Definitions of Parameters
Clarke, F. R., Birdsall, T. G., & Tanner, W. P. (1959) · The Journal of the Acoustical Society of America · doi:10.1121/1.1907764 · Cited by 183
Individual consistency in the accuracy and distribution of confidence judgments
Ais, J., Zylberberg, A., Barttfeld, P., & Sigman, M. (2016) · Cognition · doi:10.1016/j.cognition.2015.10.006 · Cited by 174
Self-citationRatcliff, R., & Starns, J. J. (2013) · Psychological Review · doi:10.1037/a0033152 · Cited by 173
Kiani, R., Cueva, C. J., Reppas, J. B., & Newsome, W. T. (2014) · Current Biology · doi:10.1016/j.cub.2014.05.049 · Cited by 160
Self-citationMotor effort alters changes of mind in sensorimotor decision making
Burk, D., Ingram, J. N., Franklin, D. W., Shadlen, M. N., & Wolpert, D. M. (2014) · PLoS ONE · doi:10.1371/journal.pone.0092681 · Cited by 117
Self-citationThe time course of visual information accrual guiding eye movement decisions
Caspi, A., Beutter, B. R., & Eckstein, M. P. (2004) · Proceedings of the National Academy of Sciences · doi:10.1073/pnas.0305329101 · Cited by 116
Calibration of Probabilities: The State of the Art to 1980
Lichtenstein, S., Fischhoff, B., & Phillips, L. D. (1981) · doi:10.21236/ada101986 · Cited by 106
Dynamics of postdecisional processing of confidence.
Yu, S., Pleskac, T. J., & Zeigenfuse, M. D. (2015) · Journal of Experimental Psychology General · doi:10.1037/xge0000062 · Cited by 103
Processing a Display Even after you Make a Response to it. How Perceptual Errors can be Corrected
Rabbitt, P., & Vyas, S. (1981) · The Quarterly Journal of Experimental Psychology Section A · doi:10.1080/14640748108400790 · Cited by 97
Moreno‐Bote, R. (2010) · Neural Computation · doi:10.1162/neco.2010.12-08-930 · Cited by 92
Relation between belief and performance in perceptual decision making
Drugowitsch, J., Moreno-Bote, R., & Pouget, A. (2014) · PLoS ONE · doi:10.1371/journal.pone.0096511 · Cited by 72
Perceptual Criteria in the Human Brain
White, C. N., Mumford, J. A., & Poldrack, R. A. (2012) · Journal of Neuroscience · doi:10.1523/jneurosci.1744-12.2012 · Cited by 63
Response Reversals in Recognition Memory.
Zandt, T. V., & Maldonado‐Molina, M. M. (2004) · Journal of Experimental Psychology Learning Memory and Cognition · doi:10.1037/0278-7393.30.6.1147 · Cited by 62
Exploring the cortical evidence of a sensory-discrimination process
Romo, R., Hernández, A., Zainos, A., Brody, C., & Salinas, E. (2002) · Philosophical Transactions of the Royal Society of London. Series B: Biological Sciences · doi:10.1098/rstb.2002.1100 · Cited by 58
Perceptual decision processes flexibly adapt to avoid change-of-mind motor costs
Moher, J., & Song, J. (2014) · Journal of Vision · doi:10.1167/14.8.1 · Cited by 57
Confidence estimation as a stochastic process in a neurodynamical system of decision making
Wei, Z., & Wang, X. (2015) · Journal of Neurophysiology · doi:10.1152/jn.00793.2014 · Cited by 32
Concurrent processing of saccades
McPeek, R. M., Keller, E. L., & Nakayama, K. (1999) · Behavioral and Brain Sciences · doi:10.1017/s0140525x99402158 · Cited by 12
Research works printed but not linked: 1
- Wald, 1947, Sequential Analysis
Cited by
Sorted by citations
Self-Evaluation of Decision-Making: A General Bayesian Framework for Metacognitive Computation
Fleming, S. M., & Daw, N. D. (2017) · Psychological Review · doi:10.1037/rev0000045 · Cited by 584
Rouault, M., Seow, T. X. F., Gillan, C. M., & Fleming, S. M. (2018) · Biological Psychiatry · doi:10.1016/j.biopsych.2017.12.017 · Cited by 349
Decision-making in sensorimotor control
Gallivan, J. P., Chapman, C. S., Wolpert, D. M., & Flanagan, J. R. (2018) · Nature reviews. Neuroscience · doi:10.1038/s41583-018-0045-9 · Cited by 332
Self-citationSubjective Confidence Predicts Information Seeking in Decision Making
Desender, K., Boldt, A., & Yeung, N. (2018) · Psychological Science · doi:10.1177/0956797617744771 · Cited by 296
Metacognition and Confidence: A Review and Synthesis
Fleming, S. M. (2024) · Annual Review of Psychology · doi:10.1146/annurev-psych-022423-032425 · Cited by 256
“Pleskac & Busemeyer (2010) additionally proposed that this evidence accumulation process may continue after a decision has been made, to inform estimates of decision confidence and potentially leading to changes of mind (van den Berg et al., 2016a, Resulaj et al., 2009).”
Metadata
- Authors
- van den Berg, R., Anandalingam, K., Zylberberg, A., Kiani, R., Shadlen, M. N., & Wolpert, D. M.
- Affiliations
- Computational and Biological Learning Laboratory, Department of Engineering, Cambridge University, Cambridge, United Kingdom
- University of Cambridge (GB)
- Howard Hughes Medical Institute (US)
- New York University (US)
- Corresponding author
- Wolpert, Daniel M
- Venue
- eLife
- Publisher
- eLife Sciences Publications, Ltd
- Published
- 2016-02-01
- Volume
- 5
- Pages
- e12192-e12192
- ISSN
- 2050-084X (ISSN-L)
- PMC
- PMC4798971
- OpenAlex
- W2261997804
- Semantic Scholar
- 8a3457c13959cfb9435daf0710bf5eac7eacbc9b
- Cited by
- 270
- References
- 67
- Citations by year
- 2026: 19 · 2025: 20 · 2024: 23 · 2023: 38 · 2022: 24 · 2021: 26 · 2020: 32 · 2019: 26 · 2018: 31 · 2017: 16 · 2016: 14
- FWCI
- 25.07
- Type
- journal article
- Language
- en
- Open access
- gold
- doi.org
- Licence
- Locations
- eLife (publishedVersion, cc-by)
- Europe PMC (PubMed Central) (publishedVersion, cc-by)
- PubMed Central (publishedVersion, cc-by)
- PubMed (publishedVersion)
- KTH Publication Database DiVA (KTH Royal Institute of Technology) (submittedVersion, other-oa)
- DOAJ (DOAJ: Directory of Open Access Journals) (submittedVersion, cc-by-sa)
- Cambridge University Engineering Department Publications Database (submittedVersion)
- Funders
- Wellcome Trust
- Howard Hughes Medical Institute
- Royal Society
- Human Frontier Science Program
- National Eye Institute
- Simons Foundation
- Alfred P. Sloan Foundation
- Topics
- Social Sciences › Decision Sciences › General Decision Sciences › Decision-Making and Behavioral Economics
- Life Sciences › Neuroscience › Cognitive Neuroscience › Neural and Behavioral Psychology Studies
- Life Sciences › Neuroscience › Cognitive Neuroscience › Visual perception and processing mechanisms
- Keywords
- decision confidence, sequential sampling, vacillation, change of mind, perceptual decision making, motion direction discrimination, reaction time, processing delay
- MeSH terms
- Choice Behavior, Decision Making, Humans, Models, Neurological, Reaction Time, Healthy Volunteers
About these checks
Registry, retraction, Cites and statistics results are computed, not judged, with one exception: a printed reference that no index lists is read once by a model before it counts as a citation error. Claims are extracted by a model and kept only when their quote appears verbatim in the text; each cited source is then checked, with a model’s help, for whether it says what the claim relies on. Those verdicts can be wrong — read the claim’s quote and the cited source before relying on one.
A language model drew the claims from the paper on 2026-10-09, under version 3 of the claim definition (model deepseek-v4.1-flash, prompt extract-v3).
A second model labelled each claim on 2026-10-09 (model jev-1.13-20260917, definition revision gold-guideline-v0.2).
Statistics and arithmetic are recomputed, not judged.
Confidence bands are shown only for fields calibrated on our annotated test set. None is calibrated yet, so no band is shown.
What counts as a claim ›How we measure confidence ›How we check this ›
Are you an author, or do you see a problem with this page? Request a review
