

The DOI matches its Crossref record; 95 of the 97 references it cites were found in a registry or an index; none of the 66 sources its claims cite is checked for support yet.
Single-cell transcriptomes and whole-brain projections of serotonin neurons in the mouse dorsal and median raphe nuclei
Open accessPublished version of a preprint
Abstract
Serotonin neurons of the dorsal and median raphe nuclei (DR, MR) collectively innervate the entire forebrain and midbrain, modulating diverse physiology and behavior. To gain a fundamental understanding of their molecular heterogeneity, we used plate-based single-cell RNA-sequencing to generate a comprehensive dataset comprising eleven transcriptomically distinct serotonin neuron clusters. Systematic in situ hybridization mapped specific clusters to the principal DR, caudal DR, or MR. These transcriptomic clusters differentially express a rich repertoire of neuropeptides, receptors, ion channels, and transcription factors. We generated novel intersectional viral-genetic tools to access specific subpopulations. Whole-brain axonal projection mapping revealed that DR serotonin neurons co-expressing vesicular glutamate transporter-3 preferentially innervate the cortex, whereas those co-expressing thyrotropin-releasing hormone innervate subcortical regions in particular the hypothalamus. Reconstruction of 50 individual DR serotonin neurons revealed diverse and segregated axonal projection patterns at the single-cell level. Together, these results provide a molecular foundation of the heterogenous serotonin neuronal phenotypes.
Overview
AI snapshot
Written from the paper’s full text.
TL;DR
Plate-based single-cell RNA-sequencing of 999 mouse dorsal and median raphe serotonin neurons identified 11 transcriptomic clusters with distinct spatial, molecular, and projection features. Intersectional viral tracing and single-neuron reconstruction showed that Vglut3+ and Trh+ DR serotonin neurons preferentially innervate cortical versus subcortical targets, while individual DR serotonin neurons have highly diverse whole-brain arborization patterns.
Key findings
- scRNA-seq of 999 Tph2+ serotonin neurons from 14 adult mouse brains resolved 11 transcriptomic clusters: six principal DR clusters (DR-1–6), one caudal DR cluster (cDR), and four median raphe clusters (MR-1–4); HCR-smFISH with 16 markers mapped these clusters to pDR, cDR, or MR locations.
- Co-transmitter and neuropeptide expression was heterogeneous: 65% of serotonin neurons expressed Vglut3, 35% expressed Gad1, Gad2, or both, 13% expressed Vglut3 plus Gad1/Gad2, and 14% expressed none of these glutamate/GABA markers; Trh was expressed in 14% and Crh in 7% of serotonin neurons.
- Intersectional Sert-Flp with Vglut3-Cre or Trh-Cre showed that Vglut3+ pDR serotonin neurons preferentially innervate cortical regions, whereas Trh+ pDR serotonin neurons innervate subcortical regions including anterior/medial hypothalamus and thalamic nuclei; whole-brain mapping used n = 3 mice per genotype.
- Reconstruction of 50 individual DR serotonin neurons revealed total axon lengths from 1.9 cm to 26.3 cm, with cortex-projecting neurons having the longest axons; 37/50 projections were unilateral, and 34/46 forebrain-projecting neurons had >80% of forebrain axon length in either cortical or subcortical regions.
Methods
- Serotonin neurons were labeled using Sert-Cre;Ai14 mice, acutely dissociated from brain slices of postnatal day 40–45 mice (six females, eight males), FACS-sorted, and processed with Smart-seq2; 709 cells came from eight MR/pDR/cDR samples and 290 cells from six pDR-only samples, yielding 999 cells after QC.
- Clustering used Seurat v3.0 with PCA and Louvain clustering; HCR-based smFISH against 16 cluster markers plus Tph2 was used to map transcriptomic clusters anatomically.
- For projection mapping, Sert-Flp mice were crossed with Vglut3-Cre or Trh-Cre and injected with AAV-CreON/FlpON-mGFP; brains were cleared with AdipoClear, imaged by light-sheet microscopy, segmented with a 3D U-Net, and aligned to the Allen Common Coordinate Framework. Single-neuron reconstructions used dual-AAV sparse labeling and fMOST in 14 Sert-Cre mice.
Limitations
- Stated: single-neuron reconstruction was limited in scope to 50 reconstructed cells out of approximately 9000 DR serotonin neurons, and larger-scale reconstruction integrated with molecular identity and function is needed.
- Stated: whole-brain tracing showed inter-individual variability in total labeled axons and detailed projection patterns, and heterogeneity within Vglut3+ or Trh+ populations may contribute; larger experiments or single-cluster Cre lines are required.
- Stated/evident: the Sert-Flp line can drive reporter expression outside raphe serotonin neurons due to transient developmental Sert expression; the paper also notes that whether Gad1/Gad2+ serotonin neurons actually release GABA remains to be determined, and MR cluster anatomical organization was less obvious with clusters more intermingled.
Model-written summary. Check it against the paper before relying on it.
Integrity signals
Registry
Cites
Statistics
Figures
Verification
Claims the paper makes
110 Own result · 55 Not checked yet · 27 Own interpretation · 9 Own method · 3 No basis given
A result the paper reports from its own data — it cites no other source for it, so there is none to check. The quote shows it is in the paper.
In the paper
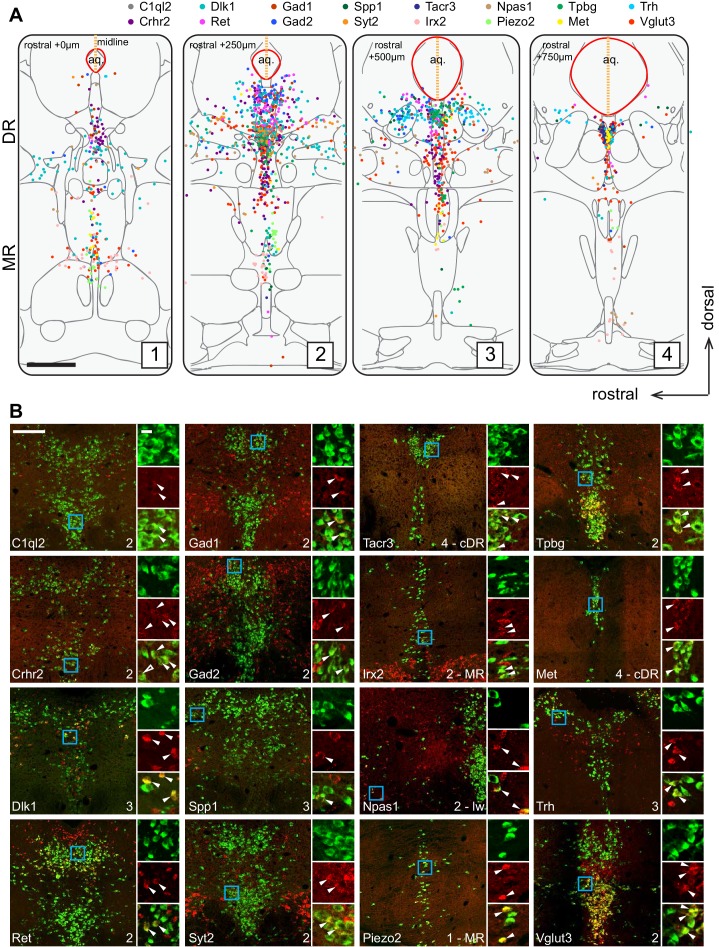
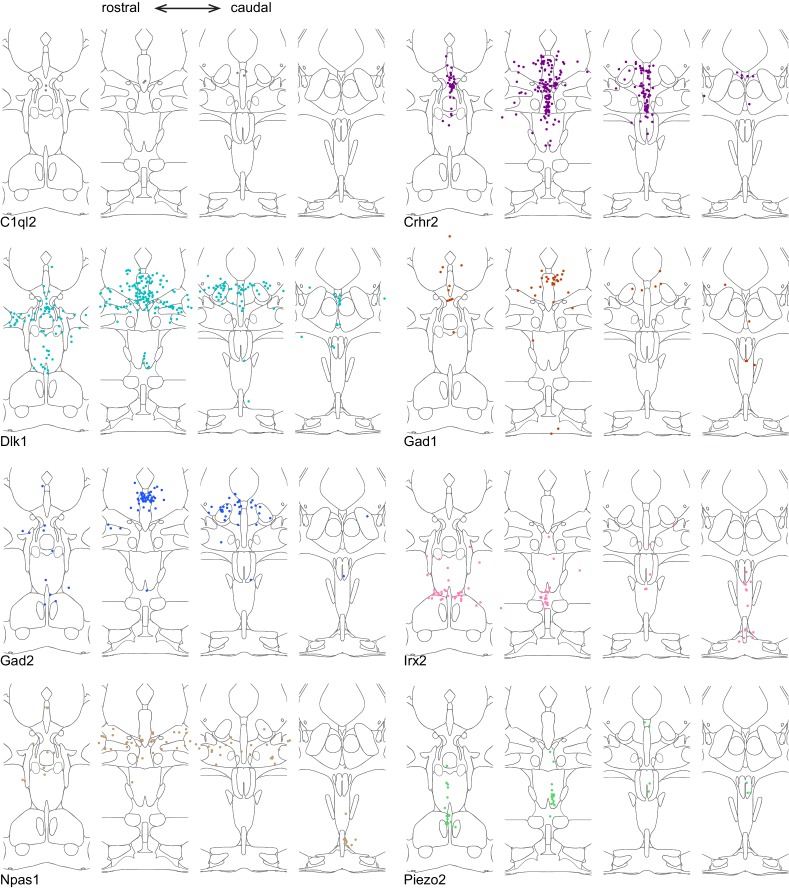
“Specifically, we found that the distribution of markers for Clusters 1–6, Ret, Trh, Gad1, Npas1, Syt2, and C1ql2 (Figure 1D), were mostly restricted to the pDR.”
§ Single-cell transcriptomes and whole-brain projections of serotonin neurons in the mouse dorsal and median raphe nuclei > Results > Anatomical organization of transcriptomically defined serotonin clusters
plaincorrelational- Asserted: passes — The authors put it forward as true.
- Checkable: passes — It can be checked against evidence.
- Load-bearing: passes — The paper’s conclusions depend on it.
- Based: passes — The paper gives a reason why it holds.
A result the paper reports from its own data — it cites no other source for it, so there is none to check. The quote shows it is in the paper.
In the paper
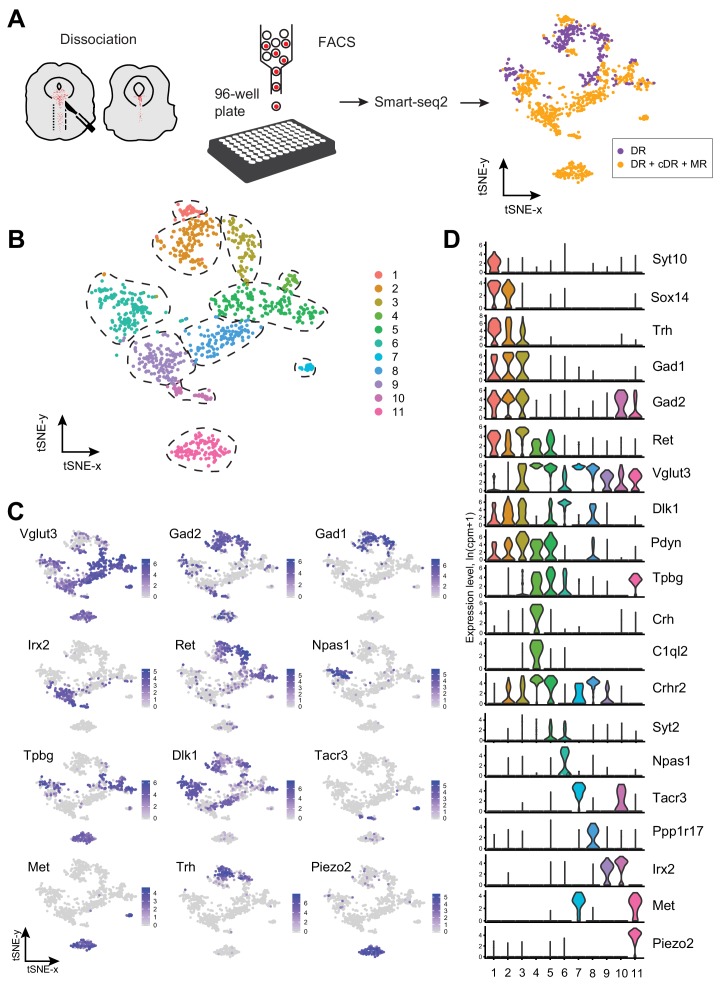
“These 999 MR and DR serotonin neurons comprised 11 clusters (Figure 1B; Figure 1—figure supplement 2).”
- Also stated in: § Abstract · plain
“we used plate-based single-cell RNA-sequencing to generate a comprehensive dataset comprising eleven transcriptomically distinct serotonin neuron clusters.”
§ Single-cell transcriptomes and whole-brain projections of serotonin neurons in the mouse dorsal and median raphe nuclei > Results > Single-cell RNA-sequencing defines 11 transcriptomic clusters of serotonin neurons in the dorsal and median raphe
plain- Asserted: passes — The authors put it forward as true.
- Checkable: passes — It can be checked against evidence.
- Load-bearing: passes — The paper’s conclusions depend on it.
- Based: passes — The paper gives a reason why it holds.
- Also stated in: § Abstract · plain
A result the paper reports from its own data — it cites no other source for it, so there is none to check. The quote shows it is in the paper.
In the paper
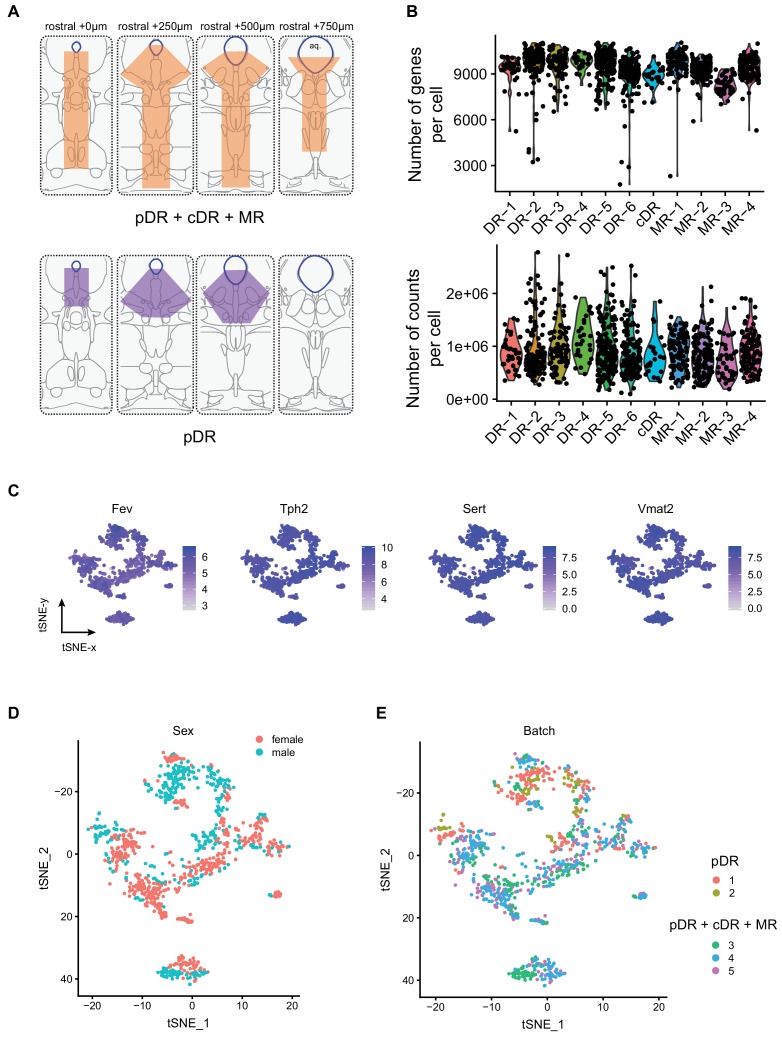
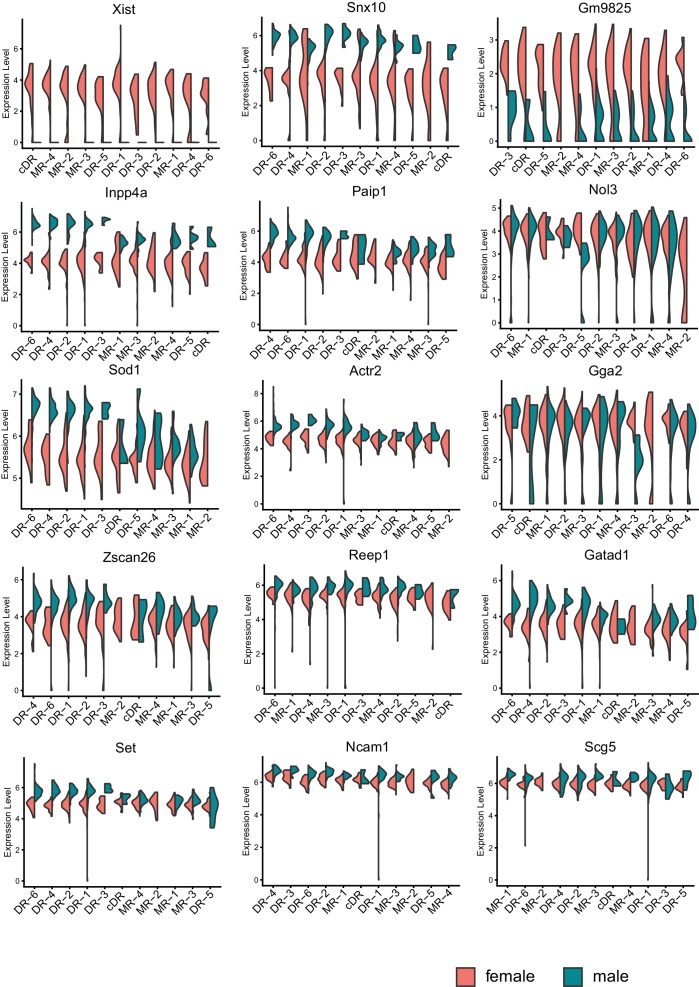
“Each cluster contained cells from both sexes after removing genes located on the Y chromosome, indicating that there were few sex-specific differences at the level of transcriptomic clusters (Figure 1—figure supplement 1D).”
§ Single-cell transcriptomes and whole-brain projections of serotonin neurons in the mouse dorsal and median raphe nuclei > Results > Single-cell RNA-sequencing defines 11 transcriptomic clusters of serotonin neurons in the dorsal and median raphe
hedged- Asserted: passes — The authors put it forward as true.
- Checkable: passes — It can be checked against evidence.
- Load-bearing: unclear — It is unclear whether the paper’s conclusions depend on it.
- Based: passes — The paper gives a reason why it holds.
A result the paper reports from its own data — it cites no other source for it, so there is none to check. The quote shows it is in the paper.
In the paper
“Of the 11 transcriptomic clusters, six (Cluster 1–6) consisted of only serotonin neurons dissected from the pDR.”
§ Single-cell transcriptomes and whole-brain projections of serotonin neurons in the mouse dorsal and median raphe nuclei > Results > Anatomical organization of transcriptomically defined serotonin clusters
plain- Asserted: passes — The authors put it forward as true.
- Checkable: passes — It can be checked against evidence.
- Load-bearing: passes — The paper’s conclusions depend on it.
- Based: passes — The paper gives a reason why it holds.
A result the paper reports from its own data — it cites no other source for it, so there is none to check. The quote shows it is in the paper.
In the paper
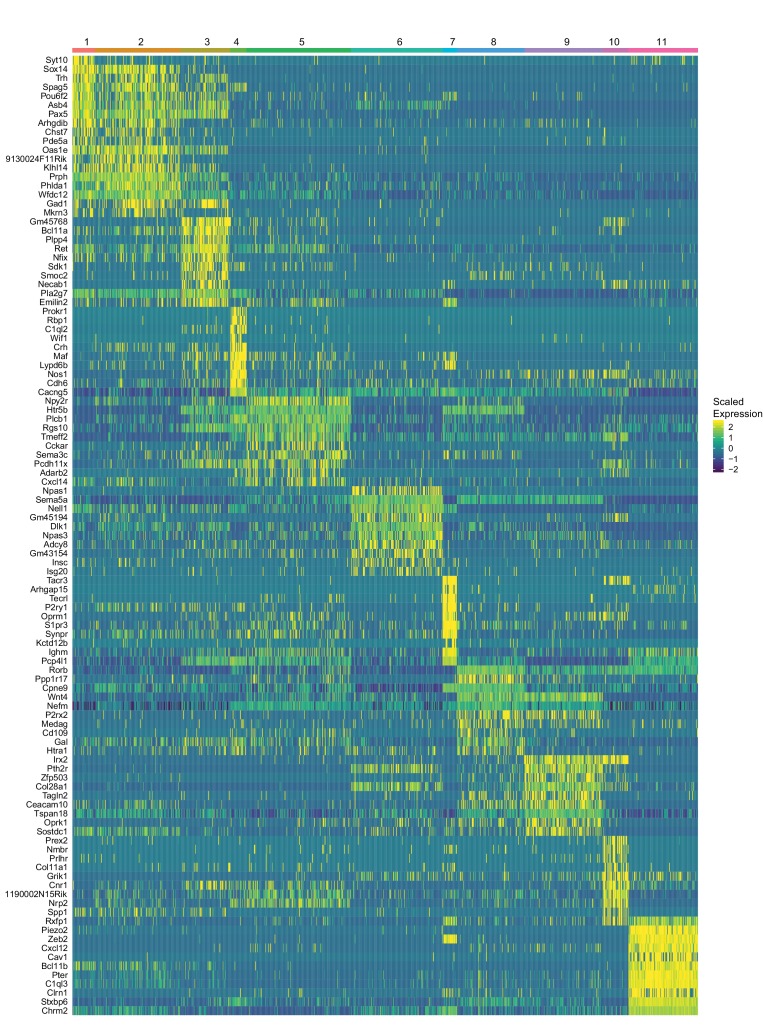
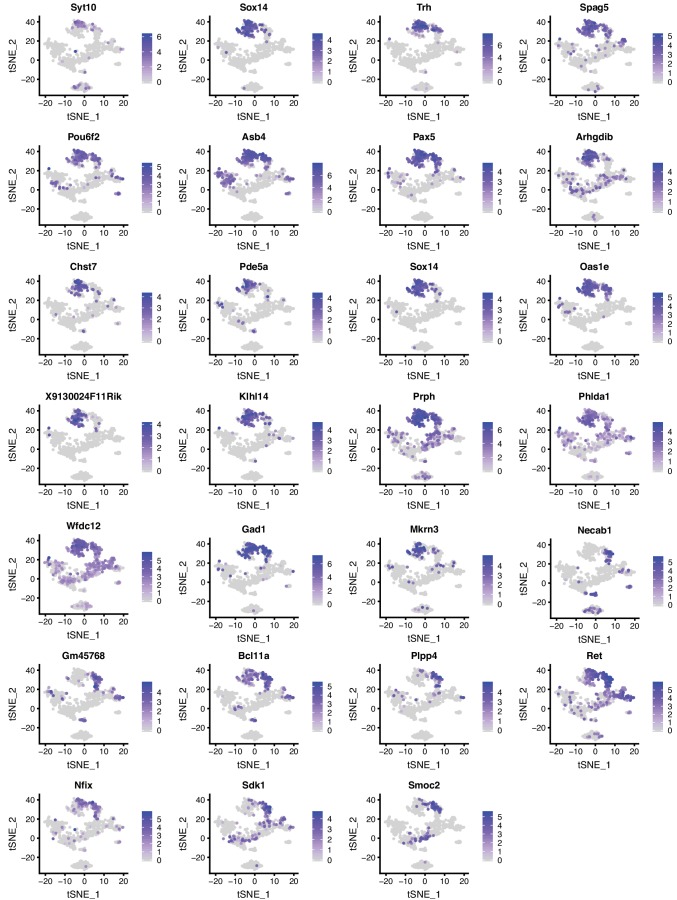
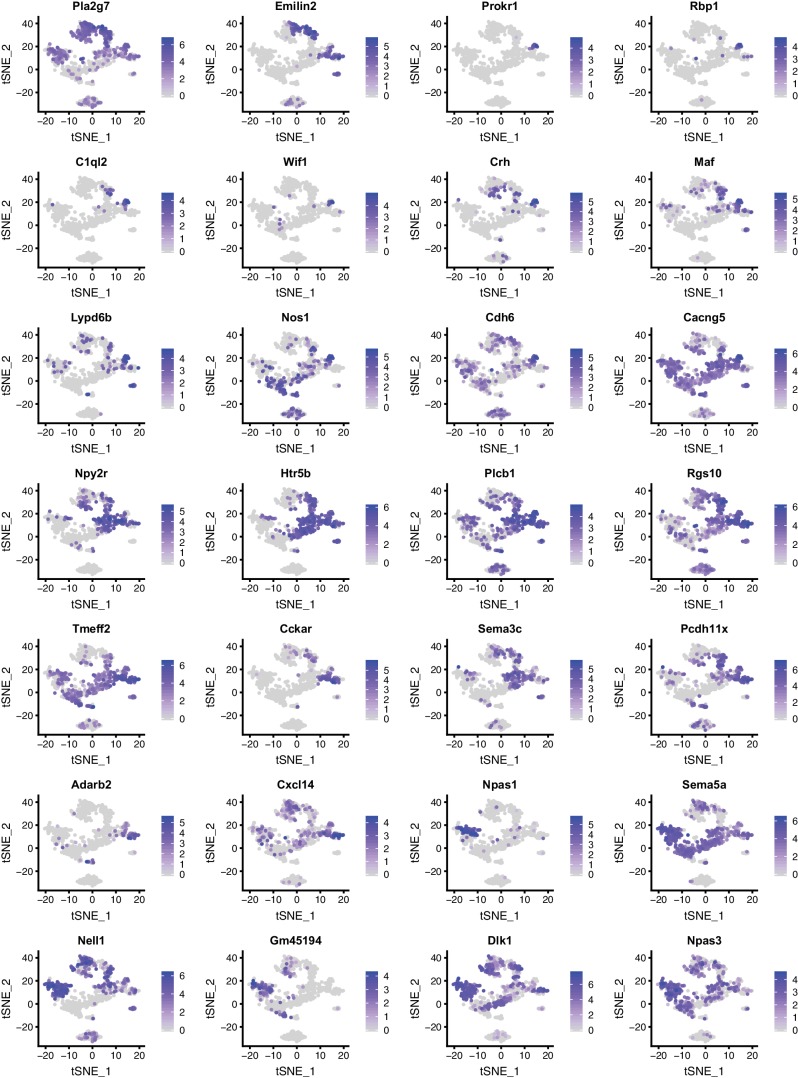
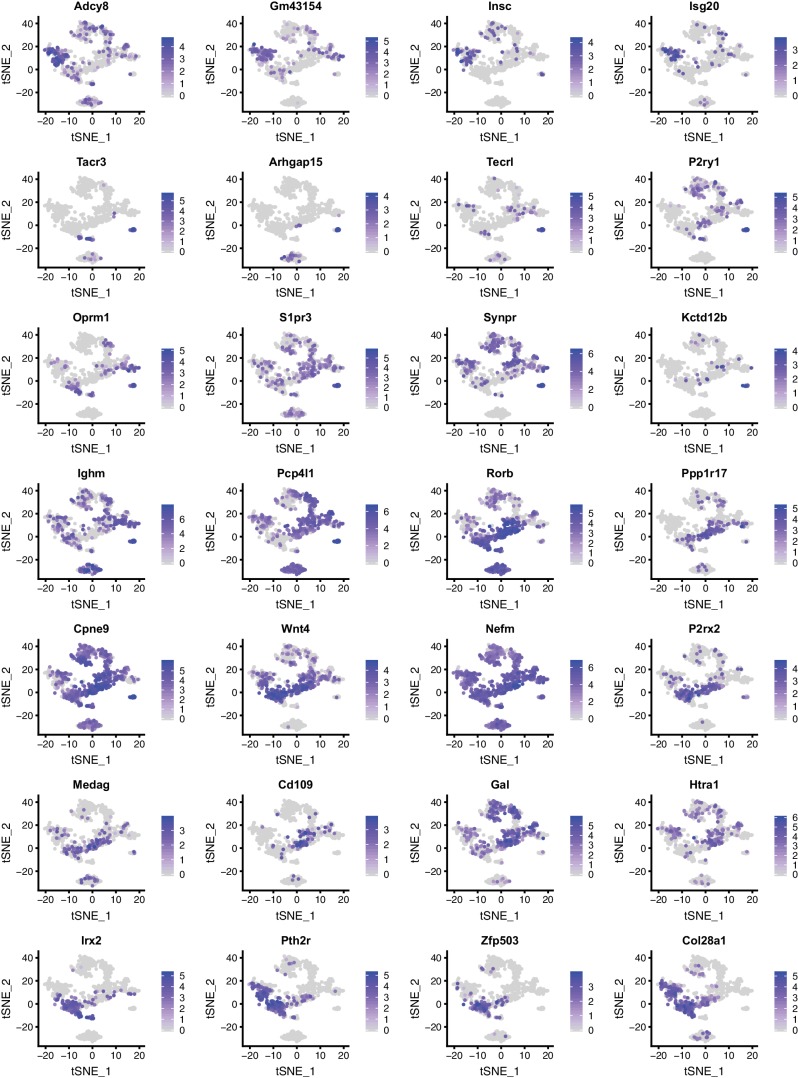
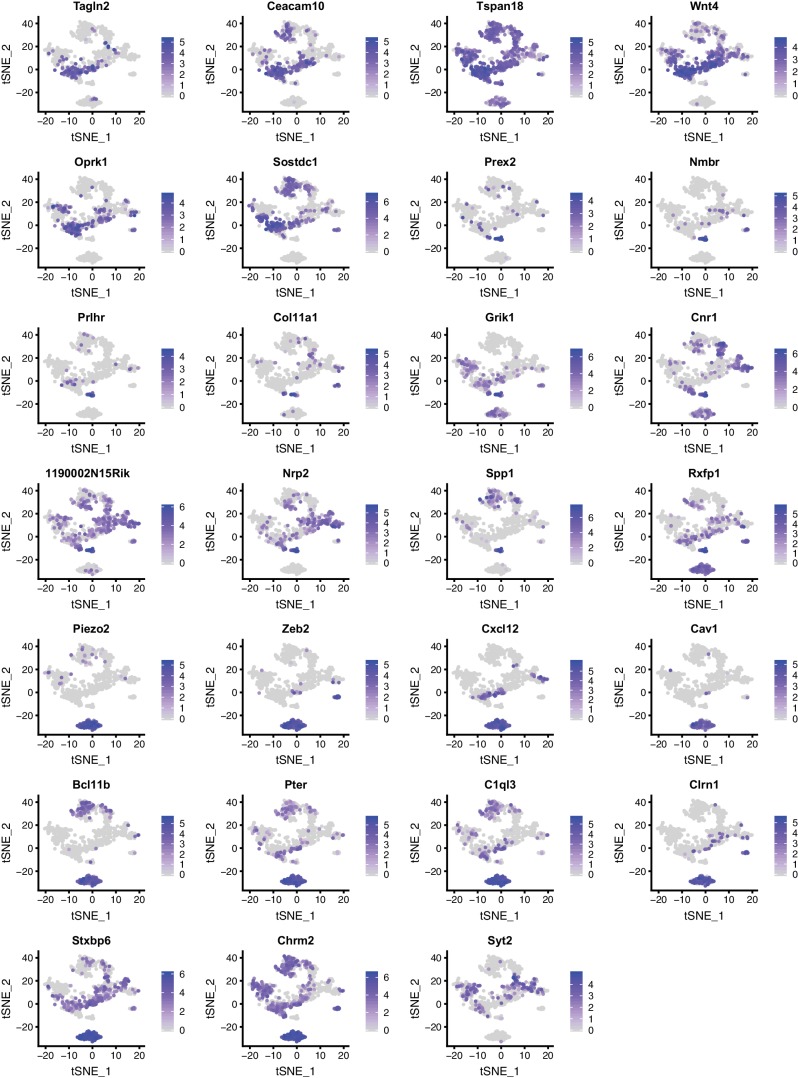
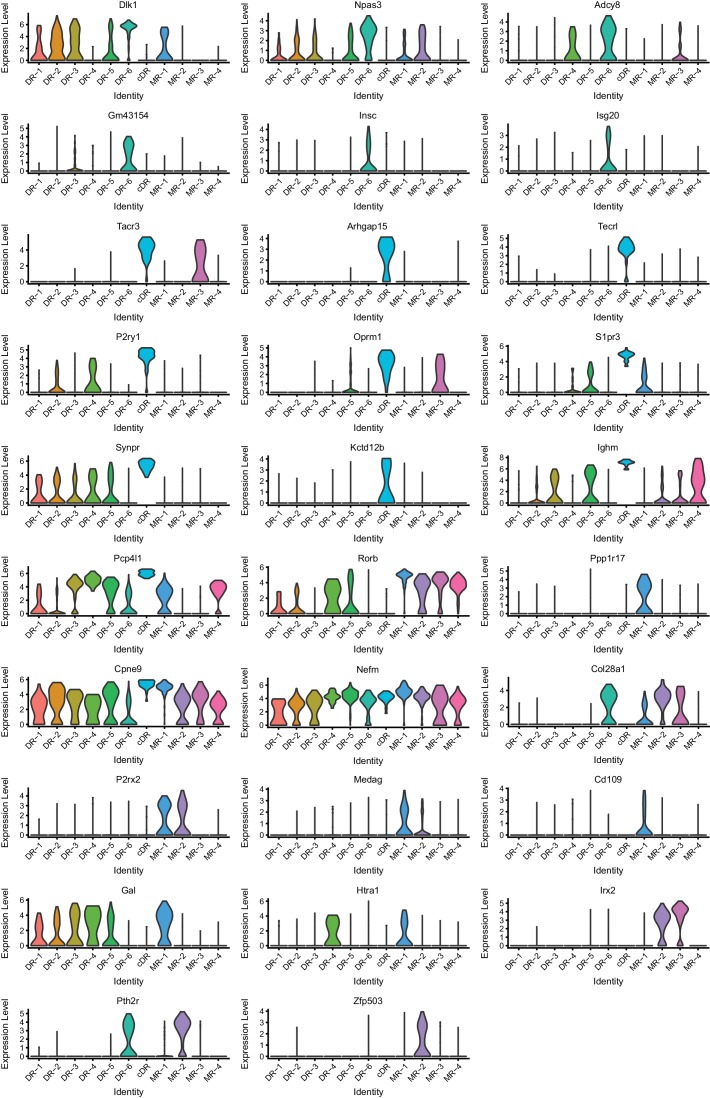
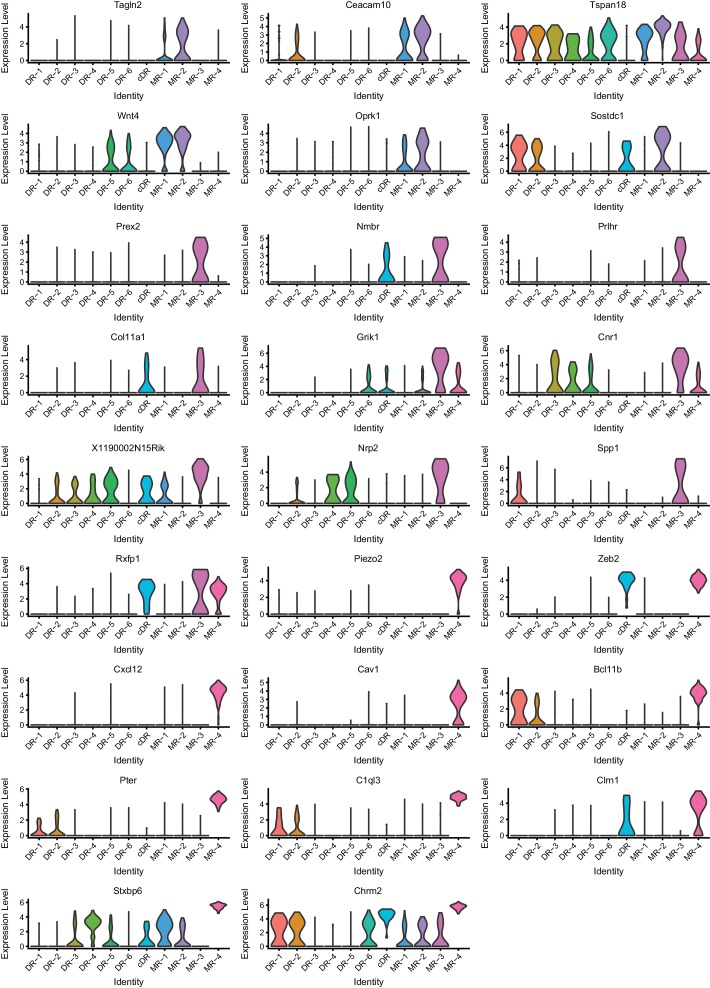
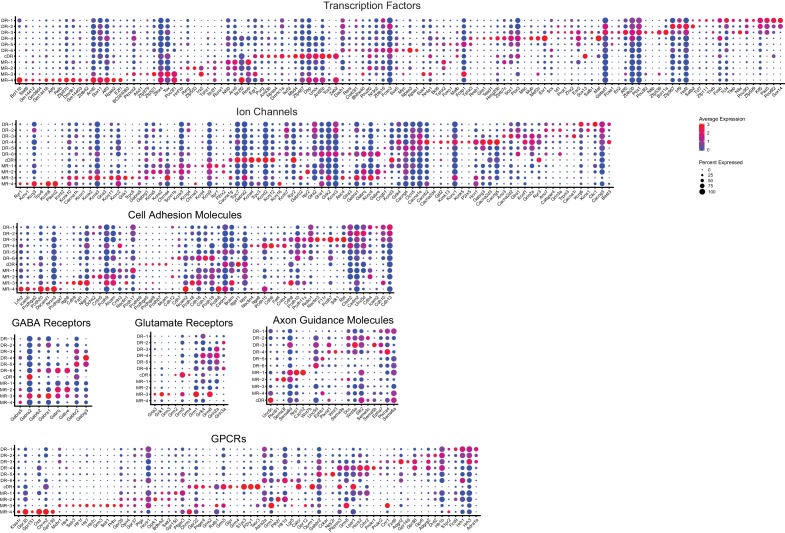
“Each of the 11 clusters expressed a set of cluster-discriminatory genes, including markers for specific neurotransmitter systems, such as Vglut3, Gad1, and Gad2 (Figure 1C,D; Figure 1—figure supplement 1–6).”
§ Single-cell transcriptomes and whole-brain projections of serotonin neurons in the mouse dorsal and median raphe nuclei > Results > Single-cell RNA-sequencing defines 11 transcriptomic clusters of serotonin neurons in the dorsal and median raphe
plain- Asserted: passes — The authors put it forward as true.
- Checkable: passes — It can be checked against evidence.
- Load-bearing: passes — The paper’s conclusions depend on it.
- Based: passes — The paper gives a reason why it holds.
A result the paper reports from its own data — it cites no other source for it, so there is none to check. The quote shows it is in the paper.
In the paper
“After quality control (Materials and methods), we determined the transcriptomes of 709 cells from eight samples that include MR, pDR, and cDR, and 290 cells from six pDR-only samples (999 cells in total, comprising 581 cells from female and 418 cells from male mice).”
§ Single-cell transcriptomes and whole-brain projections of serotonin neurons in the mouse dorsal and median raphe nuclei > Results > Single-cell RNA-sequencing defines 11 transcriptomic clusters of serotonin neurons in the dorsal and median raphe
plainn = 14- Asserted: passes — The authors put it forward as true.
- Checkable: passes — It can be checked against evidence.
- Load-bearing: passes — The paper’s conclusions depend on it.
- Based: passes — The paper gives a reason why it holds.
None of the sources cited for this claim have been checked yet.
In the paper
“Dopamine receptor D2 (Drd2) is highly expressed in DR-3 (Niederkofler et al., 2016).”
§ Single-cell transcriptomes and whole-brain projections of serotonin neurons in the mouse dorsal and median raphe nuclei > Results > Molecular properties of MR and DR serotonin neurons
plaincorrelational- Asserted: passes — The authors put it forward as true.
- Checkable: passes — It can be checked against evidence.
- Load-bearing: unclear — It is unclear whether the paper’s conclusions depend on it.
- Based: passes — The paper gives a reason why it holds.
A result the paper reports from its own data — it cites no other source for it, so there is none to check. The quote shows it is in the paper.
In the paper
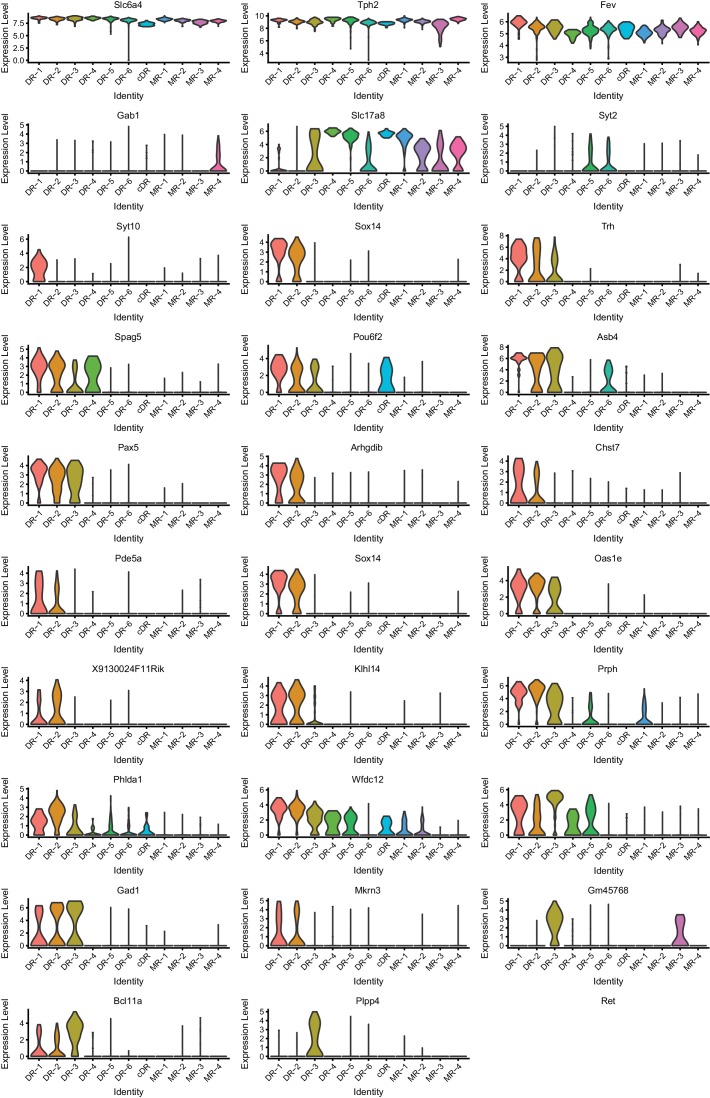
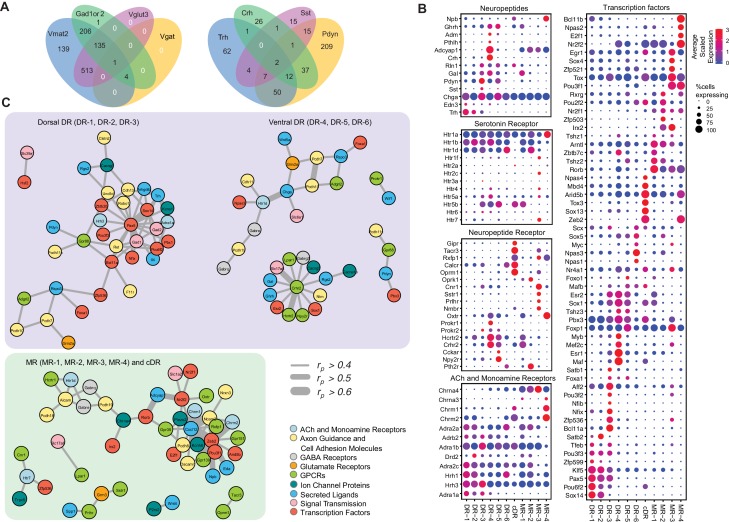
“Within our data, we observed robust cluster-specific expression of multiple TF genes (Figure 4B; Figure 4—figure supplement 1; Figure 3—figure supplement 1–3).”
§ Single-cell transcriptomes and whole-brain projections of serotonin neurons in the mouse dorsal and median raphe nuclei > Results > Molecular properties of MR and DR serotonin neurons
plaincorrelational- Asserted: passes — The authors put it forward as true.
- Checkable: passes — It can be checked against evidence.
- Load-bearing: passes — The paper’s conclusions depend on it.
- Based: passes — The paper gives a reason why it holds.
A result the paper reports from its own data — it cites no other source for it, so there is none to check. The quote shows it is in the paper.
In the paper
“Clusters MR-4 and cDR have the highest expression level of expression for Chrm1 and Chrm2, encoding muscarinic acetylcholine receptors.”
§ Single-cell transcriptomes and whole-brain projections of serotonin neurons in the mouse dorsal and median raphe nuclei > Results > Molecular properties of MR and DR serotonin neurons
plaincorrelational- Asserted: passes — The authors put it forward as true.
- Checkable: passes — It can be checked against evidence.
- Load-bearing: unclear — It is unclear whether the paper’s conclusions depend on it.
- Based: passes — The paper gives a reason why it holds.
A result the paper reports from its own data — it cites no other source for it, so there is none to check. The quote shows it is in the paper.
In the paper
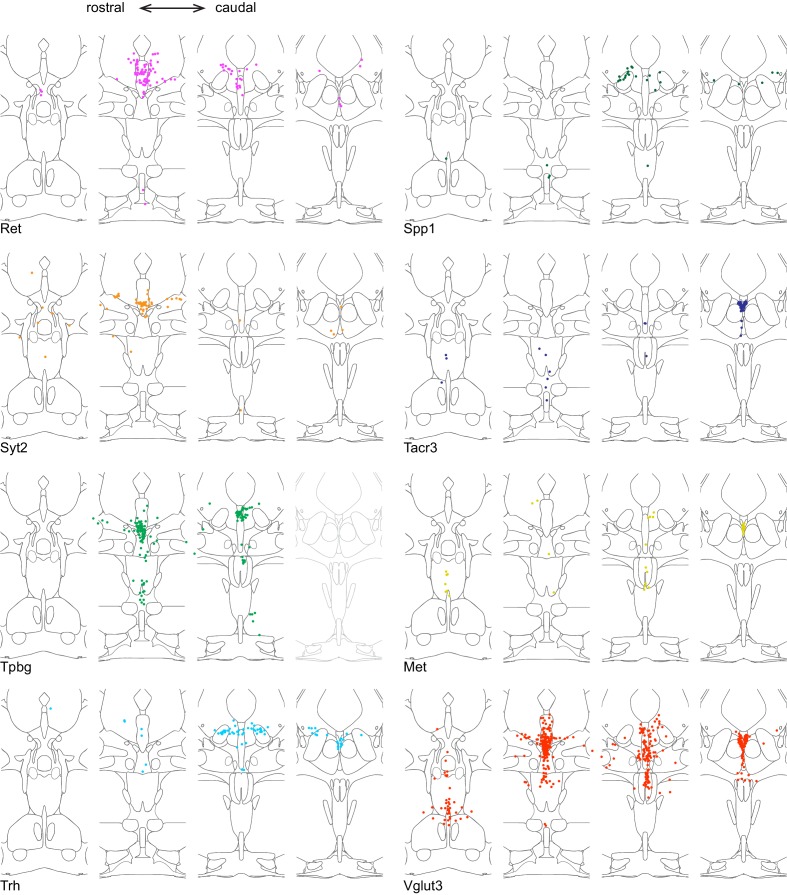
“The two common Cluster 7 markers Tacr3 and Met were both highly concentrated in serotonin neurons under the aqueduct in the cDR.”
§ Single-cell transcriptomes and whole-brain projections of serotonin neurons in the mouse dorsal and median raphe nuclei > Results > Anatomical organization of transcriptomically defined serotonin clusters
plaincorrelational- Asserted: passes — The authors put it forward as true.
- Checkable: passes — It can be checked against evidence.
- Load-bearing: passes — The paper’s conclusions depend on it.
- Based: passes — The paper gives a reason why it holds.
- It may state two separate claims as one. 66
- The quote only partly states this claim. 1
- Probably not a substantial claim. 16
A result the paper reports from its own data — it cites no other source for it, so there is none to check. The quote shows it is in the paper.
In the paper
“TFs associated with neurodevelopmental disorders, such as Npas1 and Npas3 (Erbel-Sieler et al., 2004), are preferentially expressed in DR-6, and Aff2 (Mondal et al., 2012) is enriched within DR-3.”
§ Single-cell transcriptomes and whole-brain projections of serotonin neurons in the mouse dorsal and median raphe nuclei > Results > Molecular properties of MR and DR serotonin neurons
plaincorrelational- Asserted: passes — The authors put it forward as true.
- Checkable: passes — It can be checked against evidence.
- Load-bearing: unclear — It is unclear whether the paper’s conclusions depend on it.
- Based: passes — The paper gives a reason why it holds.
It may state two separate claims as one.
A result the paper reports from its own data — it cites no other source for it, so there is none to check. The quote shows it is in the paper.
In the paper
“Corticotropin-releasing hormone (Crh) is highly expressed in the DR-3 cluster but much less everywhere else (7% serotonin neurons).”
§ Single-cell transcriptomes and whole-brain projections of serotonin neurons in the mouse dorsal and median raphe nuclei > Results > Molecular properties of MR and DR serotonin neurons
plaincorrelational- Asserted: passes — The authors put it forward as true.
- Checkable: passes — It can be checked against evidence.
- Load-bearing: unclear — It is unclear whether the paper’s conclusions depend on it.
- Based: passes — The paper gives a reason why it holds.
It may state two separate claims as one.
A result the paper reports from its own data — it cites no other source for it, so there is none to check. The quote shows it is in the paper.
In the paper
“The chemokine ligand-12 (Cxcl12) and cadherin-6 (Cdh6) are preferentially expressed in MR-1 and DR-4 clusters, respectively.”
§ Single-cell transcriptomes and whole-brain projections of serotonin neurons in the mouse dorsal and median raphe nuclei > Results > Molecular properties of MR and DR serotonin neurons
plaincorrelational- Asserted: passes — The authors put it forward as true.
- Checkable: passes — It can be checked against evidence.
- Load-bearing: unclear — It is unclear whether the paper’s conclusions depend on it.
- Based: passes — The paper gives a reason why it holds.
It may state two separate claims as one.
A result the paper reports from its own data — it cites no other source for it, so there is none to check. The quote shows it is in the paper.
In the paper
“Npas3 is specifically expressed in the DR-6 cluster and is highly correlated with Htr1d, suggesting a critical role of maintaining the characteristics of DR-6 serotonin neurons.”
§ Single-cell transcriptomes and whole-brain projections of serotonin neurons in the mouse dorsal and median raphe nuclei > Results > Molecular properties of MR and DR serotonin neurons
hedgedcorrelational- Asserted: passes — The authors put it forward as true.
- Checkable: passes — It can be checked against evidence.
- Load-bearing: unclear — It is unclear whether the paper’s conclusions depend on it.
- Based: passes — The paper gives a reason why it holds.
It may state two separate claims as one.
A result the paper reports from its own data — it cites no other source for it, so there is none to check. The quote shows it is in the paper.
In the paper
“The majority of the clusters express Slc17a8, which encodes vesicular glutamate transporter-3 (Vglut3). These include almost all serotonin neurons from the cDR, the majority from MR clusters (Domonkos et al., 2016), and DR-3–6 clusters (Figure 1D).”
§ Single-cell transcriptomes and whole-brain projections of serotonin neurons in the mouse dorsal and median raphe nuclei > Results > Molecular properties of MR and DR serotonin neurons
plain- Asserted: passes — The authors put it forward as true.
- Checkable: passes — It can be checked against evidence.
- Load-bearing: passes — The paper’s conclusions depend on it.
- Based: passes — The paper gives a reason why it holds.
It may state two separate claims as one.
A result the paper reports from its own data — it cites no other source for it, so there is none to check. The quote shows it is in the paper.
In the paper
“In contrast to DR, the anatomical organization of the molecular features that define MR clusters is less obvious and different clusters appear more intermingled.”
§ Single-cell transcriptomes and whole-brain projections of serotonin neurons in the mouse dorsal and median raphe nuclei > Results > Anatomical organization of transcriptomically defined serotonin clusters
hedged- Asserted: passes — The authors put it forward as true.
- Checkable: passes — It can be checked against evidence.
- Load-bearing: unclear — It is unclear whether the paper’s conclusions depend on it.
- Based: passes — The paper gives a reason why it holds.
It may state two separate claims as one.
A result the paper reports from its own data — it cites no other source for it, so there is none to check. The quote shows it is in the paper.
In the paper
“Cluster 6 marker Npas1+ was largely excluded from the densest portion of Tph2 expression at the midline and instead was found scattered in the more rostral and ventral portion of the lateral wings.”
§ Single-cell transcriptomes and whole-brain projections of serotonin neurons in the mouse dorsal and median raphe nuclei > Results > Anatomical organization of transcriptomically defined serotonin clusters
plain- Asserted: passes — The authors put it forward as true.
- Checkable: passes — It can be checked against evidence.
- Load-bearing: passes — The paper’s conclusions depend on it.
- Based: passes — The paper gives a reason why it holds.
It may state two separate claims as one.
A result the paper reports from its own data — it cites no other source for it, so there is none to check. The quote shows it is in the paper.
In the paper
“Finally, all serotonin neurons express at least one type of serotonin receptors, with the Gi-coupled Htr1 subfamily in particular Htr1a being the most widely expressed.”
§ Single-cell transcriptomes and whole-brain projections of serotonin neurons in the mouse dorsal and median raphe nuclei > Results > Molecular properties of MR and DR serotonin neurons
plain- Asserted: passes — The authors put it forward as true.
- Checkable: passes — It can be checked against evidence.
- Load-bearing: unclear — It is unclear whether the paper’s conclusions depend on it.
- Based: passes — The paper gives a reason why it holds.
It may state two separate claims as one.
A result the paper reports from its own data — it cites no other source for it, so there is none to check. The quote shows it is in the paper.
In the paper
“Two MR clusters express Gad2 but not Gad1, and cDR expresses neither.”
§ Single-cell transcriptomes and whole-brain projections of serotonin neurons in the mouse dorsal and median raphe nuclei > Results > Molecular properties of MR and DR serotonin neurons
plain- Asserted: passes — The authors put it forward as true.
- Checkable: passes — It can be checked against evidence.
- Load-bearing: unclear — It is unclear whether the paper’s conclusions depend on it.
- Based: passes — The paper gives a reason why it holds.
It may state two separate claims as one.
A result the paper reports from its own data — it cites no other source for it, so there is none to check. The quote shows it is in the paper.
In the paper
“Htr1a is highly expressed in the MR-4 cluster, which does not express other serotonin receptors.”
§ Single-cell transcriptomes and whole-brain projections of serotonin neurons in the mouse dorsal and median raphe nuclei > Results > Molecular properties of MR and DR serotonin neurons
plaincorrelational- Asserted: passes — The authors put it forward as true.
- Checkable: passes — It can be checked against evidence.
- Load-bearing: unclear — It is unclear whether the paper’s conclusions depend on it.
- Based: passes — The paper gives a reason why it holds.
It may state two separate claims as one.
A result the paper reports from its own data — it cites no other source for it, so there is none to check. The quote shows it is in the paper.
In the paper
“Within the DR, Trh+, Gad1+, and Gad2+ serotonin neurons were mainly located in the dorsal DR, whereas Slc17a8+ (also known as Vglut3, used hereafter) and Syt2+ serotonin neurons were mainly located in the ventral DR and cDR.”
§ Single-cell transcriptomes and whole-brain projections of serotonin neurons in the mouse dorsal and median raphe nuclei > Results > Anatomical organization of transcriptomically defined serotonin clusters
plaincorrelational- Asserted: passes — The authors put it forward as true.
- Checkable: passes — It can be checked against evidence.
- Load-bearing: passes — The paper’s conclusions depend on it.
- Based: passes — The paper gives a reason why it holds.
It may state two separate claims as one.
None of the sources cited for this claim have been checked yet.
In the paper
“For example, Bcl11a and Bcl11b (also named Ctip1 and Ctip2) (Chen et al., 2008; Wiegreffe et al., 2015) are highly enriched in DR-3 and MR-4, respectively.”
§ Single-cell transcriptomes and whole-brain projections of serotonin neurons in the mouse dorsal and median raphe nuclei > Results > Molecular properties of MR and DR serotonin neurons
plaincorrelational- Asserted: passes — The authors put it forward as true.
- Checkable: passes — It can be checked against evidence.
- Load-bearing: unclear — It is unclear whether the paper’s conclusions depend on it.
- Based: passes — The paper gives a reason why it holds.
It may state two separate claims as one.
A result the paper reports from its own data — it cites no other source for it, so there is none to check. The quote shows it is in the paper.
In the paper
“On the other hand, Crhr2, which should be expressed in all DR serotonin neuron clusters except Cluster 1 and 6 (Figure 1D), was localized preferentially near the midline and was absent from the lateral wing.”
§ Single-cell transcriptomes and whole-brain projections of serotonin neurons in the mouse dorsal and median raphe nuclei > Results > Anatomical organization of transcriptomically defined serotonin clusters
plaincorrelational- Asserted: passes — The authors put it forward as true.
- Checkable: passes — It can be checked against evidence.
- Load-bearing: passes — The paper’s conclusions depend on it.
- Based: passes — The paper gives a reason why it holds.
It may state two separate claims as one.
A result the paper reports from its own data — it cites no other source for it, so there is none to check. The quote shows it is in the paper.
In the paper
“Another neuropeptide receptor enriched cluster is MR-3, expressing Tacr3, cannabinoid receptor 1(Cnr1), somatostatin receptor-1 (Sstr1), prolactin-releasing hormone receptor (Prlhr), and neuromedin B receptor (Nmbr).”
§ Single-cell transcriptomes and whole-brain projections of serotonin neurons in the mouse dorsal and median raphe nuclei > Results > Molecular properties of MR and DR serotonin neurons
plain- Asserted: passes — The authors put it forward as true.
- Checkable: passes — It can be checked against evidence.
- Load-bearing: unclear — It is unclear whether the paper’s conclusions depend on it.
- Based: passes — The paper gives a reason why it holds.
It may state two separate claims as one.
A result the paper reports from its own data — it cites no other source for it, so there is none to check. The quote shows it is in the paper.
In the paper
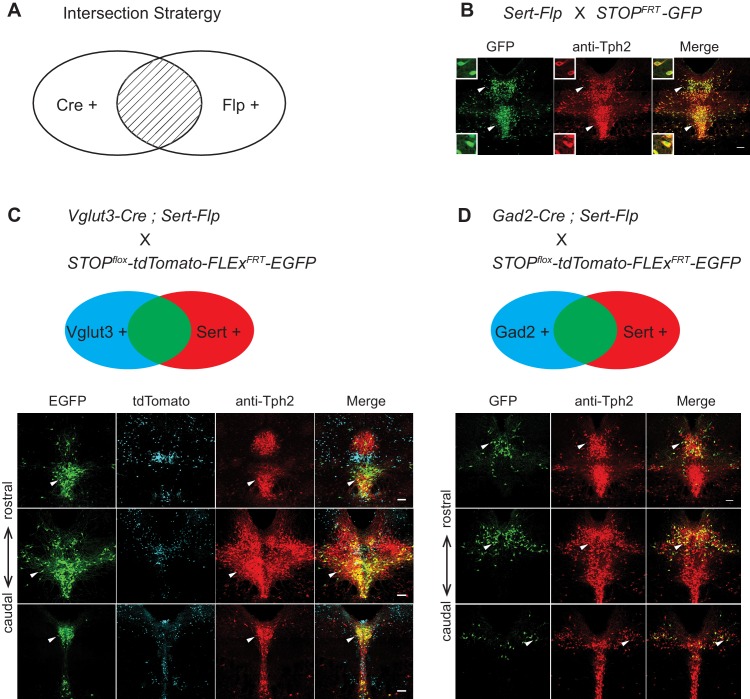
“In the pDR, Vglut3+ serotonin neurons were mainly located ventrally, whereas Gad2+ serotonin neurons were mainly located dorsally, consistent with our previous study (Ren et al., 2018) and the HCR-smFISH results (Figure 2).”
§ Single-cell transcriptomes and whole-brain projections of serotonin neurons in the mouse dorsal and median raphe nuclei > Results > Viral-genetic tools to access different serotonin neuron subtypes
plaincorrelational- Asserted: passes — The authors put it forward as true.
- Checkable: passes — It can be checked against evidence.
- Load-bearing: unclear — It is unclear whether the paper’s conclusions depend on it.
- Based: passes — The paper gives a reason why it holds.
It may state two separate claims as one.
A result the paper reports from its own data — it cites no other source for it, so there is none to check. The quote shows it is in the paper.
In the paper
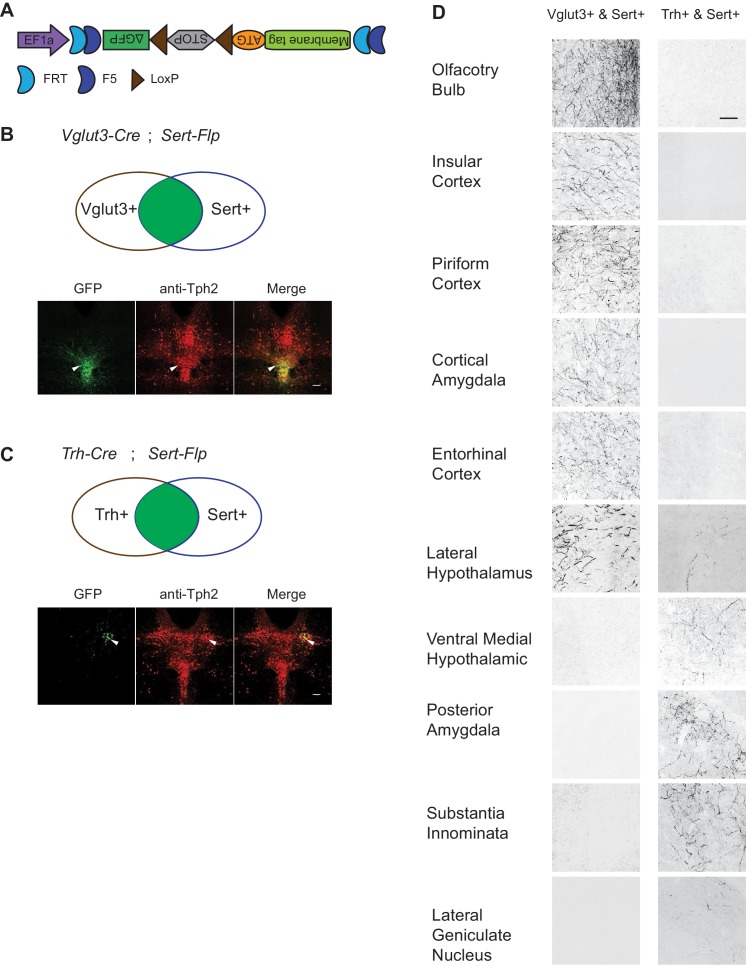
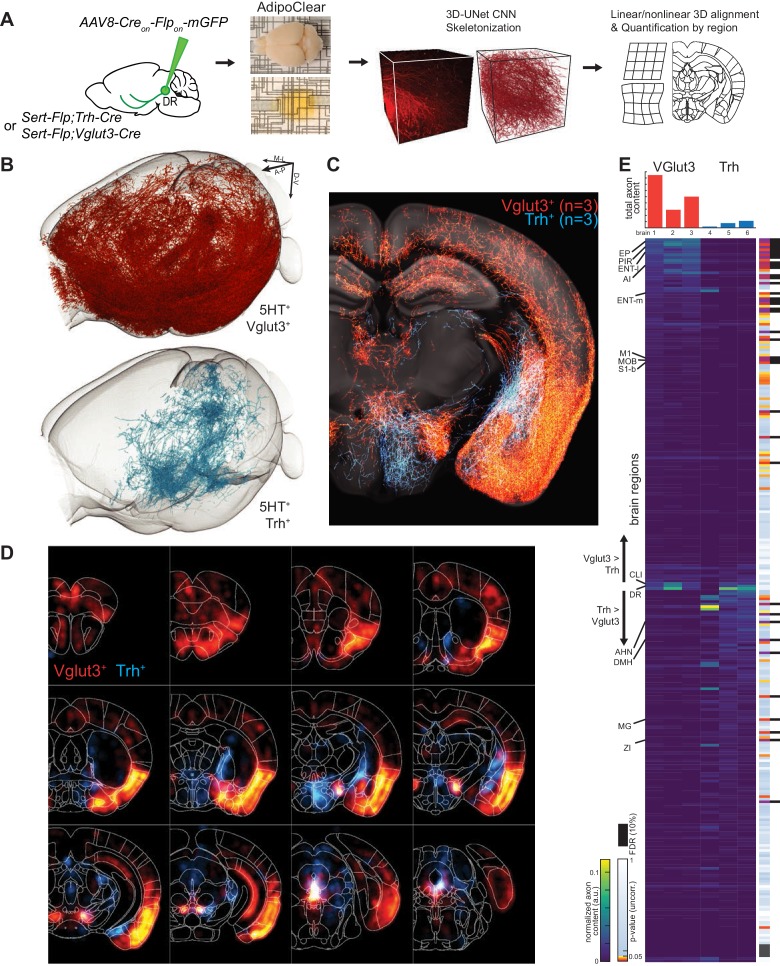
“Instead, Trh+ serotonin axons project to the anterior and medial hypothalamus, posterior amygdala, and the lateral geniculate nucleus in the thalamus, none of which were targeted by Vglut3+ axons (Figure 6D).”
- Also stated in: § Abstract · plain
“Whole-brain axonal projection mapping revealed that DR serotonin neurons co-expressing vesicular glutamate transporter-3 preferentially innervate the cortex, whereas those co-expressing thyrotropin-releasing hormone innervate subcortical regions in particular the hypothalamus.”
§ Single-cell transcriptomes and whole-brain projections of serotonin neurons in the mouse dorsal and median raphe nuclei > Results > Viral-genetic tools to access different serotonin neuron subtypes
plain- Asserted: passes — The authors put it forward as true.
- Checkable: passes — It can be checked against evidence.
- Load-bearing: passes — The paper’s conclusions depend on it.
- Based: passes — The paper gives a reason why it holds.
It may state two separate claims as one.
- Also stated in: § Abstract · plain
A result the paper reports from its own data — it cites no other source for it, so there is none to check. The quote shows it is in the paper.
In the paper
“Two cells had substantial branches to the striatum, and one to the pons (>10% axon length).”
§ Single-cell transcriptomes and whole-brain projections of serotonin neurons in the mouse dorsal and median raphe nuclei > Results > Whole-brain axonal arborization patterns of individual serotonin neurons
plainn = 6- Asserted: passes — The authors put it forward as true.
- Checkable: passes — It can be checked against evidence.
- Load-bearing: unclear — It is unclear whether the paper’s conclusions depend on it.
- Based: passes — The paper gives a reason why it holds.
It may state two separate claims as one.
A result the paper reports from its own data — it cites no other source for it, so there is none to check. The quote shows it is in the paper.
In the paper
“Complete morphological reconstruction revealed that the projection pattern of individual DR serotonin neurons was highly diverse yet follow some general patterns”
§ Single-cell transcriptomes and whole-brain projections of serotonin neurons in the mouse dorsal and median raphe nuclei > Results > Whole-brain axonal arborization patterns of individual serotonin neurons
plainn = 14- Asserted: passes — The authors put it forward as true.
- Checkable: passes — It can be checked against evidence.
- Load-bearing: passes — The paper’s conclusions depend on it.
- Based: passes — The paper gives a reason why it holds.
It may state two separate claims as one.
A result the paper reports from its own data — it cites no other source for it, so there is none to check. The quote shows it is in the paper.
In the paper
“two cortex-projecting serotonin neurons also sent substantial branches to the pons (>10% of axon length), and also innervated the cerebellum.”
§ Single-cell transcriptomes and whole-brain projections of serotonin neurons in the mouse dorsal and median raphe nuclei > Results > Whole-brain axonal arborization patterns of individual serotonin neurons
plainn = 2- Asserted: passes — The authors put it forward as true.
- Checkable: passes — It can be checked against evidence.
- Load-bearing: unclear — It is unclear whether the paper’s conclusions depend on it.
- Based: passes — The paper gives a reason why it holds.
It may state two separate claims as one.
A result the paper reports from its own data — it cites no other source for it, so there is none to check. The quote shows it is in the paper.
In the paper
“subcortical regions primarily in thalamus (zona incerta and medial geniculate) and hypothalamus (anterior and dorsomedial nuclei) were preferentially targeted by Trh+ axons and largely avoided by the Vglut3+ population”
§ Single-cell transcriptomes and whole-brain projections of serotonin neurons in the mouse dorsal and median raphe nuclei > Results > Whole-brain axonal projections of selected serotonin neuron subpopulations
plaincorrelational- Asserted: passes — The authors put it forward as true.
- Checkable: passes — It can be checked against evidence.
- Load-bearing: passes — The paper’s conclusions depend on it.
- Based: passes — The paper gives a reason why it holds.
It may state two separate claims as one.
A result the paper reports from its own data — it cites no other source for it, so there is none to check. The quote shows it is in the paper.
In the paper
“None of them had collateralization in the cortical regions.”
§ Single-cell transcriptomes and whole-brain projections of serotonin neurons in the mouse dorsal and median raphe nuclei > Results > Whole-brain axonal arborization patterns of individual serotonin neurons
plain- Asserted: passes — The authors put it forward as true.
- Checkable: passes — It can be checked against evidence.
- Load-bearing: unclear — It is unclear whether the paper’s conclusions depend on it.
- Based: passes — The paper gives a reason why it holds.
The quote only partly states this claim.
A result the paper reports from its own data — it cites no other source for it, so there is none to check. The quote shows it is in the paper.
In the paper
“By contrast, Trh+ axons, which originated preferentially from the lateral wing of pDR, were largely absent from these structures.”
§ Single-cell transcriptomes and whole-brain projections of serotonin neurons in the mouse dorsal and median raphe nuclei > Results > Whole-brain axonal projections of selected serotonin neuron subpopulations
plaincorrelational- Asserted: passes — The authors put it forward as true.
- Checkable: passes — It can be checked against evidence.
- Load-bearing: passes — The paper’s conclusions depend on it.
- Based: passes — The paper gives a reason why it holds.
It may state two separate claims as one.
A result the paper reports from its own data — it cites no other source for it, so there is none to check. The quote shows it is in the paper.
In the paper
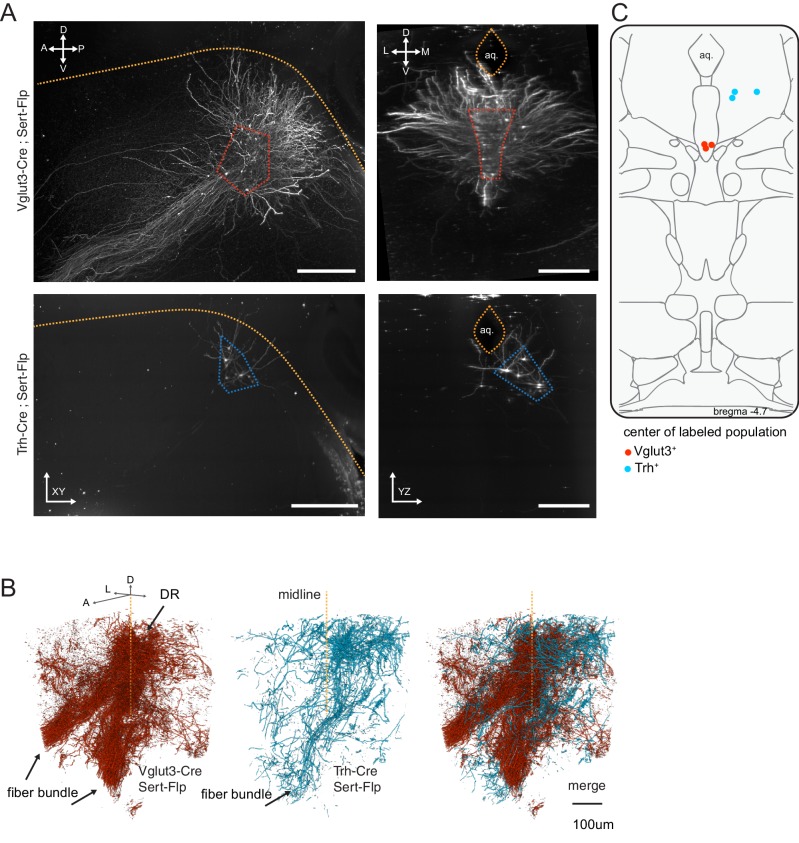
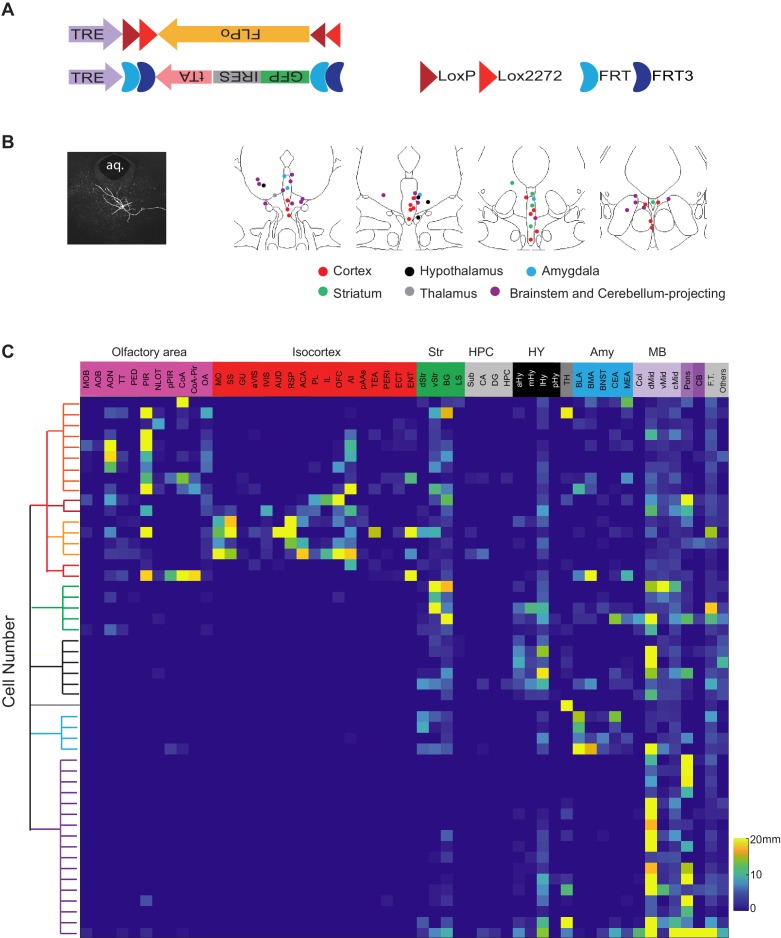
“As predicted, Vglut3+Sert+ GFP cells were mostly located in the ventral pDR (Figure 6B), whereas Trh+Sert+ cells were located in the dorsal pDR (Figure 6C).”
§ Single-cell transcriptomes and whole-brain projections of serotonin neurons in the mouse dorsal and median raphe nuclei > Results > Viral-genetic tools to access different serotonin neuron subtypes
plaincorrelationaln = 3- Asserted: passes — The authors put it forward as true.
- Checkable: passes — It can be checked against evidence.
- Load-bearing: passes — The paper’s conclusions depend on it.
- Based: passes — The paper gives a reason why it holds.
It may state two separate claims as one.
A result the paper reports from its own data — it cites no other source for it, so there is none to check. The quote shows it is in the paper.
In the paper
“this group had the most complex branching pattern, with various combinations of target regions”
§ Single-cell transcriptomes and whole-brain projections of serotonin neurons in the mouse dorsal and median raphe nuclei > Results > Whole-brain axonal arborization patterns of individual serotonin neurons
plaincorrelationaln = 17- Asserted: passes — The authors put it forward as true.
- Checkable: passes — It can be checked against evidence.
- Load-bearing: unclear — It is unclear whether the paper’s conclusions depend on it.
- Based: passes — The paper gives a reason why it holds.
It may state two separate claims as one.
A result the paper reports from its own data — it cites no other source for it, so there is none to check. The quote shows it is in the paper.
In the paper
“Notable examples include anterior bed nucleus of stria terminalis (BNST), posterior amygdala, and globus pallidus external segment (GPe) in Trh+ projections, as well as the lateral central amygdala (CeA) and dentate nucleus of the cerebellum for Vglut3+ projections.”
§ Single-cell transcriptomes and whole-brain projections of serotonin neurons in the mouse dorsal and median raphe nuclei > Results > Whole-brain axonal projections of selected serotonin neuron subpopulations
plainn = 2- Asserted: passes — The authors put it forward as true.
- Checkable: passes — It can be checked against evidence.
- Load-bearing: unclear — It is unclear whether the paper’s conclusions depend on it.
- Based: passes — The paper gives a reason why it holds.
It may state two separate claims as one.
A result the paper reports from its own data — it cites no other source for it, so there is none to check. The quote shows it is in the paper.
In the paper
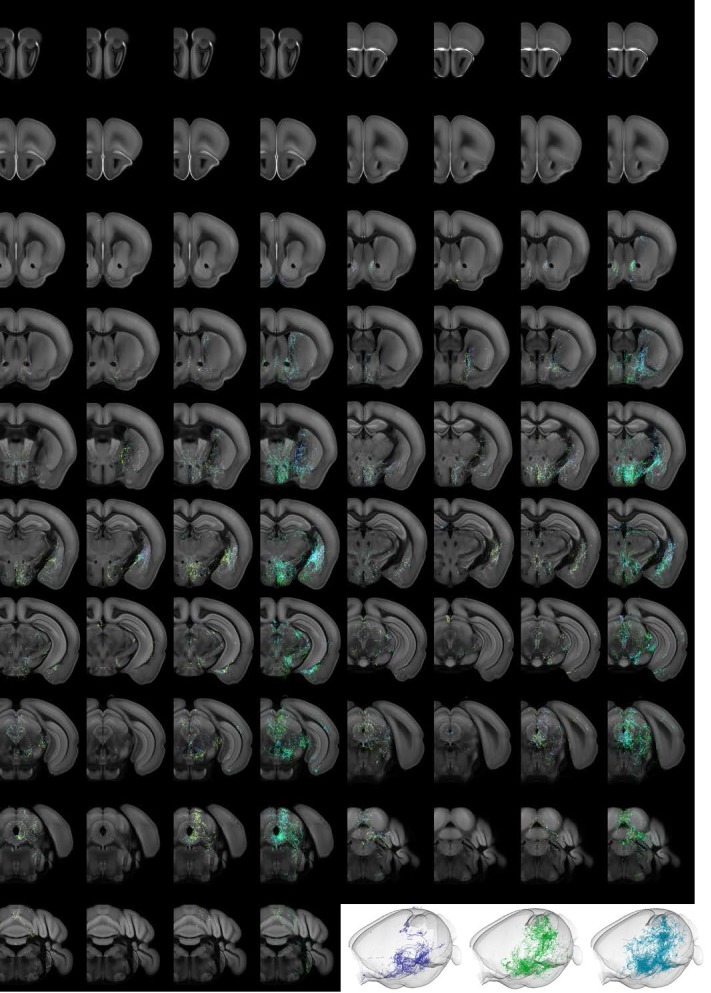
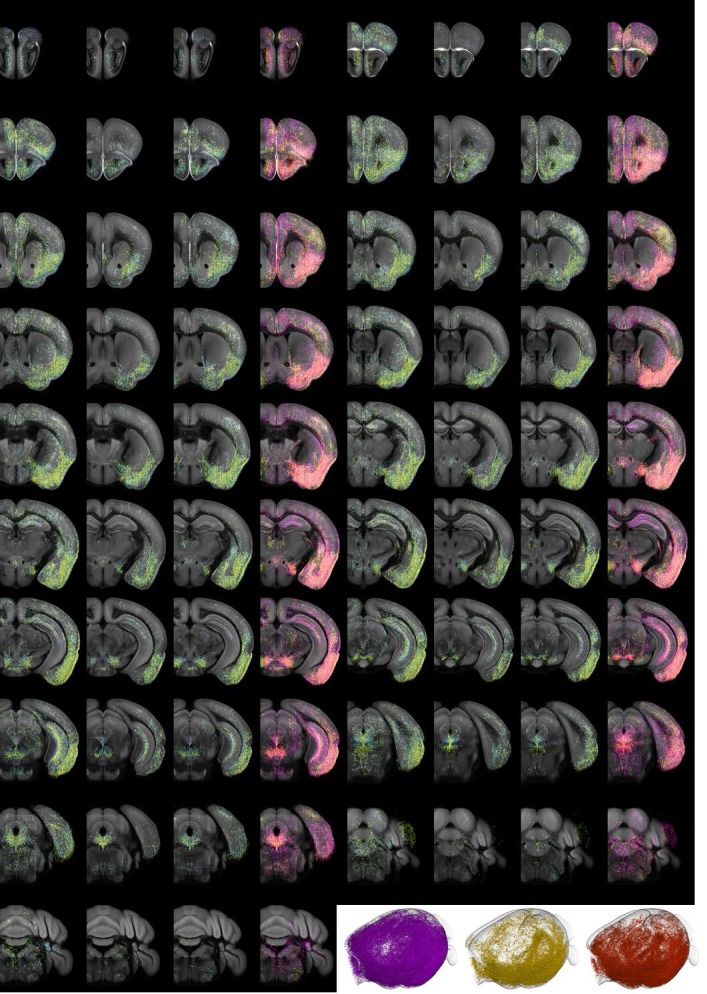
“Axons from both populations followed similar initial trajectories and were observed in shared structures along the length of the median forebrain bundle (Figure 7C,D; Figure 7—figure supplements 1–3; Figure 7—Video 1).”
§ Single-cell transcriptomes and whole-brain projections of serotonin neurons in the mouse dorsal and median raphe nuclei > Results > Whole-brain axonal projections of selected serotonin neuron subpopulations
plaincorrelational- Asserted: passes — The authors put it forward as true.
- Checkable: passes — It can be checked against evidence.
- Load-bearing: unclear — It is unclear whether the paper’s conclusions depend on it.
- Based: passes — The paper gives a reason why it holds.
It may state two separate claims as one.
A result the paper reports from its own data — it cites no other source for it, so there is none to check. The quote shows it is in the paper.
In the paper
“One cell had substantial branches to the cortical regions and two to the hypothalamus.”
§ Single-cell transcriptomes and whole-brain projections of serotonin neurons in the mouse dorsal and median raphe nuclei > Results > Whole-brain axonal arborization patterns of individual serotonin neurons
plainn = 5- Asserted: passes — The authors put it forward as true.
- Checkable: passes — It can be checked against evidence.
- Load-bearing: unclear — It is unclear whether the paper’s conclusions depend on it.
- Based: passes — The paper gives a reason why it holds.
It may state two separate claims as one.
A result the paper reports from its own data — it cites no other source for it, so there is none to check. The quote shows it is in the paper.
In the paper
“individual brains from the same genotype exhibit considerable variation in total axons labeled (Figure 7E top) and in detailed projection patterns”
§ Single-cell transcriptomes and whole-brain projections of serotonin neurons in the mouse dorsal and median raphe nuclei > Results > Whole-brain axonal projections of selected serotonin neuron subpopulations
plain- Asserted: passes — The authors put it forward as true.
- Checkable: passes — It can be checked against evidence.
- Load-bearing: passes — The paper’s conclusions depend on it.
- Based: passes — The paper gives a reason why it holds.
It may state two separate claims as one.
A result the paper reports from its own data — it cites no other source for it, so there is none to check. The quote shows it is in the paper.
In the paper
“serotonin neurons from DR-1–3 clusters are preferentially localized in dorsal pDR, whereas those from DR-4–6 in ventral pDR, with DR-6 neurons preferentially localized to the ventral lateral wings.”
§ Single-cell transcriptomes and whole-brain projections of serotonin neurons in the mouse dorsal and median raphe nuclei > Discussion > Relationship between molecular identity and cell body distribution
plaincorrelational- Asserted: passes — The authors put it forward as true.
- Checkable: passes — It can be checked against evidence.
- Load-bearing: passes — The paper’s conclusions depend on it.
- Based: passes — The paper gives a reason why it holds.
It may state two separate claims as one.
In the paper
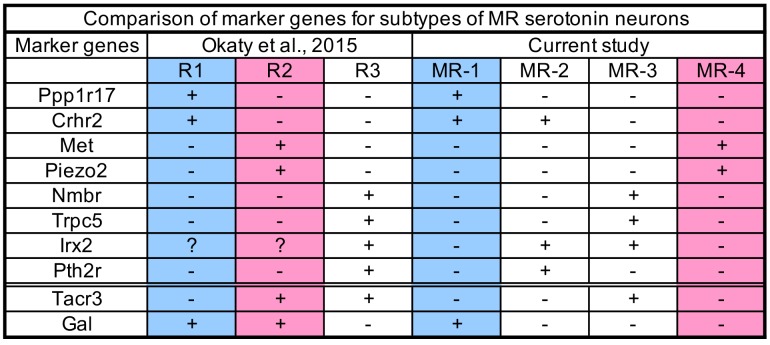
“Comparing marker genes enriched in R1–R3-derived serotonin neurons from Okaty et al. and MR-1–MR-4 transcriptomic clusters from our current study (Figure 3—figure supplement 4) indeed suggests an approximate correspondence: R1-derived serotonin neurons correspond to our MR-1 cluster, R2 to MR-4 cluster, and R3 to both MR-2 and MR-3 clusters.”
§ Single-cell transcriptomes and whole-brain projections of serotonin neurons in the mouse dorsal and median raphe nuclei > Discussion > Relationship between molecular identity and cell body distribution
What the sources say
- Not checked yetcites Okaty et al., 2015 source
hedgedcorrelational- Asserted: passes — The authors put it forward as true.
- Checkable: passes — It can be checked against evidence.
- Load-bearing: passes — The paper’s conclusions depend on it.
- Based: passes — The paper gives a reason why it holds.
It may state two separate claims as one.
A result the paper reports from its own data — it cites no other source for it, so there is none to check. The quote shows it is in the paper.
In the paper
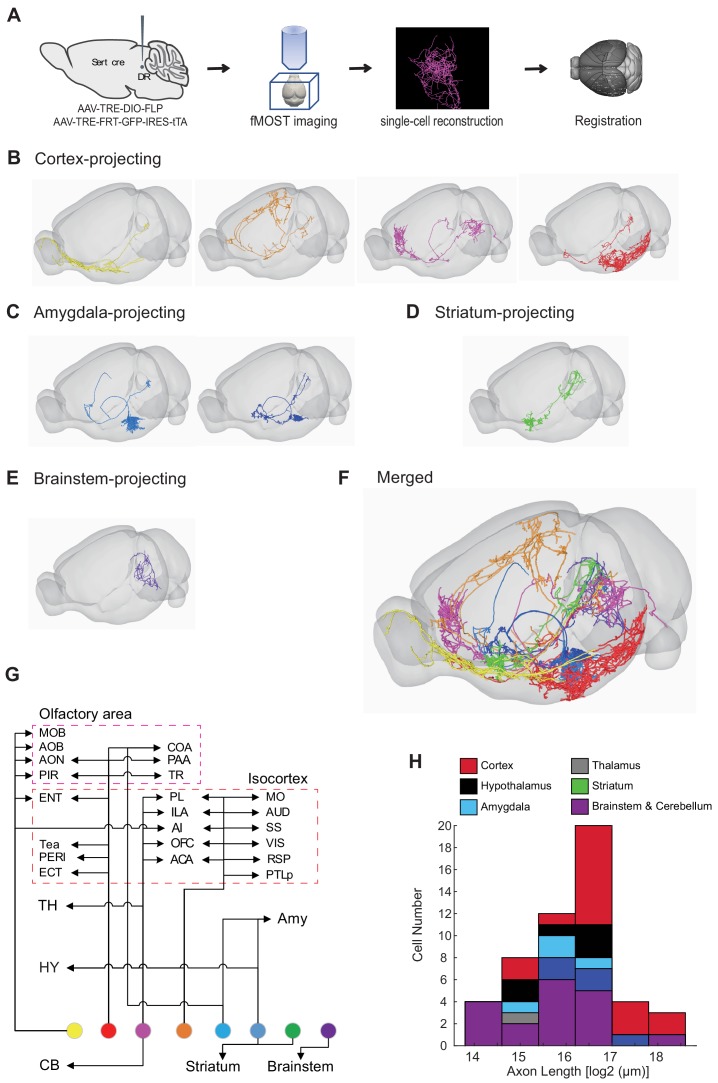
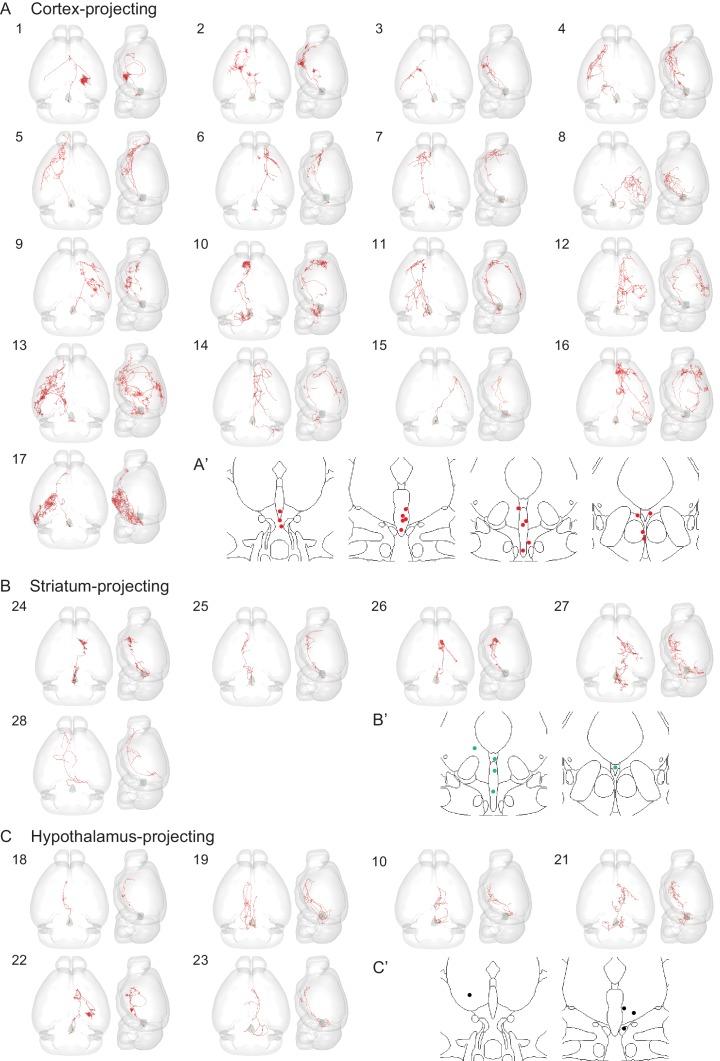
“The cortical-projecting serotonin neurons can have elaborate arborization patterns across multiple cortical areas (e.g., Figure 8—figure supplement 1C) and the longest total axon lengths per cell (Figure 8H).”
§ Single-cell transcriptomes and whole-brain projections of serotonin neurons in the mouse dorsal and median raphe nuclei > Discussion > Insights from single-cell reconstruction
plaincorrelational- Asserted: passes — The authors put it forward as true.
- Checkable: passes — It can be checked against evidence.
- Load-bearing: unclear — It is unclear whether the paper’s conclusions depend on it.
- Based: passes — The paper gives a reason why it holds.
It may state two separate claims as one.
A result the paper reports from its own data — it cites no other source for it, so there is none to check. The quote shows it is in the paper.
In the paper
“Using viral-genetic intersectional approaches to access specifically Vglut3+ pDR serotonin neurons in combination with staining in histological sections (Figure 6) and iDISCO-based whole brain imaging (Figure 7), we found that these neurons project profusely to cover much of the neocortex, as well as the olfactory bulb, cortical amygdala, and lateral hypothalamus.”
§ Single-cell transcriptomes and whole-brain projections of serotonin neurons in the mouse dorsal and median raphe nuclei > Discussion > Relationship between molecular identity and projection-defined serotonin sub-systems
plaincorrelational- Asserted: passes — The authors put it forward as true.
- Checkable: passes — It can be checked against evidence.
- Load-bearing: passes — The paper’s conclusions depend on it.
- Based: passes — The paper gives a reason why it holds.
It may state two separate claims as one.
A result the paper reports from its own data — it cites no other source for it, so there is none to check. The quote shows it is in the paper.
In the paper
“All cDR serotonin neurons co-express Vglut3, and express several unique markers (Figure 3—figure supplement 2).”
§ Single-cell transcriptomes and whole-brain projections of serotonin neurons in the mouse dorsal and median raphe nuclei > Discussion > Relationship between molecular identity and cell body distribution
plaincorrelational- Asserted: passes — The authors put it forward as true.
- Checkable: passes — It can be checked against evidence.
- Load-bearing: passes — The paper’s conclusions depend on it.
- Based: passes — The paper gives a reason why it holds.
It may state two separate claims as one.
In the paper
“Our transcriptome data suggest that each DR/MR serotonin neuron type can be distinguished from others by the expression of two marker genes (Figure 1D; Figure 3—figure supplement 1–3), supporting the view that neuronal subtypes are generally specified by unique combination of genes rather than single genes (Li et al., 2017).”
§ Single-cell transcriptomes and whole-brain projections of serotonin neurons in the mouse dorsal and median raphe nuclei > Discussion > Relationship between molecular identity and projection-defined serotonin sub-systems
What the sources say
- Not checked yetcites Li et al., 2017
hedgedcorrelational- Asserted: passes — The authors put it forward as true.
- Checkable: passes — It can be checked against evidence.
- Load-bearing: passes — The paper’s conclusions depend on it.
- Based: passes — The paper gives a reason why it holds.
It may state two separate claims as one.
A result the paper reports from its own data — it cites no other source for it, so there is none to check. The quote shows it is in the paper.
In the paper
“Our single-cell transcriptomic analysis indicated that serotonin neurons in the cDR are strikingly homogenous and profoundly different from both the pDR and MR at the molecular level (Figure 1, Figure 4, Figure 4—figure supplement 1).”
§ Single-cell transcriptomes and whole-brain projections of serotonin neurons in the mouse dorsal and median raphe nuclei > Discussion > Relationship between molecular identity and cell body distribution
hedgedcorrelational- Asserted: passes — The authors put it forward as true.
- Checkable: passes — It can be checked against evidence.
- Load-bearing: passes — The paper’s conclusions depend on it.
- Based: passes — The paper gives a reason why it holds.
It may state two separate claims as one.
A result the paper reports from its own data — it cites no other source for it, so there is none to check. The quote shows it is in the paper.
In the paper
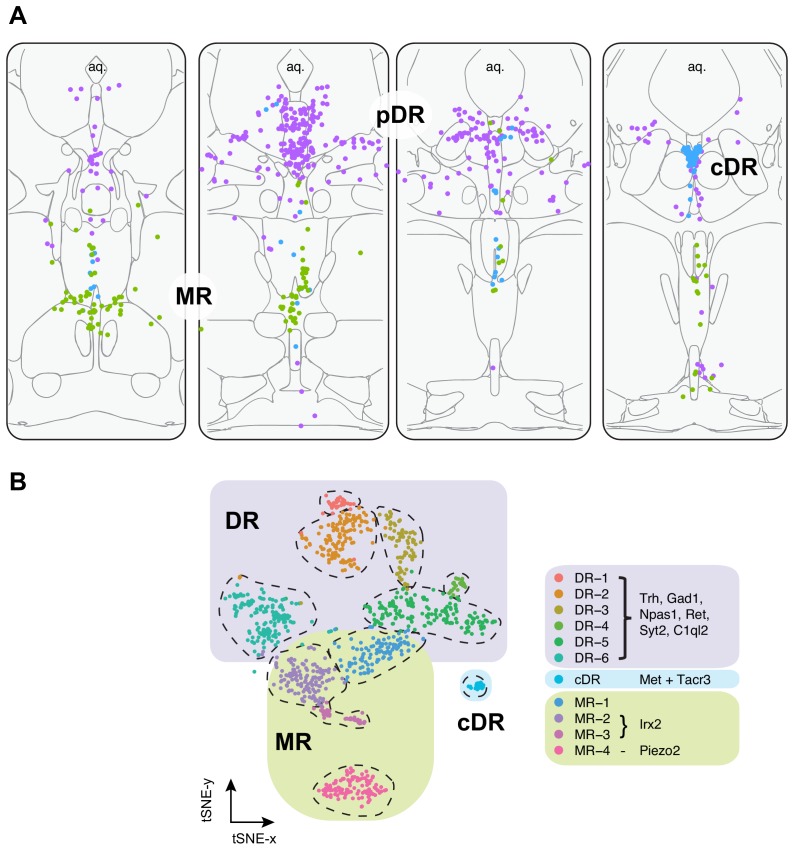
“Based on tissue source from which scRNA-seq data was collected and fluorescent in situ hybridization using transcriptomic cluster markers, we were able to assign six types to principal DR (pDR), one type to caudal DR (cDR), and four types to MR (Figure 3).”
§ Single-cell transcriptomes and whole-brain projections of serotonin neurons in the mouse dorsal and median raphe nuclei > Discussion > Relationship between molecular identity and cell body distribution
plaincorrelational- Asserted: passes — The authors put it forward as true.
- Checkable: passes — It can be checked against evidence.
- Load-bearing: passes — The paper’s conclusions depend on it.
- Based: passes — The paper gives a reason why it holds.
It may state two separate claims as one.
A result the paper reports from its own data — it cites no other source for it, so there is none to check. The quote shows it is in the paper.
In the paper
“We found that Trh+ serotonin neurons predominantly project to subcortical regions, most notably anterior and medial nuclei of the hypothalamus and several thalamic nuclei, a pattern mostly complementary to the Vglut3+ population (Figures 6–7, Figure 7—Video 1).”
§ Single-cell transcriptomes and whole-brain projections of serotonin neurons in the mouse dorsal and median raphe nuclei > Discussion > Relationship between molecular identity and projection-defined serotonin sub-systems
plaincorrelational- Asserted: passes — The authors put it forward as true.
- Checkable: passes — It can be checked against evidence.
- Load-bearing: passes — The paper’s conclusions depend on it.
- Based: passes — The paper gives a reason why it holds.
It may state two separate claims as one.
In the paper
“By contrast, we could not discern obvious difference in spatial distributions among the four MR types, despite the fact that MR serotonin neurons have heterogenous developmental origin (Jensen et al., 2008).”
§ Single-cell transcriptomes and whole-brain projections of serotonin neurons in the mouse dorsal and median raphe nuclei > Discussion > Relationship between molecular identity and cell body distribution
What the sources say
- Not checked yetcites Jensen et al., 2008 source
hedged- Asserted: passes — The authors put it forward as true.
- Checkable: passes — It can be checked against evidence.
- Load-bearing: unclear — It is unclear whether the paper’s conclusions depend on it.
- Based: passes — The paper gives a reason why it holds.
It may state two separate claims as one.
None of the sources cited for this claim have been checked yet.
In the paper
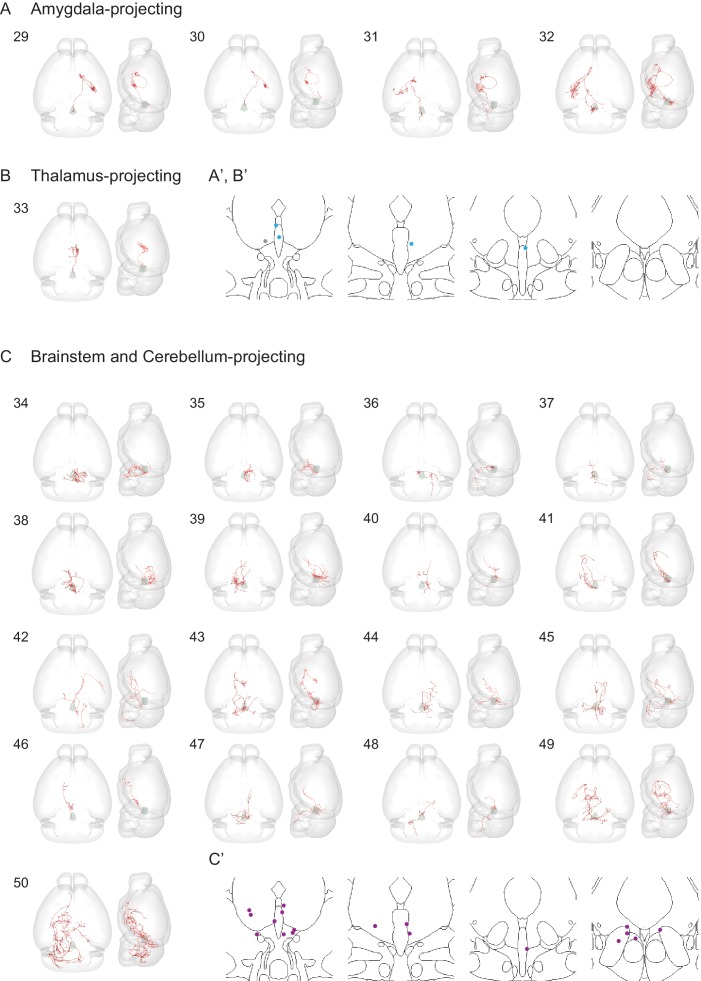
“The rest of the DR serotonin neurons were divided into thalamus-projecting and brainstem/cerebellum-projecting groups based on the highest density of axons (Figure 8—figure supplement 3B,C), one of which likely projecting to the spinal cord (brain 36) as previously reported (Bowker et al., 1981; Bowker et al., 1982).”
§ Single-cell transcriptomes and whole-brain projections of serotonin neurons in the mouse dorsal and median raphe nuclei > Results > Whole-brain axonal arborization patterns of individual serotonin neurons
What the sources say
hedgedcorrelational- Asserted: passes — The authors put it forward as true.
- Checkable: passes — It can be checked against evidence.
- Load-bearing: unclear — It is unclear whether the paper’s conclusions depend on it.
- Based: passes — The paper gives a reason why it holds.
It may state two separate claims as one.
The paper states this without a source or data behind it here, so there is nothing to check it against. The quote shows it is in the paper.
In the paper
“As a specific example, most forebrain-projecting DR serotonin neurons pass through the lateral hypothalamus to reach their targets; it is thus difficult to determine whether axons in the lateral hypothalamus play a local function.”
§ Single-cell transcriptomes and whole-brain projections of serotonin neurons in the mouse dorsal and median raphe nuclei > Discussion > Insights from single-cell reconstruction
plain- Asserted: passes — The authors put it forward as true.
- Checkable: passes — It can be checked against evidence.
- Load-bearing: unclear — It is unclear whether the paper’s conclusions depend on it.
- Based: passes — The paper gives a reason why it holds.
It may state two separate claims as one.
A result the paper reports from its own data — it cites no other source for it, so there is none to check. The quote shows it is in the paper.
In the paper
“One cell had axons that were almost equally distributed in the bed nucleus of stria terminalis (BNST), basal lateral amygdala, basal medial amygdala, and medial amygdala (MeA), and had substantial branches to the hypothalamus (>10% axon length).”
§ Single-cell transcriptomes and whole-brain projections of serotonin neurons in the mouse dorsal and median raphe nuclei > Results > Whole-brain axonal arborization patterns of individual serotonin neurons
plainSingle case- Asserted: passes — The authors put it forward as true.
- Checkable: passes — It can be checked against evidence.
- Load-bearing: unclear — It is unclear whether the paper’s conclusions depend on it.
- Based: passes — The paper gives a reason why it holds.
It may state two separate claims as one.
In the paper
“Gene expression patterns of specific serotonin neuron clusters can in principle allow genetic access to these specific subpopulations for anatomical tracing, physiological recording, and functional perturbation (Luo et al., 2018).”
§ Single-cell transcriptomes and whole-brain projections of serotonin neurons in the mouse dorsal and median raphe nuclei > Results > Viral-genetic tools to access different serotonin neuron subtypes
What the sources say
- Not checked yetcites Luo et al., 2018 source
hedgedconditional- Asserted: passes — The authors put it forward as true.
- Checkable: passes — It can be checked against evidence.
- Load-bearing: passes — The paper’s conclusions depend on it.
- Based: passes — The paper gives a reason why it holds.
Probably not a substantial claim.
A conclusion the paper draws from its own results — it cites no other source for it, so there is none to check. The quote shows it is in the paper.
In the paper
“In summary, our HCR-smFISH experiments support the notion that Clusters 1–6 correspond to pDR serotonin neurons, Cluster 7 corresponds to cDR serotonin neurons, and Clusters 8–11 correspond to MR serotonin neurons.”
- Also stated in: § Abstract · plain
“Systematic in situ hybridization mapped specific clusters to the principal DR, caudal DR, or MR.”
§ Single-cell transcriptomes and whole-brain projections of serotonin neurons in the mouse dorsal and median raphe nuclei > Results > Anatomical organization of transcriptomically defined serotonin clusters
plaincorrelational- Asserted: passes — The authors put it forward as true.
- Checkable: passes — It can be checked against evidence.
- Load-bearing: passes — The paper’s conclusions depend on it.
- Based: passes — The paper gives a reason why it holds.
It may state two separate claims as one.
- Also stated in: § Abstract · plain
A conclusion the paper draws from its own results — it cites no other source for it, so there is none to check. The quote shows it is in the paper.
In the paper
“In summary, the DR and MR serotonin neurons have diverse expression pattern of neuropeptide receptors, indicating that they are subject to complex modulation by a host of neuropeptides.”
§ Single-cell transcriptomes and whole-brain projections of serotonin neurons in the mouse dorsal and median raphe nuclei > Results > Molecular properties of MR and DR serotonin neurons
hedgedcorrelational- Asserted: passes — The authors put it forward as true.
- Checkable: passes — It can be checked against evidence.
- Load-bearing: passes — The paper’s conclusions depend on it.
- Based: passes — The paper gives a reason why it holds.
It may state two separate claims as one.
In the paper
“It has been reported that vesicular monoamine transporters (Slc8a1 for Vmat1; Slc8a2 for Vmat2) can transport GABA into synaptic vesicles (Stensrud et al., 2014), and virtually all serotonin neurons expressed Vmat2 (Figure 1—figure supplement 1D; Figure 4A left).”
§ Single-cell transcriptomes and whole-brain projections of serotonin neurons in the mouse dorsal and median raphe nuclei > Results > Molecular properties of MR and DR serotonin neurons
What the sources say
- Not checked yetcites Stensrud et al., 2014 source
plaindirect- Asserted: passes — The authors put it forward as true.
- Checkable: passes — It can be checked against evidence.
- Load-bearing: passes — The paper’s conclusions depend on it.
- Based: passes — The paper gives a reason why it holds.
Probably not a substantial claim.
A conclusion the paper draws from its own results — it cites no other source for it, so there is none to check. The quote shows it is in the paper.
In the paper
“These data suggest that Clusters 1–3 correspond to the dorsal DR and Cluster 4–6 to the ventral DR.”
§ Single-cell transcriptomes and whole-brain projections of serotonin neurons in the mouse dorsal and median raphe nuclei > Results > Anatomical organization of transcriptomically defined serotonin clusters
hedgedcorrelational- Asserted: passes — The authors put it forward as true.
- Checkable: passes — It can be checked against evidence.
- Load-bearing: passes — The paper’s conclusions depend on it.
- Based: passes — The paper gives a reason why it holds.
It may state two separate claims as one.
A conclusion the paper draws from its own results — it cites no other source for it, so there is none to check. The quote shows it is in the paper.
In the paper
“Based on our scRNA-seq and HCR-smFISH results, the Vglut3+ and Trh+ pDR serotonin neurons consist of largely complementary cell types at the transcriptomic level and have a distinct distribution along the dorsal–ventral axis in the pDR.”
§ Single-cell transcriptomes and whole-brain projections of serotonin neurons in the mouse dorsal and median raphe nuclei > Results > Viral-genetic tools to access different serotonin neuron subtypes
plaincorrelationaln = 3- Asserted: passes — The authors put it forward as true.
- Checkable: passes — It can be checked against evidence.
- Load-bearing: passes — The paper’s conclusions depend on it.
- Based: passes — The paper gives a reason why it holds.
It may state two separate claims as one.
What the paper did — it cites no source for this, so there is none to check. The quote shows it is in the paper.
In the paper
“Anti-Tph2 staining on the brain slices containing pDR showed that 98.5% GFP+ neurons are Tph2+ and 100% Tph2+ neurons are GFP+ (Figure 5B).”
§ Single-cell transcriptomes and whole-brain projections of serotonin neurons in the mouse dorsal and median raphe nuclei > Results > Viral-genetic tools to access different serotonin neuron subtypes
plaincorrelational- Asserted: passes — The authors put it forward as true.
- Checkable: passes — It can be checked against evidence.
- Load-bearing: passes — The paper’s conclusions depend on it.
- Based: passes — The paper gives a reason why it holds.
It may state two separate claims as one.
In the paper
“However, DR and MR contain not only serotonin neurons but also GABAergic and glutamatergic neurons that do not express Tph2 (and hence do not release serotonin), some of which may project to the same target regions (McDevitt et al., 2014).”
§ Single-cell transcriptomes and whole-brain projections of serotonin neurons in the mouse dorsal and median raphe nuclei > Results > Viral-genetic tools to access different serotonin neuron subtypes
What the sources say
- Not checked yetcites McDevitt et al., 2014 source
hedgedcorrelational- Asserted: passes — The authors put it forward as true.
- Checkable: passes — It can be checked against evidence.
- Load-bearing: passes — The paper’s conclusions depend on it.
- Based: passes — The paper gives a reason why it holds.
It may state two separate claims as one.
In the paper
“Transcription factors (TFs) have been shown to be the best molecular feature for cell type definition (Schaum et al., 2018).”
§ Single-cell transcriptomes and whole-brain projections of serotonin neurons in the mouse dorsal and median raphe nuclei > Results > Molecular properties of MR and DR serotonin neurons
What the sources say
- Not checked yetcites Schaum et al., 2018 source
boostedcorrelational- Asserted: passes — The authors put it forward as true.
- Checkable: passes — It can be checked against evidence.
- Load-bearing: fails — The paper’s conclusions may not depend on it.
- Based: passes — The paper gives a reason why it holds.
Probably not a substantial claim. The paper’s conclusions may not depend on it.
A conclusion the paper draws from its own results — it cites no other source for it, so there is none to check. The quote shows it is in the paper.
In the paper
“Thus, these observations support the anatomical breakdown suggested by the dissection of primary tissue, and additionally provide a more granular and detailed description about finer boundaries.”
§ Single-cell transcriptomes and whole-brain projections of serotonin neurons in the mouse dorsal and median raphe nuclei > Results > Anatomical organization of transcriptomically defined serotonin clusters
plaincorrelational- Asserted: passes — The authors put it forward as true.
- Checkable: passes — It can be checked against evidence.
- Load-bearing: passes — The paper’s conclusions depend on it.
- Based: passes — The paper gives a reason why it holds.
It may state two separate claims as one.
None of the sources cited for this claim have been checked yet.
In the paper
“DR serotonin neurons derive entirely from rhombomere 1 of the developing mouse brain, whereas MR serotonin neurons derive predominantly from rhombomeres 1, 2, and 3 (Alonso et al., 2013; Bang et al., 2012; Jensen et al., 2008).”
§ Single-cell transcriptomes and whole-brain projections of serotonin neurons in the mouse dorsal and median raphe nuclei > Introduction
What the sources say
plaindirect- Asserted: passes — The authors put it forward as true.
- Checkable: passes — It can be checked against evidence.
- Load-bearing: fails — The paper’s conclusions may not depend on it.
- Based: passes — The paper gives a reason why it holds.
Probably not a substantial claim. The paper’s conclusions may not depend on it. It may state two separate claims as one.
None of the sources cited for this claim have been checked yet.
In the paper
“Evidence has suggested that the DR and MR serotonin systems differ in developmental origin, connectivity, physiology, and behavioral function (Alonso et al., 2013; Calizo et al., 2011; Okaty et al., 2019).”
§ Single-cell transcriptomes and whole-brain projections of serotonin neurons in the mouse dorsal and median raphe nuclei > Introduction
What the sources say
hedgedcorrelational- Asserted: passes — The authors put it forward as true.
- Checkable: passes — It can be checked against evidence.
- Load-bearing: passes — The paper’s conclusions depend on it.
- Based: passes — The paper gives a reason why it holds.
It may state two separate claims as one.
None of the sources cited for this claim have been checked yet.
In the paper
“The MR serotonin neurons project to structures near the midline, whereas the DR serotonin neurons target more lateral regions (Jacobs and Azmitia, 1992; Muzerelle et al., 2016; Vertes, 1991; Vertes et al., 1999).”
§ Single-cell transcriptomes and whole-brain projections of serotonin neurons in the mouse dorsal and median raphe nuclei > Introduction
What the sources say
plaincorrelational- Asserted: passes — The authors put it forward as true.
- Checkable: passes — It can be checked against evidence.
- Load-bearing: passes — The paper’s conclusions depend on it.
- Based: passes — The paper gives a reason why it holds.
It may state two separate claims as one.
In the paper
“Groups B1–B3 are located in the medulla and provide descending serotonergic innervation to the spinal cord and other parts of the medulla. Groups B4–B9 are located in the pons and midbrain, including the dorsal raphe (DR; groups B6 and B7) and median raphe (MR; groups B5 and B8) nucleus, and provide ascending innervation to the forebrain and midbrain.”
§ Single-cell transcriptomes and whole-brain projections of serotonin neurons in the mouse dorsal and median raphe nuclei > Introduction
What the sources say
- Not checked yetcites Dahlström and Fuxe, 1964
plaindirect- Asserted: passes — The authors put it forward as true.
- Checkable: passes — It can be checked against evidence.
- Load-bearing: fails — The paper’s conclusions may not depend on it.
- Based: passes — The paper gives a reason why it holds.
Probably not a substantial claim. The paper’s conclusions may not depend on it. It may state two separate claims as one.
In the paper
“As a specific example, we recently found that DR serotonin neurons that project to frontal cortex and amygdala constitute two sub-systems with distinct cell body locations, axonal collateralization patterns, biased inputs, physiological response properties, and behavioral functions (Ren et al., 2018).”
§ Single-cell transcriptomes and whole-brain projections of serotonin neurons in the mouse dorsal and median raphe nuclei > Introduction
What the sources say
- Not checked yetcites Ren et al., 2018 source
plaincorrelational- Asserted: passes — The authors put it forward as true.
- Checkable: passes — It can be checked against evidence.
- Load-bearing: passes — The paper’s conclusions depend on it.
- Based: passes — The paper gives a reason why it holds.
It may state two separate claims as one.
None of the sources cited for this claim have been checked yet.
In the paper
“In neural circuits where cell types have been well studied by anatomical and physiological methods, there is an excellent correspondence between cell types defined by transcriptomes and the classical methods (Li et al., 2017; Shekhar et al., 2016).”
§ Single-cell transcriptomes and whole-brain projections of serotonin neurons in the mouse dorsal and median raphe nuclei > Introduction
What the sources say
- Not checked yetcites Li et al., 2017
- Not checked yetcites Shekhar et al., 2016 source
boostedcorrelational- Asserted: passes — The authors put it forward as true.
- Checkable: passes — It can be checked against evidence.
- Load-bearing: fails — The paper’s conclusions may not depend on it.
- Based: passes — The paper gives a reason why it holds.
Probably not a substantial claim. The paper’s conclusions may not depend on it.
In the paper
“Serotonin neurons in the central nervous system are spatially clustered in the brainstem, originally designated as groups B1–B9 (Dahlström and Fuxe, 1964).”
§ Single-cell transcriptomes and whole-brain projections of serotonin neurons in the mouse dorsal and median raphe nuclei > Introduction
What the sources say
- Not checked yetcites Dahlström and Fuxe, 1964
plain- Asserted: passes — The authors put it forward as true.
- Checkable: passes — It can be checked against evidence.
- Load-bearing: fails — The paper’s conclusions may not depend on it.
- Based: passes — The paper gives a reason why it holds.
Probably not a substantial claim. The paper’s conclusions may not depend on it.
In the paper
“Collectively,~12,000 serotonin neurons from the DR and MR in mice (~0.015% of all CNS neurons) innervate the entire forebrain (Ishimura et al., 1988) and modulate diverse physiological and behavioral functions.”
§ Single-cell transcriptomes and whole-brain projections of serotonin neurons in the mouse dorsal and median raphe nuclei > Discussion
What the sources say
- Not checked yetcites Ishimura et al., 1988 source
plaindirect- Asserted: passes — The authors put it forward as true.
- Checkable: passes — It can be checked against evidence.
- Load-bearing: fails — The paper’s conclusions may not depend on it.
- Based: passes — The paper gives a reason why it holds.
Probably not a substantial claim. The paper’s conclusions may not depend on it. It may state two separate claims as one.
In the paper
“The MR serotonin neurons derive from three separate rhombomeres (R1–R3), and Okaty et al. sampled these three populations separately, allowing us to ask the question of whether developmental origins correspond to transcriptomic clusters in adult.”
§ Single-cell transcriptomes and whole-brain projections of serotonin neurons in the mouse dorsal and median raphe nuclei > Discussion > Relationship between molecular identity and cell body distribution
What the sources say
- Not checked yetcites Okaty et al., 2015 source
plaincorrelational- Asserted: passes — The authors put it forward as true.
- Checkable: passes — It can be checked against evidence.
- Load-bearing: passes — The paper’s conclusions depend on it.
- Based: passes — The paper gives a reason why it holds.
It may state two separate claims as one.
In the paper
“By searching Allen Brain Institute development brain database and using multiplex fluorescent in situ hybridization (ML-FISH), Kast et al. (2017) found that the cDR expressed distinct gene markers comparing to pDR, and tracing from these neurons showed cDR was different from the MR and DR in efferent innervation.”
§ Single-cell transcriptomes and whole-brain projections of serotonin neurons in the mouse dorsal and median raphe nuclei > Discussion > Relationship between molecular identity and cell body distribution
What the sources say
- Not checked yetcites Kast et al., 2017 source
plaincorrelational- Asserted: passes — The authors put it forward as true.
- Checkable: passes — It can be checked against evidence.
- Load-bearing: unclear — It is unclear whether the paper’s conclusions depend on it.
- Based: passes — The paper gives a reason why it holds.
It may state two separate claims as one.
In the paper
“The cDR has been suggested to be more similar to the MR than to the pDR in afferent innervation (Commons, 2015).”
§ Single-cell transcriptomes and whole-brain projections of serotonin neurons in the mouse dorsal and median raphe nuclei > Discussion > Relationship between molecular identity and cell body distribution
What the sources say
- Not checked yetcites Commons, 2015 source
hedgedcorrelational- Asserted: passes — The authors put it forward as true.
- Checkable: passes — It can be checked against evidence.
- Load-bearing: fails — The paper’s conclusions may not depend on it.
- Based: passes — The paper gives a reason why it holds.
Probably not a substantial claim. The paper’s conclusions may not depend on it.
In the paper
“In our previous study, we characterized two projection-defined parallel DR serotonin sub-systems.”
§ Single-cell transcriptomes and whole-brain projections of serotonin neurons in the mouse dorsal and median raphe nuclei > Discussion > Relationship between molecular identity and projection-defined serotonin sub-systems
What the sources say
- Not checked yetcites Ren et al., 2018 source
plain- Asserted: passes — The authors put it forward as true.
- Checkable: passes — It can be checked against evidence.
- Load-bearing: passes — The paper’s conclusions depend on it.
- Based: passes — The paper gives a reason why it holds.
Probably not a substantial claim.
In the paper
“We found that serotonin neurons that project to the orbitofrontal cortex (OFC) and central amygdala (CeA) differ in input and output patterns, physiological response properties, and behavioral functions (Ren et al., 2018).”
§ Single-cell transcriptomes and whole-brain projections of serotonin neurons in the mouse dorsal and median raphe nuclei > Discussion > Relationship between molecular identity and projection-defined serotonin sub-systems
What the sources say
- Not checked yetcites Ren et al., 2018 source
plaincorrelational- Asserted: passes — The authors put it forward as true.
- Checkable: passes — It can be checked against evidence.
- Load-bearing: passes — The paper’s conclusions depend on it.
- Based: passes — The paper gives a reason why it holds.
It may state two separate claims as one.
A conclusion the paper draws from its own results — it cites no other source for it, so there is none to check. The quote shows it is in the paper.
In the paper
“Compared to droplet-based platform of the two studies, our FACS-based scRNA-seq platform allowed more sequencing depth per cell (Figure 1—figure supplement 1B) and sequencing larger number of cells, accounting for our finer classification of transcriptomic types of serotonin neurons.”
§ Single-cell transcriptomes and whole-brain projections of serotonin neurons in the mouse dorsal and median raphe nuclei > Discussion > Relationship between molecular identity and cell body distribution
plaindirect- Asserted: passes — The authors put it forward as true.
- Checkable: passes — It can be checked against evidence.
- Load-bearing: passes — The paper’s conclusions depend on it.
- Based: passes — The paper gives a reason why it holds.
It may state two separate claims as one.
A conclusion the paper draws from its own results — it cites no other source for it, so there is none to check. The quote shows it is in the paper.
In the paper
“However, our single-cell reconstruction of DR serotonin neurons revealed many more than six branching patterns (e.g., Figure 8G), indicating that there must be diverse collateralization patterns even within the same transcriptomic cluster, and highlighting the complexity of individual serotonin neuron projections.”
§ Single-cell transcriptomes and whole-brain projections of serotonin neurons in the mouse dorsal and median raphe nuclei > Discussion > Insights from single-cell reconstruction
hedgeddirect- Asserted: passes — The authors put it forward as true.
- Checkable: passes — It can be checked against evidence.
- Load-bearing: passes — The paper’s conclusions depend on it.
- Based: passes — The paper gives a reason why it holds.
It may state two separate claims as one.
In the paper
“These data support and extend our previous finding (Ren et al., 2018) for the preferential ventral pDR location of Vglut3+ serotonin neurons, which is highly expressed in DR-4 and DR-5 clusters.”
§ Single-cell transcriptomes and whole-brain projections of serotonin neurons in the mouse dorsal and median raphe nuclei > Discussion > Relationship between molecular identity and cell body distribution
What the sources say
- Not checked yetcites Ren et al., 2018 source
plaincorrelational- Asserted: passes — The authors put it forward as true.
- Checkable: passes — It can be checked against evidence.
- Load-bearing: unclear — It is unclear whether the paper’s conclusions depend on it.
- Based: passes — The paper gives a reason why it holds.
It may state two separate claims as one.
In the paper
“Because DR serotonin neurons derive exclusively from rhombomere 1 (R1), and the single-cell RNA-seq data was obtained from just 8 cells, the Okaty et al. dataset is limited in providing information about heterogeneity within DR serotonin neurons.”
§ Single-cell transcriptomes and whole-brain projections of serotonin neurons in the mouse dorsal and median raphe nuclei > Discussion > Relationship between molecular identity and cell body distribution
What the sources say
- Not checked yetcites Okaty et al., 2015 source
plaindirect- Asserted: passes — The authors put it forward as true.
- Checkable: passes — It can be checked against evidence.
- Load-bearing: unclear — It is unclear whether the paper’s conclusions depend on it.
- Based: passes — The paper gives a reason why it holds.
It may state two separate claims as one.
In the paper
“Forebrain-projecting serotonin neurons have been estimated to have very long axons based on the total serotonin fiber density and number of serotonin neurons (Wu et al., 2014).”
§ Single-cell transcriptomes and whole-brain projections of serotonin neurons in the mouse dorsal and median raphe nuclei > Results > Whole-brain axonal arborization patterns of individual serotonin neurons
What the sources say
- Not checked yetcites Wu et al., 2014
hedged- Asserted: passes — The authors put it forward as true.
- Checkable: passes — It can be checked against evidence.
- Load-bearing: fails — The paper’s conclusions may not depend on it.
- Based: passes — The paper gives a reason why it holds.
Probably not a substantial claim. The paper’s conclusions may not depend on it.
In the paper
“Given that CeA-projecting DR serotonin neurons do not innervate most of the hypothalamus (Ren et al., 2018), and Trh+ serotonin neurons only partially innervate CeA, these two populations are at most partially overlapping.”
§ Single-cell transcriptomes and whole-brain projections of serotonin neurons in the mouse dorsal and median raphe nuclei > Discussion > Relationship between molecular identity and projection-defined serotonin sub-systems
What the sources say
- Not checked yetcites Ren et al., 2018 source
plaincorrelational- Asserted: passes — The authors put it forward as true.
- Checkable: passes — It can be checked against evidence.
- Load-bearing: passes — The paper’s conclusions depend on it.
- Based: passes — The paper gives a reason why it holds.
It may state two separate claims as one.
None of the sources cited for this claim have been checked yet.
In the paper
“For example, several studies have reported that subgroups of serotonin neurons in the MR and DR express Vglut3 and indeed, subsequent slice recording confirmed that serotonin terminals can co-release glutamate and serotonin (Domonkos et al., 2016; Liu et al., 2014; Ren et al., 2018; Sengupta et al., 2017; Varga et al., 2009; Wang et al., 2019).”
§ Single-cell transcriptomes and whole-brain projections of serotonin neurons in the mouse dorsal and median raphe nuclei > Discussion > Integrating multiple features within individual serotonin sub-systems
What the sources say
plaincorrelational- Asserted: passes — The authors put it forward as true.
- Checkable: passes — It can be checked against evidence.
- Load-bearing: fails — The paper’s conclusions may not depend on it.
- Based: passes — The paper gives a reason why it holds.
Probably not a substantial claim. The paper’s conclusions may not depend on it. It may state two separate claims as one.
A conclusion the paper draws from its own results — it cites no other source for it, so there is none to check. The quote shows it is in the paper.
In the paper
“We have shown that the molecular features of these distinct serotonin groups reflect their anatomical organization and provide tools for future exploration of the full projection map of molecularly defined serotonin groups.”
§ Single-cell transcriptomes and whole-brain projections of serotonin neurons in the mouse dorsal and median raphe nuclei > Discussion > Integrating multiple features within individual serotonin sub-systems
boostedcorrelational- Asserted: passes — The authors put it forward as true.
- Checkable: passes — It can be checked against evidence.
- Load-bearing: passes — The paper’s conclusions depend on it.
- Based: passes — The paper gives a reason why it holds.
It may state two separate claims as one.
None of the sources cited for this claim have been checked yet.
In the paper
“While the reported projection and arborization complexity of individual DR neurons appear qualitatively similar to our findings, these studies cannot be directly compared because the Gagnon and Parent study did not validate the serotonin identity of individually traced DR neurons, which could include Tph2-negative long-distance projecting GABAergic and glutamatergic neurons (Bang and Commons, 2012”
§ Single-cell transcriptomes and whole-brain projections of serotonin neurons in the mouse dorsal and median raphe nuclei > Discussion > Insights from single-cell reconstruction
What the sources say
- Not checked yetcites Gagnon and Parent, 2014
- Not checked yetcites Bang and Commons, 2012
hedged- Asserted: passes — The authors put it forward as true.
- Checkable: passes — It can be checked against evidence.
- Load-bearing: passes — The paper’s conclusions depend on it.
- Based: passes — The paper gives a reason why it holds.
It may state two separate claims as one.
A conclusion the paper draws from its own results — it cites no other source for it, so there is none to check. The quote shows it is in the paper.
In the paper
“which suggests that these serotonin neurons use glutamate as co-transmitter in their cortical targets, and are in turn modulated by corticotropin-releasing hormone and neuropeptide Y.”
§ Single-cell transcriptomes and whole-brain projections of serotonin neurons in the mouse dorsal and median raphe nuclei > Discussion > Integrating multiple features within individual serotonin sub-systems
hedgeddirect- Asserted: passes — The authors put it forward as true.
- Checkable: passes — It can be checked against evidence.
- Load-bearing: unclear — It is unclear whether the paper’s conclusions depend on it.
- Based: passes — The paper gives a reason why it holds.
It may state two separate claims as one.
In the paper
“Our previous study suggests that DR serotonin sub-systems have biased input but segregated output (Ren et al., 2018).”
§ Single-cell transcriptomes and whole-brain projections of serotonin neurons in the mouse dorsal and median raphe nuclei > Discussion > Integrating multiple features within individual serotonin sub-systems
What the sources say
- Not checked yetcites Ren et al., 2018 source
hedgedcorrelational- Asserted: passes — The authors put it forward as true.
- Checkable: passes — It can be checked against evidence.
- Load-bearing: fails — The paper’s conclusions may not depend on it.
- Based: passes — The paper gives a reason why it holds.
Probably not a substantial claim. The paper’s conclusions may not depend on it.
A conclusion the paper draws from its own results — it cites no other source for it, so there is none to check. The quote shows it is in the paper.
In the paper
“In conclusion, our comprehensive transcriptomic dataset and identification of 11 distinct groups of the DR and MR serotonin neurons have revealed the molecular heterogeneity of the forebrain-projecting serotonin system.”
§ Single-cell transcriptomes and whole-brain projections of serotonin neurons in the mouse dorsal and median raphe nuclei > Discussion > Integrating multiple features within individual serotonin sub-systems
plaindirect- Asserted: passes — The authors put it forward as true.
- Checkable: passes — It can be checked against evidence.
- Load-bearing: passes — The paper’s conclusions depend on it.
- Based: passes — The paper gives a reason why it holds.
It may state two separate claims as one.
What the paper did — it cites no source for this, so there is none to check. The quote shows it is in the paper.
In the paper
“All procedures followed animal care and biosafety guidelines approved by Stanford University’s Administrative Panel on Laboratory Animal Care and Administrative Panel of Biosafety in accordance with NIH guidelines.”
§ Single-cell transcriptomes and whole-brain projections of serotonin neurons in the mouse dorsal and median raphe nuclei > Materials and methods > Animals
plain- Asserted: passes — The authors put it forward as true.
- Checkable: passes — It can be checked against evidence.
- Load-bearing: fails — The paper’s conclusions may not depend on it.
- Based: passes — The paper gives a reason why it holds.
Probably not a substantial claim. The paper’s conclusions may not depend on it.
What the paper did — it cites no source for this, so there is none to check. The quote shows it is in the paper.
In the paper
“The reconstructed neurons were checked by one another person.”
§ Single-cell transcriptomes and whole-brain projections of serotonin neurons in the mouse dorsal and median raphe nuclei > Materials and methods > Single Cell Reconstruction
plain- Asserted: passes — The authors put it forward as true.
- Checkable: passes — It can be checked against evidence.
- Load-bearing: fails — The paper’s conclusions may not depend on it.
- Based: passes — The paper gives a reason why it holds.
Probably not a substantial claim. The paper’s conclusions may not depend on it.
A conclusion the paper draws from its own results — it cites no other source for it, so there is none to check. The quote shows it is in the paper.
In the paper
“The molecular architecture of serotonin system lays the foundation for integrating anatomical, neurochemical, physiological, and behavioral functions.”
§ Single-cell transcriptomes and whole-brain projections of serotonin neurons in the mouse dorsal and median raphe nuclei > Discussion > Integrating multiple features within individual serotonin sub-systems
plaindirect- Asserted: passes — The authors put it forward as true.
- Checkable: fails — It may be too vague to check against evidence.
- Load-bearing: fails — The paper’s conclusions may not depend on it.
- Based: passes — The paper gives a reason why it holds.
Probably not a substantial claim. It may be too vague to check against evidence. The paper’s conclusions may not depend on it.
The paper relies on this without support.
The heterogeneity of DR and MR serotonin neurons must be reflected at the molecular level.
“Ultimately, the heterogeneity of DR and MR serotonin neurons must be reflected at the molecular level.”
The paper relies on this without support.
The DR contains approximately 9000 serotonin neurons.
“our study is still limited by the scope (50 reconstructed cells out of 9000 DR serotonin neurons).”
Claims other papers make about this one
Each is checked against this paper’s own text: does it say what the citing paper says it does?
In the citing paper
“Those in the dorsal raphe project widely throughout the cortex and increase or decrease their activity to reward and punish, respectively.76,78”
From Synaptic and circuit functions of multitransmitter neurons in the mammalian brain (2023) · cites this paper as [76]
Self-check
Percentages, sums and reported differences re-computed from the paper’s own numbers.
Each contradiction between two passages listed here was confirmed by an independent check.
Rated minor: it would not touch a result — a value no result rests on, a p-value that stays on the same side of the significance level, or a conflict that is clerical, resolved elsewhere in the paper, or outside its own findings.
In the paper
§ Single-cell transcriptomes and whole-brain projections of serotonin neurons in the mouse dorsal and median raphe nuclei > Results > Anatomical organization of transcriptomically defined serotonin clusters
“Slc17a8+ (also known as Vglut3, used hereafter)”
§ Single-cell transcriptomes and whole-brain projections of serotonin neurons in the mouse dorsal and median raphe nuclei > Materials and methods > Animals
“The Vglut3-Cre (also known as Slc18a8-Cre; JAX Strain 18147)”
Citations
Cites
STAR: ultrafast universal RNA-seq aligner
Dobin, A., Davis, C. A., Schlesinger, F., Drenkow, J., Zaleski, C., Jha, S., Batut, P., Chaisson, M., & Gingeras, T. R. (2013) · Bioinformatics · doi:10.1093/bioinformatics/bts635 · Cited by 51,709
HTSeq—a Python framework to work with high-throughput sequencing data
Anders, S., Pyl, P. T., & Huber, W. (2015) · Bioinformatics · doi:10.1093/bioinformatics/btu638 · Cited by 21,464 · cited 1×
“2 (Anders et al., 2015) with default parameters, except ‘stranded’ was set to ‘false’, and ‘mode’ was set to ‘intersection-nonempty’.”
Comprehensive Integration of Single-Cell Data
Stuart, T., Butler, A., Hoffman, P., Hafemeister, C., Papalexi, E., Mauck, W. M., Hao, Y., Stoeckius, M., Smibert, P., & Satija, R. (2019) · Cell · doi:10.1016/j.cell.2019.05.031 · Cited by 15,453
Integrating single-cell transcriptomic data across different conditions, technologies, and species
Butler, A., Hoffman, P., Smibert, P., Papalexi, E., & Satija, R. (2018) · Nature Biotechnology · doi:10.1038/nbt.4096 · Cited by 13,174
3D U-Net: Learning Dense Volumetric Segmentation from Sparse Annotation
Çiçek, Ö., Abdulkadir, A., Lienkamp, S. S., Brox, T., & Ronneberger, O. (2016) · Lecture Notes in Computer Science · doi:10.1007/978-3-319-46723-8_49 · Cited by 7,945
Highly parallel genome-wide expression profiling of individual cells using nanoliter droplets.
Macosko, E. Z., Basu, A., Satija, R., Nemesh, J., Shekhar, K., Goldman, M., Tirosh, I., Bialas, A. R., Kamitaki, N., Martersteck, E. M., et al. (2015) · Cell · doi:10.1016/j.cell.2015.05.002 · Cited by 7,110
A robust and high-throughput Cre reporting and characterization system for the whole mouse brain
Madisen, L., Zwingman, T. A., Sunkin, S. M., Oh, S. W., Zariwala, H. A., Gu, H., Ng, L. L., Palmiter, R. D., Hawrylycz, M. J., Jones, A. R., et al. (2010) · Nature Neuroscience · doi:10.1038/nn.2467 · Cited by 6,907 · cited 3×
“The Ai14 tdTomato Cre reporter mice (JAX Strain 7914) Ren et al. eLife 2019;8:e49424.”
BackgroundInfluentialFull-length RNA-seq from single cells using Smart-seq2
Picelli, S., Faridani, O. R., Björklund, Å. K., Winberg, G., Sagasser, S., & Sandberg, R. (2014) · Nature Protocols · doi:10.1038/nprot.2014.006 · Cited by 4,137 · cited 1×
“cDNA synthesis and library preparation were performed using the Smart-seq2 protocol (Picelli et al., 2014).”
MethodCell types in the mouse cortex and hippocampus revealed by single-cell RNA-seq
Zeisel, A., Muñoz-Manchado, A. B., Codeluppi, S., Lönnerberg, P., La Manno, G., Juréus, A., Marques, S., Munguba, H., He, L., Betsholtz, C., et al. (2015) · Science · doi:10.1126/science.aaa1934 · Cited by 3,124 · cited 1×
“…powerful tool for unbiased identification of transcriptomic cell types in the brain (Darmanis et al., 2015; Li et al., 2017; Mickelsen et al., 2019; Rosenberg et al., 2018; Saunders et al., 2018; Tasic et al., 2016; Tasic et al., 2018; Welch et al., 2019; Zeisel et al., 2018; Zeisel et al., 2015).”
MethodSingle-cell transcriptomics of 20 mouse organs creates a Tabula Muris
The Tabula Muris Consortium, coordination, O., coordination, L., processing, O. C. A., sequencing, L. P. A., analysis, C. D., annotation, C. T., Writing group, Supplemental text writing group, & Principal investigators (2018) · Nature · doi:10.1038/s41586-018-0590-4 · Cited by 2,842 · cited 3×
“Transcription factors Transcription factors (TFs) have been shown to be the best molecular feature for cell type definition (Schaum et al., 2018).”
BackgroundMethodInfluential
Research works printed but not linked: 1
- Çiçek, 2016, Medical Image Computing and Computer-Assisted Intervention – MICCAI 2016. MICCAI 2016. Lecture Notes in Computer Science, 9901
Cited by
Sorted by citations
A high-resolution transcriptomic and spatial atlas of cell types in the whole mouse brain
Yao, Z., van Velthoven, C. T. J., Kunst, M., Zhang, M., McMillen, D., Lee, C., Jung, W., Goldy, J., Abdelhak, A., Aitken, M., et al. (2023) · Nature · doi:10.1038/s41586-023-06812-z · Cited by 1,203
Molecularly defined and spatially resolved cell atlas of the whole mouse brain
Zhang, M., Pan, X., Jung, W., Halpern, A. R., Eichhorn, S. W., Lei, Z., Cohen, L., Smith, K. A., Tasic, B., Yao, Z., et al. (2023) · Nature · doi:10.1038/s41586-023-06808-9 · Cited by 531
“Serotonergic neurons were enriched in the raphe nuclei (dorsal nucleus raphe, nucleus raphe pontis and nucleus raphe magnus) in the midbrain and hindbrain 30 (Extended Data Fig.”
What is a cell type and how to define it?
Zeng, H. (2022) · Cell · doi:10.1016/j.cell.2022.06.031 · Cited by 439
Single-cell and spatial transcriptomics: deciphering brain complexity in health and disease
Piwecka, M., Rajewsky, N., & Rybak-Wolf, A. (2023) · Nature Reviews Neurology · doi:10.1038/s41582-023-00809-y · Cited by 320
Population-scale single-cell RNA-seq profiling across dopaminergic neuron differentiation
Jerber, J., Seaton, D. D., Cuomo, A. S. E., Kumasaka, N., Haldane, J., Steer, J., Patel, M. J., Pearce, D., Andersson, M. H. L., Bonder, M. J., et al. (2021) · Nature Genetics · doi:10.1038/s41588-021-00801-6 · Cited by 293
Metadata
- Authors
- Ren, J., Isakova, A., Friedmann, D., Zeng, J., Grutzner, S. M., Pun, A., Zhao, G. Q., Kolluru, S. S., Wang, R., Lin, R., Li, P., Li, A., Raymond, J. L., Luo, Q., Luo, M., Quake, S. R., & Luo, L.
- Affiliations
- Howard Hughes Medical Institute (US)
- Stanford University (US)
- National Institute of Biological Sciences, Beijing (CN)
- Stanford Medicine (US)
- Wuhan National Laboratory for Optoelectronics (CN)
- Chan Zuckerberg Biohub San Francisco (US)
- Corresponding author
- Ren, Jing
- Quake, Stephen R
- Luo, Liqun
- ORCID
- Venue
- eLife
- Publisher
- eLife Sciences Publications, Ltd
- Published
- 2019-10-24
- Volume
- 8
- ISSN
- 2050-084X (ISSN-L)
- PMC
- PMC6812963
- OpenAlex
- W2982239238
- Semantic Scholar
- 73c6ef27934225685f1623abe2f5530230da5ad5
- Cited by
- 304
- References
- 97
- Citations by year
- 2026: 32 · 2025: 52 · 2024: 50 · 2023: 59 · 2022: 42 · 2021: 41 · 2020: 25 · 2019: 2
- FWCI
- 9.10
- Type
- journal article
- Language
- en
- Open access
- gold
- doi.org
- Licence
- Locations
- eLife (publishedVersion, cc-by)
- bioRxiv (Cold Spring Harbor Laboratory) (acceptedVersion)
- PubMed Central (publishedVersion, cc-by)
- PubMed (publishedVersion)
- DOAJ (DOAJ: Directory of Open Access Journals) (submittedVersion, cc-by-sa)
- Funders
- National Institutes of Health (R01 NS104698, NS057488)
- National Science Foundation (NeuroNex)
- Ministry of Science and Technology of the People's Republic of China (2015BAI08B02)
- National Natural Science Foundation of China (91432114, 91632302)
- Beijing Municipal Government
- NSFC (61721092, 81827901)
- Swiss National Science Foundation (PostDoc Mobility Fellowship)
- Topics
- Life Sciences › Biochemistry, Genetics and Molecular Biology › Molecular Biology › Single-cell and spatial transcriptomics
- Life Sciences › Neuroscience › Cellular and Molecular Neuroscience › Neuroscience and Neuropharmacology Research
- Life Sciences › Neuroscience › Cellular and Molecular Neuroscience › Neurotransmitter Receptor Influence on Behavior
- Keywords
- serotonergic neurons, dorsal raphe nucleus, median raphe nucleus, single-cell transcriptomics, neuronal heterogeneity, VGLUT3, thyrotropin-releasing hormone, hypothalamus, neuropeptides, single-neuron reconstruction, mice
- MeSH terms
- Animals, Brain Mapping, Neural Pathways, Raphe Nuclei, Sequence Analysis, RNA, Mice, Single-Cell Analysis, Serotonergic Neurons, Transcriptome
About these checks
Registry, retraction, Cites and statistics results are computed, not judged, with one exception: a printed reference that no index lists is read once by a model before it counts as a citation error. Claims are extracted by a model and kept only when their quote appears verbatim in the text; each cited source is then checked, with a model’s help, for whether it says what the claim relies on. Those verdicts can be wrong — read the claim’s quote and the cited source before relying on one.
A language model drew the claims from the paper on 2026-10-09, under version 3 of the claim definition (model deepseek-v4.1-flash, prompt extract-v3).
A second model labelled each claim on 2026-10-09 (model jev-1.13-20260917, definition revision gold-guideline-v0.2).
Statistics and arithmetic are recomputed, not judged.
Confidence bands are shown only for fields calibrated on our annotated test set. None is calibrated yet, so no band is shown.
What counts as a claim ›How we measure confidence ›How we check this ›
Are you an author, or do you see a problem with this page? Request a review
