

The DOI matches its Crossref record; 186 of the 186 references it cites were found in a registry or an index.
Expandable and reversible copy number amplification drives rapid adaptation to antifungal drugs
Open accessAbstract
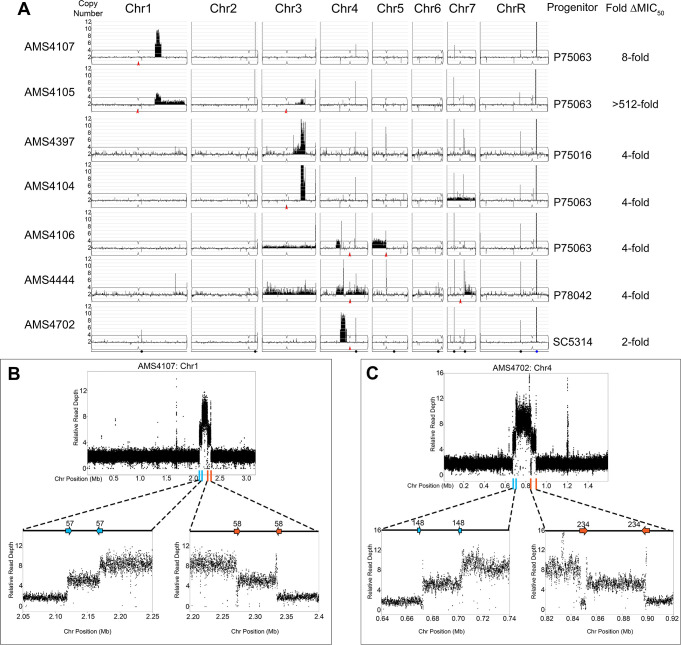
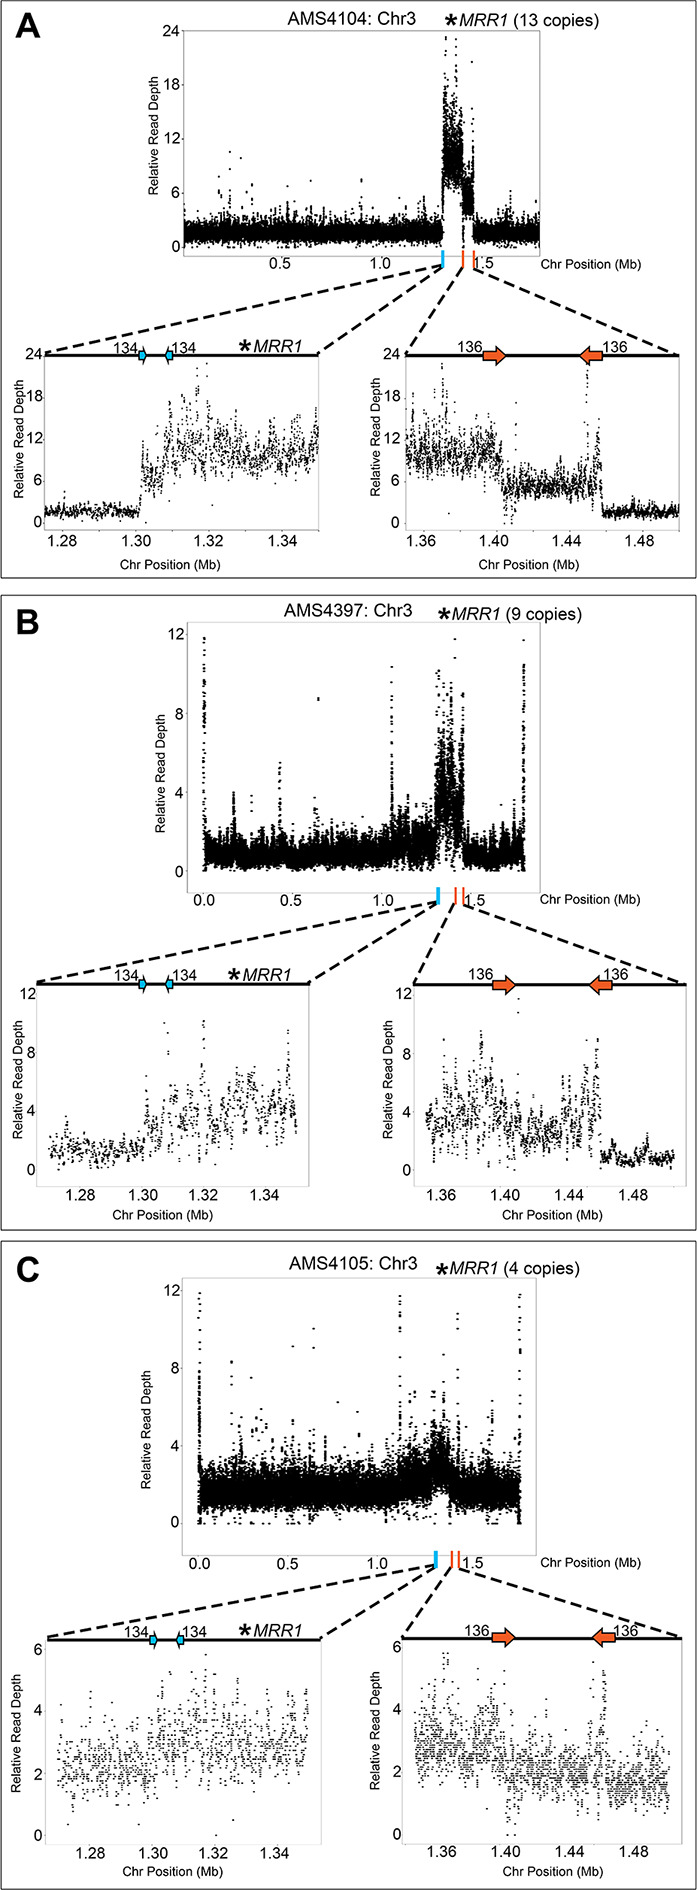
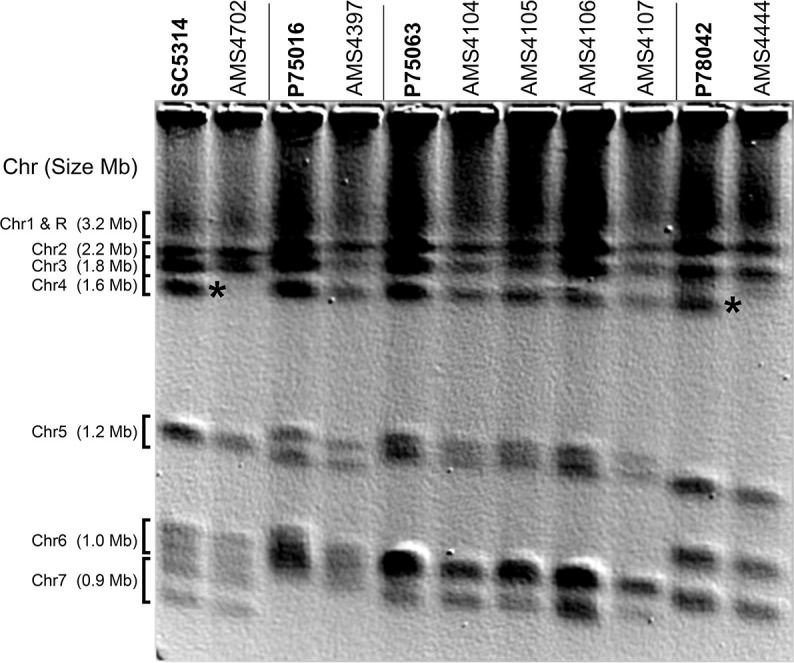
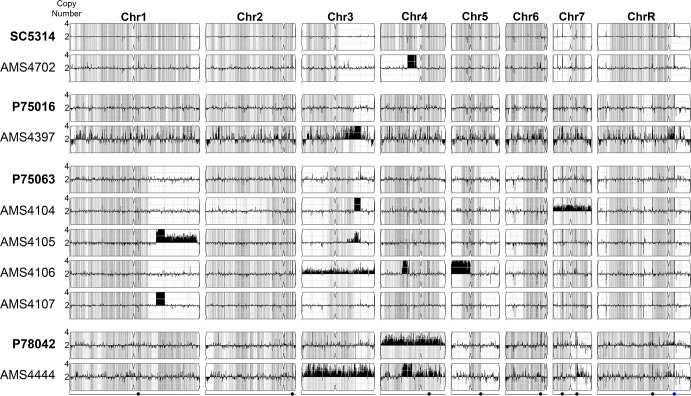
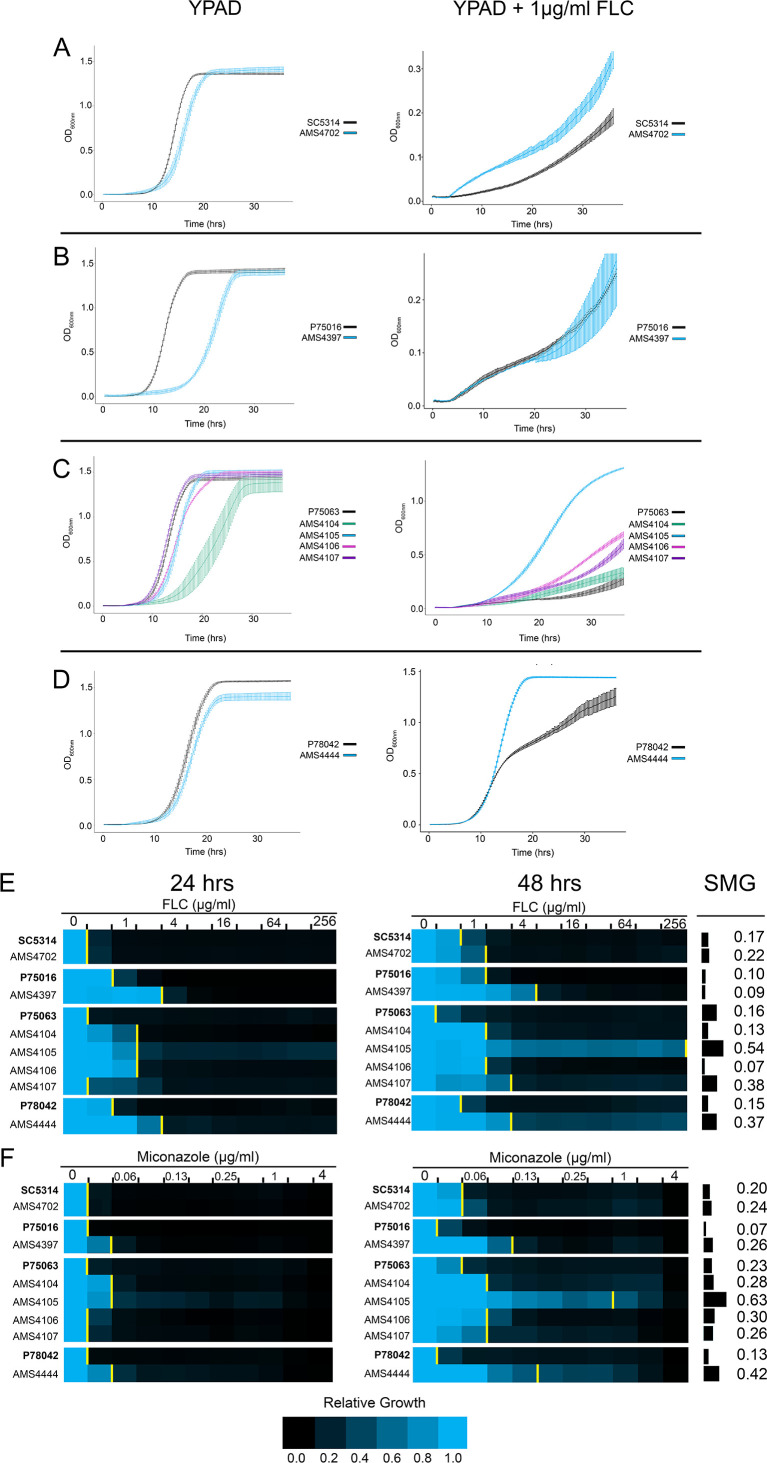
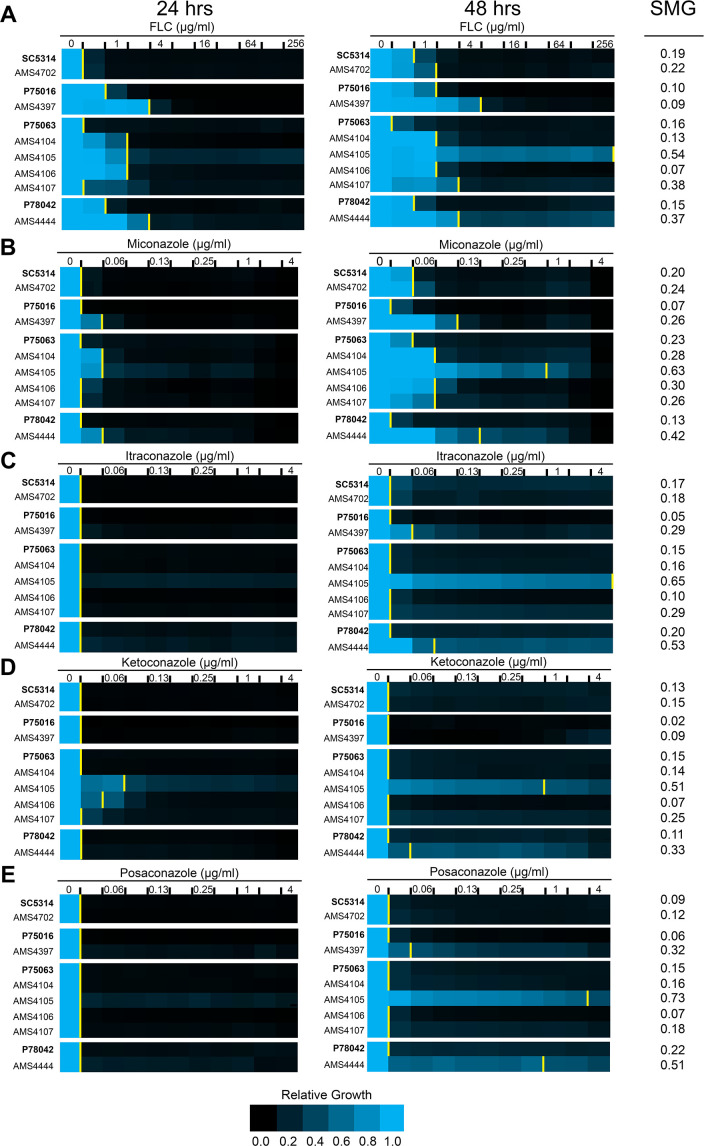
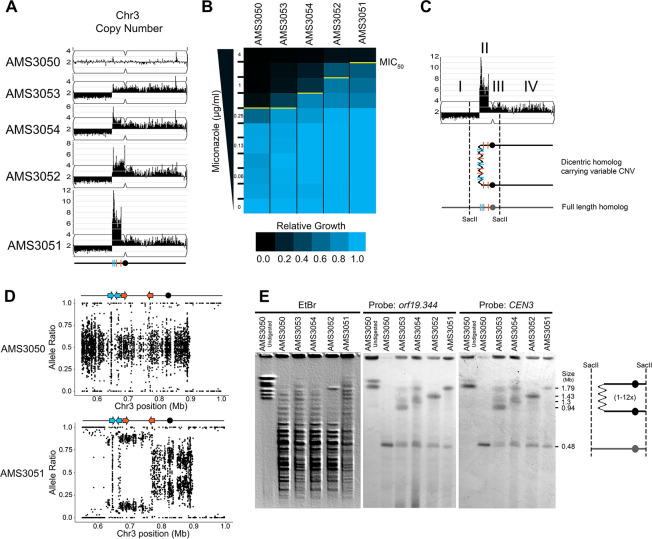
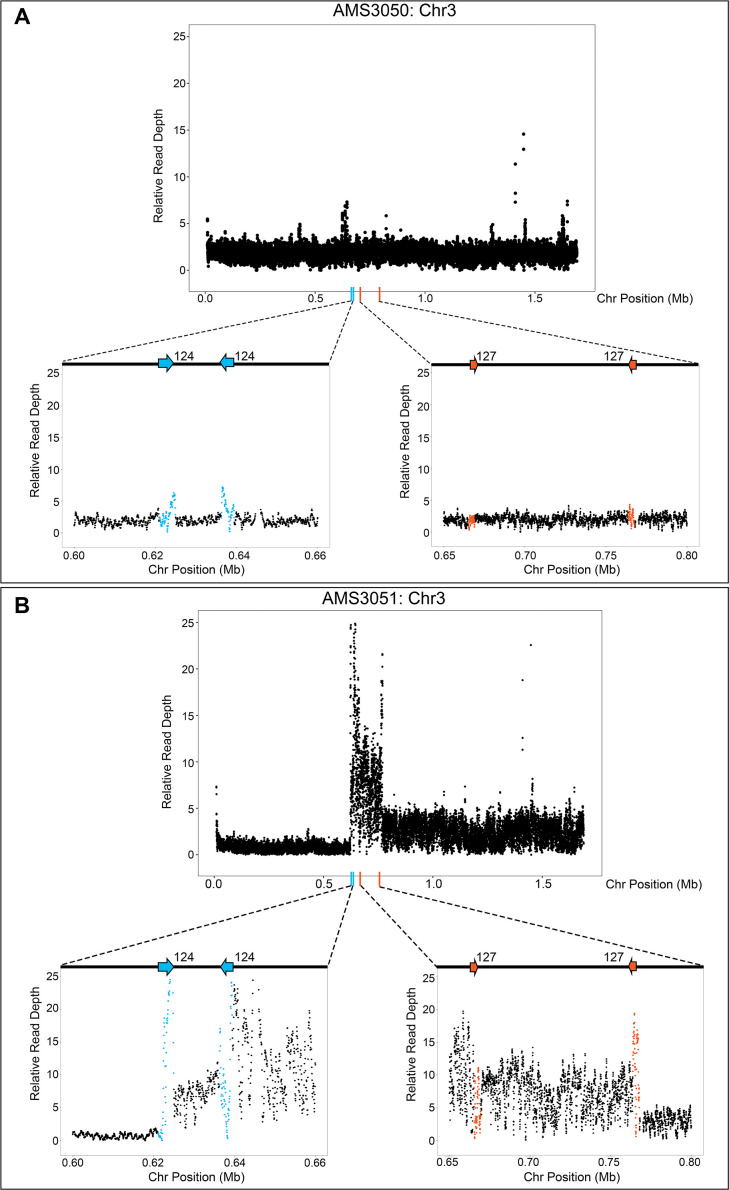
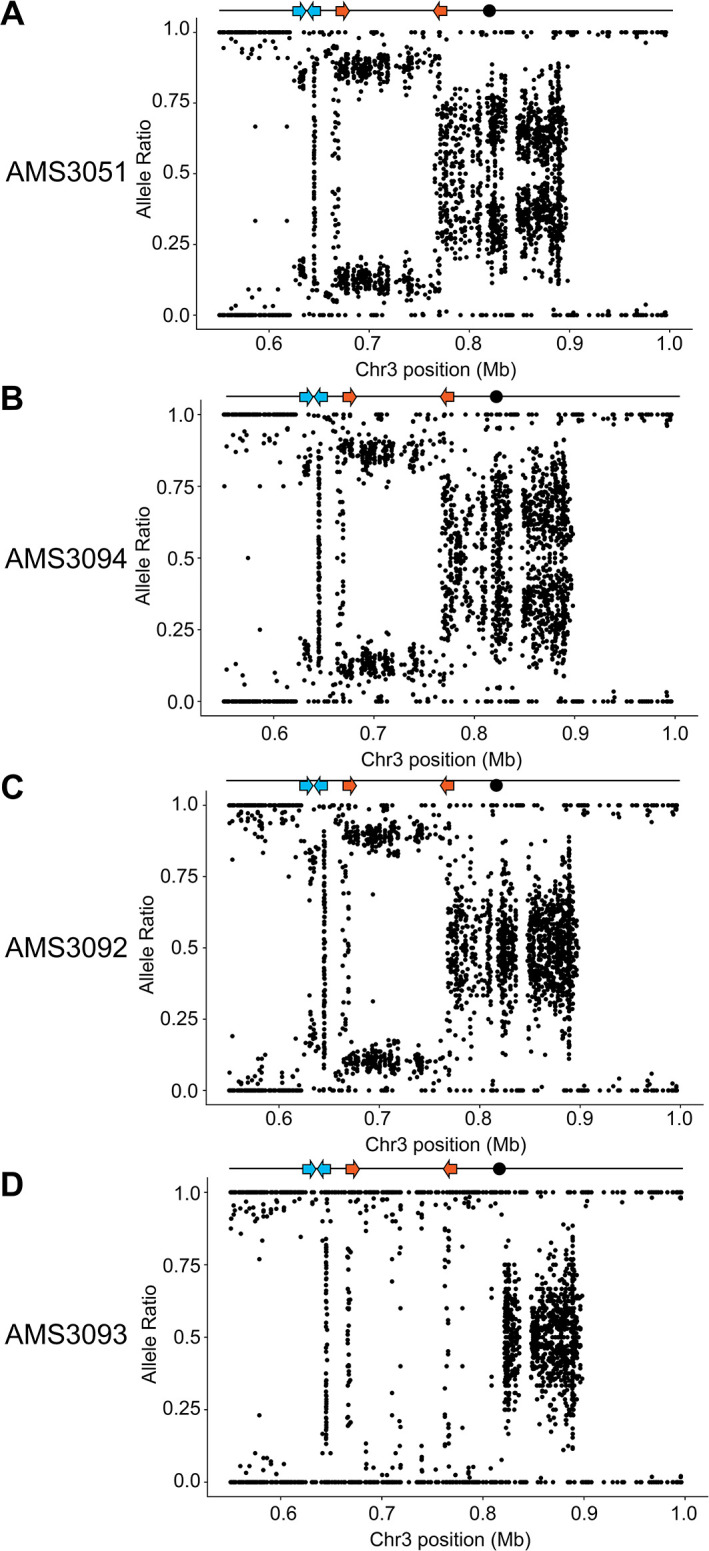
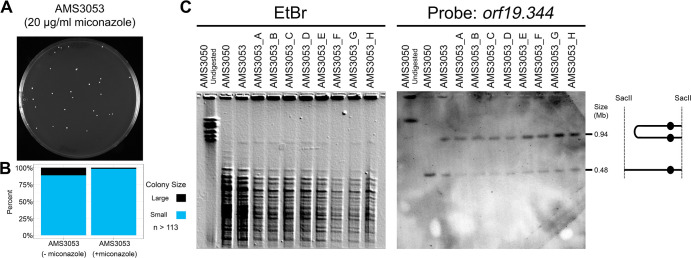
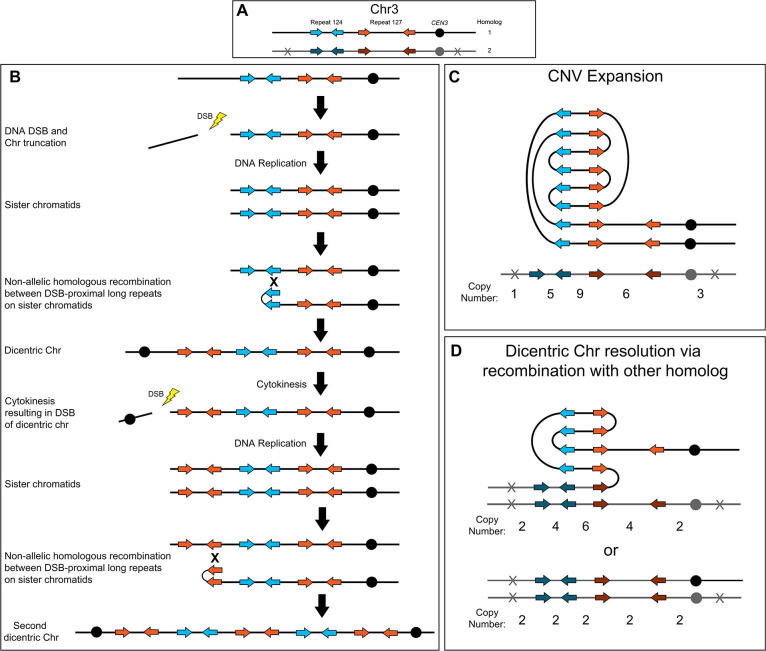
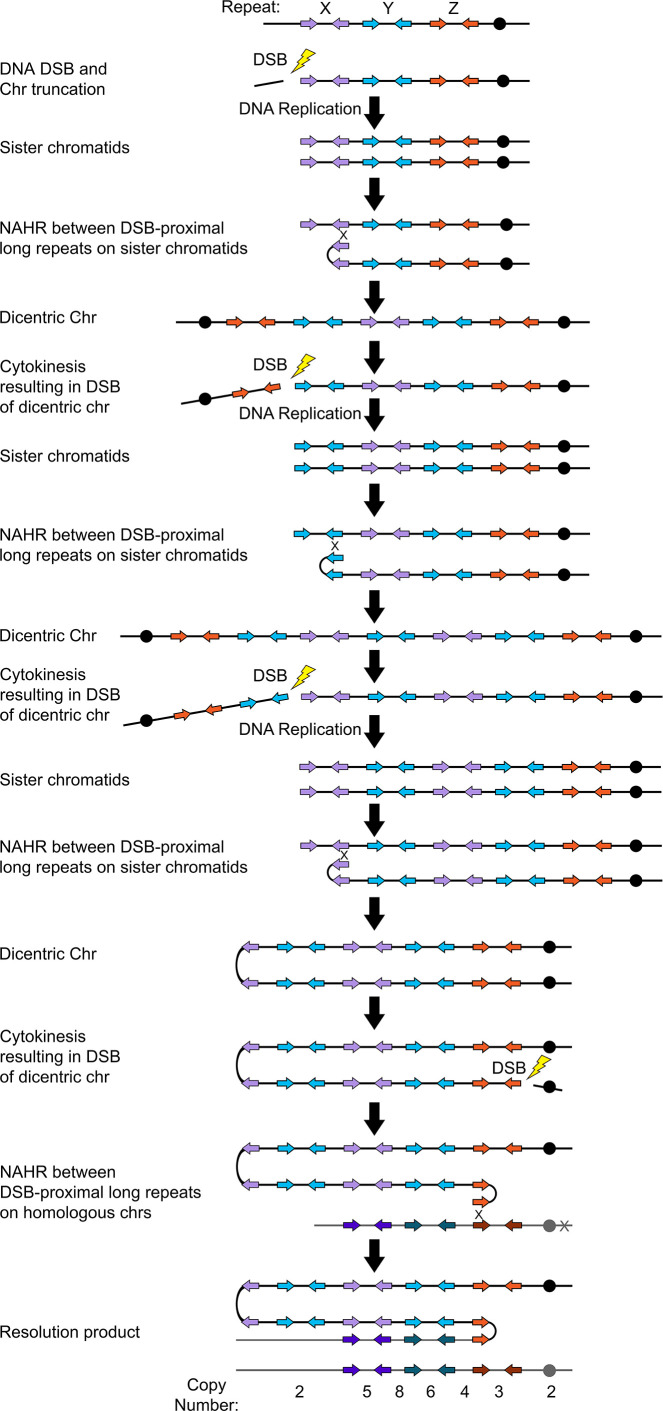
Previously, we identified long repeat sequences that are frequently associated with genome rearrangements, including copy number variation (CNV), in many diverse isolates of the human fungal pathogen Candida albicans (Todd et al., 2019). Here, we describe the rapid acquisition of novel, high copy number CNVs during adaptation to azole antifungal drugs. Single-cell karyotype analysis indicates that these CNVs appear to arise via a dicentric chromosome intermediate and breakage-fusion-bridge cycles that are repaired using multiple distinct long inverted repeat sequences. Subsequent removal of the antifungal drug can lead to a dramatic loss of the CNV and reversion to the progenitor genotype and drug susceptibility phenotype. These findings support a novel mechanism for the rapid acquisition of antifungal drug resistance and provide genomic evidence for the heterogeneity frequently observed in clinical settings.
Overview
The claims and statistics of this paper haven’t been checked yet.
Run the check — free, no account needed. It reads the open-access text and checks the sources it cites.
Integrity signals
Registry
Cites
Statistics
Figures
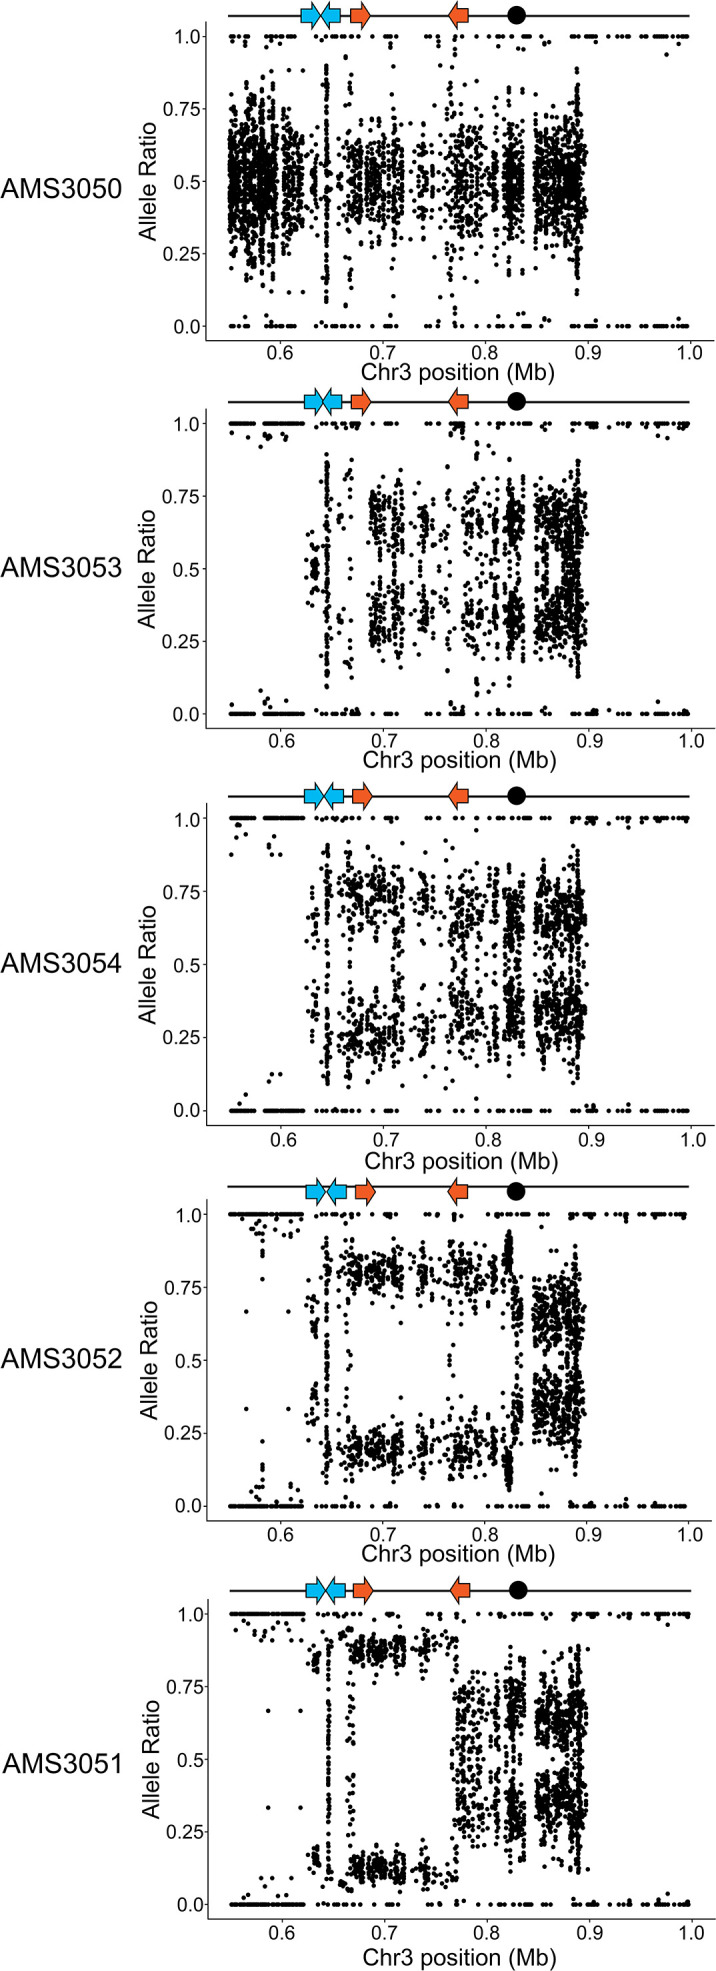
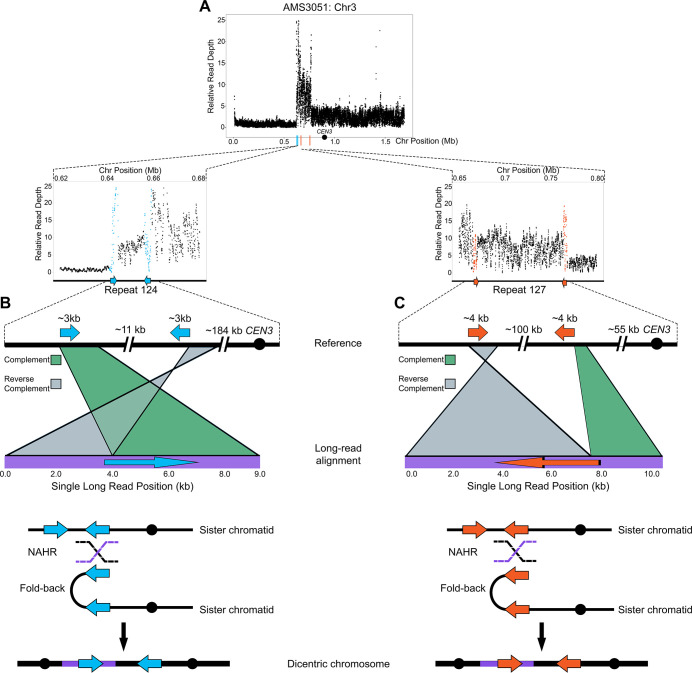
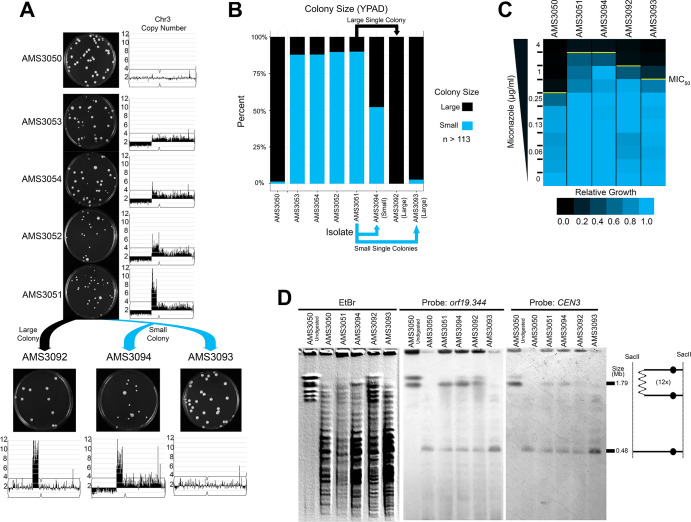
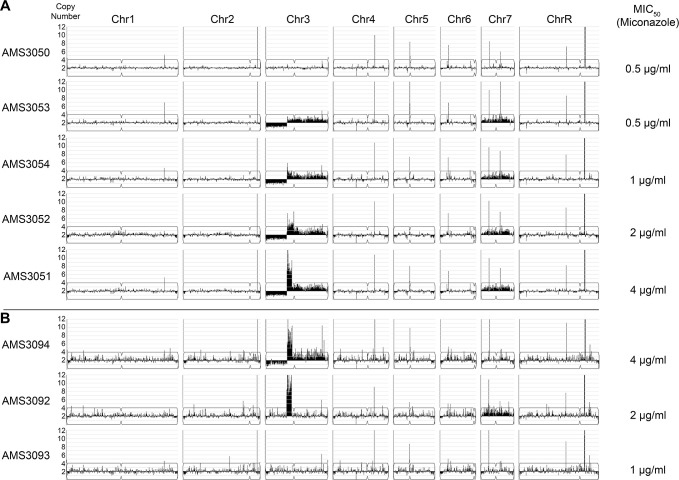
Verification
Claims the paper makes
The claims and statistics of this paper haven’t been checked yet.
Run the check — free, no account needed. It reads the open-access text and checks the sources it cites.
Claims other papers make about this one
Each is checked against this paper’s own text: does it say what the citing paper says it does?
The source backs part of the claim, not all of it — or backs it for a different population, condition or comparison.
In the citing paper
“In vitro evolution during fluconazole exposure is relatively slow, compared to C. albicans, and mainly composed of a single nucleotide polymorphism (SNP), with aneuploidy a minority effect [135,136].”
From Insight into the Mechanisms and Clinical Relevance of Antifungal Heteroresistance (2025) · cites this paper as [135]
Experimental — accuracy not yet measuredThe cited source says what the claim attributes to it.
In the citing paper
“Under fluconazole exposure, C. albicans rapidly evolves CNVs and aneuploidy in vitro [135].”
From Insight into the Mechanisms and Clinical Relevance of Antifungal Heteroresistance (2025) · cites this paper as [135]
In the citing paper
“These complex CNVs are flanked by distinct long inverted repeat sequences and are found across the genome, often containing genes associated with drug resistance68.”
From Molecular mechanisms governing antifungal drug resistance (2023) · cites this paper as [68]
In the citing paper
“Another significant source of genomic diversity that drives the rapid acquisition of azole resistance in C. albicans involves extensive copy number variations (CNVs), which amplify large genomic regions68.”
From Molecular mechanisms governing antifungal drug resistance (2023) · cites this paper as [68]
In the citing paper
“our results suggest that GRs and CNVs around these genes are related to drug resistance, as previously proposed in C. albicans.36”
From Narrow mutational signatures drive acquisition of multidrug resistance in the fungal pathogen Candida glabrata (2021) · cites this paper as [36]
In the citing paper
“Intriguingly, our recent experiments demonstrate that azole tolerance and cross-tolerance to different azole drugs can evolve rapidly in vitro (Todd and Selmecki 2020; Kukurudz et al. 2022), yet the mechanisms that distinguish drug-resistant and drug-tolerant phenotypes in fungi are not fully characterized.”
From Antifungal Drug Concentration Impacts the Spectrum of Adaptive Mutations in Candida albicans (2023) · cites this paper as Todd and Selmecki 2020
In the citing paper
“The copy number breakpoints of all segmental aneuploidies occurred at long repeat sequences as described previously (Todd et al. 2019; Todd and Selmecki 2020).”
From Antifungal Drug Concentration Impacts the Spectrum of Adaptive Mutations in Candida albicans (2023) · cites this paper as Todd and Selmecki 2020
In the citing paper
“Todd and Selmecki (2020) did, however, identify 3 isolates evolved to FLC in an in vitro experiment that had increased copy number of a subset of efflux pump, multidrug transporters, and stress response genes on Chr3, leading to increased tolerance and resistance to several azoles.”
From Acquisition of cross-azole tolerance and aneuploidy in Candida albicans strains evolved to posaconazole (2022) · cites this paper as Todd and Selmecki (2020)
Self-check
Percentages, sums and reported differences re-computed from the paper’s own numbers.
The self-check needs the paper’s full text.
Citations
Cites
Fiji: an open-source platform for biological-image analysis
Schindelin, J., Arganda-Carreras, I., Frise, E., Kaynig, V., Longair, M., Pietzsch, T., Preibisch, S., Rueden, C., Saalfeld, S., Schmid, B., et al. (2012) · Nature Methods · doi:10.1038/nmeth.2019 · Cited by 66,890
Trimmomatic: a flexible trimmer for Illumina sequence data
Bolger, A. M., Lohse, M., & Usadel, B. (2014) · Bioinformatics · doi:10.1093/bioinformatics/btu170 · Cited by 65,548
The Sequence Alignment/Map format and SAMtools
Li, H., Handsaker, B., Wysoker, A., Fennell, T., Ruan, J., Homer, N., Marth, G., Abecasis, G., Durbin, R., & 1000 Genome Project Data Processing Subgroup (2009) · Bioinformatics · doi:10.1093/bioinformatics/btp352 · Cited by 62,041
The Genome Analysis Toolkit: A MapReduce framework for analyzing next-generation DNA sequencing data
McKenna, A., Hanna, M., Banks, E., Sivachenko, A., Cibulskis, K., Kernytsky, A., Garimella, K., Altshuler, D., Gabriel, S., Daly, M., et al. (2010) · Genome Research · doi:10.1101/gr.107524.110 · Cited by 27,895
Aligning sequence reads, clone sequences and assembly contigs with BWA-MEMPreprint
Li, H. (2013) · arXiv (Cornell University) · doi:10.48550/arxiv.1303.3997 · Cited by 10,846
Integrative Genomics Viewer (IGV): high-performance genomics data visualization and exploration
Thorvaldsdottir, H., Robinson, J. T., & Mesirov, J. P. (2013) · Briefings in Bioinformatics · doi:10.1093/bib/bbs017 · Cited by 9,049
Aligning sequence reads, clone sequences and assembly con*gs with BWA-MEMPreprint
Li, H. (2014) · arXiv (Cornell University) · doi:10.6084/m9.figshare.963153.v1 · Cited by 5,155
VarScan 2: Somatic mutation and copy number alteration discovery in cancer by exome sequencingPreprint
Koboldt, D. C., Zhang, Q., Larson, D. E., Shen, D., McLellan, M. D., Lin, L., Miller, C. A., Mardis, E. R., Ding, L., & Wilson, R. K. (2012) · Genome Research · doi:10.1101/gr.129684.111 · Cited by 4,954
Survey over image thresholding techniques and quantitative performance evaluation
Sezgin, M., & Sankur, B. (2004) · Journal of Electronic Imaging · doi:10.1117/1.1631315 · Cited by 4,630
The landscape of somatic copy-number alteration across human cancers
Beroukhim, R., Mermel, C. H., Porter, D., Wei, G., Raychaudhuri, S., Donovan, J., Barretina, J., Boehm, J. S., Dobson, J., Urashima, M., et al. (2010) · Nature · doi:10.1038/nature08822 · Cited by 4,017
Cited by
Sorted by citations
The Antifungal Pipeline: Fosmanogepix, Ibrexafungerp, Olorofim, Opelconazole, and Rezafungin
Hoenigl, M., Sprute, R., Egger, M., Arastehfar, A., Cornely, O. A., Krause, R., Lass-Flörl, C., Prattes, J., Spec, A., Thompson, G. R., et al. (2021) · Drugs · doi:10.1007/s40265-021-01611-0 · Cited by 467
Molecular mechanisms governing antifungal drug resistance
Lee, Y., Robbins, N., & Cowen, L. E. (2023) · npj Antimicrobials and Resistance · doi:10.1038/s44259-023-00007-2 · Cited by 304
The importance of antimicrobial resistance in medical mycology
Gow, N. A. R., Johnson, C., Berman, J. G., Coste, A. T., Cuomo, C. A., Perlin, D. S., Bicanic, T. A., Harrison, T. S., Wiederhold, N. P., Bromley, M., et al. (2022) · Nature Communications · doi:10.1038/s41467-022-32249-5 · Cited by 232
Candida albicans and Candida glabrata : global priority pathogens
Katsipoulaki, M., Stappers, M. H. T., Malavia-Jones, D., Brunke, S., Hube, B., & Gow, N. A. R. (2024) · Microbiology and Molecular Biology Reviews · doi:10.1128/mmbr.00021-23 · Cited by 180
Hoenigl, M., Arastehfar, A. A., Arendrup, M. C., Brüggemann, R. J. M., Carvalho, A., Chiller, T. M., Chen, W., Egger, M., Feys, S., Gangneux, J., et al. (2024) · Clinical Microbiology Reviews · doi:10.1128/cmr.00074-23 · Cited by 165
Ksiezopolska, E., Schikora-Tamarit, M. À., Beyer, R., Nunez-Rodriguez, J. C., Schüller, C., & Gabaldón, T. (2021) · Current Biology · doi:10.1016/j.cub.2021.09.084 · Cited by 107
Burrack, L. S., Todd, R. T., Soisangwan, N., Wiederhold, N. P., & Selmecki, A. (2022) · mBio · doi:10.1128/mbio.00842-22 · Cited by 82
Self-citationChromosomal instability and aneuploidy as causes of cancer drug resistance
Lukow, D. A., & Sheltzer, J. M. (2021) · Trends in cancer · doi:10.1016/j.trecan.2021.09.002 · Cited by 83
The Dynamic Fungal Genome: Polyploidy, Aneuploidy and Copy Number Variation in Response to Stress
Vande Zande, P., Zhou, X., & Selmecki, A. (2023) · Annual Review of Microbiology · doi:10.1146/annurev-micro-041320-112443 · Cited by 70
Self-citationUnderstanding the mechanisms of resistance to azole antifungals in Candida species
Li, Y., Hind, C. K., Furner-Pardoe, J., Sutton, J. M., & Rahman, K. M. (2025) · JAC-Antimicrobial Resistance · doi:10.1093/jacamr/dlaf106 · Cited by 70
Zhai, B., Liao, C., Jaggavarapu, S., Tang, Y., Rolling, T., Ning, Y., Sun, T., Bergin, S. A., Gjonbalaj, M., Miranda, E., et al. (2024) · Nature Medicine · doi:10.1038/s41591-024-03183-4 · Cited by 62
The population genetics of adaptation through copy number variation in a fungal plant pathogen
Stalder, L., Oggenfuss, U., Mohd‐Assaad, N., & Croll, D. (2022) · Molecular Ecology · doi:10.1111/mec.16435 · Cited by 57
Antifungal Drug Concentration Impacts the Spectrum of Adaptive Mutations in Candida albicans
Todd, R. T., Soisangwan, N., Peters, S., Kemp, B., Crooks, T., Gerstein, A., & Selmecki, A. (2023) · Molecular Biology and Evolution · doi:10.1093/molbev/msad009 · Cited by 53
Self-citationFan, X., Dai, R.-C., Zhang, S., Geng, Y.-Y., Kang, M., Guo, D.-W., Mei, Y.-N., Pan, Y.-H., Sun, Z.-Y., Xu, Y.-C., et al. (2023) · Nature Communications · doi:10.1038/s41467-023-43380-2 · Cited by 55
Recent gene selection and drug resistance underscore clinical adaptation across Candida species
Schikora-Tamarit, M. À., & Gabaldón, T. (2024) · Nature Microbiology · doi:10.1038/s41564-023-01547-z · Cited by 57
Mba, I. E., Nweze, E. I., Eze, E. A., & Anyaegbunam, Z. K. G. (2022) · Infection, Genetics and Evolution · doi:10.1016/j.meegid.2022.105256 · Cited by 46
Genetic variation in aneuploidy prevalence and tolerance across Saccharomyces cerevisiae lineages
da Costa, E. S. F., Hose, J., Bensasson, D., & Gasch, A. P. (2021) · Genetics · doi:10.1093/genetics/iyab015 · Cited by 44
Hoenigl, M., Sprute, R., Arastehfar, A. A., Perfect, J. R., Lass‐Flörl, C., Bellmann, R., Prattes, J., Thompson, G. R., Wiederhold, N. P., Al‐Obaidi, M. M., et al. (2022) · Expert Opinion on Investigational Drugs · doi:10.1080/13543784.2022.2086120 · Cited by 48
Bergin, S. A., Zhao, F., Ryan, A. P., Müller, C. A., Nieduszynski, C. A., Zhai, B., Rolling, T., Hohl, T. M., Morio, F., Scully, J., et al. (2022) · mBio · doi:10.1128/mbio.01777-22 · Cited by 44
Tralamazza, S. M., Gluck‐Thaler, E., Feurtey, A., & Croll, D. (2024) · Nature Communications · doi:10.1038/s41467-024-49913-7 · Cited by 47
Beyond resistance: antifungal heteroresistance and antifungal tolerance in fungal pathogens
Yang, F., & Berman, J. (2024) · Current Opinion in Microbiology · doi:10.1016/j.mib.2024.102439 · Cited by 42
Kukurudz, R. J., Chapel, M., Wonitowy, Q., Adamu Bukari, A.-R., Sidney, B., Sierhuis, R., & Gerstein, A. C. (2022) · G3 · doi:10.1093/g3journal/jkac156 · Cited by 35
The Role of Structural Variation in Adaptation and Evolution of Yeast and Other Fungi
Gorkovskiy, A., & Verstrepen, K. J. (2021) · Genes · doi:10.3390/genes12050699 · Cited by 44
Narayanan, A., Kumar, P., Chauhan, A., Kumar, M., Yadav, K., Banerjee, A., Sharma, R. D., Rudramurthy, S. M., Chakrabarti, A., Sanyal, K., et al. (2022) · mBio · doi:10.1128/mbio.03052-22 · Cited by 35
PerSVade: personalized structural variant detection in any species of interest
Schikora-Tamarit, M. À., & Gabaldón, T. (2022) · Genome biology · doi:10.1186/s13059-022-02737-4 · Cited by 37
Hu, T., Wang, S., Bing, J., Zheng, Q., Du, H., Li, C., Guan, Z., Bai, F., Nobile, C. J., Chu, H., et al. (2023) · International Journal of Antimicrobial Agents · doi:10.1016/j.ijantimicag.2023.107010 · Cited by 33
A synthetic peptide mimic kills Candida albicans and synergistically prevents infection
Schaefer, S., Vij, R., Sprague, J. L., Austermeier, S., Dinh, H., Judzewitsch, P. R., Müller‐Loennies, S., Silva, T. L., Seemann, E. A., Qualmann, B., et al. (2024) · Nature Communications · doi:10.1038/s41467-024-50491-x · Cited by 41
Using genomics to understand the mechanisms of virulence and drug resistance in fungal pathogens
Schikora-Tamarit, M. À., & Gabaldón, T. (2022) · Biochemical Society Transactions · doi:10.1042/bst20211123 · Cited by 30
Cell wall protein variation, break‐induced replication, and subtelomere dynamics in Candida glabrata
Xu, Z., Green, B., Benoit, N. E., Sobel, J. D., Schatz, M. C., Wheelan, S. J., & Cormack, B. P. (2021) · Molecular Microbiology · doi:10.1111/mmi.14707 · Cited by 28
Gervais, N. C., Bella, A. A. L., Wensing, L. F., Sharma, J., Acquaviva, V., Best, M. A., López, R. O. C., Fogal, M., Uthayakumar, D., Chavez, A., et al. (2022) · G3 Genes Genomes Genetics · doi:10.1093/g3journal/jkac301 · Cited by 27
Stolp, Z. D., Kulkarni, M., Liu, Y., Zhu, C., Jalisi, A., Lin, S., Casadevall, A., Cunningham, K. W., Pineda, F. J., Teng, X., et al. (2022) · Cell Reports · doi:10.1016/j.celrep.2022.110647 · Cited by 26
Avecilla, G., Chuong, J. N., Li, F., Sherlock, G., Gresham, D., & Ram, Y. (2022) · PLoS Biology · doi:10.1371/journal.pbio.3001633 · Cited by 34
Gallet, R., Mattia, J. D., Ravel, S., Zeddam, J.-L., Vitalis, R., Michalakis, Y., & Blanc, S. (2022) · Virus Evolution · doi:10.1093/ve/veac058 · Cited by 27
Scott, N. E., Erayil, S. E., Kline, S. E., & Selmecki, A. M. (2023) · Antimicrobial Agents and Chemotherapy · doi:10.1128/aac.00543-23 · Cited by 25
Self-citationAspergillus fumigatus Can Display Persistence to the Fungicidal Drug Voriconazole
Scott, J., Valero, C., Mato-López, Á., Donaldson, I. J., Roldán, A., Chown, H., Van Rhijn, N., Lobo-Vega, R., Gago, S., Furukawa, T., et al. (2023) · Microbiology Spectrum · doi:10.1128/spectrum.04770-22 · Cited by 24
Identification and characterization of mediators of fluconazole tolerance in Candida albicans
Delarze, E., Brandt, L., Trachsel, E., Patxot, M., Pralong, C., Maranzano, F., Chauvel, M., Legrand, M., Znaidi, S., Bougnoux, M.-E., et al. (2020) · Frontiers in Microbiology · doi:10.3389/fmicb.2020.591140 · Cited by 25
Challenges and pitfalls of inferring microbial growth rates from lab cultures
Ghenu, A., Marrec, L., & Bank, C. (2024) · Frontiers in Ecology and Evolution · doi:10.3389/fevo.2023.1313500 · Cited by 27
Branco, J., Ryan, A. P., Silva, A. P., Butler, G., Miranda, I. M., & Rodrigues, A. G. (2022) · Clinical Microbiology and Infection · doi:10.1016/j.cmi.2022.08.014 · Cited by 25
Adaptation dynamics between copy-number and point mutations
Tomanek, I., & Guet, C. C. (2022) · eLife · doi:10.7554/elife.82240 · Cited by 28
Dumeaux, V., Massahi, S., Bettauer, V., Mottola, A., Dukovny, A., Khurdia, S. S., Costa, A. C. B. P., Omran, R. P., Simpson, S., Xie, J. L., et al. (2023) · eLife · doi:10.7554/elife.81406 · Cited by 25
The Microevolution of Antifungal Drug Resistance in Pathogenic Fungi
Boyce, K. J. (2023) · Microorganisms · doi:10.3390/microorganisms11112757 · Cited by 26
Zhou, X., Hilk, A. L., Solis, N. V., Scott, N. E., Beach, A., Soisangwan, N., Billings, C. L., Burrack, L. S., Filler, S. G., & Selmecki, A. M. (2024) · Nature Microbiology · doi:10.1038/s41564-024-01795-7 · Cited by 20
Self-citationKeighley, C., Gall, M. L., van Hal, S. J., Halliday, C. L., Chai, L. Y. A., Chew, K. L., Biswas, C., Slavin, M. A., Meyer, W., Sintchenko, V., et al. (2022) · Journal of Fungi · doi:10.3390/jof8090896 · Cited by 24
The role of gene copy number variation in antimicrobial resistance in human fungal pathogens
Jay, A., Jordan, D., Gerstein, A. C., & Landry, C. R. (2025) · npj Antimicrobials and Resistance · doi:10.1038/s44259-024-00072-1 · Cited by 29
Fu, C., Davy, A., Holmes, S., Sun, S., Yadav, V., Gusa, A. A., Coelho, M. A., & Heitman, J. (2021) · PLoS Genetics · doi:10.1371/journal.pgen.1009935 · Cited by 21
Daneshnia, F., Floyd, D. J., Ryan, A. P., Ghahfarokhy, P. M., Ebadati, A., Jusuf, S., Munoz, J., Jeffries, N. E., Yvanovich, E., Apostolopoulou, A., et al. (2024) · Emerging Microbes & Infections · doi:10.1080/22221751.2024.2322655 · Cited by 22
Zande, P. V., Gautier, C., Kawar, N., Maufrais, C., Metzner, K., Wash, E., Beach, A. K., Bracken, R., Maciel, E. I., de Sá, N. P., et al. (2024) · PLoS Pathogens · doi:10.1371/journal.ppat.1012497 · Cited by 21
Self-citationArastehfar, A., Daneshnia, F., Floyd, D. J., Jeffries, N. E., Salehi, M., Perlin, D. S., Ilkit, M., Lass-Flöerl, C., & Mansour, M. K. (2024) · mBio · doi:10.1128/mbio.00072-24 · Cited by 19
Saada, A. A., Guo, W., Costa, A. B., Yang, J., Wang, J., & Lobachev, K. S. (2023) · Nucleic Acids Research · doi:10.1093/nar/gkad153 · Cited by 19
Min, K., Jannace, T. F., Si, H., Veeramah, K. R., Haley, J. D., & Konopka, J. B. (2021) · PLoS Pathogens · doi:10.1371/journal.ppat.1009861 · Cited by 18
Genomics insights of candidiasis: mechanisms of pathogenicity and drug resistance
Huang, X., Dong, Q., Zhou, Q., Fang, S., Xu, Y., Hu, L., Chen, J., Li, X. Y., Qin, H., Mu, D., et al. (2025) · Frontiers in Microbiology · doi:10.3389/fmicb.2025.1531543 · Cited by 22
Bergin, S. A., Doorley, L. A., Rybak, J. M., Wolfe, K. H., Butler, G., Cuomo, C. A., & Rogers, P. D. (2024) · Antimicrobial Agents and Chemotherapy · doi:10.1128/aac.01619-23 · Cited by 19
Pathogenic Fungal Sensing and Responses to Stressful Host Environments
Rapala, J. R., Anderson, F. M., Larkin, A., & O’Meara, T. R. (2025) · Annual Review of Microbiology · doi:10.1146/annurev-micro-051024-033116 · Cited by 17
How fungal multidrug transporters mediate hyper resistance through DNA amplification and mutation
Banerjee, A., Rahman, H., Prasad, R., & Golin, J. E. (2022) · Molecular Microbiology · doi:10.1111/mmi.14947 · Cited by 16
Multilevel Gene Expression Changes in Lineages Containing Adaptive Copy Number Variants
Spealman, P., de Santana, C., De, T., & Gresham, D. (2025) · Molecular Biology and Evolution · doi:10.1093/molbev/msaf005 · Cited by 16
Insight into the Mechanisms and Clinical Relevance of Antifungal Heteroresistance
Su, Y., Li, Y., Yi, Q., Xu, Y., Sun, T., & Li, Y. (2025) · Journal of Fungi · doi:10.3390/jof11020143 · Cited by 18
“In vitro evolution during fluconazole exposure is relatively slow, compared to C. albicans , and mainly composed of a single nucleotide polymorphism (SNP), with aneuploidy a minority effect [135,136].”
Evolutionary causes and consequences of gene duplication
Cisneros, A. F., Dibyachintan, S., Bédard, F., Aubé, S., Lemieux, P., & Landry, C. R. (2026) · Nature Reviews Genetics · doi:10.1038/s41576-026-00935-5 · Cited by 19
Spealman, P., De, T., Chuong, J. N., & Gresham, D. (2023) · Journal of Molecular Evolution · doi:10.1007/s00239-023-10102-7 · Cited by 16
Tibayrenc, M., & Ayala, F. J. (2021) · Advances in Parasitology/Advances in parasitology · doi:10.1016/bs.apar.2020.12.001 · Cited by 15
Unlocking the potential of experimental evolution to study drug resistance in pathogenic fungi
Jacobs, S., Boccarella, G., van den Berg, P., Dijck, P. V., & Carolus, H. (2024) · npj Antimicrobials and Resistance · doi:10.1038/s44259-024-00064-1 · Cited by 14
Späth, G. F., & Bussotti, G. (2021) · Nucleic Acids Research · doi:10.1093/nar/gkab1237 · Cited by 15
Experimental and in-host evolution of triazole resistance in human pathogenic fungi
Handelman, M., & Osherov, N. (2022) · Frontiers in Fungal Biology · doi:10.3389/ffunb.2022.957577 · Cited by 15
Oh, J., Jo, S., Park, K. W., Lee, E., Lee, S. H., Hwang, Y. S., Jeon, H. R., Ryu, Y., Yoon, H. J., Chun, S., et al. (2023) · Experimental & Molecular Medicine · doi:10.1038/s12276-023-00952-y · Cited by 13
The impact of phenotypic heterogeneity on fungal pathogenicity and drug resistance
Kozubowski, L., & Berman, J. G. (2025) · FEMS Microbiology Reviews · doi:10.1093/femsre/fuaf001 · Cited by 14
Copy number variation alters local and global mutational tolerancePreprint
Avecilla, G., Spealman, P., Matthews, J. C., Caudal, É., Schacherer, J., & Gresham, D. (2023) · Genome Research · doi:10.1101/gr.277625.122 · Cited by 14
Teixeira, M. D. M., Almeida‐Paes, R., Bernardes‐Engemann, A. R., Nicola, A. M., de Macedo, P. M., do Valle, A. C. F., Gutierrez‐Galhardo, M. C., Freitas, D. F. S., Barker, B. M., Matute, D. R., et al. (2022) · Fungal Genetics and Biology · doi:10.1016/j.fgb.2022.103743 · Cited by 12
Beekman, C. N., Cuomo, C. A., Bennett, R. J., & Ene, I. V. (2021) · G3 Genes Genomes Genetics · doi:10.1093/g3journal/jkab001 · Cited by 12
Todd, R. T., & Selmecki, A. M. (2023) · Methods in molecular biology · doi:10.1007/978-1-0716-3155-3_8 · Cited by 11
Self-citationEvolution and strain diversity advance exploration of Candida albicans biology
Anderson, M. Z., & Dietz, S. M. (2024) · mSphere · doi:10.1128/msphere.00641-23 · Cited by 11
Rizzo, M., Soisangwan, N., Vega, S. B. P., Price, R. J., Uyl, C., Iracane, E., Shaw, M., Soetaert, J., Selmecki, A. M., & Buscaino, A. (2022) · PLoS Genetics · doi:10.1371/journal.pgen.1010576 · Cited by 8
Self-citationHorizontal Gene Transfer in Fungi and Its Ecological Importance
Gonçalves, C., Hittinger, C. T., & Rokas, A. (2024) · The mycota · doi:10.1007/978-3-031-41648-4_3 · Cited by 9
Experimental evolution of drug resistance in human fungal pathogens
Gerstein, A. C., & Sethi, P. (2022) · Current Opinion in Genetics & Development · doi:10.1016/j.gde.2022.101965 · Cited by 9
Oggenfuss, U., Todd, R. T., Soisangwan, N., Kemp, B. R., Guyer, A., Beach, A., & Selmecki, A. M. (2024) · Genome Research · doi:10.1101/gr.279301.124 · Cited by 9
Self-citationA rapidly reversible mutation generates subclonal genetic diversity and unstable drug resistance
Dan, L., Li, Y., Chen, S., Liu, J., Wang, Y., Li, F., He, X., & Carey, L. B. (2021) · Proceedings of the National Academy of Sciences · doi:10.1073/pnas.2019060118 · Cited by 5
Heterogeneity of Candida bloodstream isolates in an academic medical center and affiliated hospitals
Scott, N. E., Wash, E., Zajac, C., Erayil, S. E., Kline, S. E., & Selmecki, A. M. (2025) · Microbiology Spectrum · doi:10.1128/spectrum.00464-25 · Cited by 6
Self-citationBeyer, R., Zangl, I., Seidl, B., Pap, I.-J., Lackner, M., Strauss, J., Willinger, B., & Schüller, C. (2025) · mSystems · doi:10.1128/msystems.00786-25 · Cited by 9
Zhai, B., Liao, C., Jaggavarapu, S., Tang, Y., Rolling, T., Ning, Y., Sun, T., Bergin, S. A., Gjonbalaj, M., Miranda, E., et al. (2022) · medRxiv · doi:10.1101/2022.05.29.22275734 · Cited by 7
Challenges and pitfalls of inferring microbial growth rates from lab culturesPreprint
Ghenu, A., Marrec, L., & Bank, C. (2022) · bioRxiv (Cold Spring Harbor Laboratory) · doi:10.1101/2022.06.24.497412 · Cited by 7
Drivers of diversification in fungal pathogen populations
Murante, D., & Hogan, D. A. (2024) · PLoS Pathogens · doi:10.1371/journal.ppat.1012430 · Cited by 7
Transcriptomic and proteomic ramifications of segmental amplification in Escherichia coli
Fritts, R. K., Ebmeier, C. C., & Copley, S. D. (2025) · Proceedings of the National Academy of Sciences · doi:10.1073/pnas.2422424122 · Cited by 8
Chauhan, A., Gow, N. A. R., & Prasad, R. (2026) · The Cell Surface · doi:10.1016/j.tcsw.2026.100168 · Cited by 6
Genetic and Epigenetic Mechanisms Underlying Reversible Adaptive Responses in Fungi
Dan, L., Liu, S., Qiang, Z., Ye, X., & Zhang, J. (2026) · Journal of Fungi · doi:10.3390/jof12050309 · Cited by 8
Ibe, C., Otu, A. A., & Pohl, C. H. (2025) · Expert Review of Anti-infective Therapy · doi:10.1080/14787210.2024.2448844 · Cited by 6
Li, K., Gong, J., Zheng, Q., Yang, L., Mei, X., Chen, J., Liao, G., & Liang, Y. (2022) · Frontiers in Oncology · doi:10.3389/fonc.2022.971546 · Cited by 6
Huang, J. T., Liu, S., & Cook, D. E. (2023) · Physiological and Molecular Plant Pathology · doi:10.1016/j.pmpp.2023.102006 · Cited by 6
Drug Resistance and Evolvability in an Emerging Human Fungal Pathogen
Billmyre, R. B. (2022) · mBio · doi:10.1128/mbio.01876-22 · Cited by 5
Recurrent copy number variations in the human fungal pathogen Candida parapsilosis
Selmecki, A. M. (2023) · mBio · doi:10.1128/mbio.00713-23 · Cited by 4
Self-citationThe putative error prone polymerase REV1 mediates DNA damage and drug resistance in Candida albicans
Agyare-Tabbi, M. R., Uthayakumar, D., Francis, D., Maroc, L., Grant, C., McQueen, P., Westmacott, G., Shaker, H., Skulska, I., Gagnon‐Arsenault, I., et al. (2024) · npj Antimicrobials and Resistance · doi:10.1038/s44259-024-00057-0 · Cited by 6
Ene, I. V., Hickman, M. A., & Gerstein, A. C. (2021) · Current Clinical Microbiology Reports · doi:10.1007/s40588-021-00171-x · Cited by 4
Aspergillus fumigatus can display persistence to the fungicidal drug voriconazolePreprint
Scott, J., Valero, C., Mato-López, Á., Donaldson, I. J., Roldán, A., Chown, H., van Rhijn, N., Lobo-Vega, R., Gago, S., Furukawa, T., et al. (2022) · bioRxiv (Cold Spring Harbor Laboratory) · doi:10.1101/2022.05.16.491816 · Cited by 4
Stress-driven emergence of heritable non-genetic drug resistancePreprint
Xie, J. L., Yin, S., Yang, T. S., Chandrasekher, K. A., Hanson, L., Kim, S. H., Esqueda, L., Hogan, C. A., Banaei, N., Round, J. L., et al. (2024) · Research Square · doi:10.1101/2024.12.20.629823 · Cited by 4
Sousa, G., Correia, I., & Bezerra, A. R. (2026) · Microorganisms · doi:10.3390/microorganisms14020273 · Cited by 3
АНТИЕВОЛЮЦІЙНА ТЕРАПІЯ: НОВИЙ ПІДХІД ДО ЛІКУВАННЯ ІНФЕКЦІЙНИХ ЗАХВОРЮВАНЬ
Мінухін, В. В., Kolotova, T., & Скляр, Н. І. (2023) · Інфекційні хвороби · doi:10.11603/1681-2727.2023.4.14241 · Cited by 3
Guo, Y., Dall’Ara, M., Baldo, D., Gilmer, D., & Ratti, C. (2024) · Journal of Virology · doi:10.1128/jvi.01410-24 · Cited by 3
Nywening, A. V., Thorn, H. I., Xie, J., Martín‐Vicente, A., Guruceaga, X., Ge, W., Gibbons, J. G., & Fortwendel, J. R. (2025) · Microbiology Spectrum · doi:10.1128/spectrum.00536-25 · Cited by 3
Fu, C., Xiong, E. H., Kupczok, L., Archambault, L. S., Wang, T. R. W., Holleran, C., Carruthers-Lay, D., Zhuang, T. X., Marcoccia, S., Zhang, H., et al. (2025) · PLoS Biology · doi:10.1371/journal.pbio.3003409 · Cited by 2
The Genome of the CTG(Ser1) Yeast Scheffersomyces stipitis Is Plastic
Vega, S. B. P., Armitage, A. D., Bates, H. J., Harrison, R. J., & Buscaino, A. (2021) · mBio · doi:10.1128/mbio.01871-21 · Cited by 3
Pai, C., Durley, S. C., Cheng, W., Chiang, N., Peters, J. A., Kasparek, T., Blaikley, E., Wee, B.-Y., Walker, C. A., Kearsey, S. E., et al. (2023) · Nucleic Acids Research · doi:10.1093/nar/gkad160 · Cited by 3
Bergin, S. A., Zhao, F., Ryan, A. P., Müller, C. A., Nieduszynski, C. A., Zhai, B., Rolling, T., Hohl, T. M., Morio, F., Scully, J., et al. (2021) · bioRxiv (Cold Spring Harbor Laboratory) · doi:10.1101/2021.12.16.473093 · Cited by 3
MAESTRO uncovers tandem paralog dynamics as a core driver of fungal stress adaptationPreprint
Hsieh, P.-H., Sasaki, Y., Yang, C.-I., Wu, Z., Steindorff, A. S., Haridas, S., Ke, J., Fatma, Z., Zhao, Z., Opulente, D. A., et al. (2025) · bioRxiv (Cold Spring Harbor Laboratory) · doi:10.1101/2025.08.29.673034 · Cited by 3
Metadata
- Authors
- Todd, R. T., & Selmecki, A.
- Affiliations
- University of Minnesota (US)
- Corresponding author
- Selmecki, Anna
- Venue
- eLife
- Publisher
- eLife Sciences Publications, Ltd
- Published
- 2020-07-20
- Volume
- 9
- ISSN
- 2050-084X (ISSN-L)
- PMC
- PMC7371428
- OpenAlex
- W3042508348
- Cited by
- 138
- References
- 184
- Citations by year
- 2026: 20 · 2025: 20 · 2024: 27 · 2023: 20 · 2022: 28 · 2021: 20 · 2020: 3
- FWCI
- 2.33
- Type
- journal article
- Language
- en
- Open access
- gold
- doi.org
- Licence
- Locations
- eLife (publishedVersion, cc-by)
- PubMed Central (publishedVersion, cc-by)
- PubMed (publishedVersion)
- DOAJ (DOAJ: Directory of Open Access Journals) (submittedVersion, cc-by-sa)
- Funders
- National Institute of Allergy and Infectious Diseases (AI143689)
- Nebraska Department of Health and Human Services (LB506-2017-55)
- Nebraska Established Program to Stimulate Competitive Research (First Award)
- National Center for Research Resources (COBRE P20RR018788 sub-award)
- Topics
- Health Sciences › Medicine › Infectious Diseases › Antifungal resistance and susceptibility
- Life Sciences › Biochemistry, Genetics and Molecular Biology › Molecular Biology › Fungal and yeast genetics research
- Life Sciences › Biochemistry, Genetics and Molecular Biology › Genetics › Genomic variations and chromosomal abnormalities
- Keywords
- Candida albicans, copy number variation, antifungal resistance, azole antifungals, breakage-fusion-bridge cycles, inverted repeats, drug sensitivity, genome rearrangement
- MeSH terms
- Adaptation, Biological, Antifungal Agents, Candida albicans, Genotype, Drug Resistance, Fungal, DNA Copy Number Variations, Single-Cell Analysis, Karyotype
About these checks
Registry, retraction, Cites and statistics results are computed, not judged, with one exception: a printed reference that no index lists is read once by a model before it counts as a citation error. Claims are extracted by a model and kept only when their quote appears verbatim in the text; each cited source is then checked, with a model’s help, for whether it says what the claim relies on. Those verdicts can be wrong — read the claim’s quote and the cited source before relying on one.
Statistics and arithmetic are recomputed, not judged.
Confidence bands are shown only for fields calibrated on our annotated test set. None is calibrated yet, so no band is shown.
What counts as a claim ›How we measure confidence ›How we check this ›
Are you an author, or do you see a problem with this page? Request a review
