

The DOI matches its Crossref record; 32 of the 32 references it cites were found in a registry or an index.
A Single-Cell Transcriptomic Analysis of the Mouse Hippocampus After Voluntary Exercise
Published version of a preprint
Abstract
Exercise has been recognized as a beneficial factor for cognitive health, particularly in relation to the hippocampus, a vital brain region responsible for learning and memory. Previous research has demonstrated that exercise-mediated improvement of learning and memory in humans and rodents correlates with increased adult neurogenesis and processes related to enhanced synaptic plasticity. Nevertheless, the underlying molecular mechanisms are not fully understood. With the aim to further elucidate these mechanisms, we provide a comprehensive dataset of the mouse hippocampal transcriptome at the single-cell level after 4 weeks of voluntary wheel-running. Our analysis provides a number of interesting observations. For example, the results suggest that exercise affects adult neurogenesis by accelerating the maturation of a subpopulation of Prdm16 -expressing neurons. Moreover, we uncover the existence of an intricate crosstalk among multiple vital signaling pathways such as NF-κB, Wnt/β-catenin, Notch, and retinoic acid (RA) pathways altered upon exercise in a specific cluster of excitatory neurons within the Cornu Ammonis (CA) region of the hippocampus. In conclusion, our study provides an important resource dataset and sheds further light on the molecular changes induced by exercise in the hippocampus. These findings have implications for developing targeted interventions aimed at optimizing cognitive health and preventing age-related cognitive decline.
Overview
The claims and statistics of this paper haven’t been checked yet.
Run the check — free, no account needed. It reads the open-access text and checks the sources it cites.
Integrity signals
Registry
Cites
Statistics
Figures
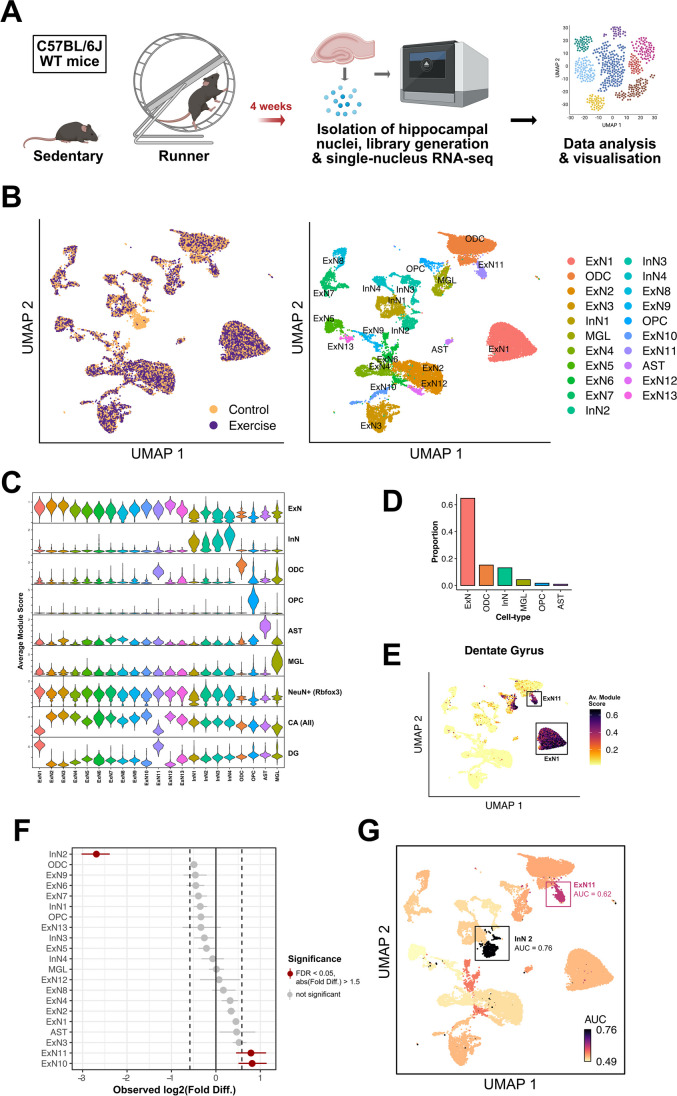
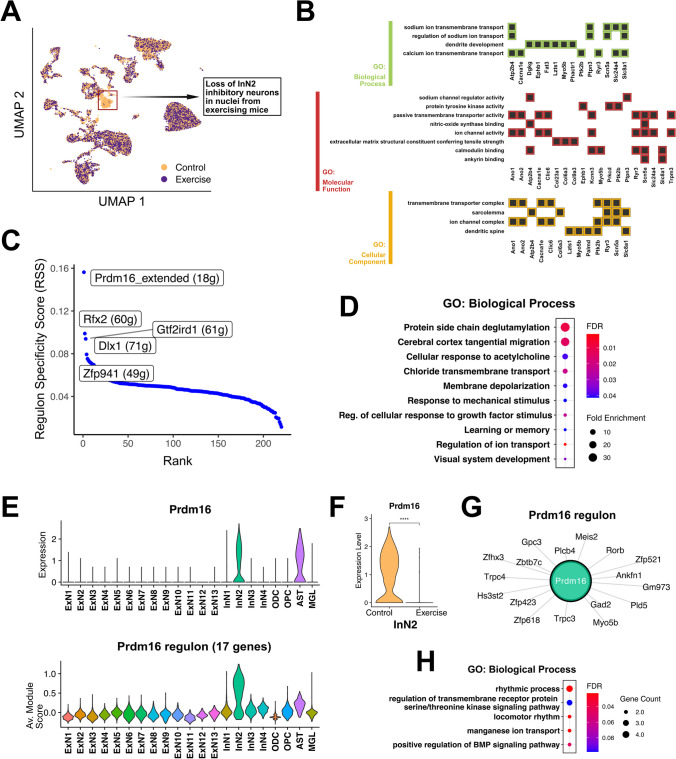
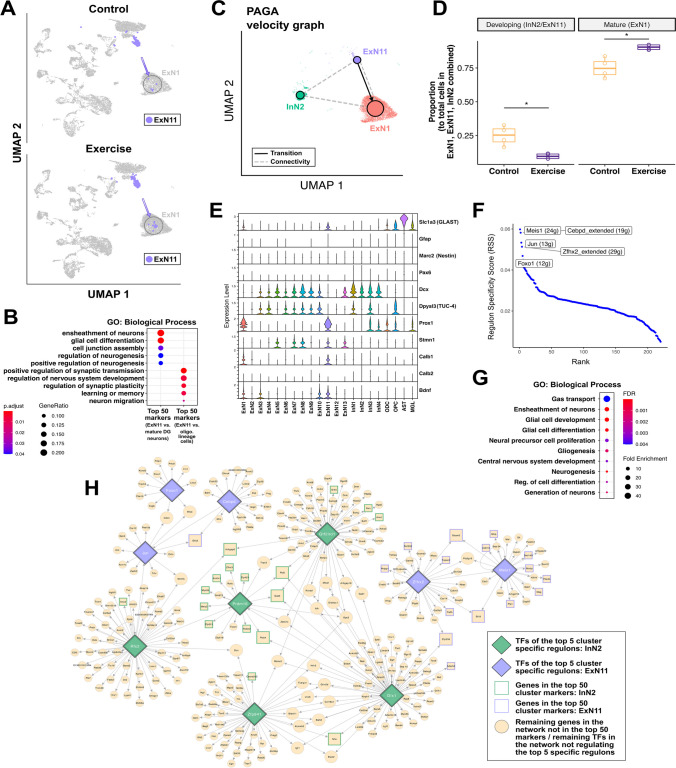
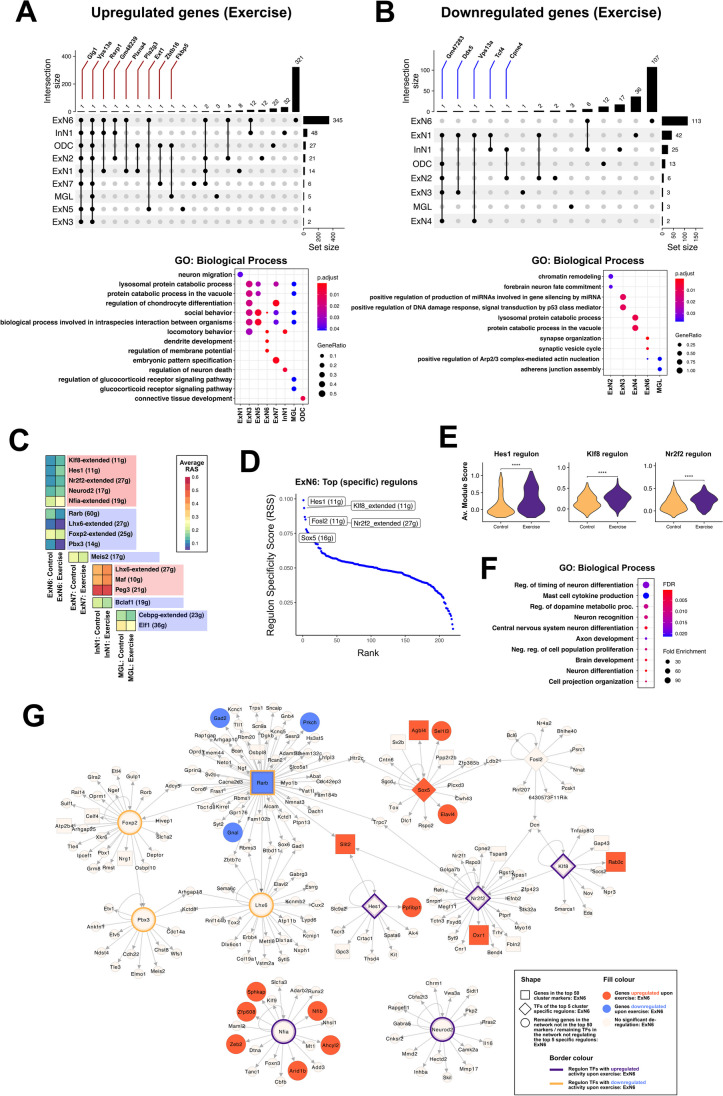
Verification
Claims the paper makes
The claims and statistics of this paper haven’t been checked yet.
Run the check — free, no account needed. It reads the open-access text and checks the sources it cites.
Claims other papers make about this one
Each is checked against this paper’s own text: does it say what the citing paper says it does?
The check wasn’t confident either way, so it gives no verdict — never disputed.
In the citing paper
“Dysregulation of miRs has been observed in various neurodegenerative and neuropsychiatric diseases, including Alzheimer’s disease (AD), Parkinson’s disease (PD), amyotrophic lateral sclerosis (ALS), schizophrenia, and depression [13–19].”
From A role for astrocytic miR-129-5p in frontotemporal dementia (2025) · cites this paper as [19]
Experimental — accuracy not yet measured
Self-check
Percentages, sums and reported differences re-computed from the paper’s own numbers.
The self-check needs the paper’s full text.
Citations
Cites
From Louvain to Leiden: guaranteeing well-connected communities
Traag, V. A., Waltman, L., & van Eck, N. J. (2019) · Scientific Reports · doi:10.1038/s41598-019-41695-z · Cited by 5,635
McGinnis, C. S., Murrow, L. M., & Gartner, Z. J. (2019) · Cell Systems · doi:10.1016/j.cels.2019.03.003 · Cited by 4,521
Hafemeister, C., & Satija, R. (2019) · Genome Biology · doi:10.1186/s13059-019-1874-1 · Cited by 4,479 · cited 1×
“Normalization was done using the SCTransform() function from the Seurat and sctransform (version 0.3.2) packages [46], with the arguments method = “glmGamPoi” and vars. to.regress = “percent.mt.” PCA embeddings were calculated using the RunPCA() function, and RunHarmony() function from the harmony…”
InfluentialPerformance of neural network basecalling tools for Oxford Nanopore sequencing
Wick, R. R., Judd, L. M., & Holt, K. E. (2019) · Genome Biology · doi:10.1186/s13059-019-1727-y · Cited by 3,221
Generalizing RNA velocity to transient cell states through dynamical modeling
Bergen, V., Lange, M., Peidli, S., Wolf, F. A., & Theis, F. J. (2020) · Nature Biotechnology · doi:10.1038/s41587-020-0591-3 · Cited by 2,951
Reactive astrocyte nomenclature, definitions, and future directions
Escartin, C., Galea, E., Lakatos, A., O’Callaghan, J. P., Petzold, G. C., Serrano-Pozo, A., Steinhäuser, C., Volterra, A., Carmignoto, G., Agarwal, A., et al. (2021) · Nature Neuroscience · doi:10.1038/s41593-020-00783-4 · Cited by 2,513 · cited 1×
“This might be due to the specific nuclei isolation protocols [141, 142] suggesting the necessity to address the role of such cells in future single-cell/nucleus RNAseq experiments.”
Inferring Regulatory Networks from Expression Data Using Tree-Based Methods
Huynh-Thu, V. A., Irrthum, A., Wehenkel, L., & Geurts, P. (2010) · PLoS ONE · doi:10.1371/journal.pone.0012776 · Cited by 2,131 · cited 1×
“Briefly, this analysis was performed as follows: with the gene expression matrix as input, gene sets that were co-expressed with potential regulators or transcription factors (TFs) were identified using the GENIE3 algorithm (implemented using the GENIE3 R package (version 1.16.0} [55].”
InfluentialEnriched environments, experience-dependent plasticity and disorders of the nervous system
Nithianantharajah, J., & Hannan, A. J. (2006) · Nature Reviews Neuroscience · doi:10.1038/nrn1970 · Cited by 1,771
The ageing systemic milieu negatively regulates neurogenesis and cognitive function
Villeda, S. A., Luo, J., Mosher, K. I., Zou, B., Britschgi, M., Bieri, G., Stan, T. M., Fainberg, N., Ding, Z., Eggel, A., et al. (2011) · Nature · doi:10.1038/nature10357 · Cited by 1,763
Astrocytes give rise to new neurons in the adult mammalian hippocampus
Seri, B., Garcı́a-Verdugo, J. M., McEwen, B. S., & Alvarez-Buylla, A. (2001) · The Journal of Neuroscience · doi:10.1523/jneurosci.21-18-07153.2001 · Cited by 1,495
A scalable SCENIC workflow for single-cell gene regulatory network analysis
Van de Sande, B., Flerin, C., Davie, K., De Waegeneer, M., Hulselmans, G., Aibar, S., Seurinck, R., Saelens, W., Cannoodt, R., Rouchon, Q., et al. (2020) · Nature Protocols · doi:10.1038/s41596-020-0336-2 · Cited by 1,494
An in vivo correlate of exercise-induced neurogenesis in the adult dentate gyrus
Pereira, A. C., Huddleston, D. E., Brickman, A. M., Sosunov, A. A., Hen, R., McKhann, G. M., Sloan, R., Gage, F. H., Brown, T. R., & Small, S. A. (2007) · Proceedings of the National Academy of Sciences · doi:10.1073/pnas.0611721104 · Cited by 1,353
Human Hippocampal Neurogenesis Persists throughout Aging
Boldrini, M., Fulmore, C. A., Tartt, A. N., Simeon, L. R., Pavlova, I., Poposka, V., Rosoklija, G. B., Stankov, A., Arango, V., Dwork, A. J., et al. (2018) · Cell Stem Cell · doi:10.1016/j.stem.2018.03.015 · Cited by 1,345
Young blood reverses age-related impairments in cognitive function and synaptic plasticity in mice
Villeda, S. A., Plambeck, K. E., Middeldorp, J., Castellano, J. M., Mosher, K. I., Luo, J., Smith, L. K., Bieri, G., Lin, K., Berdnik, D., et al. (2014) · Nature Medicine · doi:10.1038/nm.3569 · Cited by 1,081
Exercise and brain neurotrophins
Neeper, S. A., Góauctemez-Pinilla, F., Choi, J., & Cotman, C. (1995) · Nature · doi:10.1038/373109a0 · Cited by 1,066
Vascular and Neurogenic Rejuvenation of the Aging Mouse Brain by Young Systemic Factors
Katsimpardi, L., Litterman, N. K., Schein, P. A., Miller, C. M., Loffredo, F. S., Wojtkiewicz, G. R., Chen, J. W., Lee, R. T., Wagers, A. J., & Rubin, L. L. (2014) · Science · doi:10.1126/science.1251141 · Cited by 1,037
The Impact of Resistance Exercise on the Cognitive Function of the Elderly
CASSILHAS, R. C., VIANA, V. A. R., GRASSMANN, V., SANTOS, R. T., SANTOS, R. F., TUFIK, S., & MELLO, M. T. (2007) · Medicine & Science in Sports & Exercise · doi:10.1249/mss.0b013e318060111f · Cited by 770
Isackson, P. J., Huntsman, M. M., Murray, K. D., & Gall, C. M. (1991) · Neuron · doi:10.1016/0896-6273(91)90234-q · Cited by 711
Div-Seq: Single-nucleus RNA-Seq reveals dynamics of rare adult newborn neurons
Habib, N., Li, Y., Heidenreich, M., Swiech, L., Avraham-Davidi, I., Trombetta, J. J., Hession, C., Zhang, F., & Regev, A. (2016) · Science · doi:10.1126/science.aad7038 · Cited by 601
Molecular mechanisms linking exercise to cancer prevention and treatment
Hojman, P., Gehl, J., Christensen, J. F., & Pedersen, B. K. (2018) · Cell Metabolism · doi:10.1016/j.cmet.2017.09.015 · Cited by 600 · cited 1×
“In addition to alleviating the risk of metabolic diseases [1–3], cardiovascular disease [1, 4, 5], and several types of cancers [6], the benefits of physical exercise on brain function have also been extensively studied and reviewed [7–10].”
Exercise-Mediated Neurogenesis in the Hippocampus via BDNF
Liu, P. Z., & Nusslock, R. (2018) · Frontiers in Neuroscience · doi:10.3389/fnins.2018.00052 · Cited by 533
Ashdown-Franks, G., Firth, J., Carney, R., Carvalho, A. F., Hallgren, M., Koyanagi, A., Rosenbaum, S., Schuch, F. B., Smith, L., Solmi, M., et al. (2020) · Sports Medicine · doi:10.1007/s40279-019-01187-6 · Cited by 460 · cited 1×
“These changes indicate an overall positive impact of exercise on hippocampal function, including protective effects against aging and neurological disorders [11–14], increased adult neurogenesis [7, 15], enhanced synaptic plasticity, and improved cognitive performance [16].”
Exercise plasma boosts memory and dampens brain inflammation via clusterin
De Miguel, Z., Khoury, N., Betley, M. J., Lehallier, B., Willoughby, D., Olsson, N., Yang, A. C., Hahn, O., Lu, N., Vest, R. T., et al. (2021) · Nature · doi:10.1038/s41586-021-04183-x · Cited by 422
Exercise Benefits Brain Function: The Monoamine Connection
Lin, T.-W., & Kuo, Y.-M. (2013) · Brain Sciences · doi:10.3390/brainsci3010039 · Cited by 392
The bHLH Gene Hes1 as a Repressor of the Neuronal Commitment of CNS Stem Cells
Nakamura, Y., Sakakibara, S.-I., Miyata, T., Ogawa, M., Shimazaki, T., Weiss, S., Kageyama, R., & Okano, H. (2000) · The Journal of Neuroscience · doi:10.1523/jneurosci.20-01-00283.2000 · Cited by 316 · cited 1×
“…regulates the maintenance and proliferative capacity of neuronal progenitor cells, acting as a repressor of the commitment of the latter to a neuronal fate, which in turn influences the number of neurons produced, the timing of neurogenesis as well as overall brain morphogenesis [138, 139].”
Retinoic acid signaling and neuronal differentiation
Janesick, A., Wu, S. C., & Blumberg, B. (2015) · Cellular and Molecular Life Sciences · doi:10.1007/s00018-014-1815-9 · Cited by 295
Blood-brain barrier permeability and physical exercise
Małkiewicz, M. A., Szarmach, A., Sabisz, A., Cubała, W. J., Szurowska, E., & Winklewski, P. J. (2019) · Journal of Neuroinflammation · doi:10.1186/s12974-019-1403-x · Cited by 276
Cell type prioritization in single-cell data
Skinnider, M. A., Squair, J. W., Kathe, C., Anderson, M. A., Gautier, M., Matson, K. J. E., Milano, M., Hutson, T. H., Barraud, Q., Phillips, A. A., et al. (2021) · Nature Biotechnology · doi:10.1038/s41587-020-0605-1 · Cited by 274
Exercise, brain plasticity, and depression
Zhao, J., Jiang, W., Wang, X., Cai, Z., Liu, Z., & Liu, G. (2020) · CNS Neuroscience & Therapeutics · doi:10.1111/cns.13385 · Cited by 241
Schäffner, I., Minakaki, G., Khan, M. A., Balta, E.-A., Schlötzer-Schrehardt, U., Schwarz, T. J., Beckervordersandforth, R., Winner, B., Webb, A. E., DePinho, R. A., et al. (2018) · Neuron · doi:10.1016/j.neuron.2018.08.017 · Cited by 145 · cited 1×
“…Zfhx2 which is involved in neuronal differentiation [105], and Foxo1 which regulates the long-term maintenance of adult neural stem cells and belongs to the FoxO family that plays an important role in the maintenance of autophagic flux and neuronal morphogenesis in adult neurogenesis [106, 107].”
Fuentealba, P., Klausberger, T., Karayannis, T., Suen, W. Y., Huck, J., Tomioka, R., Rockland, K., Capogna, M., Studer, M., Morales, M., et al. (2010) · The Journal of Neuroscience · doi:10.1523/jneurosci.4199-09.2010 · Cited by 113
Exercise Interventions and Peripheral Arterial Function: Implications for Cardio-Metabolic Disease
Phillips, S. A., Mahmoud, A. M., Brown, M. D., & Haus, J. M. (2015) · Progress in Cardiovascular Diseases · doi:10.1016/j.pcad.2014.12.005 · Cited by 78
Research works printed but not linked: 119
- Sylow L, Richter EA (2019) Current advances in our understanding of exercise as medicine in metabolic disease. Curr Opin Physio 12(12):19
- Zanuso S et al (2010) Exercise for the management of type 2 diabetes: a review of the evidence. Acta Diabetol 47(15):22
- Gielen S et al (2015) Exercise training in patients with heart disease: review of beneficial effects and clinical recommendations. Prog Cardiovasc Dis 57(3):347–355 · DOI
- Morris JN (1994) Exercise in the prevention of coronary heart disease: today’s best buy in public health. Med Sci Sports Exerc 26(7):807–814 · DOI
- van Praag H et al (1999) Running enhances neurogenesis, learning, and long-term potentiation in mice. Proc Natl Acad Sci U S A 96(23):13427–13431 · DOI · Paper page
- Voss MW et al (2011) Exercise, brain, and cognition across the life span. J Appl Physiol 111(5):1505–1513 · DOI · Paper page
- Fischer A (2016) Environmental enrichment as a method to improve cognitive function. What can we learn from animal models? Neuroimage 1(132):42–47 · DOI
- Fischer A et al (2007) Recovery of learning & memory after neuronal loss is associated with chromatin remodeling. Nature 447(7141):178–182 · DOI · Paper page
- Brown BM, Peiffer JJ, Martins RN (2013) Multiple effects of physical activity on molecular and cognitive signs of brain aging: can exercise slow neurodegeneration and delay Alzheimer’s disease? Mol Psychiatry 18(8):864–874 · DOI
- Cass SP (2017)Alzheimer's disease and exercise: a literature review. Curr Sports Med Rep 16(1):19–22. https://doi.org/10.1249/JSR.0000000000000332 · DOI
- Kempermann G, Kuhn HG, Gage FH (1997) More hippocampal neurons in adult mice living in an enriched environment. Nature 386(6624):493–495 · DOI
- Erickson KI, Kramer AF (2009) Aerobic exercise effects on cognitive and neural plasticity in older adults. Br J Sports Med 43(1):22–24 · DOI
- Erickson KI (2011) Exercise training increases size of hippocampus and improves memory. Proc Natl Acad Sci 108(7):3017–3022 · DOI · Paper page
- Maass A et al (2015) Vascular hippocampal plasticity after aerobic exercise in older adults. Mol Psychiatry 20(5):585–593 · DOI · Paper page
- Fabel K et al (2003) VEGF is necessary for exercise-induced adult hippocampal neurogenesis. Eur J Neurosci 18(10):2803–2812 · DOI · Paper page
- Loprinzi PD, Frith E (2019) A brief primer on the mediational role of BDNF in the exercise-memory link. Clin Physiol Funct Imaging 39(1):9–14 · DOI · Paper page
- Trejo JL, Carro E, Torres-Aleman I (2001) Circulating insulin-like growth factor I mediates exercise-induced increases in the number of new neurons in the adult hippocampus. J Neurosci 21(5):1628–1634 · DOI · Paper page
- Pedersen BK (2000) Exercise and cytokines. Immunol Cell Biol 78(5):532–535 · DOI
- Meeusen R, Piacentini M (2001) Exercise and neurotransmission: a window to the future? Eur J Sport Sci 1(1):12 · DOI
- Packer N, Pervaiz N, Hoffman-Goetz L (2010) Does exercise protect from cognitive decline by altering brain cytokine and apoptotic protein levels? A systematic review of the literature. Exerc Immunol Rev 16:138–162
- Rampon C et al (2000) Effects of environmental enrichment on gene expression in the brain. Proc Natl Acad Sci U S A 97(23):12880–12884 · DOI
- Mojtahedi S, Kordi MR, Hosseini SE, Omran SF, Soleimani M (2013) Effect of treadmill running on the expression of genes that are involved in neuronal differentiation in the hippocampus of adult male rats. Cell Biol Int 37(4):276–283. https://doi.org/10.1002/cbin.10022 · DOI
- Tong L et al (2001) Effects of exercise on gene-expression profile in the rat hippocampus. Neurobiol Dis 8(6):1046–1056 · DOI
- Stilling R et al (2014) K-Lysine acetlytransferase 2A regulates a hippocampal gene-expression network linked to memory formation. EMBO J 33(17):1912–1927 · DOI
- Lake BB et al (2018) Integrative single-cell analysis of transcriptional and epigenetic states in the human adult brain. Nat Biotechnol 36(1):70–80 · DOI · Paper page
- Mathys H et al (2018) Single-cell transcriptomic analysis of Alzheimer’s disease. Nature 570(7761):332–337 · DOI · Paper page
- Zhou Y et al (2022) Molecular landscapes of human hippocampal immature neurons across lifespan. Nature 607(7919):527–533 · DOI
- Pan-Vazquez A et al (2015) Impact of voluntary exercise and housing conditions on hippocampal glucocorticoid receptor, miR-124 and anxiety. Mol Brain 8(1):12 · DOI
- Shah R et al (2017) Small RNA-seq during acute maximal exercise reveal RNAs involved in vascular inflammation and cardiometabolic health: brief report. Am J Physiol-Heart Circ Physiol 313(6):1162–1167 · DOI
- Benito E, Kerimoglu C, Ramachandran B, Pena-Centeno T, Jain G, Stilling RM, Islam MR, Capece V et al (2018) RNA-dependent intergenerational inheritance of enhanced synaptic plasticity after environmental enrichment. Cell Rep 23(2):546–554. https://doi.org/10.1016/j.celrep.2018.03.059 · DOI
- McGreevy KR et al (2019) Proceedings of the National Academy of Sciences. Proc Natl Acad Sci 116(20):10103–10112 · DOI
- Goldberg M et al (2021) Exercise as a model to identify microRNAs linked to human cognition: a role for microRNA-409 and microRNA-501. Transl Psychiatry 11(1):514 · DOI · Paper page
- Urdinguio RG, Tejedor JR, Fernández-Sanjurjo M, Pérez RF, Peñarroya A, Ferrero C, Codina-Martínez H, Díez-Planelles C et al (2021) Physical exercise shapes the mouse brain epigenome. Mol Metab 54:101398. https://doi.org/10.1016/j.molmet.2021.101398 · DOI
- Klinker F et al (2017) Dopamine D3 receptor status modulates sexual dimorphism in voluntary wheel running behavior in mice. Behav Brain Res 333(241):1872
- Kettwig M et al (2021) Interferon-driven brain phenotype in a mouse model of RNaseT2 deficient leukoencephalopathy. Nat Commun 12(1):6530 · DOI
- Sakib MS et al (2021) Intranuclear immunostaining-based FACS protocol from embryonic cortical tissue. Star Protocols 2(1):100318 · DOI
- Hao Y et al (2023) Dictionary learning for integrative, multimodal and scalable single-cell analysis. Nat Biotechnol. https://doi.org/10.1038/s41587-023-01767-y · DOI · Paper page
- Korsunsky I, Millard N, Fan J, Slowikowski K, Zhang F, Wei K, Baglaenko Y, Brenner M, et al (2019) Fast, sensitive and accurate integration of single-cell data with harmony. Nat Methods 16(12):1289–1296. https://doi.org/10.1038/s41592-019-0619-0 · DOI · Paper page
- Becht E et al (2018) Dimensionality reduction for visualizing single-cell data using UMAP. Nat Biotechnol. https://doi.org/10.1038/nbt.4314.Advanceonlinepublication · DOI
- McInnes L, J. Healy, J. Melville (2018) Umap: uniform manifold approximation and projection for dimension reduction. GitHub. https://umap-learn.readthedocs.io/en/latest/. · DOI · Paper page
- Squair JW et al (2021) Prioritization of cell types responsive to biological perturbations in single-cell data with Augur. Nat Protoc 16(8):3836–3873 · DOI · Paper page
- Aibar S et al (2017) SCENIC: single-cell regulatory network inference and clustering. Nat Methods 14(1):1083–1086 · DOI · Paper page
- Yu G et al (2012) clusterProfiler: an R package for comparing biological themes among gene clusters. Omics: a J Integr Biol 16(5):284–286 · DOI · Paper page
- Liao Y et al (2019) WebGestalt 2019: gene set analysis toolkit with revamped UIs and APIs. Nucleic Acids Res 47(1):199–205 · DOI · Paper page
- Ge SX, Jung D, Yao R (2019) ShinyGO: a graphical gene-set enrichment tool for animals and plants. Bioinformatics 36(8):2628–2629 · DOI · Paper page
- Shannon P et al (2003) Cytoscape: a software environment for integrated models of biomolecular interaction networks. Genome Res 13(11):2498–2504 · DOI · Paper page
- Wolf FA, Hamey FK, Plass M, Solana J, Dahlin JS, Göttgens B, Rajewsky N, Simon L, et al (2019) PAGA: graph abstraction reconciles clustering with trajectory inference through a topology preserving map of single cells. Genome Biol 20(1):59. https://doi.org/10.1186/s13059-019-1663-x · DOI · Paper page
- Cembrowski MS et al (2016) Hipposeq: a comprehensive RNA-seq database of gene expression in hippocampal principal neurons. Elife 16(8):3836–3873
- Gao Y, Syed M, Zhao X (2023) Mechanisms underlying the effect of voluntary running on adult hippocampal neurogenesis. Hippocampus 33(4):373–390 · DOI
- Kajimura S, Seale P, Spiegelman BM (2010) Transcriptional control of brown fat development. Cell Metab 11(4):257–262 · DOI
- Seale P et al (2011) Prdm16 determines the thermogenic program of subcutaneous white adipose tissue in mice. J Clin Invest 121(1):96–105 · DOI
- Aguilo F et al (2011) Prdm16 is a physiologic regulator of hematopoietic stem cells. Blood 117(19):5057–5066 · DOI
- Leszczyński P et al (2020) Emerging roles of PRDM factors in stem cells and neuronal system: cofactor dependent regulation of PRDM3/16 and FOG1/2 (novel PRDM factor). Cells 9(12). https://doi.org/10.3390/cells9122603. · DOI
- Shimada IS et al (2017) Prdm16 is required for the maintenance of neural stem cells in the postnatal forebrain and their differentiation into ependymal cells. Genes Dev 31(11):1134–1146 · DOI
- Su L et al (2020) PRDM16 orchestrates angiogenesis via neural differentiation in the developing brain. Cell Death Differ 27(8):2313–2329 · DOI
- TurreroGarcía M et al (2020) Transcriptional regulation of MGE progenitor proliferation by PRDM16 controls cortical GABAergic interneuron production. Development 147(22):1477–1482
- Hawn MB et al (2021) Molecular mechanisms of activation and regulation of ANO1-Encoded Ca(2+)-Activated Cl(-) channels. Channels 15(1):569–603 · DOI
- Hong G-S et al (2019) ANO1/TMEM16A regulates process maturation in radial glial cells in the developing brain. Proc National Acad Sci USA 116(25):12494–12499 · DOI
- Huang WC et al (2012) Calcium-activated chloride channels (CaCCs) regulate action potential and synaptic response in hippocampal neurons. Neuron 74(1):179–192 · DOI
- Zhang W et al (2015) Anoctamin calcium-activated chloride channels may modulate inhibitory transmission in the cerebellar cortex. PloS One 10(11). https://doi.org/10.1371/journal.pone.0142160. · DOI
- Morinaga T et al (1991) A human alpha-fetoprotein enhancer-binding protein, ATBF1, contains four homeodomains and seventeen zinc fingers. Mol Cell Biol 11(12):6041–6049
- Jung C-G et al (2005) Homeotic factor ATBF1 induces the cell cycle arrest associated with neuronal differentiation. Development 132(23):5137–5145 · DOI
- Miura Y et al (1995) Cloning and characterization of an ATBF1 isoform that expresses in a neuronal differentiation-dependent manner. J Biol Chem 270(45):26840–26848 · DOI
- Gaston-Massuet C et al (2005) Zic4, a zinc-finger transcription factor, is expressed in the developing mouse nervous system. Dev Dyn 233(3):1110–1115 · DOI
- Inoue T et al (2007) Zic1 and Zic3 regulate medial forebrain development through expansion of neuronal progenitors. J Neurosci 27(20):5461–5473 · DOI
- Kamiya D et al (2011) Intrinsic transition of embryonic stem-cell differentiation into neural progenitors. Nature 470(7335):503–509 · DOI
- Zarei-Kheirabadi M et al (2019) Generation of neural stem cells from adult astrocytes by using a single reprogramming factor. J Cell Physiol 234(10):18697–18706 · DOI
- Agrawal A et al (2011) A genome-wide association study of DSM-IV cannabis dependence. Addict Biol 16(3):514–518 · DOI
- Agoston Z et al (2014) Meis2 is a Pax6 co-factor in neurogenesis and dopaminergic periglomerular fate specification in the adult olfactory bulb. Development 141(1):28–38 · DOI
- Bond AM, Bhalala OG, Kessler JA (2012) The dynamic role of bone morphogenetic proteins in neural stem cell fate and maturation. Dev Neurobiol 72(7):1068–1084 · DOI
- Cobos I et al (2005) Mice lacking Dlx1 show subtype-specific loss of interneurons, reduced inhibition and epilepsy. Nat Neurosci 8(8):1059–1068 · DOI · Paper page
- Su Z, Wang Z, Lindtner S, Yang L, Shang Z, Tian Y, Guo R, You Y et al (2022) Dlx1/2-dependent expression of Meis2 promotes neuronal fate determination in the mammalian striatum. Development 149(4):dev200035. https://doi.org/10.1242/dev.200035 · DOI
- Ambrogini P et al (2013) Physical exercise and environment exploration affect synaptogenesis in adult-generated neurons in the rat dentate gyrus: possible role of BDNF. Brain Res 1(12):321–356
- Lattanzi D et al (2022) Short-term, Voluntary exercise affects morpho-functional maturation of adult-generated neurons in rat hippocampus. Int J Mol Sci 23(12):134–145 · DOI
- Wu CW et al (2008) Exercise enhances the proliferation of neural stem cells and neurite growth and survival of neuronal progenitor cells in dentate gyrus of middle-aged mice. J Appl Physiol 105(5):1585–1594 · DOI
- Erwin SR et al (2020) A sparse, spatially biased subtype of mature granule cell dominates recruitment in hippocampal-associated behaviors. Cell Reports 31(4). https://doi.org/10.1016/j.celrep.2020.107551. · DOI
- Kempermann G, H Song, FH Gage (2015) Neurogenesis in the adult hippocampus. Cold Spring Harbor Perspectives in Biology 7(9). https://doi.org/10.1101/cshperspect.a018812. · DOI · Paper page
- Kempermann G, Jessberger S, Steiner B, Kronenberg G (2004) Milestones of neuronal development in the adult hippocampus. Trends Neurosci 27(8):447–452. https://doi.org/10.1016/j.tins.2004.05.013 · DOI
- von Bohlen HO (2007) Immunohistological markers for staging neurogenesis in adult hippocampus. Cell Tissue Res 329(3):409–420 · DOI
- Potten CS, Loeffler M (1990) Stem cells: attributes, cycles, spirals, pitfalls and uncertainties Lessons for and from the crypt. Development 110(4):1001–1020 · DOI
- Boekhoorn K et al (2014) The microtubule destabilizing protein stathmin controls the transition from dividing neuronal precursors to postmitotic neurons during adult hippocampal neurogenesis. Dev Neurobiol 74(12):1226–1242 · DOI
- Sleiman, S.F., et al., Exercise promotes the expression of brain derived neurotrophic factor (BDNF) through the action of the ketone body β-hydroxybutyrate. ELife, 2016. 5(https://doi.org/10.7554/eLife.15092). · DOI · Paper page
- Barber BA et al (2013) Dynamic expression of MEIS1 homeoprotein in E14.5 forebrain and differentiated forebrain-derived neural stem cells. Ann Anat - Anat Anzeiger 195(5):431–440 · DOI
- Mojsin M, Stevanovic M (2009) PBX1 and MEIS1 up-regulate SOX3 gene expression by direct interaction with a consensus binding site within the basal promoter region. Biochemical Journal 425(1):107–116 · DOI
- Owa T et al (2018) Meis1 coordinates cerebellar granule cell development by regulating Pax6 transcription, BMP signaling and Atoh1 degradation. J Neurosci 38(5):1277–1294 · DOI
- Banerjee S et al (2019) Loss of C/EBPδ exacerbates radiation-induced cognitive decline in aged mice due to impaired oxidative stress response. Int J Mol Sci 2019. 20(4). https://doi.org/10.3390/ijms20040885. · DOI
- Powell TR et al (2017) Inter-individual variation in genes governing human hippocampal progenitor differentiation in vitro is associated with hippocampal volume in adulthood. Scientific Reports 7(1). https://doi.org/10.1038/s41598-017-15042-z. · DOI
- Weston CR, Davis RJ (2007) The JNK signal transduction pathway. Curr Opin Cell Biol 19(2):142–149 · DOI · Paper page
- Komine, Y., et al (2012) Behavioral abnormalities observed in Zfhx2-deficient mice. PloS One 7(12). https://doi.org/10.1371/journal.pone.0053114. · DOI
- Ro S-H et al (2013) FoxOs in neural stem cell fate decision. Arch Biochem Biophys 534(1):55–63 · DOI
- Ruusuvuori E, Kaila K (2014) Carbonic anhydrases and brain pH in the control of neuronal excitability. Subcell Biochem 75:271–275 · DOI
- Föller M et al (2012) Chorein-sensitive polymerization of cortical actin and suicidal cell death in chorea-acanthocytosis. FASEB J 26(4):1526–1534 · DOI
- Lazarczyk MJ et al (2016) Heterozygous chorein deficiency in probable tau-negative early-onset Alzheimer disease. Alzheimer Dis Assoc Disord 30(3):272–275 · DOI
- Tan C et al (2019) Endothelium-derived semaphorin 3G regulates hippocampal synaptic structure and plasticity via neuropilin-2/PlexinA4. Neuron 101(5):937–43 · DOI
- Yamashita N et al (2016) TrkA mediates retrograde semaphorin 3A signaling through plexin A4 to regulate dendritic branching. J Cell Sci 129(9):1802–1814 · DOI
- Usui N et al (2021) Zbtb16 regulates social cognitive behaviors and neocortical development. Translational Psychiatry 2021. 11(1). https://doi.org/10.1038/s41398-021-01358-y. · DOI
- Qiu B et al (2019) Loss of FKBP5 affects neuron synaptic plasticity. Neuroscience 402(23):36
- Li H et al (2017) Helicase DDX5 inhibits reprogramming to pluripotency by miRNA-based repression of RYBP and its PRC1-dependent and -independent functions. Cell Stem Cell 20(3). https://doi.org/10.1016/j.stem.2017.03.014. · DOI
- Suthapot P et al (2022) The RNA helicases DDX5 and DDX17 facilitate neural differentiation of human pluripotent stem cells NTERA2. Life Sci. 291. https://doi.org/10.1016/j.lfs.2021.120298. · DOI
- Forrest MP et al (2014) The emerging roles of TCF4 in disease and development. Trends Mol Med 20(6):322–331 · DOI
- Crux S, J Herms, MM Dorostkar (2018) Tcf4 regulates dendritic spine density and morphology in the adult brain. PloS One 13(6): https://doi.org/10.1371/journal.pone.0199359. · DOI
- Chen T et al (2016) Tcf4 controls neuronal migration of the cerebral cortex through regulation of Bmp7. Front Mol Neurosci 9. https://doi.org/10.3389/fnmol.2016.00094. · DOI
- Badowska DM et al (2020) Modulation of cognition and neuronal plasticity in gain- and loss-of-function mouse models of the schizophrenia risk gene Tcf4. Transl Psychiatry 10(1):2158–2168 · DOI
- Costa RM, Honjo T, Silva AJ (2003) Learning and memory deficits in notch mutant mice. Curr Biol 13(15):1348–1354 · DOI
- Wang Y et al (2004) Involvement of Notch signaling in hippocampal synaptic plasticity. Proc Natl Acad Sci USA 101(25):9458–9462 · DOI
- Amar, D., et al (2021) Time trajectories in the transcriptomic response to exercise - a meta-analysis. Nat Commun 12(1). https://doi.org/10.1038/s41467-021-23579-x. · DOI
- Matsuzaki T et al (2019) Hes1 expression in mature neurons in the adult mouse brain is required for normal behaviors. Sci Rep 52:231–241
- Yi R, Chen B, Zhao J, Zhan X, Zhang L, Liu X, Dong Q (2014) Krüppel-like factor 8 ameliorates Alzheimer's disease by activating β-catenin. J Mol Neurosci 52(2):231–241. https://doi.org/10.1007/s12031-013-0131-4 · DOI
- Praag HV et al (2005) Exercise enhances learning and hippocampal neurogenesis in aged mice. J Neurosci 25:8680–8685 · DOI · Paper page
- Rendeiro C, Rhodes JS (2018) A new perspective of the hippocampus in the origin of exercise–brain interactions. Brain Struct Funct 223:2527–2545 · DOI
- Chuikov S et al (2010) Prdm16 promotes stem cell maintenance in multiple tissues, partly by regulating oxidative stress. Nat Cell Biol 12(10):999–1006 · DOI
- Li, J., et al., Prdm16 and Vcam1 regulate the postnatal disappearance of embryonic radial glia and the ending of cortical neurogenesis. bioRxiv, 2023: https://www.ncbi.nlm.nih.gov/pmc/articles/PMC9949035/. · DOI
- Steiner B et al (2004) Differential regulation of gliogenesis in the context of adult hippocampal neurogenesis in mice. Glia 46(1):41–52 · DOI
- Lugert S et al (2010) Quiescent and active hippocampal neural stem cells with distinct morphologies respond selectively to physiological and pathological stimuli and aging. Cell Stem Cell 6(5):445–456 · DOI · Paper page
- Katsimpardi L, Lledo PM (2018) Regulation of neurogenesis in the adult and aging brain. Curr Opin Neurobiol 53:131–138 · DOI
- Graciani AL, Gutierre MU, Coppi AA, Arida RM, Gutierre RC (2023) Myelin, aging, and physical exercise. Neurobiol Aging 127:70–81. https://doi.org/10.1016/j.neurobiolaging.2023.03.009 · DOI
- Ochi S et al (2020) Oscillatory expression of Hes1 regulates cell proliferation and neuronal differentiation in the embryonic brain. Development 147(4):1477–1489
- Maugeri G et al (2021) Neuroprotective effects of physical activity via the adaptation of astrocytes. Cells 10(6):1542 · DOI
- de Ceglia R et al (2023) Specialized astrocytes mediate glutamatergic gliotransmission in the CNS. Nature 622(7981):120–129 · DOI
Cited by
Sorted by citations
Neurogenesis and Neuroinflammation in Dialogue: Mapping Gaps, Modulating Microglia, Rewiring Aging
Tanaka, M. (2026) · Cells · doi:10.3390/cells15010078 · Cited by 11
A role for astrocytic miR-129-5p in frontotemporal dementia
Kaurani, L., Pradhan, R., Schröder, S., Burkhardt, S., Schuetz, A.-L., Krüger, D. M., Pena, T., Heutink, P., Sananbenesi, F., & Fischer, A. (2025) · Translational Psychiatry · doi:10.1038/s41398-025-03338-y · Cited by 10
Self-citation
Metadata
- Authors
- Methi, A., Islam, M. R., Kaurani, L., Sakib, M. S., Krüger, D. M., Pena, T., Burkhardt, S., Liebetanz, D., & Fischer, A.
- ORCID
- Fischer, André
- Venue
- Molecular Neurobiology
- Published
- 2024-01-13
- Volume
- 61
- Issue
- 8
- Pages
- 5628-5645
- ISSN
- 0893-7648
- 1559-1182
- PMC
- PMC11249425
- Cited by
- 33
- References
- 32
- Language
- en
- Funders
- Deutsche Forschungsgemeinschaft (SFB1286, EXC 2067/1 390729940)
- Deutsches Zentrum für Neurodegenerative Erkrankungen e.V. (DZNE) in der Helmholtz-Gemeinschaft
About these checks
Registry, retraction, Cites and statistics results are computed, not judged, with one exception: a printed reference that no index lists is read once by a model before it counts as a citation error. Claims are extracted by a model and kept only when their quote appears verbatim in the text; each cited source is then checked, with a model’s help, for whether it says what the claim relies on. Those verdicts can be wrong — read the claim’s quote and the cited source before relying on one.
Statistics and arithmetic are recomputed, not judged.
Confidence bands are shown only for fields calibrated on our annotated test set. None is calibrated yet, so no band is shown.
What counts as a claim ›How we measure confidence ›How we check this ›
Are you an author, or do you see a problem with this page? Request a review
