Cited by 486

The DOI matches its Crossref record; 8 of the 8 references it cites were found in a registry or an index.

TET2 and TET3 regulate GlcNAcylation and H3K4 methylation through OGT and SET1/COMPASS

Deplus, Rachel, Delatte, Benjamin, Schwinn, Marie K, Defrance, Matthieu, Méndez, Jacqui, Murphy, Nancy, Dawson, Mark A, Volkmar, Michael, Putmans, Pascale, Calonne, Emilie, Shih, Alan H, Levine, Ross L, Bernard, Olivier, Mercher, Thomas, Solary, Eric, Urh, Marjeta, Daniels, Danette L, Fuks, François·2013·The EMBO Journal

Overview

The claims and statistics of this paper haven’t been checked yet.

Run the check — free, no account needed. It reads the open-access text and checks the sources it cites.

A few free checks a day · papers already verified open instantly · results are public

Integrity signals

Registry

Crossref · 10.1038/emboj.2012.357

Cites

8 of 8 references verified0 citation errors · 0 not checkable

Statistics

Figures

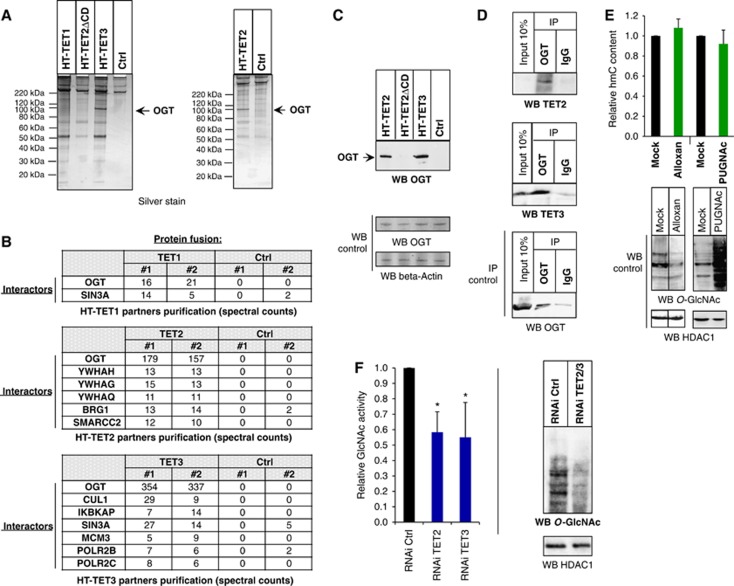
Figure 1 TET2 and TET3 associate with the O-GlcNAc transferase OGT and promote GlcNAcylation. (A) Silver stain gel of HaloTag-TET protein complex isolations and HaloTag alone control (Ctrl). Protein pulldowns were performed from HEK293T cells overexpressing the indicated HT constructs (see Materials and methods and Supplementary Figure 1 for details). As not all of the indicated complex isolations were performed at the same time, two separate silver stain gels were run, as shown in this panel. (B) Table of transcriptional or chromatin protein interactors found in the various HaloTag-TET isolations. Spectral counts for each interacting protein are shown for biological replicates. TET1, but not TET2, as previously reported (Williams et al, 2011; Wu et al, 2011), shows interaction with SIN3A. OGT interacts with all TET proteins, though it is most highly abundant with TET2 and TET3. (C) Detection of OGT by western blotting from HT-TET2 and HT-TET3 pulldowns from (A). The indicated pulldowns were probed with an anti-OGT antibody to detect the presence of OGT. OGT and beta-Actin shown as input loading controls. (D) TET2 and TET3 co-immunoprecipitate (CoIP) with endogenous OGT from untransfected HEK293T cells. Cell extracts were immunoprecipitated with anti-OGT or rabbit IgG and probed with antibodies against the indicated proteins. An IP control of OGT alone is shown to demonstrate specific capture and enrichment of OGT. Inputs loading controls are shown for all. Note that in this experiment very weak expression of TET2 relative to TET3 is observed. (E) The global level of hmC does not change after cell treatment with Alloxan or PUGNAc. Dot blot quantification of global hmC after the indicated treatments. The hmC content is normalized with respect to the input DNA and to mock-treated cells, where the ratio is set at 1.00. Error bars indicate s.d. of three independent experiments. As controls, western blots using anti-O-GlcNAc antibody show the expected decrease in GlcNAcylation with Alloxan and increase with PUGNAc. HDAC1 input loading controls are also shown. Vertical line indicates juxtaposition of lanes non-adjacent within the same blot, exposed for the same time. (F) Global decrease in GlcNAcylation is observed in TET2/3 knockdowns. Left: TET2 kd or TET3 kd show decreased GlcNAc activity. Nuclear extracts were prepared from HEK293T cells expressing RNAi Ctrl, RNAi TET2, or RNAi TET3, and UDP-[3H]GlcNAc incorporation was measured. The amount incorporated into the control cells was set at 1. Error bars indicate s.d. of three independent experiments (*P<0.05). Right: Nuclear extracts were prepared from HEK293T cells expressing RNAi Ctrl or RNAi TET2/3 and global GlcNAcylation was visualized with an antibody against O-GlcNAc. HDAC1 input loading control is also shown.
Figure 1 TET2 and TET3 associate with the O-GlcNAc transferase OGT and promote GlcNAcylation. (A) Silver stain gel of HaloTag-TET protein complex isolations and HaloTag alone control (Ctrl). Protein pulldowns were performed from HEK293T cells overexpressing the indicated HT constructs (see Materials and methods and Supplementary Figure 1 for details). As not all of the indicated complex isolations were performed at the same time, two separate silver stain gels were run, as shown in this panel. (B) Table of transcriptional or chromatin protein interactors found in the various HaloTag-TET isolations. Spectral counts for each interacting protein are shown for biological replicates. TET1, but not TET2, as previously reported (Williams et al, 2011; Wu et al, 2011), shows interaction with SIN3A. OGT interacts with all TET proteins, though it is most highly abundant with TET2 and TET3. (C) Detection of OGT by western blotting from HT-TET2 and HT-TET3 pulldowns from (A). The indicated pulldowns were probed with an anti-OGT antibody to detect the presence of OGT. OGT and beta-Actin shown as input loading controls. (D) TET2 and TET3 co-immunoprecipitate (CoIP) with endogenous OGT from untransfected HEK293T cells. Cell extracts were immunoprecipitated with anti-OGT or rabbit IgG and probed with antibodies against the indicated proteins. An IP control of OGT alone is shown to demonstrate specific capture and enrichment of OGT. Inputs loading controls are shown for all. Note that in this experiment very weak expression of TET2 relative to TET3 is observed. (E) The global level of hmC does not change after cell treatment with Alloxan or PUGNAc. Dot blot quantification of global hmC after the indicated treatments. The hmC content is normalized with respect to the input DNA and to mock-treated cells, where the ratio is set at 1.00. Error bars indicate s.d. of three independent experiments. As controls, western blots using anti-O-GlcNAc antibody show the expected decrease in GlcNAcylation with Alloxan and increase with PUGNAc. HDAC1 input loading controls are also shown. Vertical line indicates juxtaposition of lanes non-adjacent within the same blot, exposed for the same time. (F) Global decrease in GlcNAcylation is observed in TET2/3 knockdowns. Left: TET2 kd or TET3 kd show decreased GlcNAc activity. Nuclear extracts were prepared from HEK293T cells expressing RNAi Ctrl, RNAi TET2, or RNAi TET3, and UDP-[3H]GlcNAc incorporation was measured. The amount incorporated into the control cells was set at 1. Error bars indicate s.d. of three independent experiments (*P<0.05). Right: Nuclear extracts were prepared from HEK293T cells expressing RNAi Ctrl or RNAi TET2/3 and global GlcNAcylation was visualized with an antibody against O-GlcNAc. HDAC1 input loading control is also shown.CC BY-NC-SA · PubMed Central
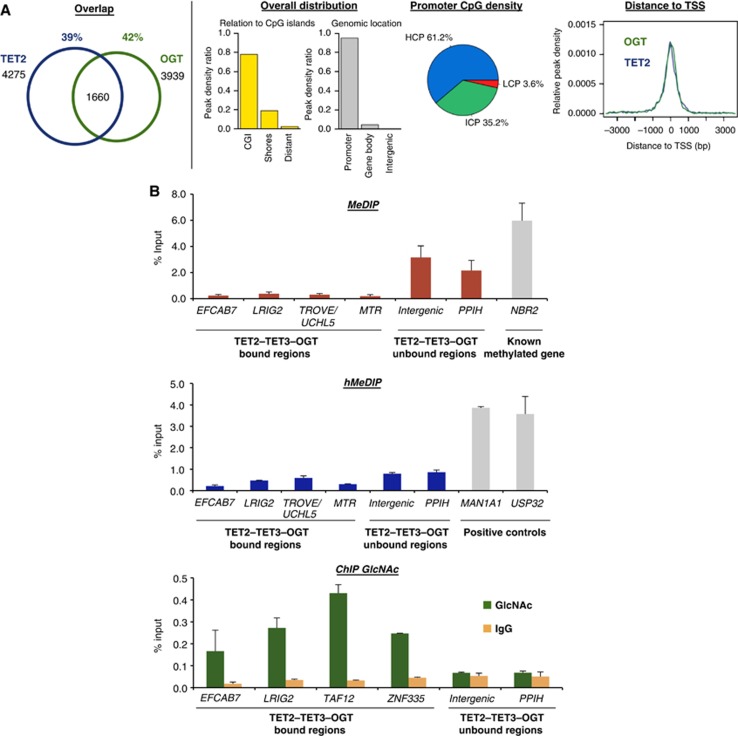
Figure 2 TET2/3–OGT show genomic co-localization around TSSs and impact on H3K4me3 and transcriptional activation. (A) Left: Venn diagrams indicating significant overlap of TET2 and OGT bound regions (left part; P-value<10−10) identified after HaloCHIP-Seq in HEK293T cells expressing HT-TET2, or HT-OGT. Right: TET2–OGT targets are primarily found at TSSs and CpG-rich sequences. Similar profiles were also observed for TET3–OGT (Supplementary Figure 8). (B) An analysed subset of TET2–TET3–OGT targets show a lack of DNA methylation and hydroxymethylation, yet display GlcNAcylation. qPCR analysis of TET2–TET3–OGT binding and non-binding regions after MeDIP (top), hMeDIP (middle), or ChIP with an anti-O-GlcNAc antibody (bottom). ‘% Input’ represents real-time qPCR values normalized with respect to the input chromatin. Known methylated and hydroxymethylated regions are shown as positive controls in MeDIP and hMeDIP panels.
Figure 2 TET2/3–OGT show genomic co-localization around TSSs and impact on H3K4me3 and transcriptional activation. (A) Left: Venn diagrams indicating significant overlap of TET2 and OGT bound regions (left part; P-value<10−10) identified after HaloCHIP-Seq in HEK293T cells expressing HT-TET2, or HT-OGT. Right: TET2–OGT targets are primarily found at TSSs and CpG-rich sequences. Similar profiles were also observed for TET3–OGT (Supplementary Figure 8). (B) An analysed subset of TET2–TET3–OGT targets show a lack of DNA methylation and hydroxymethylation, yet display GlcNAcylation. qPCR analysis of TET2–TET3–OGT binding and non-binding regions after MeDIP (top), hMeDIP (middle), or ChIP with an anti-O-GlcNAc antibody (bottom). ‘% Input’ represents real-time qPCR values normalized with respect to the input chromatin. Known methylated and hydroxymethylated regions are shown as positive controls in MeDIP and hMeDIP panels.CC BY-NC-SA · PubMed Central
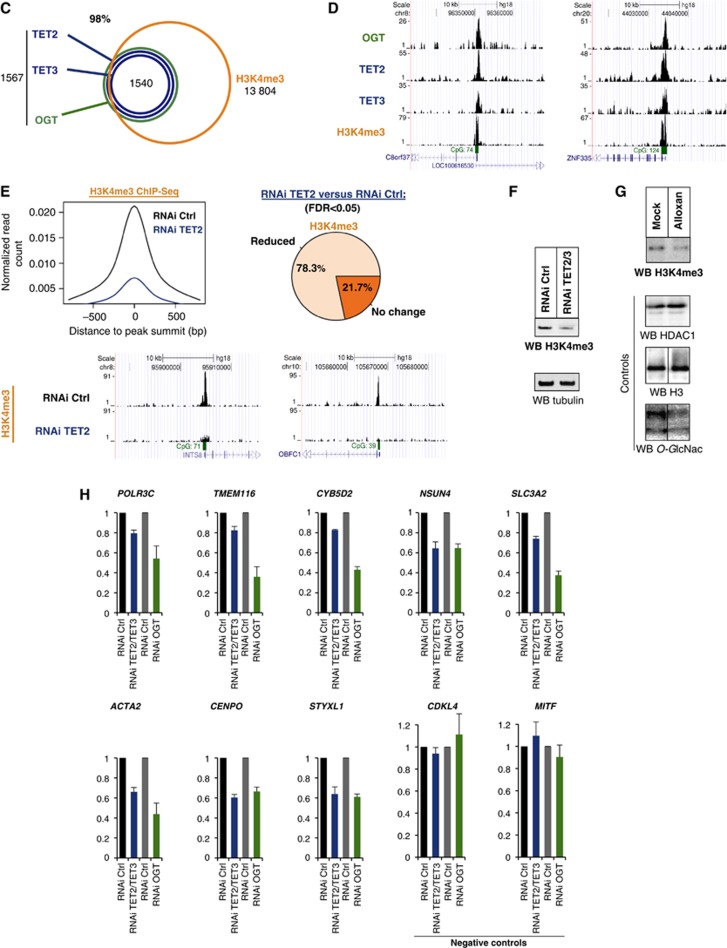
Figure 2 (C) TET2/3–OGT targets in HEK293T cells are enriched for H3K4me3 as depicted in a Venn diagram; P-value<10−10. (D) Examples of HaloCHIP-Seq OGT, TET2, TET3, and ChIP-Seq H3K4me3 profiles (UCSC tracks). (E) Decreased levels of H3K4me3 in TET2 kd cells. Upper-left: decrease in the normalized number of H3K4me3 reads in TET2/3–OGT-binding regions in TET2 kd cells versus control RNAi-treated cells. Upper-right: pie chart showing the percentage of TET2–TET3–OGT binding regions with a statistically significant reduction of the normalized number of H3K4me3 reads for TET2 kd versus control RNAi-treated cells. Lower-part: examples of H3K4me3 ChIP-Seq profiles (UCSC tracks) in TET2–TET3–OGT-binding regions for the RNAi control versus TET2 kd sample. (F) Western blot showing global decrease in H3K4me3 in a TET2/3 double kd cells. Lysates from mock HEK293T RNAi kd or TET2/3 kd cells were probed for H3K4me3 using an anti-H3K4 antibody in western blot. Tubulin is shown as a loading control. (G) OGT activity is important for H3K4me3. Cell extracts were prepared from HEK293T cells treated with or without the OGT inhibitor Alloxan, and then western blots for H3K4me3 were performed. HDAC1 and H3 are shown as loading controls and a western blot against O-GlcNAc was used to monitor specific GlcNAcylation inhibition by Alloxan. Vertical lines indicate juxtaposition of lanes non-adjacent within the same blot, exposed for the same time. (H) Decreases in transcription are observed in both TET2/3 knockdowns and an OGT knockdown. The indicated target genes (which showed decrease in H3K4me3 after TET2 kd; cf. E) and negative controls (unbound TET2/3–OGT–H3K4me3 targets), were analysed by RT–qPCR in HEK293T cells subjected to the various listed RNAi treatments. Independent experiments were performed in duplicates.
Figure 2 (C) TET2/3–OGT targets in HEK293T cells are enriched for H3K4me3 as depicted in a Venn diagram; P-value<10−10. (D) Examples of HaloCHIP-Seq OGT, TET2, TET3, and ChIP-Seq H3K4me3 profiles (UCSC tracks). (E) Decreased levels of H3K4me3 in TET2 kd cells. Upper-left: decrease in the normalized number of H3K4me3 reads in TET2/3–OGT-binding regions in TET2 kd cells versus control RNAi-treated cells. Upper-right: pie chart showing the percentage of TET2–TET3–OGT binding regions with a statistically significant reduction of the normalized number of H3K4me3 reads for TET2 kd versus control RNAi-treated cells. Lower-part: examples of H3K4me3 ChIP-Seq profiles (UCSC tracks) in TET2–TET3–OGT-binding regions for the RNAi control versus TET2 kd sample. (F) Western blot showing global decrease in H3K4me3 in a TET2/3 double kd cells. Lysates from mock HEK293T RNAi kd or TET2/3 kd cells were probed for H3K4me3 using an anti-H3K4 antibody in western blot. Tubulin is shown as a loading control. (G) OGT activity is important for H3K4me3. Cell extracts were prepared from HEK293T cells treated with or without the OGT inhibitor Alloxan, and then western blots for H3K4me3 were performed. HDAC1 and H3 are shown as loading controls and a western blot against O-GlcNAc was used to monitor specific GlcNAcylation inhibition by Alloxan. Vertical lines indicate juxtaposition of lanes non-adjacent within the same blot, exposed for the same time. (H) Decreases in transcription are observed in both TET2/3 knockdowns and an OGT knockdown. The indicated target genes (which showed decrease in H3K4me3 after TET2 kd; cf. E) and negative controls (unbound TET2/3–OGT–H3K4me3 targets), were analysed by RT–qPCR in HEK293T cells subjected to the various listed RNAi treatments. Independent experiments were performed in duplicates.CC BY-NC-SA · PubMed Central
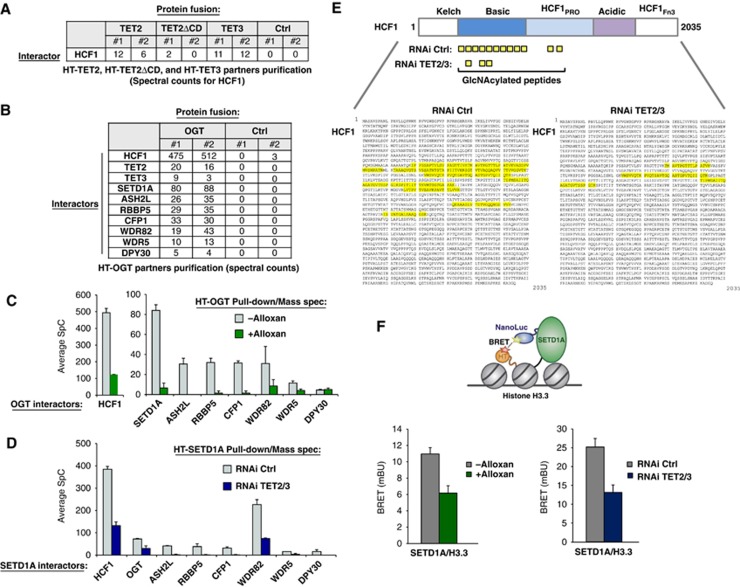
Figure 3 TET2/3 promotes GlcNAcylation of HCF1, and both TET and OGT activity favour the integrity of SET1/COMPASS and SETD1A binding to chromatin. (A) Mass spectrometry reveals HCF1, a known target of OGT (Wysocka et al, 2003) and component of SET1/COMPASS (Lee et al, 2010), as an interacting partner of HT-TET2 and HT-TET3. Biological duplicates and respective spectral counts (SpC) for HCF1 are shown. (B) Protein pulldowns of HT-OGT coupled with mass spectrometry identify HCF1, TET2, TET3, and all components of SET1/COMPASS as partners of OGT. Biological duplicates and SpC for each protein identified are shown for HT-OGT and Ctrl isolations. (C) The interaction of HCF1 and SET1/COMPASS components with HT-OGT depends on O-GlcNAc activity. Plot showing average SpCs for HCF1 and SET1/COMPASS components isolated from HT-OGT pulldowns of untreated (grey bars) and Alloxan-treated (green bars) HEK293T cells. Error bars represent s.d. of biological duplicates. Representative NSAF plots are shown in Supplementary Figure 11. (D) The interaction of HT-SETD1A with SET1/COMPASS components and OGT is reduced by a TET2/3 double kd. Plot showing average SpCs for SET1/COMPASS components and OGT isolated from HT-SETD1A pulldowns of control RNAi-treated (grey bars) and TET2/3 kd (blue bars) HEK293T cells. Error bars represent s.d. of biological duplicates. Representative NSAF plots are shown in Supplementary Figure 11. (E) A significant reduction in HCF1 GlcNAcylation is observed after TET2/3 double kd. Upper diagram shows a schematic representation of full-length HCF1 and its domains (Capotosti et al, 2011). The GlcNAcylated peptides identified by mass spectrometry from HT-SETD1A isolations from control RNAi-treated and TET2/3 kd cells are indicated below. The full-length HCF1 amino-acid sequence (NP_005325.2) shows the corresponding GlcNAcylated peptides highlighted in yellow with RNAi Ctrl on the left and RNAi TET2/3 kd on the right. (F) Bioluminescence resonance energy transfer (BRET) assays show reduction of SETD1A binding to histone H3.3 in the presence of an OGT inhibitor and in TET2/3 kd cells. Upper diagram showing the schematic of BRET energy transfer upon binding of a NanoLuc-SETD1A fusion donor and fluorescently labelled Histone H3.3-HaloTag fusion acceptor in live HEK293T cells (see Materials and methods for experimental details and calculation of BRET). Left: BRET measurements were calculated without treatment (grey) or with Alloxan treatment (green). Right: BRET measurement for RNAi control (grey) or RNAi TET2/3 (blue). Biological triplicates ±s.d. are shown.
Figure 3 TET2/3 promotes GlcNAcylation of HCF1, and both TET and OGT activity favour the integrity of SET1/COMPASS and SETD1A binding to chromatin. (A) Mass spectrometry reveals HCF1, a known target of OGT (Wysocka et al, 2003) and component of SET1/COMPASS (Lee et al, 2010), as an interacting partner of HT-TET2 and HT-TET3. Biological duplicates and respective spectral counts (SpC) for HCF1 are shown. (B) Protein pulldowns of HT-OGT coupled with mass spectrometry identify HCF1, TET2, TET3, and all components of SET1/COMPASS as partners of OGT. Biological duplicates and SpC for each protein identified are shown for HT-OGT and Ctrl isolations. (C) The interaction of HCF1 and SET1/COMPASS components with HT-OGT depends on O-GlcNAc activity. Plot showing average SpCs for HCF1 and SET1/COMPASS components isolated from HT-OGT pulldowns of untreated (grey bars) and Alloxan-treated (green bars) HEK293T cells. Error bars represent s.d. of biological duplicates. Representative NSAF plots are shown in Supplementary Figure 11. (D) The interaction of HT-SETD1A with SET1/COMPASS components and OGT is reduced by a TET2/3 double kd. Plot showing average SpCs for SET1/COMPASS components and OGT isolated from HT-SETD1A pulldowns of control RNAi-treated (grey bars) and TET2/3 kd (blue bars) HEK293T cells. Error bars represent s.d. of biological duplicates. Representative NSAF plots are shown in Supplementary Figure 11. (E) A significant reduction in HCF1 GlcNAcylation is observed after TET2/3 double kd. Upper diagram shows a schematic representation of full-length HCF1 and its domains (Capotosti et al, 2011). The GlcNAcylated peptides identified by mass spectrometry from HT-SETD1A isolations from control RNAi-treated and TET2/3 kd cells are indicated below. The full-length HCF1 amino-acid sequence (NP_005325.2) shows the corresponding GlcNAcylated peptides highlighted in yellow with RNAi Ctrl on the left and RNAi TET2/3 kd on the right. (F) Bioluminescence resonance energy transfer (BRET) assays show reduction of SETD1A binding to histone H3.3 in the presence of an OGT inhibitor and in TET2/3 kd cells. Upper diagram showing the schematic of BRET energy transfer upon binding of a NanoLuc-SETD1A fusion donor and fluorescently labelled Histone H3.3-HaloTag fusion acceptor in live HEK293T cells (see Materials and methods for experimental details and calculation of BRET). Left: BRET measurements were calculated without treatment (grey) or with Alloxan treatment (green). Right: BRET measurement for RNAi control (grey) or RNAi TET2/3 (blue). Biological triplicates ±s.d. are shown.CC BY-NC-SA · PubMed Central
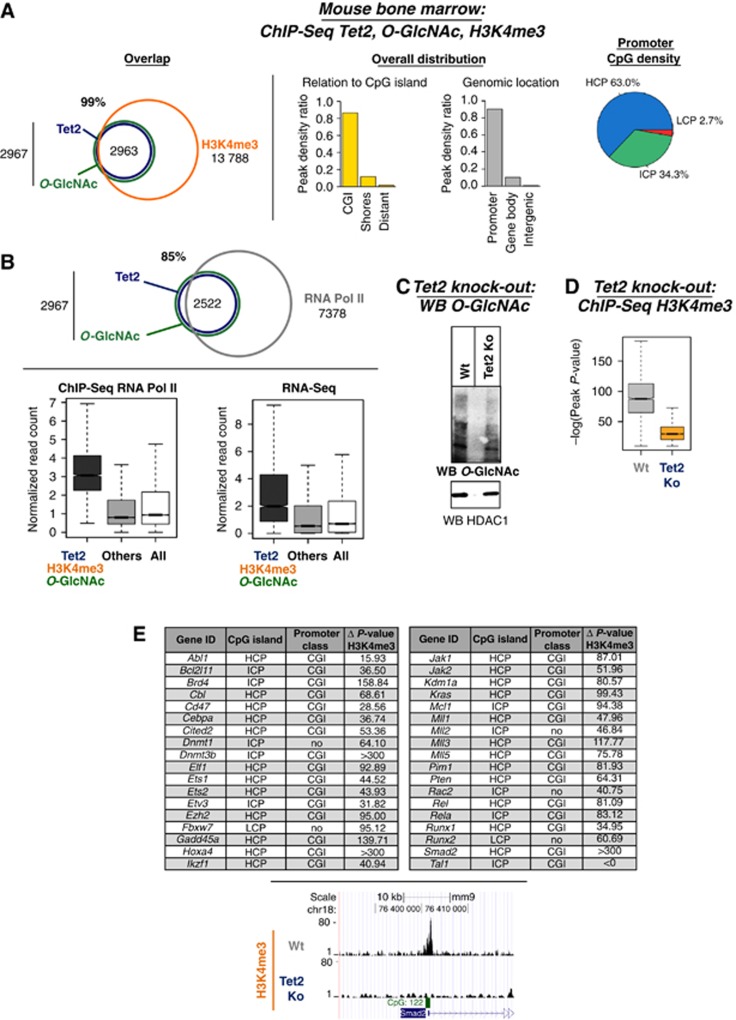
Figure 4 Tet2 knockout mouse tissue shows that Tet2 is needed for global GlcNAcylation and H3K4me3 at target promoters. (A) Genome-wide co-localization of endogenous Tet2 with O-GlcNAc and H3K4me3 at promoters and CpG-rich regions. Venn diagrams are shown (P-value overlap<10−10) as well as the indicated genome-wide distribution. (B) Tet2, O-GlcNAc, and H3K4me3 are enriched at many active genes, mirroring the presence of RNA Pol II. Upper panel: Venn diagram showing the overlap of Tet2 and O-GlcNAc with RNA Pol II (P-value overlap <10−10); lower panel: Box plots showing the reads density at targets and non-targets (others) for ChIP-Seq RNA Pol II or RNA-Seq in mouse bone marrow. (C) Global decrease in GlcNAcylation is observed in Tet2 knockout mouse bone marrow. Mouse bone marrow tissues with or without a Tet2 knockout were analysed by western blot for O-GlcNAc levels using an anti-O-GlcNAc antibody. HDAC1 is shown as loading control. (D) ChIP-Seq for H3K4me3 in Tet2 knockout mouse tissues shows reduced global H3K4me3 at target promoters. Overall impact on H3K4me3 peak significance (−log(P-value) of the peaks) between wild-type and Tet2 knockout bone marrow is shown. (E) Table showing key haematopoietic genes with specifically reduced H3K4me3 in Tet2 knockout as compared to wild type. The location at CpG islands and the promoter class for each is listed. Lower part: example of H3K4me3 ChIP-Seq profiles (UCSC tracks) in wild type versus Tet2 knockout.
Figure 4 Tet2 knockout mouse tissue shows that Tet2 is needed for global GlcNAcylation and H3K4me3 at target promoters. (A) Genome-wide co-localization of endogenous Tet2 with O-GlcNAc and H3K4me3 at promoters and CpG-rich regions. Venn diagrams are shown (P-value overlap<10−10) as well as the indicated genome-wide distribution. (B) Tet2, O-GlcNAc, and H3K4me3 are enriched at many active genes, mirroring the presence of RNA Pol II. Upper panel: Venn diagram showing the overlap of Tet2 and O-GlcNAc with RNA Pol II (P-value overlap <10−10); lower panel: Box plots showing the reads density at targets and non-targets (others) for ChIP-Seq RNA Pol II or RNA-Seq in mouse bone marrow. (C) Global decrease in GlcNAcylation is observed in Tet2 knockout mouse bone marrow. Mouse bone marrow tissues with or without a Tet2 knockout were analysed by western blot for O-GlcNAc levels using an anti-O-GlcNAc antibody. HDAC1 is shown as loading control. (D) ChIP-Seq for H3K4me3 in Tet2 knockout mouse tissues shows reduced global H3K4me3 at target promoters. Overall impact on H3K4me3 peak significance (−log(P-value) of the peaks) between wild-type and Tet2 knockout bone marrow is shown. (E) Table showing key haematopoietic genes with specifically reduced H3K4me3 in Tet2 knockout as compared to wild type. The location at CpG islands and the promoter class for each is listed. Lower part: example of H3K4me3 ChIP-Seq profiles (UCSC tracks) in wild type versus Tet2 knockout.CC BY-NC-SA · PubMed Central
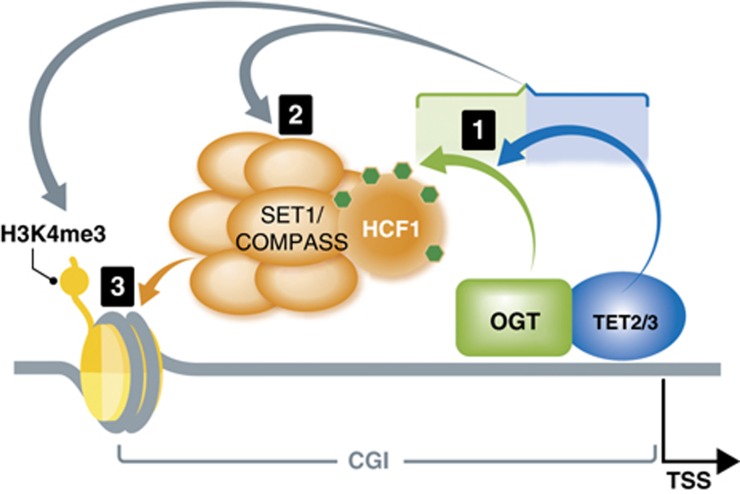
Figure 5 Model connecting DNA modifying enzymes, TETs, a master cellular sensor protein, OGT, and a histone modifying complex, SET1/COMPASS. Based on our findings, a hierarchical model of the involved proteins, with the cascade of their respective activities, can be envisaged as followed: (1) The first sequence of events in the cascade is the formation of TET2/3–OGT interaction, which promotes OGT GlcNAcylation on numerous proteins, including HCF1; (2) In a TET-dependent manner, a GlcNAcylated HCF1 is important for the formation of the SET1/COMPASS; (3) In the last step, both TET proteins and OGT activity favour binding of SETD1A to chromatin, an event necessary for histone H3K4me3 and subsequent transcriptional activation.
Figure 5 Model connecting DNA modifying enzymes, TETs, a master cellular sensor protein, OGT, and a histone modifying complex, SET1/COMPASS. Based on our findings, a hierarchical model of the involved proteins, with the cascade of their respective activities, can be envisaged as followed: (1) The first sequence of events in the cascade is the formation of TET2/3–OGT interaction, which promotes OGT GlcNAcylation on numerous proteins, including HCF1; (2) In a TET-dependent manner, a GlcNAcylated HCF1 is important for the formation of the SET1/COMPASS; (3) In the last step, both TET proteins and OGT activity favour binding of SETD1A to chromatin, an event necessary for histone H3K4me3 and subsequent transcriptional activation.CC BY-NC-SA · PubMed Central

Verification

Claims the paper makes

The claims and statistics of this paper haven’t been checked yet.

Run the check — free, no account needed. It reads the open-access text and checks the sources it cites.

A few free checks a day · papers already verified open instantly · results are public

Claims other papers make about this one

Each is checked against this paper’s own text: does it say what the citing paper says it does?

Self-check

Percentages, sums and reported differences re-computed from the paper’s own numbers.

The self-check needs the paper’s full text.

Citations

Cites

Show all 8 references

Research works printed but not linked: 21

  1. Bonasio R, Tu S, Reinberg D (2010) Molecular signals of epigenetic states. Science 330: 612–616 · DOI · Paper page
  2. Capotosti F, Guernier S, Lammers F, Waridel P, Cai Y, Jin J, Conaway JW, Conaway RC, Herr W (2011) O‐GlcNAc transferase catalyzes site‐specific proteolysis of HCF‐1. Cell 144: 376–388 · DOI
  3. Daniels DL, Mendez J, Mosley AL, Ramisetty SR, Murphy N, Benink H, Wood KV, Urh M, Washburn MP (2012) Examining the complexity of human RNA polymerase complexes using HaloTag technology coupled to label free quantitative proteomics. J Proteome Res 11: 564–575 · DOI
  4. Ficz G, Branco MR, Seisenberger S, Santos F, Krueger F, Hore TA, Marques CJ, Andrews S, Reik W (2011) Dynamic regulation of 5‐hydroxymethylcytosine in mouse ES cells and during differentiation. Nature 473: 398–402 · DOI
  5. Fujiki R, Chikanishi T, Hashiba W, Ito H, Takada I, Roeder RG, Kitagawa H, Kato S (2009) GlcNAcylation of a histone methyltransferase in retinoic‐acid‐induced granulopoiesis. Nature 459: 455–459 · DOI
  6. Fujiki R, Hashiba W, Sekine H, Yokoyama A, Chikanishi T, Ito S, Imai Y, Kim J, He HH, Igarashi K, Kanno J, Ohtake F, Kitagawa H, Roeder RG, Brown M, Kato S (2011) GlcNAcylation of histone H2B facilitates its monoubiquitination. Nature 480: 557–560 · DOI
  7. Gambetta MC, Oktaba K, Muller J (2009) Essential role of the glycosyltransferase sxc/Ogt in polycomb repression. Science 325: 93–96 · DOI · Paper page
  8. Gu TP, Guo F, Yang H, Wu HP, Xu GF, Liu W, Xie ZG, Shi L, He X, Jin SG, Iqbal K, Shi YG, Deng Z, Szabo PE, Pfeifer GP, Li J, Xu GL (2011) The role of Tet3 DNA dioxygenase in epigenetic reprogramming by oocytes. Nature 477: 606–610 · DOI
  9. Hartzell DD, Trinklein ND, Mendez J, Murphy N, Aldred SF, Wood K, Urh M (2009) A functional analysis of the CREB signaling pathway using HaloCHIP‐chip and high throughput reporter assays. BMC Genomics 10: 497 · DOI
  10. Ito S, D'Alessio AC, Taranova OV, Hong K, Sowers LC, Zhang Y (2010) Role of Tet proteins in 5mC to 5hmC conversion, ES‐cell self‐renewal and inner cell mass specification. Nature 466: 1129–1133 · DOI · Paper page
  11. Langemeijer SM, Kuiper RP, Berends M, Knops R, Aslanyan MG, Massop M, Stevens‐Linders E, van Hoogen P, van Kessel AG, Raymakers RA, Kamping EJ, Verhoef GE, Verburgh E, Hagemeijer A, Vandenberghe P, de Witte T, van der Reijden BA, Jansen JH (2009) Acquired mutations in TET2 are common in myelodysplastic syndromes. Nat Genet 41: 838–842 · DOI · Paper page
  12. Lee JS, Smith E, Shilatifard A (2010) The language of histone crosstalk. Cell 142: 682–685 · DOI
  13. Los GV, Encell LP, McDougall MG, Hartzell DD, Karassina N, Zimprich C, Wood MG, Learish R, Ohana RF, Urh M, Simpson D, Mendez J, Zimmerman K, Otto P, Vidugiris G, Zhu J, Darzins A, Klaubert DH, Bulleit RF, Wood KV (2008) HaloTag: a novel protein labeling technology for cell imaging and protein analysis. ACS Chem Biol 3: 373–382 · DOI · Paper page
  14. Narayanan A, Ruyechan WT, Kristie TM (2007) The coactivator host cell factor‐1 mediates Set1 and MLL1 H3K4 trimethylation at herpesvirus immediate early promoters for initiation of infection. Proc Natl Acad Sci USA 104: 10835–10840 · DOI
  15. Quivoron C, Couronne L, Della VV, Lopez CK, Plo I, Wagner‐Ballon O, Do Cruzeiro M, Delhommeau F, Arnulf B, Stern MH, Godley L, Opolon P, Tilly H, Solary E, Duffourd Y, Dessen P, Merle‐Beral H, Nguyen‐Khac F, Fontenay M, Vainchenker W et al (2011) TET2 inactivation results in pleiotropic hematopoietic abnormalities in mouse and is a recurrent event during human lymphomagenesis. Cancer Cell 20: 25–38 · DOI · Paper page
  16. Slawson C, Hart GW (2011) O‐GlcNAc signalling: implications for cancer cell biology. Nat Rev Cancer 11: 678–684 · DOI
  17. Tahiliani M, Koh KP, Shen Y, Pastor WA, Bandukwala H, Brudno Y, Agarwal S, Iyer LM, Liu DR, Aravind L, Rao A (2009) Conversion of 5‐methylcytosine to 5‐hydroxymethylcytosine in mammalian DNA by MLL partner TET1. Science 324: 930–935 · DOI · Paper page
  18. Tyagi S, Herr W (2009) E2F1 mediates DNA damage and apoptosis through HCF‐1 and the MLL family of histone methyltransferases. EMBO J 28: 3185–3195 · DOI
  19. Wu H, D'Alessio AC, Ito S, Xia K, Wang Z, Cui K, Zhao K, Sun YE, Zhang Y (2011) Dual functions of Tet1 in transcriptional regulation in mouse embryonic stem cells. Nature 473: 389–393 · DOI · Paper page
  20. Wysocka J, Myers MP, Laherty CD, Eisenman RN, Herr W (2003) Human Sin3 deacetylase and trithorax‐related Set1/Ash2 histone H3‐K4 methyltransferase are tethered together selectively by the cell‐proliferation factor HCF‐1. Genes Dev 17: 896–911 · DOI
  21. Ndlovu MN, Denis H, Fuks F (2011) Exposing the DNA methylome iceberg. Trends Biochem Sci 36: 381–387

Cited by

Metadata

Authors
Deplus, R., Delatte, B., Schwinn, M. K., Defrance, M., Méndez, J., Murphy, N., Dawson, M. A., Volkmar, M., Putmans, P., Calonne, E., Shih, A. H., Levine, R. L., Bernard, O., Mercher, T., Solary, E., Urh, M., Daniels, D. L., & Fuks, F.
Venue
The EMBO Journal
Published
2013-01-25
Volume
32
Issue
5
Pages
645-655
ISSN
  • 0261-4189
  • 1460-2075
Cited by
486
References
8
Language
en

About these checks

Registry, retraction, Cites and statistics results are computed, not judged, with one exception: a printed reference that no index lists is read once by a model before it counts as a citation error. Claims are extracted by a model and kept only when their quote appears verbatim in the text; each cited source is then checked, with a model’s help, for whether it says what the claim relies on. Those verdicts can be wrong — read the claim’s quote and the cited source before relying on one.

Statistics and arithmetic are recomputed, not judged.

Confidence bands are shown only for fields calibrated on our annotated test set. None is calibrated yet, so no band is shown.

What counts as a claim ›How we measure confidence ›How we check this ›

Are you an author, or do you see a problem with this page? Request a review