CoChat

Reversible changes in pancreatic islet structure and function produced by elevated blood glucose

Open access

The DOI matches its Crossref record; 46 of the 46 references it cites were found in a registry or an index.

Abstract

Diabetes is characterized by hyperglycaemia due to impaired insulin secretion and aberrant glucagon secretion resulting from changes in pancreatic islet cell function and/or mass. The extent to which hyperglycaemia per se underlies these alterations remains poorly understood. Here we show that β-cell-specific expression of a human activating K ATP channel mutation in adult mice leads to rapid diabetes and marked alterations in islet morphology, ultrastructure and gene expression. Chronic hyperglycaemia is associated with a dramatic reduction in insulin-positive cells and an increase in glucagon-positive cells in islets, without alterations in cell turnover. Furthermore, some β-cells begin expressing glucagon, whilst retaining many β-cell characteristics. Hyperglycaemia, rather than K ATP channel activation, underlies these changes, as they are prevented by insulin therapy and fully reversed by sulphonylureas. Our data suggest that many changes in islet structure and function associated with diabetes are attributable to hyperglycaemia alone and are reversed when blood glucose is normalized.

Overview

The claims and statistics of this paper haven’t been checked yet.

Free: it reads the open-access text and checks the first 5 claims that cite a source we can check. Create a free account to check every claim.

A few free checks a day · papers already verified open instantly · results are public

Integrity signals

Registry

Crossref · 10.1038/ncomms5639

Cites

46 of 46 references verified0 citation errors · 0 not checkable

Statistics

Figures

Figure 1 Gene induction results in rapid diabetes that is normalized by insulin and SU therapy. (a) Blood glucose levels for 12-week-old βV59M (open circle, black star) and control (black circle, n=41) mice. Mice were injected with tamoxifen (Tx) as indicated by the arrow to induce Kir6.2-V59M expression. Some Tx-injected mice were subsequently implanted with a subcutaneous slow-release placebo pellet at time zero (black star, n=35), whereas others were not (open circle, n=31). (b,c) Blood glucose levels measured in βV59M mice injected with Tx (arrow) and subsequently implanted (arrow) with an insulin pellet (b; open square, n=6) or glibenclamide pellet (c; open triangle, n=19). Control mice (black circle) and Tx-induced untreated βV59M mice (open circle) are the same data as in Fig. 1a. (d) βV59M mice injected with Tx (arrow) and subsequently implanted (arrow) with a glibenclamide pellet (Glib) after 4 weeks of diabetes (open diamond, n=6). Control littermates (black circle, n=6) were sham injected with Tx. Data are mean values±s.e.m.
Figure 1 Gene induction results in rapid diabetes that is normalized by insulin and SU therapy. (a) Blood glucose levels for 12-week-old βV59M (open circle, black star) and control (black circle, n=41) mice. Mice were injected with tamoxifen (Tx) as indicated by the arrow to induce Kir6.2-V59M expression. Some Tx-injected mice were subsequently implanted with a subcutaneous slow-release placebo pellet at time zero (black star, n=35), whereas others were not (open circle, n=31). (b,c) Blood glucose levels measured in βV59M mice injected with Tx (arrow) and subsequently implanted (arrow) with an insulin pellet (b; open square, n=6) or glibenclamide pellet (c; open triangle, n=19). Control mice (black circle) and Tx-induced untreated βV59M mice (open circle) are the same data as in Fig. 1a. (d) βV59M mice injected with Tx (arrow) and subsequently implanted (arrow) with a glibenclamide pellet (Glib) after 4 weeks of diabetes (open diamond, n=6). Control littermates (black circle, n=6) were sham injected with Tx. Data are mean values±s.e.m.CC BY · PubMed Central
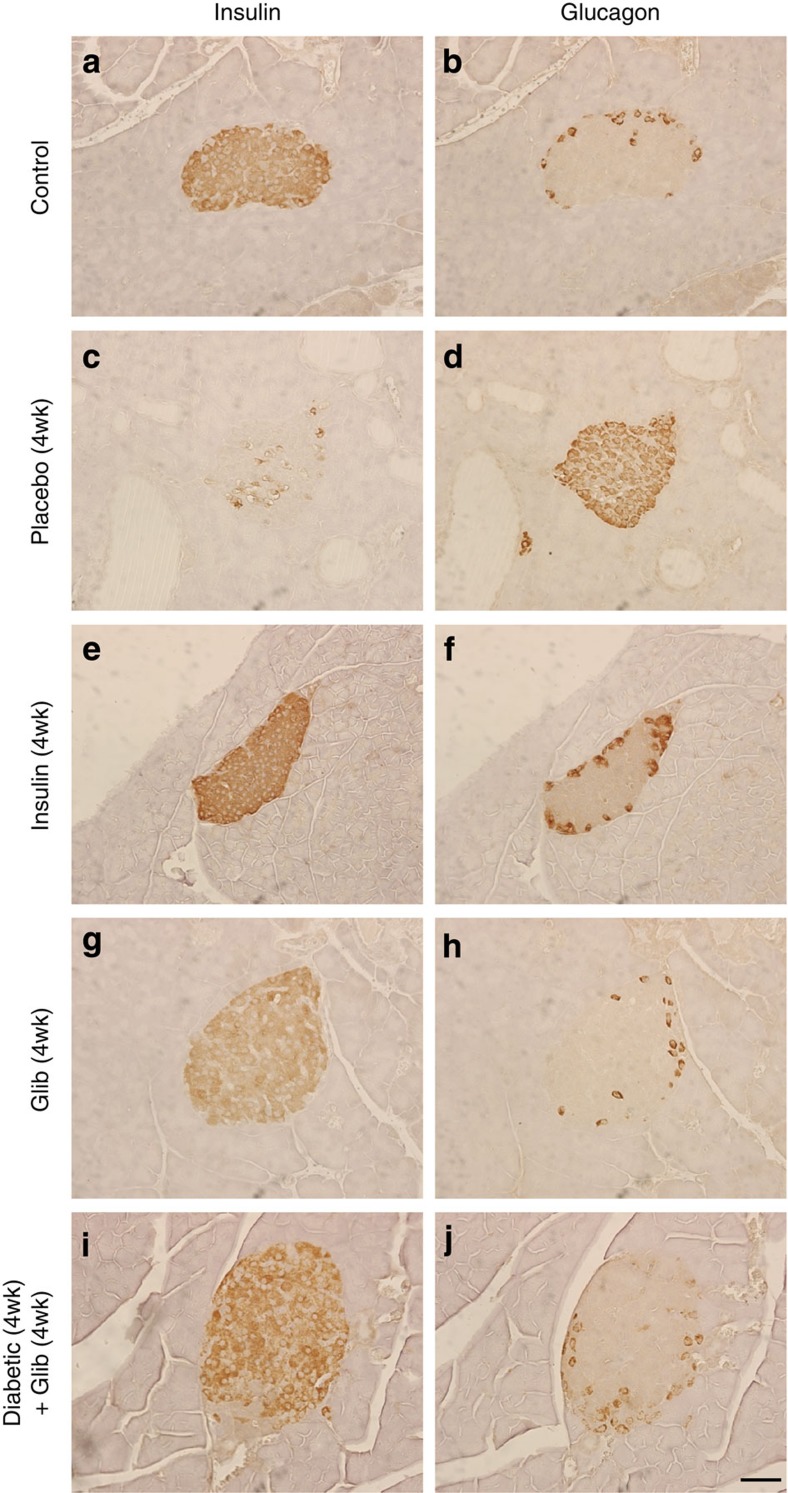
Figure 2 Chronic hyperglycaemia alters insulin and glucagon immunostaining in pancreatic islets. Representative serial sections of mouse pancreas immunostained for insulin (left) or glucagon (right) using DAB (brown). Control mouse pancreas (a,b). βV59M mouse pancreas 4 weeks after implantation with a placebo (c,d), insulin (e,f), or glibenclamide (g,h) pellet. (i,j) Islets from βV59M mice exposed to 4 weeks of hyperglycaemia and then 4 weeks of glibenclamide therapy (n=4). Results are representative of four (a–d,i–j) or three (g,h) mice. Scale bar, 50 μm (applies to all panels).
Figure 2 Chronic hyperglycaemia alters insulin and glucagon immunostaining in pancreatic islets. Representative serial sections of mouse pancreas immunostained for insulin (left) or glucagon (right) using DAB (brown). Control mouse pancreas (a,b). βV59M mouse pancreas 4 weeks after implantation with a placebo (c,d), insulin (e,f), or glibenclamide (g,h) pellet. (i,j) Islets from βV59M mice exposed to 4 weeks of hyperglycaemia and then 4 weeks of glibenclamide therapy (n=4). Results are representative of four (a–d,i–j) or three (g,h) mice. Scale bar, 50 μm (applies to all panels).CC BY · PubMed Central
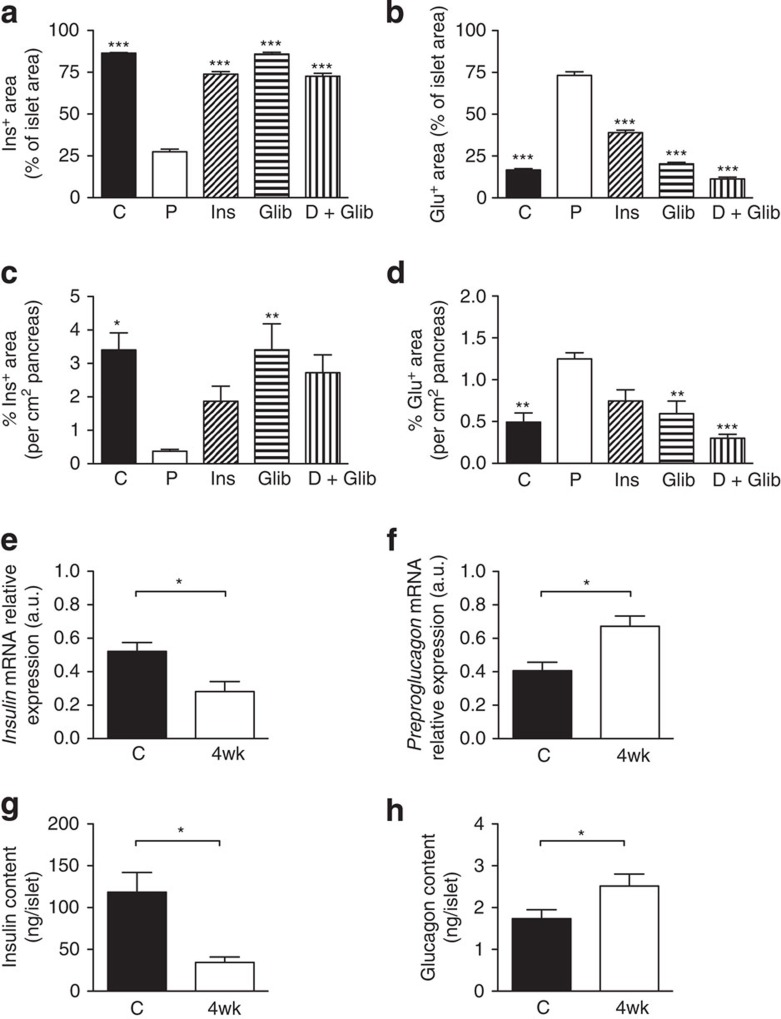
Figure 3 Effects of chronic hyperglycaemia on insulin and glucagon levels. Mean islet cross-sectional area immunostaining for insulin (a,c) or glucagon (b,d), expressed either as a percentage of the total islet cross-sectional area (a,b) or per cm2 of pancreas (c,d). Once plasma glucose exceeded 20 mM, βV59M mice were treated for 4 weeks with placebo (P), insulin (Ins) or glibenclamide (Glib); or, following 4 weeks of no therapy, with 4 weeks of glibenclamide (D+Glib). Data are mean±s.e.m. of three to six mice per genotype (five sections per mouse, 100 μm apart). (*P<0.05; **P<0.01, ***P<0.001 compared with placebo (P); one-way analysis of variance followed by post-hoc Bonferroni test). Insulin (e) and preproglucagon (f) mRNA levels determined by qPCR in islets isolated from control (C, black bars) and 4-week-diabetic (4wk, white bars) βV59M mice (n=6–7 per genotype). Insulin (g) and glucagon (h) protein content of islets determined by radioimmunoassay from control (C) and 4-week-diabetic (4wk) βV59M mice (*P<0.05; Mann–Whitney test; n=6–7 per genotype). Data are mean values±s.e.m.
Figure 3 Effects of chronic hyperglycaemia on insulin and glucagon levels. Mean islet cross-sectional area immunostaining for insulin (a,c) or glucagon (b,d), expressed either as a percentage of the total islet cross-sectional area (a,b) or per cm2 of pancreas (c,d). Once plasma glucose exceeded 20 mM, βV59M mice were treated for 4 weeks with placebo (P), insulin (Ins) or glibenclamide (Glib); or, following 4 weeks of no therapy, with 4 weeks of glibenclamide (D+Glib). Data are mean±s.e.m. of three to six mice per genotype (five sections per mouse, 100 μm apart). (*P<0.05; **P<0.01, ***P<0.001 compared with placebo (P); one-way analysis of variance followed by post-hoc Bonferroni test). Insulin (e) and preproglucagon (f) mRNA levels determined by qPCR in islets isolated from control (C, black bars) and 4-week-diabetic (4wk, white bars) βV59M mice (n=6–7 per genotype). Insulin (g) and glucagon (h) protein content of islets determined by radioimmunoassay from control (C) and 4-week-diabetic (4wk) βV59M mice (*P<0.05; Mann–Whitney test; n=6–7 per genotype). Data are mean values±s.e.m.CC BY · PubMed Central
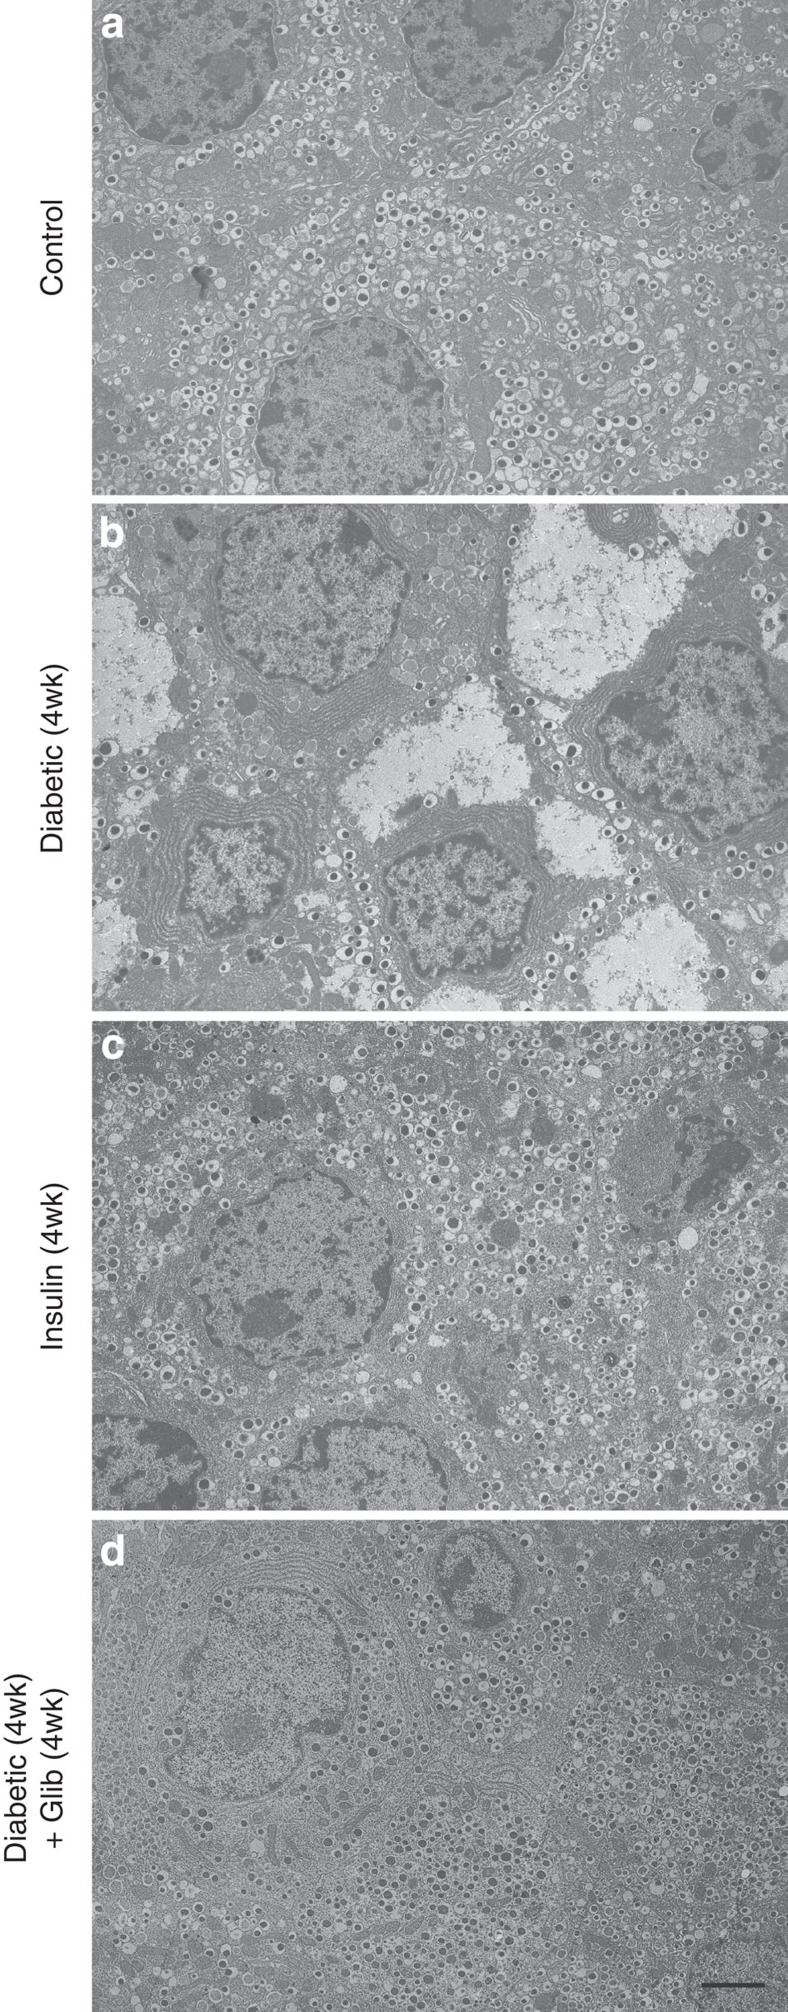
Figure 4 Chronic hyperglycaemia reversibly alters β-cell ultrastructure. Representative electron micrographs of pancreatic sections from control mice (a), βV59M mice exposed to hyperglycaemia for 4 weeks (b), βV59M mice treated with insulin for 4 weeks (c) and βV59M mice that were hyperglycaemic for 4 weeks and then treated with glibenclamide for 4 weeks (d). Scale bar, 2 μm (refers to all panels). Images are representative of: a, 9 mice/9 islets/150 β-cells; b, 3 mice/9 islets/134 β-cells; c, 2 mice/3 islets/100 β-cells; d, 3 mice/3 islets/105 β-cells.
Figure 4 Chronic hyperglycaemia reversibly alters β-cell ultrastructure. Representative electron micrographs of pancreatic sections from control mice (a), βV59M mice exposed to hyperglycaemia for 4 weeks (b), βV59M mice treated with insulin for 4 weeks (c) and βV59M mice that were hyperglycaemic for 4 weeks and then treated with glibenclamide for 4 weeks (d). Scale bar, 2 μm (refers to all panels). Images are representative of: a, 9 mice/9 islets/150 β-cells; b, 3 mice/9 islets/134 β-cells; c, 2 mice/3 islets/100 β-cells; d, 3 mice/3 islets/105 β-cells.CC BY · PubMed Central
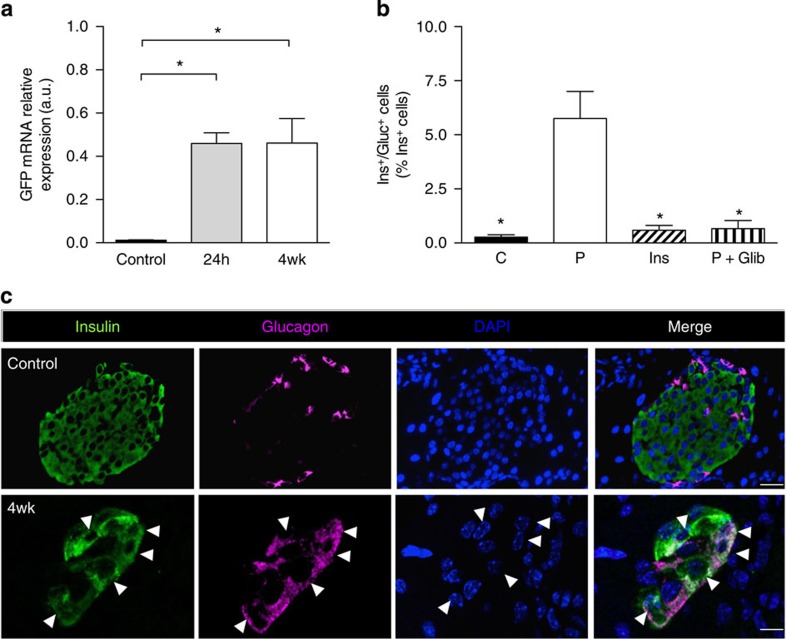
Figure 5 Insulin/glucagon double-positive cells are reversibly increased by hyperglycaemia. (a). GFP mRNA levels determined by qPCR in islets isolated from control mice and βV59M mice 24-h (24 h) and 4 weeks (4wk) after diabetes onset. Data are mean values±s.e.m., n=4 per genotype. (*P<0.05; one-way analysis of variance (ANOVA) followed by post-hoc Bonferroni test). (b) Dual ins+/glu+ cells expressed as a percentage of the total number of ins+ cells. Control islets (C). Islets from βV59M mice implanted with placebo (P) or insulin (Ins) for 4 weeks, or treated for 4 weeks with glibenclamide after 4 weeks of hyperglycaemia (P+Glib). Data are mean values±s.e.m., n=2,600–7,700 ins+ cells; n=92–127 islets; n=3–4 mice per genotype. (*P<0.05 compared with placebo (P); one-way ANOVA followed by post-hoc Bonferroni test). (c) Representative example of immunofluorescence staining for insulin (green), glucagon (pink), DAPI (4′,6-diamidino-2-phenylindole; blue) and merged data (white) in control islets and 4-week βV59M diabetic islets. White arrowheads indicate cells positive for both insulin and glucagon. Scale bars, 50 μm control; 10 μm 4-week βV59M diabetic islets.
Figure 5 Insulin/glucagon double-positive cells are reversibly increased by hyperglycaemia. (a). GFP mRNA levels determined by qPCR in islets isolated from control mice and βV59M mice 24-h (24 h) and 4 weeks (4wk) after diabetes onset. Data are mean values±s.e.m., n=4 per genotype. (*P<0.05; one-way analysis of variance (ANOVA) followed by post-hoc Bonferroni test). (b) Dual ins+/glu+ cells expressed as a percentage of the total number of ins+ cells. Control islets (C). Islets from βV59M mice implanted with placebo (P) or insulin (Ins) for 4 weeks, or treated for 4 weeks with glibenclamide after 4 weeks of hyperglycaemia (P+Glib). Data are mean values±s.e.m., n=2,600–7,700 ins+ cells; n=92–127 islets; n=3–4 mice per genotype. (*P<0.05 compared with placebo (P); one-way ANOVA followed by post-hoc Bonferroni test). (c) Representative example of immunofluorescence staining for insulin (green), glucagon (pink), DAPI (4′,6-diamidino-2-phenylindole; blue) and merged data (white) in control islets and 4-week βV59M diabetic islets. White arrowheads indicate cells positive for both insulin and glucagon. Scale bars, 50 μm control; 10 μm 4-week βV59M diabetic islets.CC BY · PubMed Central
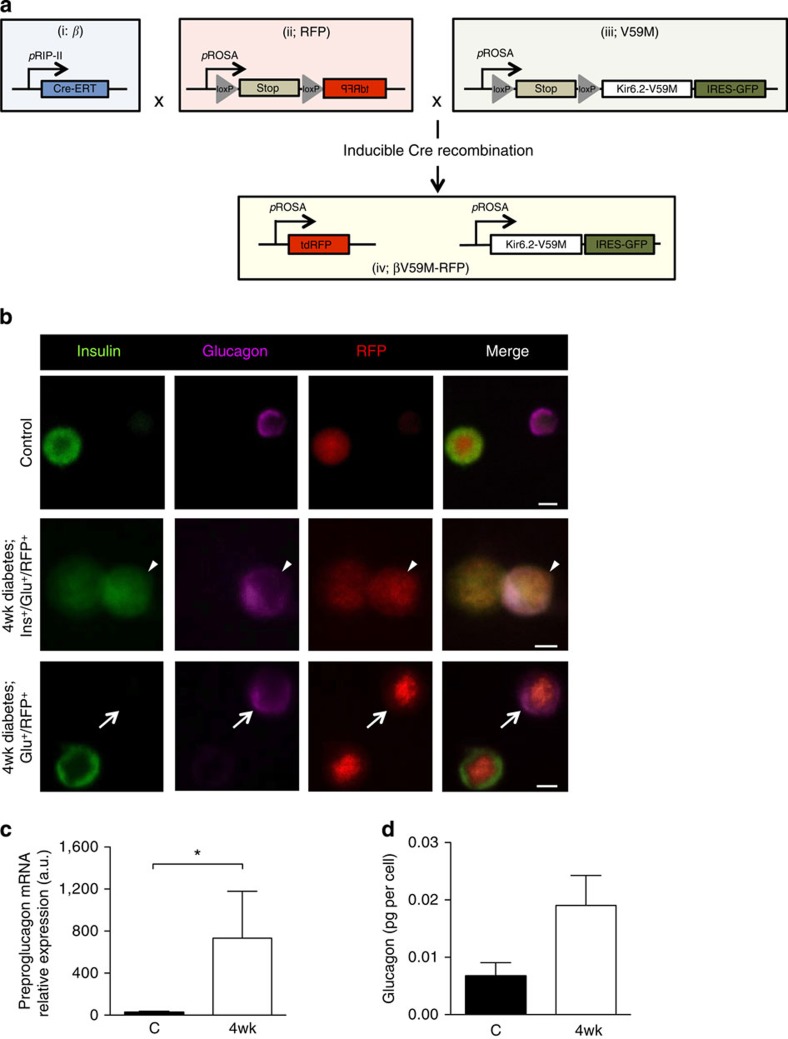
Figure 6 Chronic hyperglycaemia induces glucagon expression in β-cells. (a) Schematic illustrating how Rip-CreER+/+ (i), RosaRFP/− (ii) and RosaV59M/− (iii) were used to generate RosaRFP/V59M mice (βV59M-RFP mice). β-Cells were selectively and irreversibly labelled following tamoxifen injection, by crossing an inducible rat insulin promoter Cre line (i; β) with a floxed tdRFP reporter line in which tdRFP expression was driven by the endogenous ROSA promoter (ii; RFP). These β-RFP control mice were then crossed with an inducible Kir6.2-V59M line (iii; V59M) to create βV59M-RFP mice (iv). (b) Representative examples of immunofluorescence staining for insulin (green), glucagon (pink) and RFP (red) in control (top panel, β-RFP) and 4-week-diabetic βV59M-RFP (middle and bottom panels) isolated islet cells. White arrows, RFP+/glu+ cells. White arrowhead, RFP+/glu+/ins+ cell. Scale bar, 10 μm. (c,d) Islet cells from β-RFP and 4-week-diabetic βV59M-RFP mice were FAC-sorted into RFP+ and RFP− populations, and analysed for preproglucagon mRNA by qPCR (c) and glucagon protein (d); n=4 mice per genotype. Data are mean values±s.e.m. *P<0.05; Mann–Whitney test.
Figure 6 Chronic hyperglycaemia induces glucagon expression in β-cells. (a) Schematic illustrating how Rip-CreER+/+ (i), RosaRFP/− (ii) and RosaV59M/− (iii) were used to generate RosaRFP/V59M mice (βV59M-RFP mice). β-Cells were selectively and irreversibly labelled following tamoxifen injection, by crossing an inducible rat insulin promoter Cre line (i; β) with a floxed tdRFP reporter line in which tdRFP expression was driven by the endogenous ROSA promoter (ii; RFP). These β-RFP control mice were then crossed with an inducible Kir6.2-V59M line (iii; V59M) to create βV59M-RFP mice (iv). (b) Representative examples of immunofluorescence staining for insulin (green), glucagon (pink) and RFP (red) in control (top panel, β-RFP) and 4-week-diabetic βV59M-RFP (middle and bottom panels) isolated islet cells. White arrows, RFP+/glu+ cells. White arrowhead, RFP+/glu+/ins+ cell. Scale bar, 10 μm. (c,d) Islet cells from β-RFP and 4-week-diabetic βV59M-RFP mice were FAC-sorted into RFP+ and RFP− populations, and analysed for preproglucagon mRNA by qPCR (c) and glucagon protein (d); n=4 mice per genotype. Data are mean values±s.e.m. *P<0.05; Mann–Whitney test.CC BY · PubMed Central
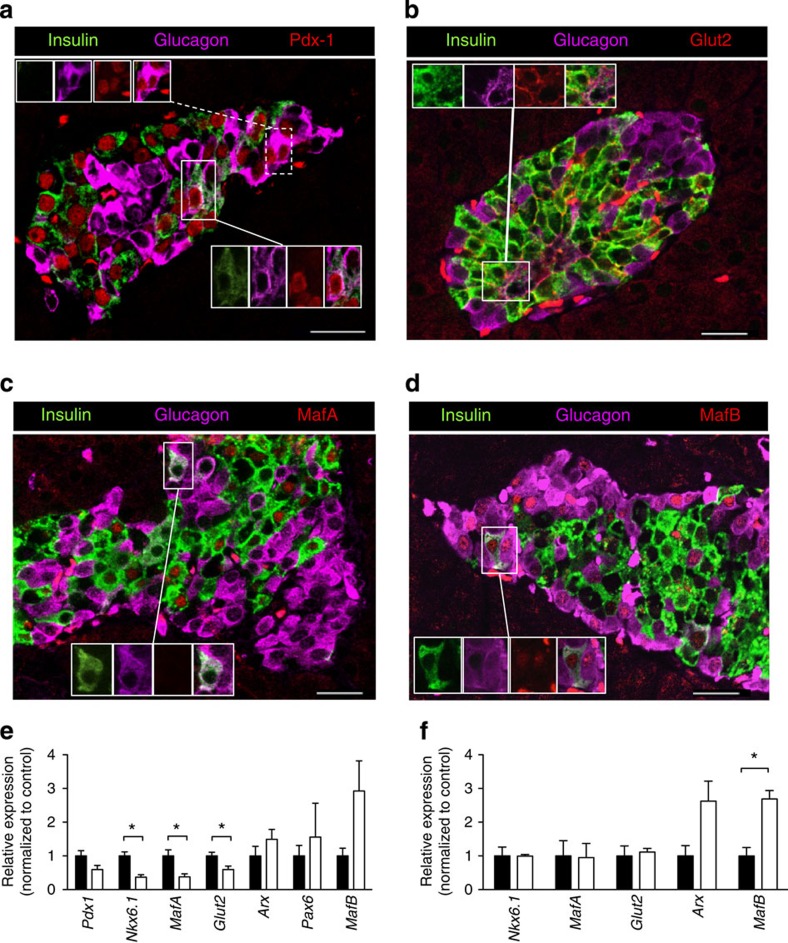
Figure 7 Effects of hyperglycaemia on islet cell transcription factors and transporters. (a–d) Representative examples of immunofluorescence staining for (red) Pdx-1 (a), Glut2 (b), MafA (c) or MafB (d) in a 4-week-diabetic βV59M islet. Insulin (green), glucagon (pink). (a) Insets show (upper) glu+ and (lower) ins+/glu+ cells that express Pdx1. (b) Inset shows an ins+/glu+ cell that expresses Glut2. (c) Inset shows an ins+/glu+ cell that does not express MafA. (d) Inset shows an ins+/glu+ cell that expresses MafB. Scale bars, 50 μm. (e) Pdx-1, Nkx6.1, MafA, Glut2, Arx, Pax6 and MafB mRNA levels assessed by qPCR in islets isolated from control mice (black bars) and 4-week-diabetic βV59M mice (white bars). Data are mean values±s.e.m., n=6–7 mice per genotype. (*P<0.05; Mann–Whitney test). (f) Nkx6.1, MafA, Glut2, Arx and MafB mRNA levels in FAC-sorted RFP+ cells isolated from control mice (black bars) and 4-week-diabetic βV59M mice (white bars). Data are mean values±s.e.m., n=4 mice per genotype. (*P<0.05; Mann–Whitney test).
Figure 7 Effects of hyperglycaemia on islet cell transcription factors and transporters. (a–d) Representative examples of immunofluorescence staining for (red) Pdx-1 (a), Glut2 (b), MafA (c) or MafB (d) in a 4-week-diabetic βV59M islet. Insulin (green), glucagon (pink). (a) Insets show (upper) glu+ and (lower) ins+/glu+ cells that express Pdx1. (b) Inset shows an ins+/glu+ cell that expresses Glut2. (c) Inset shows an ins+/glu+ cell that does not express MafA. (d) Inset shows an ins+/glu+ cell that expresses MafB. Scale bars, 50 μm. (e) Pdx-1, Nkx6.1, MafA, Glut2, Arx, Pax6 and MafB mRNA levels assessed by qPCR in islets isolated from control mice (black bars) and 4-week-diabetic βV59M mice (white bars). Data are mean values±s.e.m., n=6–7 mice per genotype. (*P<0.05; Mann–Whitney test). (f) Nkx6.1, MafA, Glut2, Arx and MafB mRNA levels in FAC-sorted RFP+ cells isolated from control mice (black bars) and 4-week-diabetic βV59M mice (white bars). Data are mean values±s.e.m., n=4 mice per genotype. (*P<0.05; Mann–Whitney test).CC BY · PubMed Central
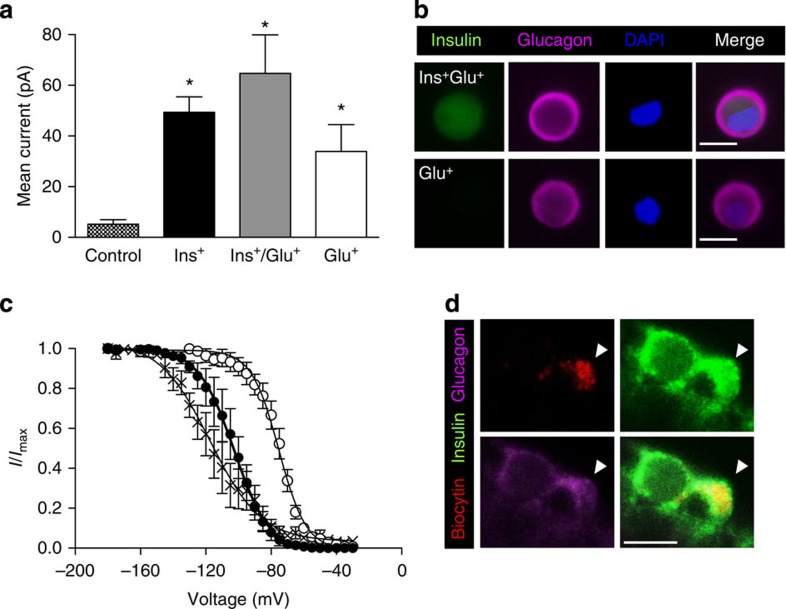
Figure 8 Glucagon-expressing β-cells retain β-cell electrophysiological characteristics. (a) Mean±s.e.m. cell-attached KATP currents from control β-cells (hatched bars; n=27) and from 4-week-diabetic βV59M islet cells that express insulin (black bars; n=48), insulin and glucagon (grey bars; n=5), or glucagon alone (white bars; n=6). (*P<0.05; one-way analysis of variance followed by post-hoc Bonferroni test). (b) Representative examples of cells exhibiting large KATP currents obtained in cell-attached patches that expressed both insulin and glucagon (top panels) or glucagon alone (bottom panels). Scale bar, 10 μm. (c) Voltage-dependent inactivation of whole-cell Na+ currents in β-cells (closed circles; n=5) and α-cells (open circles; n=6) from control mice and in ins+/glu+ cells from 4-week-diabetic βV59M mice (crosses; n=6). The pulse protocol consisted of 1 ms depolarizations to 0 mV preceded by 200 ms conditioning pulses to membrane potentials between −180 and −5 mV. Data are mean values±s.e.m. The superimposed curves represent Boltzmann fits to the data. (d) Representative example of a patched cell (indicated by the white arrowhead) showing Na+ current inactivation characteristic of a β-cell and identified by infusion of biocytin (red, upper left panel) that expressed both insulin (green, upper right) and glucagon (pink, lower left). Merged images, lower right panel. Scale bar, 10 μm.
Figure 8 Glucagon-expressing β-cells retain β-cell electrophysiological characteristics. (a) Mean±s.e.m. cell-attached KATP currents from control β-cells (hatched bars; n=27) and from 4-week-diabetic βV59M islet cells that express insulin (black bars; n=48), insulin and glucagon (grey bars; n=5), or glucagon alone (white bars; n=6). (*P<0.05; one-way analysis of variance followed by post-hoc Bonferroni test). (b) Representative examples of cells exhibiting large KATP currents obtained in cell-attached patches that expressed both insulin and glucagon (top panels) or glucagon alone (bottom panels). Scale bar, 10 μm. (c) Voltage-dependent inactivation of whole-cell Na+ currents in β-cells (closed circles; n=5) and α-cells (open circles; n=6) from control mice and in ins+/glu+ cells from 4-week-diabetic βV59M mice (crosses; n=6). The pulse protocol consisted of 1 ms depolarizations to 0 mV preceded by 200 ms conditioning pulses to membrane potentials between −180 and −5 mV. Data are mean values±s.e.m. The superimposed curves represent Boltzmann fits to the data. (d) Representative example of a patched cell (indicated by the white arrowhead) showing Na+ current inactivation characteristic of a β-cell and identified by infusion of biocytin (red, upper left panel) that expressed both insulin (green, upper right) and glucagon (pink, lower left). Merged images, lower right panel. Scale bar, 10 μm.CC BY · PubMed Central

Verification

Claims the paper makes

The claims and statistics of this paper haven’t been checked yet.

Free: it reads the open-access text and checks the first 5 claims that cite a source we can check. Create a free account to check every claim.

A few free checks a day · papers already verified open instantly · results are public

Claims other papers make about this one

Each is checked against this paper’s own text: does it say what the citing paper says it does?

Self-check

Percentages, sums and reported differences re-computed from the paper’s own numbers.

The self-check needs the paper’s full text.

Citations

Cites

Show all 46 references

Cited by

See all 259

Metadata

Authors
Brereton, M. F., Iberl, M., Shimomura, K., Zhang, Q., Adriaenssens, A. E., Proks, P., Spiliotis, I. I., Dace, W., Mattis, K. K., Ramracheya, R., Gribble, F. M., Reimann, F., Clark, A., Rorsman, P., & Ashcroft, F. M.
Affiliations
  • University of Oxford (GB)
  • Churchill Hospital (GB)
  • Addenbrooke's Hospital (GB)
Corresponding author
Ashcroft, Frances M.
Venue
Nature Communications
Published
2014-08-22
Volume
5
Issue
1
Pages
4639-4639
ISSN
2041-1723 (ISSN-L)
OpenAlex
W2025410324
Cited by
259
References
46
Citations by year
2026: 10 · 2025: 12 · 2024: 25 · 2023: 23 · 2022: 22 · 2021: 31 · 2020: 27 · 2019: 28 · 2018: 22 · 2017: 23 · 2016: 20 · 2015: 13 · 2014: 1
FWCI
18.85
Type
journal article
Language
en
Open access
Licence
Locations
  • Nature Communications (publishedVersion, cc-by)
  • Europe PMC (PubMed Central) (publishedVersion, cc-by)
  • PubMed Central (publishedVersion, cc-by)
  • PubMed (publishedVersion)
  • Ulster University Research Portal (Ulster University) (acceptedVersion, cc-by)
Funders
  • Wellcome Trust (WT088357Z/09/Z, 084655, 884655, 095531/Z/11/Z, 095531, 088357, WT084210Z/07/Z, 089795, MRC_MC_UU_12012/3)
  • National Institute for Health and Care Research (ACF-2011-13-006)
  • European Commission (322620)
  • Medical Research Council (MRC_MC_UU_12012/3)
Topics
  • Health Sciences › Medicine › Endocrinology, Diabetes and Metabolism › Pancreatic function and diabetes
  • Life Sciences › Biochemistry, Genetics and Molecular Biology › Genetics › Diabetes and associated disorders
  • Health Sciences › Medicine › Endocrinology, Diabetes and Metabolism › Diabetes Treatment and Management
Keywords
hyperglycemia, pancreatic islets, beta-cell dysfunction, glucagon secretion, insulin secretion, KATP channel mutations, islet ultrastructure, sulfonylureas, insulin therapy, diabetes mellitus
MeSH terms
Kcnj11 Channel, Animals, Blood Glucose, Diabetes Mellitus, Experimental, Disease Models, Animal, Electrophysiology, Glyburide, Humans, Hyperglycemia, Insulin, Islets of Langerhans, Mice, Transgenic, Mutation, Potassium Channels, Inwardly Rectifying, KATP Channels

About these checks

Registry, retraction, Cites and statistics results are computed, not judged, with one exception: a printed reference that no index lists is read once by a model before it counts as a citation error. Claims are extracted by a model and kept only when their quote appears verbatim in the text; each cited source is then checked, with a model’s help, for whether it says what the claim relies on. Those verdicts can be wrong — read the claim’s quote and the cited source before relying on one.

Statistics and arithmetic are recomputed, not judged.

Confidence bands are shown only for fields calibrated on our annotated test set. None is calibrated yet, so no band is shown.

What counts as a claim ›How we measure confidence ›How we check this ›

Are you an author, or do you see a problem with this page? Request a review

How to cite

Cite CoChat for the checks on this page, and the paper for its own findings.

This page
CoChat. (2026). Citation check: Reversible changes in pancreatic islet structure and function produced by elevated blood glucose. https://app.cochat.ai/papers/10.1038/ncomms5639
The paper
Brereton, M. F., Iberl, M., Shimomura, K., Zhang, Q., Adriaenssens, A. E., Proks, P., Spiliotis, I. I., Dace, W., Mattis, K. K., Ramracheya, R., Gribble, F. M., Reimann, F., Clark, A., Rorsman, P., & Ashcroft, F. M. (2014). Reversible changes in pancreatic islet structure and function produced by elevated blood glucose. Nature Communications. https://doi.org/10.1038/ncomms5639

Data sources

Bibliographic data: Semantic Scholar, OpenAlex, Crossref.

Contains information from the Semantic Scholar Academic Graph Datasets, made available under the ODC Attribution License (ODC-BY 1.0).

Semantic Scholar’s data is described in: Kinney, R., et al. (2023). The Semantic Scholar Open Data Platform. arXiv:2301.10140.