

The DOI matches its Crossref record; 70 of the 70 references it cites were found in a registry or an index.
Yolk sac macrophage progenitors traffic to the embryo during defined stages of development
Abstract
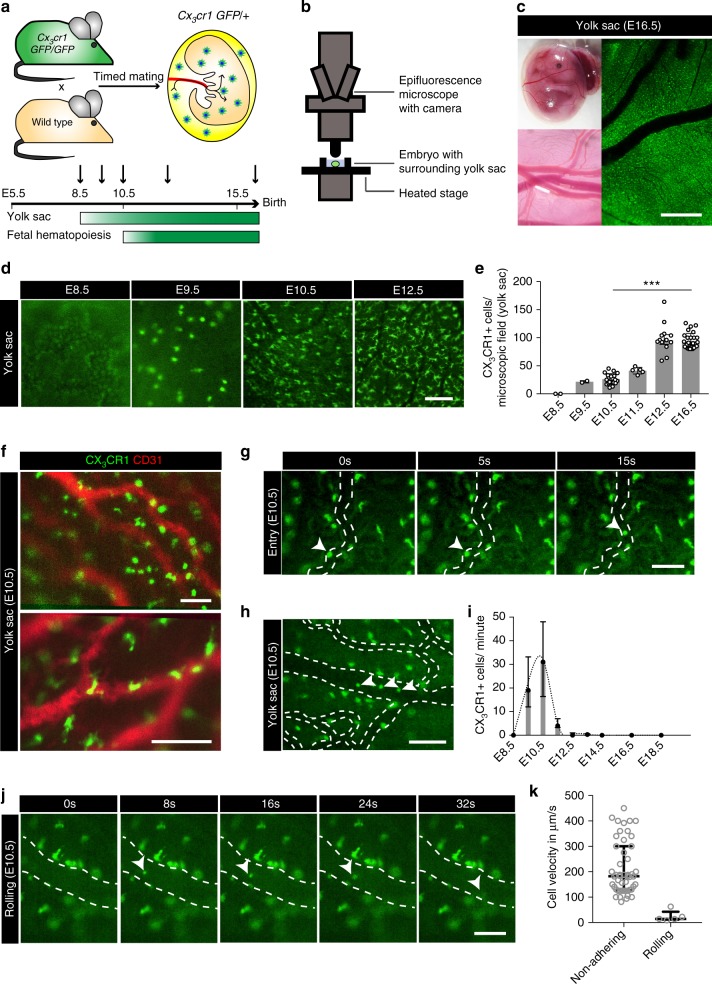
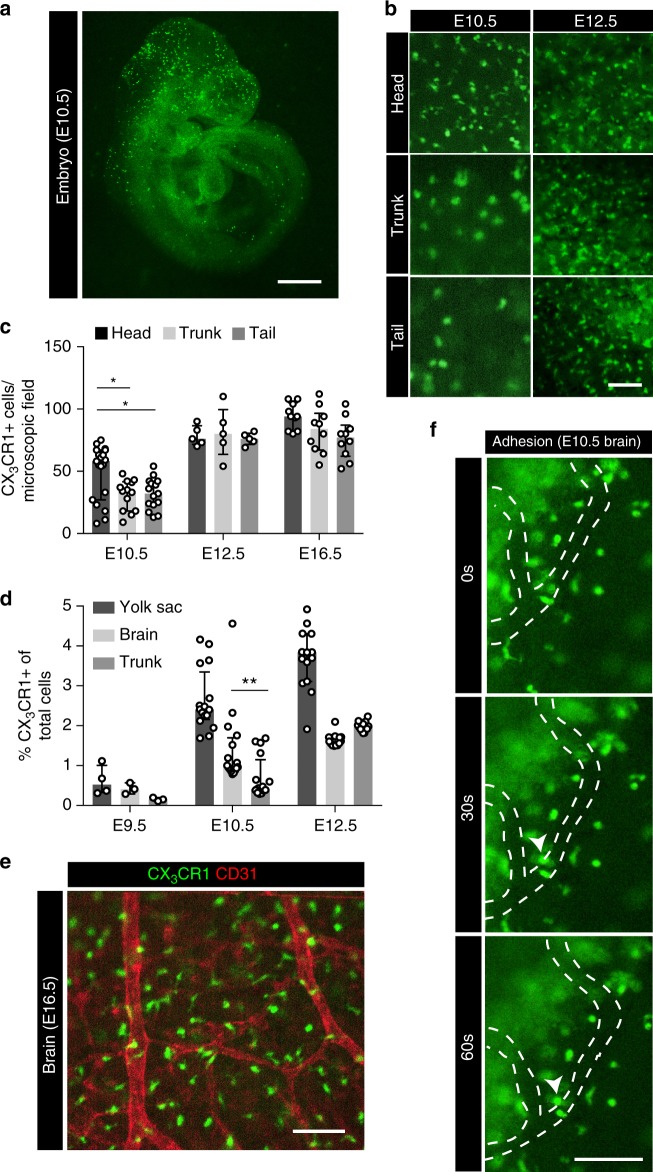
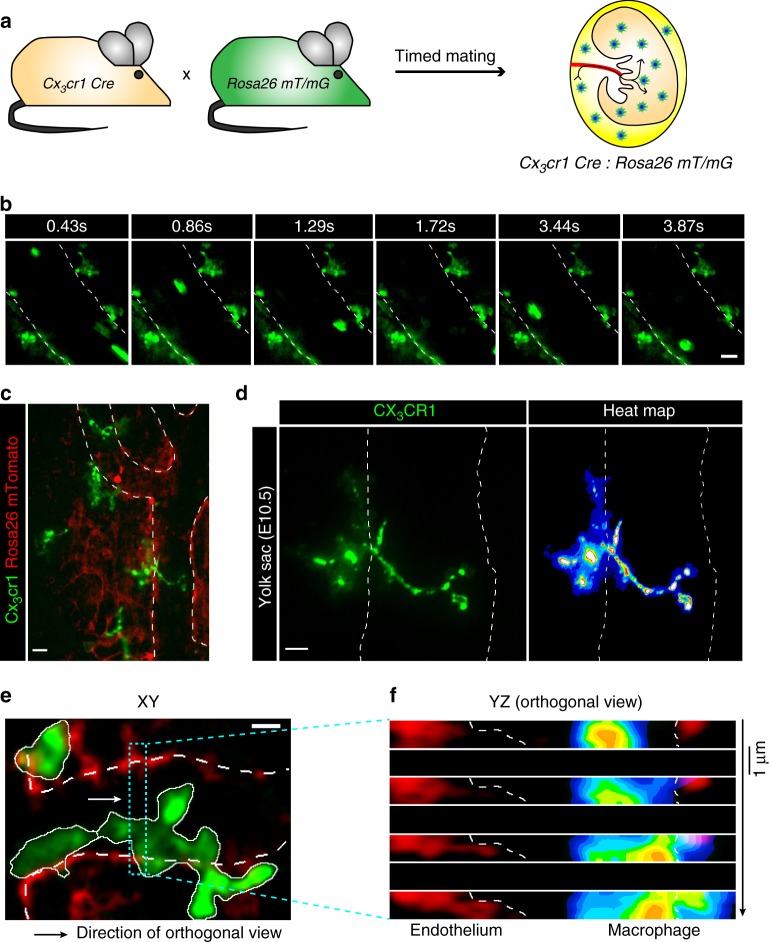
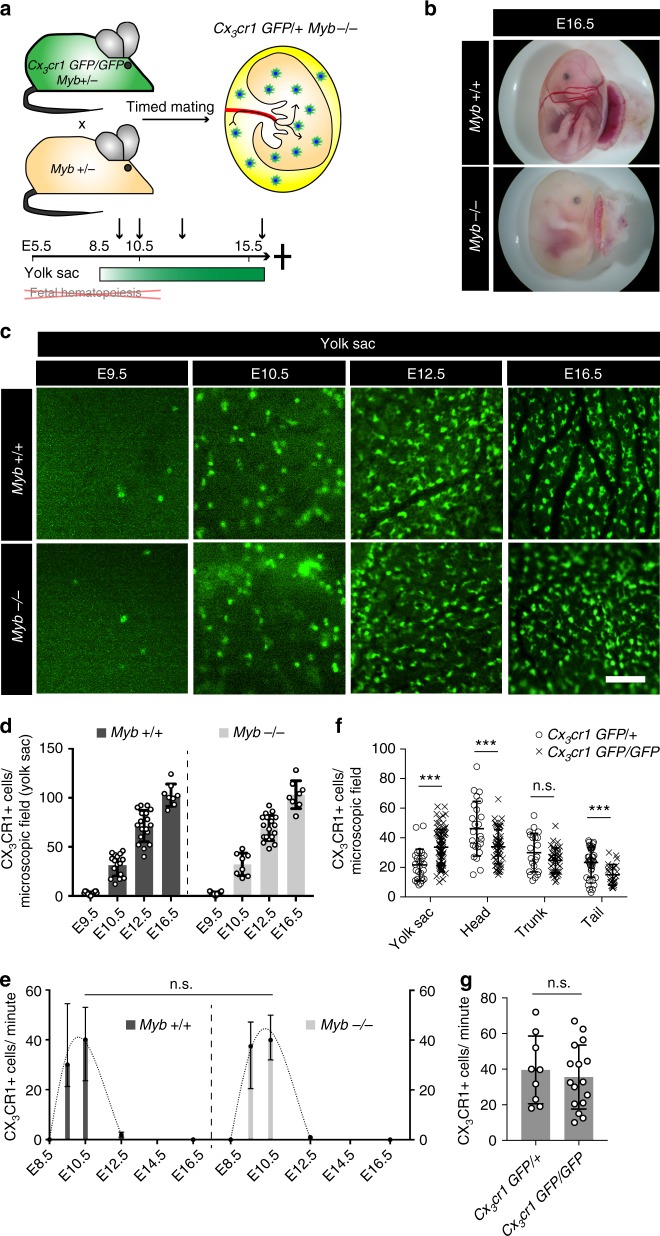
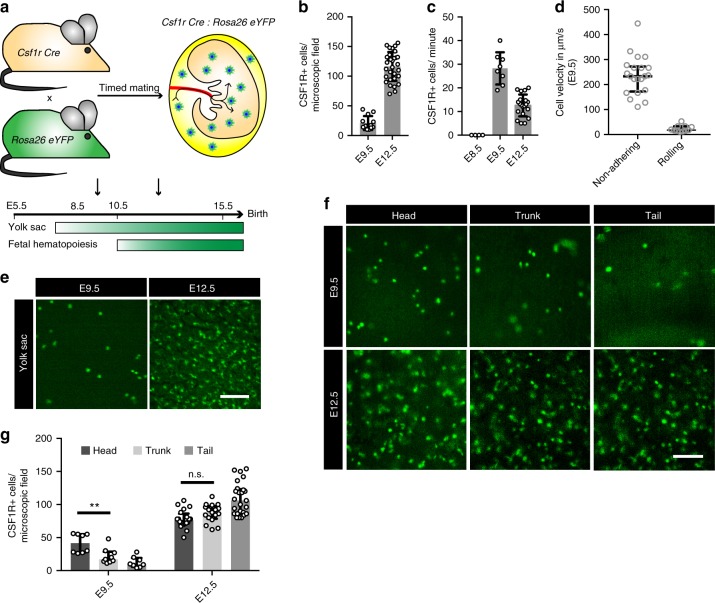
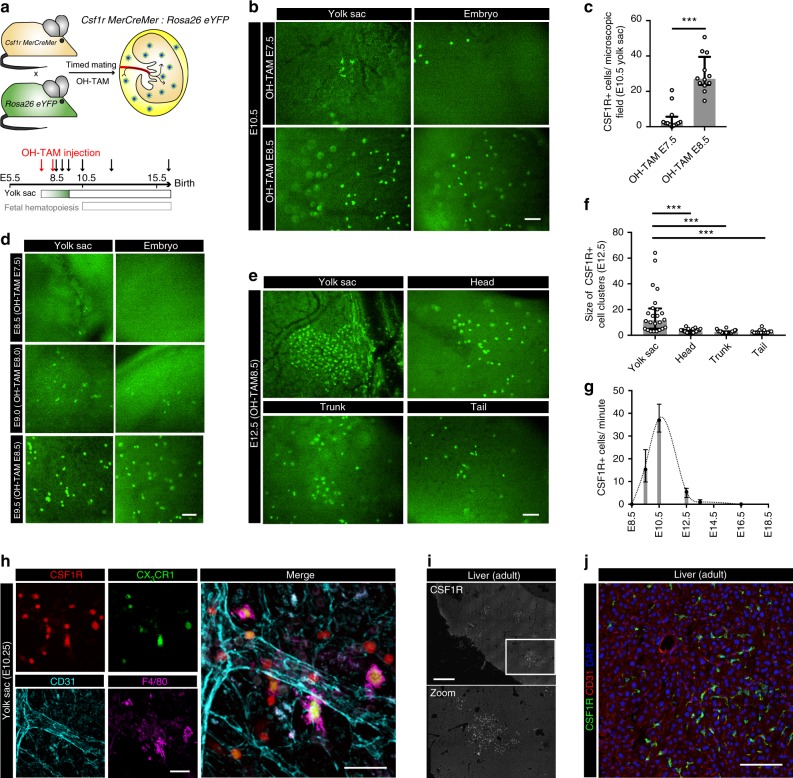
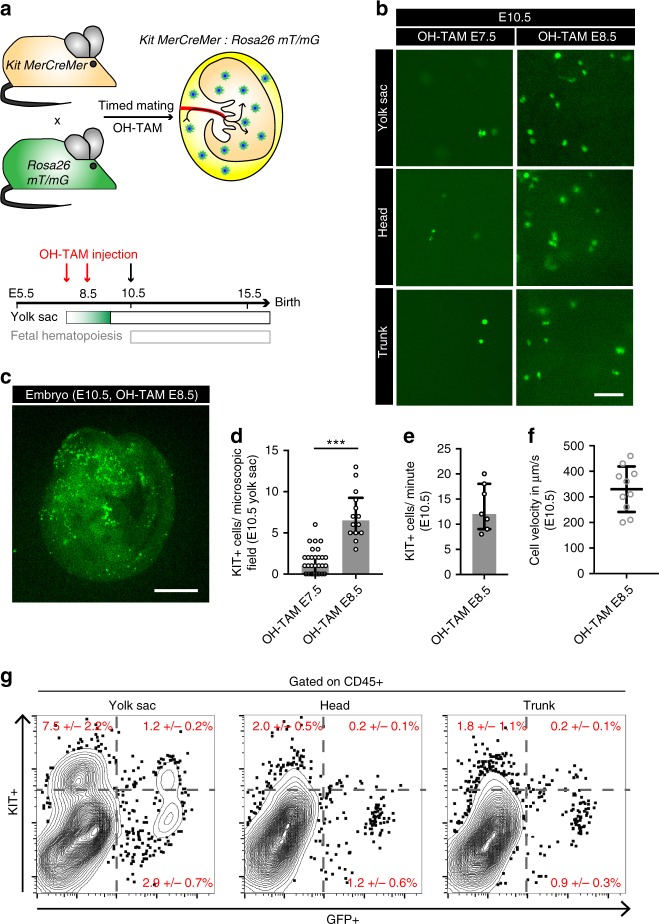
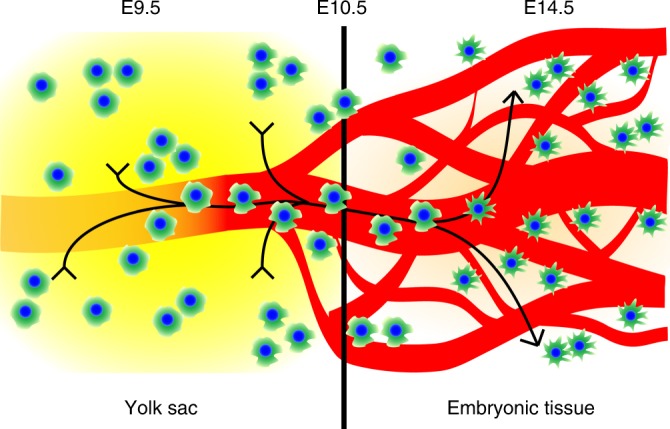
Tissue macrophages in many adult organs originate from yolk sac (YS) progenitors, which invade the developing embryo and persist by means of local self-renewal. However, the route and characteristics of YS macrophage trafficking during embryogenesis are incompletely understood. Here we show the early migration dynamics of YS-derived macrophage progenitors in vivo using fate mapping and intravital microscopy. From embryonic day 8.5 (E8.5) CX 3 CR1+ pre-macrophages are present in the mouse YS where they rapidly proliferate and gain access to the bloodstream to migrate towards the embryo. Trafficking of pre-macrophages and their progenitors from the YS to tissues peaks around E10.5, dramatically decreases towards E12.5 and is no longer evident from E14.5 onwards. Thus, YS progenitors use the vascular system during a restricted time window of embryogenesis to invade the growing fetus. These findings close an important gap in our understanding of the development of the innate immune system.
Overview
The claims and statistics of this paper haven’t been checked yet.
Run the check — free, no account needed. It reads the open-access text and checks the sources it cites.
Integrity signals
Registry
Cites
Statistics
Figures
Verification
Claims the paper makes
The claims and statistics of this paper haven’t been checked yet.
Run the check — free, no account needed. It reads the open-access text and checks the sources it cites.
Claims other papers make about this one
Each is checked against this paper’s own text: does it say what the citing paper says it does?
In the citing paper
“Microglia are yolk sac-derived macrophages residing in the parenchyma of brain and spinal cord, where they interact with neurons and other glial.”
From Engrafted parenchymal brain macrophages differ from microglia in transcriptome, chromatin landscape and response to challenge (2018) · cites this paper as [1]
Self-check
Percentages, sums and reported differences re-computed from the paper’s own numbers.
The self-check needs the paper’s full text.
Citations
Cites
Fiji: an open-source platform for biological-image analysis
Schindelin, J., Arganda-Carreras, I., Frise, E., Kaynig, V., Longair, M., Pietzsch, T., Preibisch, S., Rueden, C., Saalfeld, S., Schmid, B., et al. (2012) · Nature Methods · doi:10.1038/nmeth.2019 · Cited by 66,890
A robust and high-throughput Cre reporting and characterization system for the whole mouse brain
Madisen, L., Zwingman, T. A., Sunkin, S. M., Oh, S. W., Zariwala, H. A., Gu, H., Ng, L. L., Palmiter, R. D., Hawrylycz, M. J., Jones, A. R., et al. (2010) · Nature Neuroscience · doi:10.1038/nn.2467 · Cited by 6,907
Fate Mapping Analysis Reveals That Adult Microglia Derive from Primitive Macrophages
Ginhoux, F., Greter, M., Leboeuf, M., Nandi, S., See, P., Gokhan, S., Mehler, M. F., Conway, S. J., Ng, L. G., Stanley, E. R., et al. (2010) · Science · doi:10.1126/science.1194637 · Cited by 5,175
Tumor-Associated Macrophages: From Mechanisms to Therapy
Noy, R., & Pollard, J. W. (2014) · Immunity · doi:10.1016/j.immuni.2014.06.010 · Cited by 4,089
A global double-fluorescent Cre reporter mouse
Muzumdar, M. D., Tasic, B., Miyamichi, K., Li, L., & Luo, L. (2007) · genesis · doi:10.1002/dvg.20335 · Cited by 3,491
Fate Mapping Reveals Origins and Dynamics of Monocytes and Tissue Macrophages under Homeostasis
Yona, S., Kim, K.-W., Wolf, Y., Mildner, A., Varol, D., Breker, M., Strauss-Ayali, D., Viukov, S., Guilliams, M., Misharin, A., et al. (2013) · Immunity · doi:10.1016/j.immuni.2012.12.001 · Cited by 3,245
Self-citationCre reporter strains produced by targeted insertion of EYFP and ECFP into the ROSA26 locus
Srinivas, S., Watanabe, T., Lin, C.-S., William, C. M., Tanabe, Y., Jessell, T. M., & Costantini, F. (2001) · BMC Developmental Biology · doi:10.1186/1471-213x-1-4 · Cited by 3,121
CCL2 recruits inflammatory monocytes to facilitate breast-tumour metastasis
Qian, B.-Z., Li, J., Zhang, H., Kitamura, T., Zhang, J., Campion, L. R., Kaiser, E. A., Snyder, L. A., & Pollard, J. W. (2011) · Nature · doi:10.1038/nature10138 · Cited by 2,874
Jung, S., Aliberti, J., Graemmel, P., Sunshine, M. J., Kreutzberg, G. W., Sher, A., & Littman, D. R. (2000) · Molecular and Cellular Biology · doi:10.1128/mcb.20.11.4106-4114.2000 · Cited by 2,632
A Lineage of Myeloid Cells Independent of Myb and Hematopoietic Stem Cells
Schulz, C., Perdiguero, E. G., Chorro, L., Szabo-Rogers, H., Cagnard, N., Kierdorf, K., Prinz, M., Wu, B., Jacobsen, S. E. W., Pollard, J. W., et al. (2012) · Science · doi:10.1126/science.1219179 · Cited by 2,578
Self-citationMacrophages in atherosclerosis: a dynamic balance
Moore, K. J., Sheedy, F. J., & Fisher, E. A. (2013) · Nature reviews. Immunology · doi:10.1038/nri3520 · Cited by 2,559
Tissue-resident macrophages originate from yolk-sac-derived erythro-myeloid progenitors
Gomez Perdiguero, E., Klapproth, K., Schulz, C., Busch, K., Azzoni, E., Crozet, L., Garner, H., Trouillet, C., de Bruijn, M. F., Geissmann, F., et al. (2015) · Nature · doi:10.1038/nature13989 · Cited by 2,339
Self-citationHashimoto, D., Chow, A., Noizat, C., Teo, P., Beasley, M. B., Leboeuf, M., Becker, C. D., See, P., Price, J., Lucas, D., et al. (2013) · Immunity · doi:10.1016/j.immuni.2013.04.004 · Cited by 2,311
Tissue-Resident Macrophage Ontogeny and Homeostasis
Ginhoux, F., & Guilliams, M. (2016) · Immunity · doi:10.1016/j.immuni.2016.02.024 · Cited by 1,884
Origin and functions of tissue macrophages
Epelman, S., Lavine, K. J., & Randolph, G. J. (2014) · Immunity · doi:10.1016/j.immuni.2014.06.013 · Cited by 1,585
Microglia emerge from erythromyeloid precursors via Pu.1- and Irf8-dependent pathways
Kierdorf, K., Erny, D., Goldmann, T., Sander, V., Schulz, C., Perdiguero, E. G., Wieghofer, P., Heinrich, A., Riemke, P., Hölscher, C., et al. (2013) · Nature Neuroscience · doi:10.1038/nn.3318 · Cited by 1,457
Self-citationMicroglia and brain macrophages in the molecular age: from origin to neuropsychiatric disease
Prinz, M., & Priller, J. (2014) · Nature Reviews Neuroscience · doi:10.1038/nrn3722 · Cited by 1,329
Gosselin, D., Link, V. M., Romanoski, C. E., Fonseca, G. J., Eichenfield, D. Z., Spann, N. J., Stender, J. D., Chun, H. B., Garner, H., Geissmann, F., et al. (2014) · Cell · doi:10.1016/j.cell.2014.11.023 · Cited by 1,307
Self-citationBain, C. C., Bravo-Blas, A., Scott, C. L., Gomez Perdiguero, E., Geissmann, F., Henri, S., Malissen, B., Osborne, L. C., Artis, D., & Mowat, A. M. (2014) · Nature Immunology · doi:10.1038/ni.2967 · Cited by 1,178
Self-citationFantin, A., Vieira, J. M., Gestri, G., Denti, L., Schwarz, Q., Prykhozhij, S., Peri, F., Wilson, S. W., & Ruhrberg, C. (2010) · Blood · doi:10.1182/blood-2009-12-257832 · Cited by 1,153
Hoeffel, G., Chen, J., Lavin, Y., Low, D., Almeida, F. F., See, P., Beaudin, A. E., Lum, J., Low, I., Forsberg, E. C., et al. (2015) · Immunity · doi:10.1016/j.immuni.2015.03.011 · Cited by 1,135
A functional c-myb gene is required for normal murine fetal hepatic hematopoiesis
Mucenski, M. L., McLain, K., Kier, A. B., Swerdlow, S. H., Schreiner, C. M., Miller, T. A., Pietryga, D. W., Scott, W. J., & Potter, S. S. (1991) · Cell · doi:10.1016/0092-8674(91)90099-k · Cited by 1,042
Haematopoietic stem cells derive directly from aortic endothelium during development
Bertrand, J. Y., Chi, N. C., Santoso, B., Teng, S., Stainier, D. Y. R., & Traver, D. (2010) · Nature · doi:10.1038/nature08738 · Cited by 1,025
Moore, M. A. S., & Metcalf, D. (1970) · British Journal of Haematology · doi:10.1111/j.1365-2141.1970.tb01443.x · Cited by 1,017
Development of erythroid and myeloid progenitors in the yolk sac and embryo proper of the mouse
Palis, J., Robertson, S., Kennedy, M., Wall, C., & Keller, G. (1999) · Development · doi:10.1242/dev.126.22.5073 · Cited by 965
Blood stem cells emerge from aortic endothelium by a novel type of cell transition
Kissa, K., & Herbomel, P. (2010) · Nature · doi:10.1038/nature08761 · Cited by 961
In vivo imaging of haematopoietic cells emerging from the mouse aortic endothelium
Boisset, J.-C., van Cappellen, W., Andrieu-Soler, C., Galjart, N., Dzierzak, E., & Robin, C. (2010) · Nature · doi:10.1038/nature08764 · Cited by 917
Specification of tissue-resident macrophages during organogenesis
Mass, E., Ballesteros, I., Farlik, M., Halbritter, F., Günther, P., Crozet, L., Jacome-Galarza, C. E., Händler, K., Klughammer, J., Kobayashi, Y., et al. (2016) · Science · doi:10.1126/science.aaf4238 · Cited by 891
Self-citationc-kit+ cells minimally contribute cardiomyocytes to the heart
van Berlo, J. H., Kanisicak, O., Maillet, M., Vagnozzi, R. J., Karch, J., Lin, S.-C. J., Middleton, R. C., Marbán, E., & Molkentin, J. D. (2014) · Nature · doi:10.1038/nature13309 · Cited by 799
Self-citationHoeffel, G., Wang, Y., Greter, M., See, P., Teo, P., Malleret, B., Leboeuf, M., Low, D., Oller, G., Almeida, F., et al. (2012) · Journal of Experimental Medicine · doi:10.1084/jem.20120340 · Cited by 786
Nr4a1-Dependent Ly6Clow Monocytes Monitor Endothelial Cells and Orchestrate Their Disposal
Carlin, L. M., Stamatiades, E. G., Auffray, C., Hanna, R. N., Glover, L., Vizcay-Barrena, G., Hedrick, C. C., Cook, H. T., Diebold, S., & Geissmann, F. (2013) · Cell · doi:10.1016/j.cell.2013.03.010 · Cited by 768
Self-citationMacrophages, Immunity, and Metabolic Disease
McNelis, J. C., & Olefsky, J. M. (2014) · Immunity · doi:10.1016/j.immuni.2014.05.010 · Cited by 720
Macrophage heterogeneity in tissues: phenotypic diversity and functions
Gordon, S., Plüddemann, A., & Martinez Estrada, F. (2014) · Immunological Reviews · doi:10.1111/imr.12223 · Cited by 715
Herbomel, P., Thisse, B., & Thisse, C. (2001) · Developmental Biology · doi:10.1006/dbio.2001.0393 · Cited by 574
Bain, C. C., Hawley, C. A., Garner, H., Scott, C. L., Schridde, A., Steers, N. J., Mack, M., Joshi, A., Guilliams, M., Mowat, A. M. I., et al. (2016) · Nature Communications · doi:10.1038/ncomms11852 · Cited by 527
Self-citationMost Tissue-Resident Macrophages Except Microglia Are Derived from Fetal Hematopoietic Stem Cells
Sheng, J., Ruedl, C., & Karjalainen, K. (2015) · Immunity · doi:10.1016/j.immuni.2015.07.016 · Cited by 489
Cell tracing shows the contribution of the yolk sac to adult haematopoiesis
Samokhvalov, I. M., Samokhvalova, N. I., & Nishikawa, S. (2007) · Nature · doi:10.1038/nature05725 · Cited by 481
Expansion of hematopoietic stem cells in the developing liver of a mouse embryo
Ema, H., & Nakauchi, H. (2000) · Blood · doi:10.1182/blood.v95.7.2284 · Cited by 458
McGrath, K. E., Frame, J. M., Fegan, K. H., Bowen, J. R., Conway, S. J., Catherman, S. C., Kingsley, P. D., Koniski, A. D., & Palis, J. (2015) · Cell Reports · doi:10.1016/j.celrep.2015.05.036 · Cited by 433
Metchnikoff and the phagocytosis theory
Tauber, A. I. (2003) · Nature Reviews Molecular Cell Biology · doi:10.1038/nrm1244 · Cited by 413
The origin and cell lineage of microglia: new concepts
Chan, W. Y., Kohsaka, S., & Rezaie, P. (2007) · Brain Research Reviews · doi:10.1016/j.brainresrev.2006.11.002 · Cited by 400
Ensan, S., Li, A., Besla, R., Degousee, N., Cosme, J., Roufaiel, M., Shikatani, E. A., El-Maklizi, M., Williams, J. W., Robins, L., et al. (2016) · Nature Immunology · doi:10.1038/ni.3343 · Cited by 372
Three pathways to mature macrophages in the early mouse yolk sac
Bertrand, J. Y., Jalil, A., Klaine, M., Jung, S., Cumano, A., & Godin, I. (2005) · Blood · doi:10.1182/blood-2005-02-0461 · Cited by 314
Migliaccio, G., Migliaccio, A. R., Petti, S., Mavilio, F., Russo, G., Lazzaro, D., Testa, U., Marinucci, M., & Peschle, C. (1986) · Journal of Clinical Investigation · doi:10.1172/jci112572 · Cited by 297
Böiers, C., Carrelha, J., Lutteropp, M., Luc, S., Green, J. C. A., Azzoni, E., Woll, P. S., Mead, A. J., Hultquist, A., Swiers, G., et al. (2013) · Cell Stem Cell · doi:10.1016/j.stem.2013.08.012 · Cited by 280
Self-citationLux, C. T., Yoshimoto, M., McGrath, K., Conway, S. J., Palis, J., & Yoder, M. C. (2008) · Blood · doi:10.1182/blood-2007-08-107086 · Cited by 273
Clonal Analysis of Mouse Development Reveals a Polyclonal Origin for Yolk Sac Blood Islands
Ueno, H., & Weissman, I. L. (2006) · Developmental Cell · doi:10.1016/j.devcel.2006.08.001 · Cited by 247
The hare and the tortoise: an embryonic haematopoietic race
Godin, I., & Cumano, A. (2002) · Nature reviews. Immunology · doi:10.1038/nri857 · Cited by 238
Deng, L., Zhou, J.-F., Sellers, R. S., Li, J.-F., Nguyen, A., Wang, Y., Orlofsky, A., Liu, Q., Hume, D. A., Pollard, J. W., et al. (2009) · American Journal Of Pathology · doi:10.2353/ajpath.2010.090622 · Cited by 234
CX3CR1-dependent renal macrophage survival promotes Candida control and host survival
Lionakis, M. S., Swamydas, M., Fischer, B. G., Plantinga, T. S., Johnson, M. D., Jaeger, M., Green, N. M., Masedunskas, A., Weigert, R., Mikelis, C., et al. (2013) · Journal of Clinical Investigation · doi:10.1172/jci71307 · Cited by 230
Frame, J. M., Fegan, K. H., Conway, S. J., McGrath, K. E., & Palis, J. (2015) · Stem Cells · doi:10.1002/stem.2213 · Cited by 198
Early hematopoiesis and macrophage development
McGrath, K. E., Frame, J. M., & Palis, J. (2015) · Seminars in Immunology · doi:10.1016/j.smim.2016.03.013 · Cited by 196
Cuadros, M. A., Martin, C., Coltey, P., Almendros, A., & Navascués, J. (1993) · Journal of Comparative Neurology · doi:10.1002/cne.903300110 · Cited by 192
Lichanska, A. M., Browne, C. M., Henkel, G. W., Murphy, K. M., Ostrowski, M. C., McKercher, S. R., Maki, R. A., & Hume, D. A. (1999) · Blood · doi:10.1182/blood.v94.1.127.413k07_127_138 · Cited by 188
Development and homeostasis of “resident” myeloid cells: the case of the microglia
Gomez Perdiguero, E., Schulz, C., & Geissmann, F. (2013) · Glia · doi:10.1002/glia.22393 · Cited by 182
Self-citationTickets to the brain: Role of CCR2 and CX3CR1 in myeloid cell entry in the CNS
Prinz, M., & Priller, J. (2010) · Journal of Neuroimmunology · doi:10.1016/j.jneuroim.2010.05.015 · Cited by 172
McGrath, K. E., Frame, J. M., Fromm, G. J., Koniski, A. D., Kingsley, P. D., Little, J. A., Bulger, M., & Palis, J. (2011) · Blood · doi:10.1182/blood-2010-12-325357 · Cited by 156
Multicolor fate mapping of Langerhans cell homeostasis
Ghigo, C., Mondor, I., Jorquera, A., Nowak, J., Wienert, S., Zahner, S. P., Clausen, B. E., Luche, H., MALISSEN, B., Klauschen, F., et al. (2013) · The Journal of Experimental Medicine · doi:10.1084/jem.20130403 · Cited by 150
Mu, J., & Adamson, S. L. (2006) · American Journal of Physiology-Heart and Circulatory Physiology · doi:10.1152/ajpheart.00031.2006 · Cited by 131
Immature hematopoietic stem cells undergo maturation in the fetal liver
Kieusseian, A., de la Grange, P. B., Burlen‐Defranoux, O., Godin, I., & Cumano, A. (2012) · Development · doi:10.1242/dev.079210 · Cited by 121
Turnover of Epidermal Langerhans' Cells
Kanitakis, J., Petruzzo, P., & Dubernard, J. (2004) · New England Journal of Medicine · doi:10.1056/nejm200412163512523 · Cited by 108
Ovchinnikov, D. A., van Zuylen, W. J., DeBats, C. E. E., Alexander, K. A., Kellie, S., & Hume, D. A. (2007) · Journal of Leukocyte Biology · doi:10.1189/jlb.0807585 · Cited by 100
Fetal liver endothelium regulates the seeding of tissue-resident macrophages
Rantakari, P., Jäppinen, N., Lokka, E., Mokkala, E., Gerke, H., Peuhu, E., Ivaska, J., Elima, K., Auvinen, K., & Salmi, M. (2016) · Nature · doi:10.1038/nature19814 · Cited by 86
CX3CR1 Reduces Kidney Fibrosis by Inhibiting Local Proliferation of Profibrotic Macrophages
Engel, D. R., Krause, T. A., Snelgrove, S. L., Thiebes, S., Hickey, M. J., Boor, P., Kitching, A. R., & Kurts, C. (2015) · The Journal of Immunology · doi:10.4049/jimmunol.1402149 · Cited by 85
The Na+-Ca2+ Exchanger Is Essential for Embryonic Heart Development in Mice
Cho, C.-H., Kim, S. S., Jeong, M.-J., Lee, C. O., & Shin, H. (2000) · Molecules and Cells · doi:10.1007/s10059-000-0712-2 · Cited by 76
Inlay, M. A., Serwold, T. F., Mosley, A. R., Fathman, J. W., Dimov, I. K., Seita, J., & Weissman, I. L. (2014) · Stem Cell Reports · doi:10.1016/j.stemcr.2014.02.001 · Cited by 69
The human EGF-TM7 family member EMR2 is a heterodimeric receptor expressed on myeloid cells
Kwakkenbos, M. J., Chang, G.-W., Lin, H., Pouwels, W., de Jong, E. C., van Lier, R. A. W., Gordon, S., & Hamann, J. (2002) · Journal of Leukocyte Biology · doi:10.1189/jlb.71.5.854 · Cited by 68
Haemopoiesis in the human yolk sac.
Takashina, T. (1987) · PubMed · Cited by 66
Stolla, M., Pelisek, J., von Brühl, M.-L., Schäfer, A., Barocke, V., Heider, P., Lorenz, M., Tirniceriu, A., Steinhart, A., Bauersachs, J. K., et al. (2012) · PLoS ONE · doi:10.1371/journal.pone.0043572 · Cited by 60
Self-citationChang, G.-W., Davies, J. Q., Stacey, M. A., et al. (2006) · Biochemical and Biophysical Research Communications · doi:10.1016/j.bbrc.2006.11.148 · Cited by 50
Cited by
Microglia states and nomenclature: A field at its crossroads
Paolicelli, R. C., Sierra, A., Stevens, B., Tremblay, M.-E., Aguzzi, A., Ajami, B., Amit, I., Audinat, E., Bechmann, I., Bennett, M., et al. (2022) · Neuron · doi:10.1016/j.neuron.2022.10.020 · Cited by 1,973
Microglia in neurodegenerative diseases: mechanism and potential therapeutic targets
Gao, C., Jiang, J., Tan, Y., & Chen, S. (2023) · Signal Transduction and Targeted Therapy · doi:10.1038/s41392-023-01588-0 · Cited by 1,616
Microglia Biology: One Century of Evolving Concepts
Prinz, M., Jung, S., & Priller, J. (2019) · Cell · doi:10.1016/j.cell.2019.08.053 · Cited by 1,525
Shemer, A., Grozovski, J., Tay, T. L., Tao, J., Volaski, A., Süß, P., Ardura-Fabregat, A., Gross-Vered, M., Kim, J.-S., David, E., et al. (2018) · Nature Communications · doi:10.1038/s41467-018-07548-5 · Cited by 1,052
Targeting tumor-associated macrophages in cancer
Pathria, P., Louis, T. L., & Varner, J. A. (2019) · Trends in Immunology · doi:10.1016/j.it.2019.02.003 · Cited by 933
Metadata
- Authors
- Stremmel, C., Schuchert, R., Wagner, F., Thaler, R., Weinberger, T., Pick, R., Mass, E., Ishikawa-Ankerhold, H. C., Margraf, A., Hutter, S., Vagnozzi, R., Klapproth, S., Frampton, J., Yona, S., Scheiermann, C., Molkentin, J. D., Jeschke, U., Moser, M., Sperandio, M., Massberg, S., Geissmann, F., & Schulz, C.
- Venue
- Nature Communications
- Published
- 2018-01-08
- Volume
- 9
- Issue
- 1
- ISSN
- 2041-1723
- PMC
- PMC5758709
- Cited by
- 278
- References
- 70
- Language
- en
- Update notices
- correction (2018-09-07)
- Licence
- creativecommons.org/licenses/by/4.0 (tdm)
- creativecommons.org/licenses/by/4.0 (vor)
About these checks
Registry, retraction, Cites and statistics results are computed, not judged, with one exception: a printed reference that no index lists is read once by a model before it counts as a citation error. Claims are extracted by a model and kept only when their quote appears verbatim in the text; each cited source is then checked, with a model’s help, for whether it says what the claim relies on. Those verdicts can be wrong — read the claim’s quote and the cited source before relying on one.
Statistics and arithmetic are recomputed, not judged.
Confidence bands are shown only for fields calibrated on our annotated test set. None is calibrated yet, so no band is shown.
What counts as a claim ›How we measure confidence ›How we check this ›
Are you an author, or do you see a problem with this page? Request a review
Data sources
Bibliographic data: Semantic Scholar, OpenAlex, Crossref.
Contains information from the Semantic Scholar Academic Graph Datasets, made available under the ODC Attribution License (ODC-BY 1.0).
Semantic Scholar’s data is described in: Kinney, R., et al. (2023). The Semantic Scholar Open Data Platform. arXiv:2301.10140.
