Cited by 56

The DOI matches its Crossref record; 10 of the 10 references it cites were found in a registry or an index.

MiR-34 inhibits polycomb repressive complex 2 to modulate chaperone expression and promote healthy brain aging

Kennerdell, Jason R., Liu, Nan, Bonini, Nancy M.·2018·Nature Communications

Abstract

Aging is a prominent risk factor for neurodegenerative disease. Defining gene expression mechanisms affecting healthy brain aging should lead to insight into genes that modulate susceptibility to disease. To define such mechanisms, we have pursued analysis of miR-34 mutants in Drosophila . The miR-34 mutant brain displays a gene expression profile of accelerated aging, and miR-34 upregulation is a potent suppressor of polyglutamine-induced neurodegeneration. We demonstrate that Pcl and Su(z)12 , two components of polycomb repressive complex 2, (PRC2), are targets of miR-34 , with implications for age-associated processes. Because PRC2 confers the repressive H3K27me3 mark, we hypothesize that miR-34 modulates PRC2 activity to relieve silencing of genes promoting healthful aging. Gene expression profiling of the brains of hypomorphic mutants in Enhancer of zeste ( E(z) ), the enzymatic methyltransferase component of PRC2, revealed a younger brain transcriptome profile and identified the small heat shock proteins as key genes reduced in expression with age.

Overview

The claims and statistics of this paper haven’t been checked yet.

Run the check — free, no account needed. It reads the open-access text and checks the sources it cites.

A few free checks a day · papers already verified open instantly · results are public

Integrity signals

Registry

Crossref · 10.1038/s41467-018-06592-5

Cites

10 of 10 references verified0 citation errors · 0 not checkable

Statistics

Figures

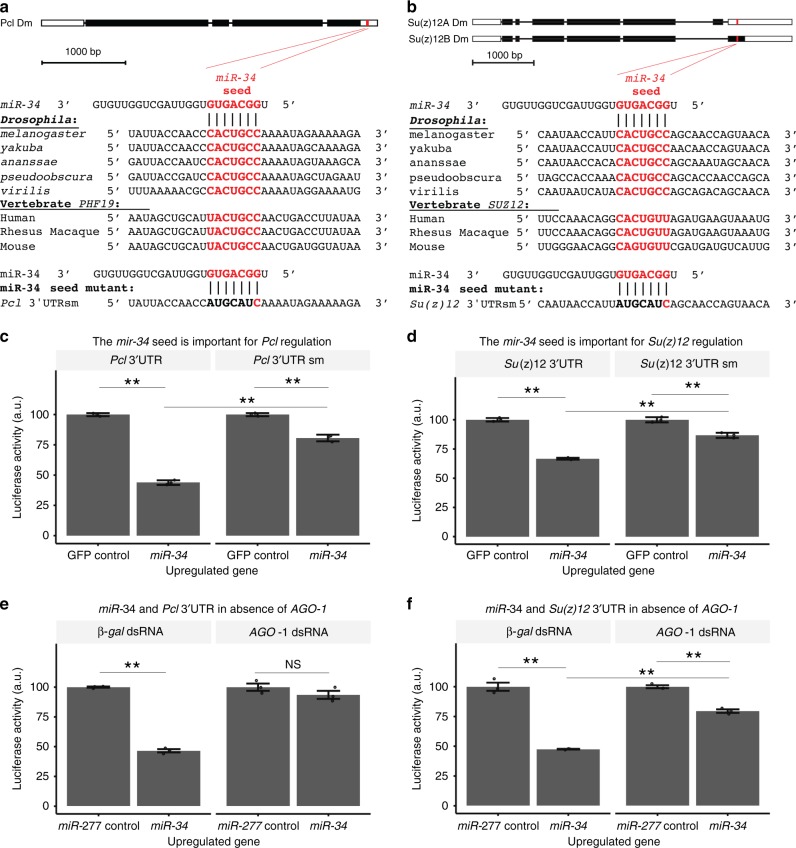
Fig. 1 miR-34 targets 3′UTRs of Su(z)12 and Pcl. a, b Pcl and Su(z)12 are predicted targets of miR-34. The seed sequence of miR-34 has complementarity with the (a) Pcl 3′UTR and the (b) Su(z)12 3′UTR. The seed sequence is conserved in various homologs. Bottom, an engineered mutation in the seed sequence was also generated, red letters indicate base-pairing retained in the seed mutation, those with disrupted base-pairing are in black. c, d Luciferase assays confirm that miR-34 targets Pcl and Su(z)12. A reporter construct containing the 3′UTR of (c) Pcl or (d) Su(z)12 fused to Renilla luciferase was expressed in Drosophila SL2 cells and tested for a response to miR-34. Upon miR-34 upregulation, luciferase activity decreases in reporters containing the (c, left) Pcl 3′UTR and the (d, left) Su(z)12 3′UTR. Regulation of the Pcl 3′UTR by miR-34 was attenuated by a seed sequence mutation (c, right). Regulation of the Su(z)12 3′UTR by miR-34 was also attenuated by the seed sequence mutation (d, right). Two-way ANOVA indicated a significant interaction term for the Pcl 3′UTR (F1,8 = 8.5, p < 0.02), and Su(z)12 3′UTR (F1,8 = 17.5, p < 0.01). **p < 0.01, two-way ANOVA with Tukey post-test. Mean ± SEM, n = 3 wells. e, f The RNAi induced silencing complex (RISC) is required for regulation of the 3′UTR of Pcl and Su(z)12 by miR-34. The 3′UTR reporter constructs were expressed in DL1 cells treated with dsRNA to argonaute-1 (an essential component of RISC) or a control gene (β-gal). The cells were tested for a response to upregulation of miR-34 or a control microRNA (miR-277). In cells treated with β-gal dsRNA, upregulation of miR-34 resulted in decreased reporter expression. In cells treated with AGO1 dsRNA, the effect of miR-34 on reporter expression was eliminated (e, for Pcl 3′UTR reporter two-way ANOVA indicated a significant interaction term, F1,8 = 107, p < 0.01) or attenuated (f for Su(z)12 3′UTR reporter two-way ANOVA indicated a significant interaction term, F1,8 = 73, p < 0.01). **p < 0.01, Two-way ANOVA, Tukey post-test. Mean ± SEM, n = 3 wells
Fig. 1 miR-34 targets 3′UTRs of Su(z)12 and Pcl. a, b Pcl and Su(z)12 are predicted targets of miR-34. The seed sequence of miR-34 has complementarity with the (a) Pcl 3′UTR and the (b) Su(z)12 3′UTR. The seed sequence is conserved in various homologs. Bottom, an engineered mutation in the seed sequence was also generated, red letters indicate base-pairing retained in the seed mutation, those with disrupted base-pairing are in black. c, d Luciferase assays confirm that miR-34 targets Pcl and Su(z)12. A reporter construct containing the 3′UTR of (c) Pcl or (d) Su(z)12 fused to Renilla luciferase was expressed in Drosophila SL2 cells and tested for a response to miR-34. Upon miR-34 upregulation, luciferase activity decreases in reporters containing the (c, left) Pcl 3′UTR and the (d, left) Su(z)12 3′UTR. Regulation of the Pcl 3′UTR by miR-34 was attenuated by a seed sequence mutation (c, right). Regulation of the Su(z)12 3′UTR by miR-34 was also attenuated by the seed sequence mutation (d, right). Two-way ANOVA indicated a significant interaction term for the Pcl 3′UTR (F1,8 = 8.5, p < 0.02), and Su(z)12 3′UTR (F1,8 = 17.5, p < 0.01). **p < 0.01, two-way ANOVA with Tukey post-test. Mean ± SEM, n = 3 wells. e, f The RNAi induced silencing complex (RISC) is required for regulation of the 3′UTR of Pcl and Su(z)12 by miR-34. The 3′UTR reporter constructs were expressed in DL1 cells treated with dsRNA to argonaute-1 (an essential component of RISC) or a control gene (β-gal). The cells were tested for a response to upregulation of miR-34 or a control microRNA (miR-277). In cells treated with β-gal dsRNA, upregulation of miR-34 resulted in decreased reporter expression. In cells treated with AGO1 dsRNA, the effect of miR-34 on reporter expression was eliminated (e, for Pcl 3′UTR reporter two-way ANOVA indicated a significant interaction term, F1,8 = 107, p < 0.01) or attenuated (f for Su(z)12 3′UTR reporter two-way ANOVA indicated a significant interaction term, F1,8 = 73, p < 0.01). **p < 0.01, Two-way ANOVA, Tukey post-test. Mean ± SEM, n = 3 wellsCC BY · PubMed Central
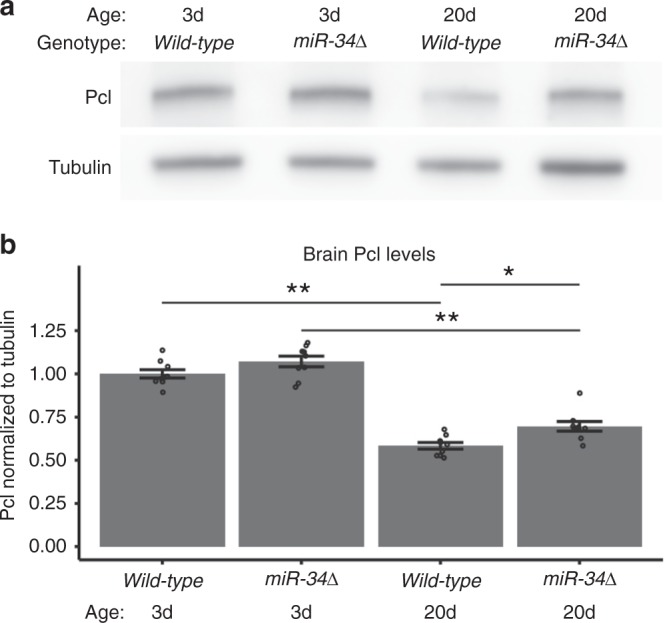
Fig. 2 Pcl is a target of miR-34 in the brain. a, b Pcl protein levels are deregulated in miR-34 mutants. a Western immunoblots. b Quantitation of immunoblots. Pcl levels decrease with age in both wild-type and miR-34 mutants. Pcl levels were higher than wild-type control at 20d. Protein samples from dissected brains. Western immunoblot, with tubulin as the loading control. Pcl protein levels are normalized to tubulin. Mean ± SEM, n = 9 biological replicates. Significant main effects were observed (genotype: F1,32 = 12.7, p < 0.01 age: F1,32 = 232, p < 0.001). (*p < 0.05, **p < 0.01, two-way ANOVA with Tukey post-test)
Fig. 2 Pcl is a target of miR-34 in the brain. a, b Pcl protein levels are deregulated in miR-34 mutants. a Western immunoblots. b Quantitation of immunoblots. Pcl levels decrease with age in both wild-type and miR-34 mutants. Pcl levels were higher than wild-type control at 20d. Protein samples from dissected brains. Western immunoblot, with tubulin as the loading control. Pcl protein levels are normalized to tubulin. Mean ± SEM, n = 9 biological replicates. Significant main effects were observed (genotype: F1,32 = 12.7, p < 0.01 age: F1,32 = 232, p < 0.001). (*p < 0.05, **p < 0.01, two-way ANOVA with Tukey post-test)CC BY · PubMed Central
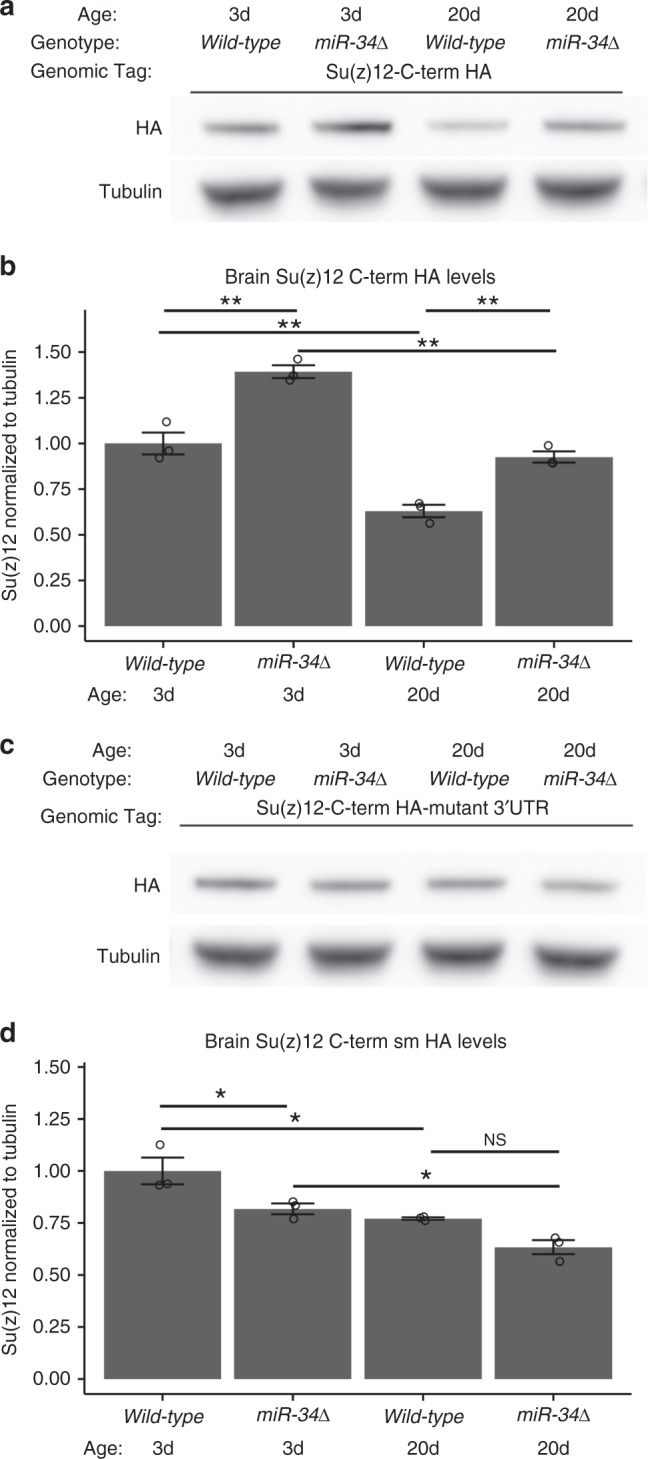
Fig. 3 Su(z)12 is a target of miR-34 in the brain. a, b Su(z)12 protein levels are deregulated in miR-34 mutants. Su(z)12 protein was detected using a transgene containing the Su(z)12 genomic region tagged with the HA epitope on the C-terminus of the predicted protein (Su(z)12-C-term HA). Su(z)12 levels decreased with age in wild-type, but remained elevated in miR-34 mutants. Protein samples from dissected brains. Su(z)12-C-term HA protein levels were normalized to tubulin loading control. Mean ± SEM, n = 3 biological replicates. Significant main effects were observed (genotype: F1,8 = 68, p < 0.001 age: F1,8 = 101, p < 0.001). (*p < 0.05, **p < 0.01, two-way ANOVA with Tukey post-test).c, d The regulation of Su(z)12 protein levels by miR-34 is dependent upon the miR-34 seed sequence in the 3′UTR of the Su(z)12 transcript. The Su(z)12-C-term HA-mutant 3′UTR transgene contains a mutation in the miR-34 seed sequence that relieves the transcript from regulation by miR-34 (see Fig. 1d). Su(z)12-C-term HA-mutant 3′UTR protein levels still decrease with age, but are no longer increased in miR-34 mutants. The difference between wild-type at 20d and miR-34 mutant at 20d is not significant. Protein samples from dissected brains. Quantification of Su(z)12-C-term HA-mutant 3′UTR protein levels using Western immunoblotting, normalized to tubulin loading control. Mean ± SEM, n = 3 biological replicates. Significant main effects were observed (genotype: F1,8 = 17, p < 0.01 age: F1,8 = 28.5, p < 0.001). (*p < 0.05, two-way ANOVA with Tukey post-test)
Fig. 3 Su(z)12 is a target of miR-34 in the brain. a, b Su(z)12 protein levels are deregulated in miR-34 mutants. Su(z)12 protein was detected using a transgene containing the Su(z)12 genomic region tagged with the HA epitope on the C-terminus of the predicted protein (Su(z)12-C-term HA). Su(z)12 levels decreased with age in wild-type, but remained elevated in miR-34 mutants. Protein samples from dissected brains. Su(z)12-C-term HA protein levels were normalized to tubulin loading control. Mean ± SEM, n = 3 biological replicates. Significant main effects were observed (genotype: F1,8 = 68, p < 0.001 age: F1,8 = 101, p < 0.001). (*p < 0.05, **p < 0.01, two-way ANOVA with Tukey post-test).c, d The regulation of Su(z)12 protein levels by miR-34 is dependent upon the miR-34 seed sequence in the 3′UTR of the Su(z)12 transcript. The Su(z)12-C-term HA-mutant 3′UTR transgene contains a mutation in the miR-34 seed sequence that relieves the transcript from regulation by miR-34 (see Fig. 1d). Su(z)12-C-term HA-mutant 3′UTR protein levels still decrease with age, but are no longer increased in miR-34 mutants. The difference between wild-type at 20d and miR-34 mutant at 20d is not significant. Protein samples from dissected brains. Quantification of Su(z)12-C-term HA-mutant 3′UTR protein levels using Western immunoblotting, normalized to tubulin loading control. Mean ± SEM, n = 3 biological replicates. Significant main effects were observed (genotype: F1,8 = 17, p < 0.01 age: F1,8 = 28.5, p < 0.001). (*p < 0.05, two-way ANOVA with Tukey post-test)CC BY · PubMed Central
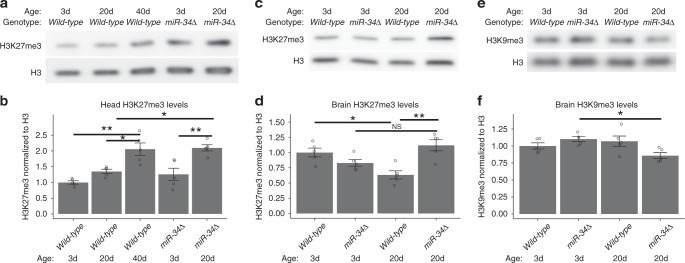
Fig. 4 H3K27me3 levels with age and in miR-34 mutants. a, b H3K27me3 levels with age in heads. Total histone was purified from Drosophila heads at 3d, 20d, and 40d. H3K27me3 gradually increased with age, and increased faster in miR-34 mutants. Histone H3 is a control for total H3 levels. Quantification of relative levels of H3K27me3 was normalized to the total histone H3. Mean ± SEM, n = 5 biological replicates. Significant main effects were observed (genotype: F1,20 = 13.5, p < .01, age: F2,20 = 18, p < .001). (*p < 0.05, **p < 0.01 two-way ANOVA, with Tukey post-test).c, d H3K27me3 levels are increased in the brain of aged miR-34 mutants. Protein samples were derived from dissected brains. H3K27me3 protein levels are normalized to total Histone H3 levels. Mean ± SEM, n = 5 biological replicates. Significant interaction and main effect were observed (genotype: F1, 16 = 4.7, p < .05, age: F1, 16 = 0.28, ns, interaction: F1, 16 = 2.06, p < .001. (*p < 0.05, **p < 0.01 two-way ANOVA with Tukey post-test). e, f H3K9me3 levels are affected in miR-34 mutants. Protein samples from dissected brains. H3K9me3 levels were normalized to total histone H3. Mean ± SEM, n = 5 biological replicates. A significant interaction was observed (interaction: F1 16 = 8.76, p < 0.01, genotype: F1,16 = 1.1, p > .05, age: F1,16 = .2.7, p > .05). (*p < 0.05, two-way ANOVA, Tukey post-test)
Fig. 4 H3K27me3 levels with age and in miR-34 mutants. a, b H3K27me3 levels with age in heads. Total histone was purified from Drosophila heads at 3d, 20d, and 40d. H3K27me3 gradually increased with age, and increased faster in miR-34 mutants. Histone H3 is a control for total H3 levels. Quantification of relative levels of H3K27me3 was normalized to the total histone H3. Mean ± SEM, n = 5 biological replicates. Significant main effects were observed (genotype: F1,20 = 13.5, p < .01, age: F2,20 = 18, p < .001). (*p < 0.05, **p < 0.01 two-way ANOVA, with Tukey post-test).c, d H3K27me3 levels are increased in the brain of aged miR-34 mutants. Protein samples were derived from dissected brains. H3K27me3 protein levels are normalized to total Histone H3 levels. Mean ± SEM, n = 5 biological replicates. Significant interaction and main effect were observed (genotype: F1, 16 = 4.7, p < .05, age: F1, 16 = 0.28, ns, interaction: F1, 16 = 2.06, p < .001. (*p < 0.05, **p < 0.01 two-way ANOVA with Tukey post-test). e, f H3K9me3 levels are affected in miR-34 mutants. Protein samples from dissected brains. H3K9me3 levels were normalized to total histone H3. Mean ± SEM, n = 5 biological replicates. A significant interaction was observed (interaction: F1 16 = 8.76, p < 0.01, genotype: F1,16 = 1.1, p > .05, age: F1,16 = .2.7, p > .05). (*p < 0.05, two-way ANOVA, Tukey post-test)CC BY · PubMed Central
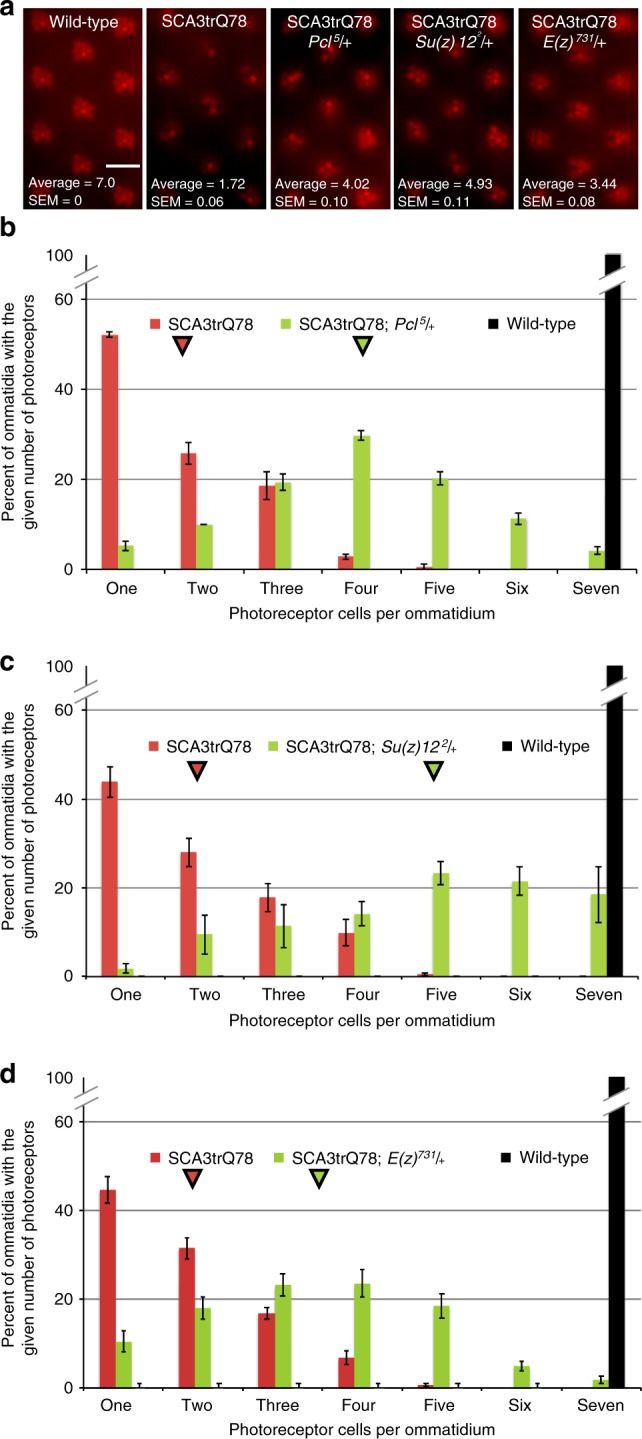
Fig. 5 Neural degeneration due to pathogenic ATXN3 is suppressed by PRC2 mutations. a The fly compound eye is comprised of individual optical units called ommatidia, which are arranged in a hexagonal array. Within each ommatidium are eight photoreceptors (PR), of which seven are visible by this assay. Each panel shows eleven ommatidial units; flies are 21d old. Whereas wild-type has seven PRs in each ommatidial unit, expression of SCA3trQ78 results in PR loss. Heterozygous mutation of Pcl or Su(z)12 mitigates PR cell loss. Heterozygous reduction of E(z) also mitigates PR loss. Scale bar indicates 10 μm. b Histogram showing the distribution of photoreceptors (PR) per ommatidium at 21d in wild-type (black, 7.0 PR/ommatidium), SCA3trQ78 (red, average 1.72 ± 0.06 SEM noted with red arrowhead, n = 24 flies, 240 ommatidia), and SCA3trQ78 with a heterozygous Pcl allele (green, average 4.02 ± 0.10 SEM noted with green arrowhead, n = 20 flies, 200 ommatidia). p < 0.001, Kruskal–Wallis test, Dunn post-test. Genotypes: SCA3trQ78 is rh1-GAL4, UAS-SCA3trQ78/+; Pcl5/+ is Pcl5/+; rh1-GAL4, UAS-SCA3trQ78/+. c Histogram showing the distribution of photoreceptors (PR) per ommatidium at 21d in wild-type (black, 7.0 PR), SCA3trQ78 (red, average 1.92 ± 0.06 SEM noted with red arrowhead, n = 29 flies, 291 ommatidia), and SCA3trQ78 heterozygous for a Su(z)12 allele (green, average 4.93 ± 0.11 SEM noted with arrowhead, n = 20 flies, 197 ommatidia). p < 0.001, Kruskal–Wallis test, Dunn post-test. Genotypes: SCA3trQ78 is rh1-GAL4, UAS-SCA3trQ78/+; Su(z)122/+ is rh1-GAL4, UAS-SCA3trQ78/Su(z)122. d Histogram showing the distribution of photoreceptors (PR) per ommatidium at 21d in wild-type (black, 7.0 PR), SCA3trQ78 (red, average 1.86 ± 0.06 SEM noted with red arrowhead, n = 19 flies, 379 ommatidia), and SCA3trQ78 heterozygous for an E(z) allele (green, average 3.44 ± 0.16 SEM noted with arrowhead, n = 19 flies, 349 ommatidia). p < 0.001, Kruskal–Wallis test, Dunn post-test. Genotypes: SCA3trQ78 is rh1-GAL4, UAS-SCA3trQ78/+; E(z)731/+ is rh1-GAL4, UAS-SCA3trQ78/E(z)731
Fig. 5 Neural degeneration due to pathogenic ATXN3 is suppressed by PRC2 mutations. a The fly compound eye is comprised of individual optical units called ommatidia, which are arranged in a hexagonal array. Within each ommatidium are eight photoreceptors (PR), of which seven are visible by this assay. Each panel shows eleven ommatidial units; flies are 21d old. Whereas wild-type has seven PRs in each ommatidial unit, expression of SCA3trQ78 results in PR loss. Heterozygous mutation of Pcl or Su(z)12 mitigates PR cell loss. Heterozygous reduction of E(z) also mitigates PR loss. Scale bar indicates 10 μm. b Histogram showing the distribution of photoreceptors (PR) per ommatidium at 21d in wild-type (black, 7.0 PR/ommatidium), SCA3trQ78 (red, average 1.72 ± 0.06 SEM noted with red arrowhead, n = 24 flies, 240 ommatidia), and SCA3trQ78 with a heterozygous Pcl allele (green, average 4.02 ± 0.10 SEM noted with green arrowhead, n = 20 flies, 200 ommatidia). p < 0.001, Kruskal–Wallis test, Dunn post-test. Genotypes: SCA3trQ78 is rh1-GAL4, UAS-SCA3trQ78/+; Pcl5/+ is Pcl5/+; rh1-GAL4, UAS-SCA3trQ78/+. c Histogram showing the distribution of photoreceptors (PR) per ommatidium at 21d in wild-type (black, 7.0 PR), SCA3trQ78 (red, average 1.92 ± 0.06 SEM noted with red arrowhead, n = 29 flies, 291 ommatidia), and SCA3trQ78 heterozygous for a Su(z)12 allele (green, average 4.93 ± 0.11 SEM noted with arrowhead, n = 20 flies, 197 ommatidia). p < 0.001, Kruskal–Wallis test, Dunn post-test. Genotypes: SCA3trQ78 is rh1-GAL4, UAS-SCA3trQ78/+; Su(z)122/+ is rh1-GAL4, UAS-SCA3trQ78/Su(z)122. d Histogram showing the distribution of photoreceptors (PR) per ommatidium at 21d in wild-type (black, 7.0 PR), SCA3trQ78 (red, average 1.86 ± 0.06 SEM noted with red arrowhead, n = 19 flies, 379 ommatidia), and SCA3trQ78 heterozygous for an E(z) allele (green, average 3.44 ± 0.16 SEM noted with arrowhead, n = 19 flies, 349 ommatidia). p < 0.001, Kruskal–Wallis test, Dunn post-test. Genotypes: SCA3trQ78 is rh1-GAL4, UAS-SCA3trQ78/+; E(z)731/+ is rh1-GAL4, UAS-SCA3trQ78/E(z)731CC BY · PubMed Central
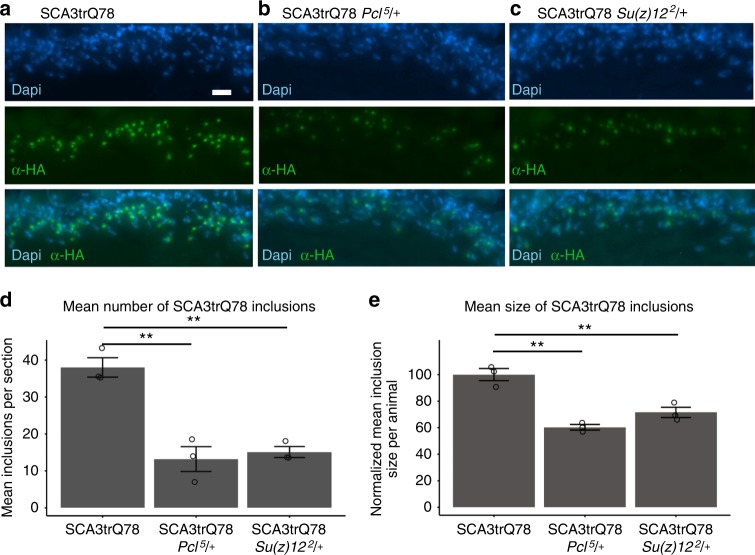
Fig. 6 PRC2 mutations suppress accumulation of pathogenic polyglutamine protein. a Animals expressing SCA3trQ78 in the photoreceptor cells have prominent nuclear inclusions. 3d animals, antibody to HA tag present on the SCA3trQ78 transgene (green). Dapi (blue), nuclei. Genotype: rh1-GAL4, UAS-SCA3trQ78/+. Scale bar indicates 10 μm. b Decreasing Pcl activity decreased SCA3trQ78 inclusions of 3d animals. Genotype: Pcl5/+; rh1-GAL4, UAS-SCA3trQ78/+. c Decreasing Su(z)12 activity decreased SCA3trQ78 inclusions of 3d animals. Genotype: rh1-GAL4, UAS-SCA3trQ78/Su(z)122. d Average number of inclusions detected in the region of interest in various genotypes. Mean ± SEM, n = 3 animals, using the average of at least 4 sections per animal. F2,6 = 27.84, p < 0.001, one-way ANOVA, with Tukey post-test **p < 0.01. e Mean size of inclusions. The size of inclusions detected in at least 4 sections per animal was determined, with the control cohort adjusted to 100%. The average size of inclusions was smaller in animals heterozygous for Pcl5 or Su(z)122. Mean ± SEM, n = 3 animals, using the average of at least 4 sections per animal. F2,6 = 30.89, p < 0.001, one-way ANOVA, with Tukey post-test, **p < 0.01
Fig. 6 PRC2 mutations suppress accumulation of pathogenic polyglutamine protein. a Animals expressing SCA3trQ78 in the photoreceptor cells have prominent nuclear inclusions. 3d animals, antibody to HA tag present on the SCA3trQ78 transgene (green). Dapi (blue), nuclei. Genotype: rh1-GAL4, UAS-SCA3trQ78/+. Scale bar indicates 10 μm. b Decreasing Pcl activity decreased SCA3trQ78 inclusions of 3d animals. Genotype: Pcl5/+; rh1-GAL4, UAS-SCA3trQ78/+. c Decreasing Su(z)12 activity decreased SCA3trQ78 inclusions of 3d animals. Genotype: rh1-GAL4, UAS-SCA3trQ78/Su(z)122. d Average number of inclusions detected in the region of interest in various genotypes. Mean ± SEM, n = 3 animals, using the average of at least 4 sections per animal. F2,6 = 27.84, p < 0.001, one-way ANOVA, with Tukey post-test **p < 0.01. e Mean size of inclusions. The size of inclusions detected in at least 4 sections per animal was determined, with the control cohort adjusted to 100%. The average size of inclusions was smaller in animals heterozygous for Pcl5 or Su(z)122. Mean ± SEM, n = 3 animals, using the average of at least 4 sections per animal. F2,6 = 30.89, p < 0.001, one-way ANOVA, with Tukey post-test, **p < 0.01CC BY · PubMed Central
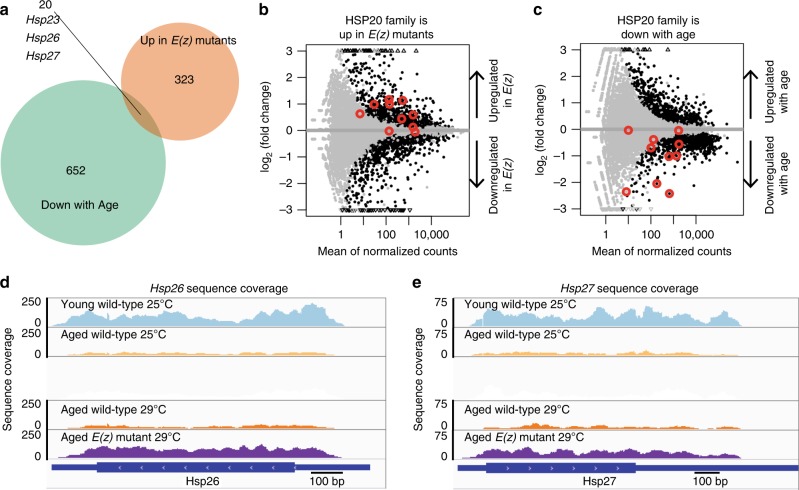
Fig. 7 The small HSP chaperone family is regulated with age and by E(z). RNA-seq was performed on 20d brain tissue from animals transheterozygous for the E(z)61 and E(z)731 alleles, and on wild-type. Because the E(z)61 allele is temperature-sensitive, two temperatures were used, 25 °C (permissive) and 29 °C (restrictive). Wild-type brains, 3d (young) and 20d (aged) 25 °C, were also dissected and RNA-seq performed. Genes were selected as differentially expressed using a Benjamini-Hochberg p < 0.05 and at least a 0.5 absolute log2 fold-change. a Gene overlap. Twenty genes had an expression pattern consistent with being a target of E(z) with age in the brain: upregulated in E(z) and downregulated with age. b, c Differential gene expression analysis of sHSP family genes. Gray data points are genes not differentially expressed. Black data points are genes with significant changes in expression (p<0.05, DEseq2 negative binomial generalized linear model, Benjamini-Hochberg correction). Red circles mark the sHSP family members Hsp23, Hsp26, Hsp27, Hsp67Ba, Hsp67Bc, l(2)efl, CG4461, CG7409, CG13133, and CG14207. Hsp22 was not included because no reads mapped uniquely to this gene. b Small HSP genes are upregulated in 20d E(z) mutant brains. Among these, Hsp23, Hsp26, Hsp27, and CG7409 were significantly elevated in E(z) mutants (p < 0.05, DESeq2 negative binomial generalized linear model, Bonferroni correction), compared to 20d wild-type. c Small HSPs are downregulated in the brain with age. Hsp23, Hsp26, Hsp27, Hsp67Ba, and Hsp67Bc were significantly decreased (p < 0.05, DESeq2 negative binomial generalized linear model, Bonferroni correction) with age comparing 20d to 3d wild-type. d, e Sequence coverage at specific loci indicates silencing of sHSPs with age, and release from silencing in E(z) mutants. Read coverage at the individual sHSP loci (d) Hsp26 and (e) Hsp27 demonstrates a decrease in expression of sHSPs with age. Young wild-type animals express high levels (blue) while aged wild-type animals have less sHSP expression (yellow). E(z) mutation (purple) results in increased sHSP levels compared to age and temperature matched controls (orange). Y-axis indicates sequence read coverage from one biological replicate from each cohort. Each library shown had similar depth of sequencing (24–26 × 106 reads). X-axis indicates position along the gene. Expression levels in E(z) are high, similar to young brain tissue
Fig. 7 The small HSP chaperone family is regulated with age and by E(z). RNA-seq was performed on 20d brain tissue from animals transheterozygous for the E(z)61 and E(z)731 alleles, and on wild-type. Because the E(z)61 allele is temperature-sensitive, two temperatures were used, 25 °C (permissive) and 29 °C (restrictive). Wild-type brains, 3d (young) and 20d (aged) 25 °C, were also dissected and RNA-seq performed. Genes were selected as differentially expressed using a Benjamini-Hochberg p < 0.05 and at least a 0.5 absolute log2 fold-change. a Gene overlap. Twenty genes had an expression pattern consistent with being a target of E(z) with age in the brain: upregulated in E(z) and downregulated with age. b, c Differential gene expression analysis of sHSP family genes. Gray data points are genes not differentially expressed. Black data points are genes with significant changes in expression (p<0.05, DEseq2 negative binomial generalized linear model, Benjamini-Hochberg correction). Red circles mark the sHSP family members Hsp23, Hsp26, Hsp27, Hsp67Ba, Hsp67Bc, l(2)efl, CG4461, CG7409, CG13133, and CG14207. Hsp22 was not included because no reads mapped uniquely to this gene. b Small HSP genes are upregulated in 20d E(z) mutant brains. Among these, Hsp23, Hsp26, Hsp27, and CG7409 were significantly elevated in E(z) mutants (p < 0.05, DESeq2 negative binomial generalized linear model, Bonferroni correction), compared to 20d wild-type. c Small HSPs are downregulated in the brain with age. Hsp23, Hsp26, Hsp27, Hsp67Ba, and Hsp67Bc were significantly decreased (p < 0.05, DESeq2 negative binomial generalized linear model, Bonferroni correction) with age comparing 20d to 3d wild-type. d, e Sequence coverage at specific loci indicates silencing of sHSPs with age, and release from silencing in E(z) mutants. Read coverage at the individual sHSP loci (d) Hsp26 and (e) Hsp27 demonstrates a decrease in expression of sHSPs with age. Young wild-type animals express high levels (blue) while aged wild-type animals have less sHSP expression (yellow). E(z) mutation (purple) results in increased sHSP levels compared to age and temperature matched controls (orange). Y-axis indicates sequence read coverage from one biological replicate from each cohort. Each library shown had similar depth of sequencing (24–26 × 106 reads). X-axis indicates position along the gene. Expression levels in E(z) are high, similar to young brain tissueCC BY · PubMed Central
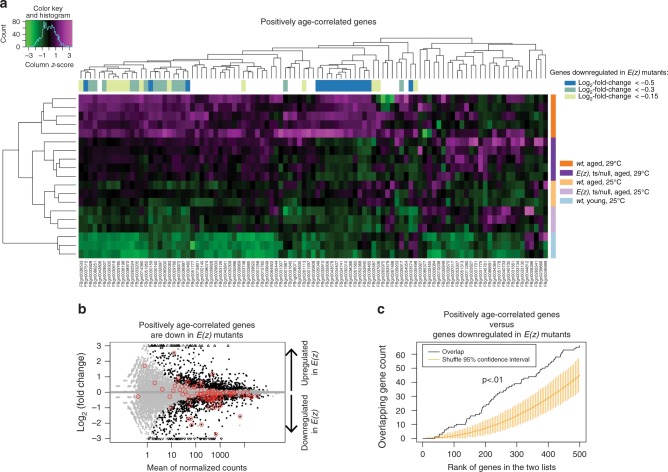
Fig. 8 E(z) mutants have a chronologically younger aged transcriptome. a Heatmap of positively age-correlated genes. A set of genes previously shown to be positively correlated with age in the Drosophila brain6 were analyzed using hierarchical clustering to assess their pattern of expression in the E(z) mutant combination. Magenta indicates high and green indicates low expression. Colored bars on the side indicate genotype, age, and temperature. Colored bars on the top refer to genes downregulated in E(z) mutants, with color indicating the log2-fold-change threshold. Brains from young animals have the lowest expression of positively age-correlated genes, followed by brains from 20d E(z) mutants. Brains from 20d wild-type animals cultivated at 29 °C generally have the highest expression levels. For two clusters of genes (blue genes), expression is decreased in E(z) mutants relative to age-matched and temperature-matched wild-type controls. b Genes positively correlated with age are disproportionately downregulated in E(z) mutants. Gray data points are genes not differentially expressed. Black data points are differentially expressed genes (p < 0.05). Red circles are genes corresponding to probe sets previously defined as positively correlated with age6. The overlap between genes called downregulated in E(z) and the genes positively-correlated with age is statistically significant (p-value = 0.001, hypergeometric test). c Significant overlap between genes positively correlated with age and genes downregulated in E(z) mutants indicate a less advanced age transcriptome profile. Comparison of two ranked lists of genes: the list of genes ranked by degree of downregulation in E(z) mutants (Supplementary Data 1) and top 500 genes ranked by positive correlation with age Supplementary Data 2. E(z) regulated genes were ranked by the product of the -log(p-value) and the moderated log2 fold-change (low to high). All positively age-correlated genes were ranked according to decreasing significance of the correlation with age among all genes with a positive correlation, followed by genes with negative correlation which were ranked according to increasing significance (Supplementary Data 2). Yellow bars indicate 95% confidence intervals. By contrast, the correlation from the data (black line) is outside of the confidence intervals and thus is statistically significant (p < 0.01, calculated empirically using permutations, orderedList R-package)
Fig. 8 E(z) mutants have a chronologically younger aged transcriptome. a Heatmap of positively age-correlated genes. A set of genes previously shown to be positively correlated with age in the Drosophila brain6 were analyzed using hierarchical clustering to assess their pattern of expression in the E(z) mutant combination. Magenta indicates high and green indicates low expression. Colored bars on the side indicate genotype, age, and temperature. Colored bars on the top refer to genes downregulated in E(z) mutants, with color indicating the log2-fold-change threshold. Brains from young animals have the lowest expression of positively age-correlated genes, followed by brains from 20d E(z) mutants. Brains from 20d wild-type animals cultivated at 29 °C generally have the highest expression levels. For two clusters of genes (blue genes), expression is decreased in E(z) mutants relative to age-matched and temperature-matched wild-type controls. b Genes positively correlated with age are disproportionately downregulated in E(z) mutants. Gray data points are genes not differentially expressed. Black data points are differentially expressed genes (p < 0.05). Red circles are genes corresponding to probe sets previously defined as positively correlated with age6. The overlap between genes called downregulated in E(z) and the genes positively-correlated with age is statistically significant (p-value = 0.001, hypergeometric test). c Significant overlap between genes positively correlated with age and genes downregulated in E(z) mutants indicate a less advanced age transcriptome profile. Comparison of two ranked lists of genes: the list of genes ranked by degree of downregulation in E(z) mutants (Supplementary Data 1) and top 500 genes ranked by positive correlation with age Supplementary Data 2. E(z) regulated genes were ranked by the product of the -log(p-value) and the moderated log2 fold-change (low to high). All positively age-correlated genes were ranked according to decreasing significance of the correlation with age among all genes with a positive correlation, followed by genes with negative correlation which were ranked according to increasing significance (Supplementary Data 2). Yellow bars indicate 95% confidence intervals. By contrast, the correlation from the data (black line) is outside of the confidence intervals and thus is statistically significant (p < 0.01, calculated empirically using permutations, orderedList R-package)CC BY · PubMed Central
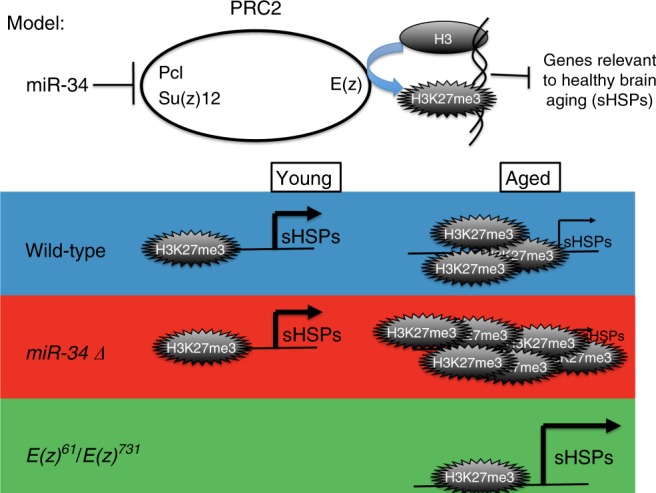
Fig. 9 Model for opposing activities of miR-34 and the PRC2 complex in aging. Our data suggest that miR-34 represses translation of Pcl and Su(z)12 transcripts, resulting in a reduction of PRC2 activity and less H3K27me3. In the miR-34 mutant and normally with age, H3K27me3 accumulates globally and at particular genes, resulting in decreased transcription. Some of these genes (the small heat shock proteins (sHSPs) are highlighted here) appear critical for healthy brain aging. Mutation of E(z) reduces the activity of PRC2, resulting in less suppression of sHSPs and a younger brain transcriptome profile. These data indicate that reduction of the activity of PRC2 with age will be associated with healthier brain aging and protection from deleterious consequences to the brain with age, including neurodegenerative disease
Fig. 9 Model for opposing activities of miR-34 and the PRC2 complex in aging. Our data suggest that miR-34 represses translation of Pcl and Su(z)12 transcripts, resulting in a reduction of PRC2 activity and less H3K27me3. In the miR-34 mutant and normally with age, H3K27me3 accumulates globally and at particular genes, resulting in decreased transcription. Some of these genes (the small heat shock proteins (sHSPs) are highlighted here) appear critical for healthy brain aging. Mutation of E(z) reduces the activity of PRC2, resulting in less suppression of sHSPs and a younger brain transcriptome profile. These data indicate that reduction of the activity of PRC2 with age will be associated with healthier brain aging and protection from deleterious consequences to the brain with age, including neurodegenerative diseaseCC BY · PubMed Central

Verification

Claims the paper makes

The claims and statistics of this paper haven’t been checked yet.

Run the check — free, no account needed. It reads the open-access text and checks the sources it cites.

A few free checks a day · papers already verified open instantly · results are public

Claims other papers make about this one

Each is checked against this paper’s own text: does it say what the citing paper says it does?

Self-check

Percentages, sums and reported differences re-computed from the paper’s own numbers.

The self-check needs the paper’s full text.

Citations

Cites

Research works printed but not linked: 48

  1. Kenyon, C., Chang, J., Gensch, E., Rudner, A. & Tabtiang, R. A. C. elegans mutant that lives twice as long as wild type. Nature 366, 461–464 (1993). · DOI · Paper page
  2. Tissenbaum, H. A. & Guarente, L. Increased dosage of a sir-2 gene extends lifespan in Caenorhabditis elegans. Nature 410, 227–230 (2001). · DOI · Paper page
  3. Arey, R. N. & Murphy, C. T. Conserved regulators of cognitive aging: from worms to humans. Behav. Brain. Res. 322, 299–310 (2017). · DOI
  4. Hsin, H. & Kenyon, C. Signals from the reproductive system regulate the lifespan of C. elegans. Nature 399, 362–366 (1999). · DOI
  5. Liu, N. et al. The microRNA miR-34 modulates ageing and neurodegeneration in Drosophila. Nature 482, 519–523 (2012). · DOI · Paper page
  6. Isik, M., Blackwell, T. K. & Berezikov, E. MicroRNA mir-34 provides robustness to environmental stress response via the DAF-16 network in C. elegans. Sci. Rep. 6, 36766 (2016). · DOI · Paper page
  7. Xiong, X. P. et al. miR-34 modulates innate immunity and ecdysone signaling in drosophila. PLoS Pathog. 12, e1006034 (2016). · DOI
  8. Kim, S., Benguria, A., Lai, C. Y. & Jazwinski, S. M. Modulation of life-span by histone deacetylase genes in Saccharomyces cerevisiae. Mol. Biol. Cell 10, 3125–3136 (1999). · DOI
  9. Ma, Z. et al. Epigenetic drift of H3K27me3 in aging links glycolysis to healthy longevity in Drosophila. eLife 7, pii: e35368 (2018). · DOI
  10. Li, J. et al. EZH2-mediated H3K27 trimethylation mediates neurodegeneration in ataxia-telangiectasia. Nat. Neurosci. 16, 1745–1753 (2013). · DOI
  11. Warrick, J. M. et al. Suppression of polyglutamine-mediated neurodegeneration in Drosophila by the molecular chaperone HSP70. Nat. Genet. 23, 425–428 (1999). · DOI
  12. Vos, M. J. et al. Specific protein homeostatic functions of small heat-shock proteins increase lifespan. Aging Cell 15, 217–226 (2016). · DOI
  13. Robertson, A. L. et al. Small heat-shock proteins interact with a flanking domain to suppress polyglutamine aggregation. Proc. Natl Acad. Sci. USA 107, 10424–10429 (2010). · DOI
  14. Morrow, G., Samson, M., Michaud, S. & Tanguay, R. M. Overexpression of the small mitochondrial Hsp22 extends Drosophila life span and increases resistance to oxidative stress. FASEB J. 18, 598–599 (2004). · DOI · Paper page
  15. Klaips C. L., Jayaraj G. G. & Hartl F. U. Pathways of cellular proteostasis in aging and disease. J. Cell Biol. 217, 151–163 (2017). · DOI
  16. Nekrasov, M. et al. Pcl-PRC2 is needed to generate high levels of H3-K27 trimethylation at Polycomb target genes. EMBO J. 26, 4078–4088 (2007). · DOI
  17. Young, M. D. et al. ChIP-seq analysis reveals distinct H3K27me3 profiles that correlate with transcriptional activity. Nucleic Acids Res. 39, 7415–7427 (2011). · DOI
  18. Chen, S., Birve, A. & Rasmuson-Lestander, A. In vivo analysis of Drosophila SU(Z)12 function. Mol. Genet. Genom. 279, 159–170 (2008). · DOI
  19. Robins, H., Li, Y. & Padgett, R. Incorporating structure to predict microRNA targets. Proc. Natl Acad. Sci. USA 102, 4006–4009 (2005). · DOI
  20. Rehmsmeier, M., Steffen, P., Hochsmann, M. & Giegerich, R. Fast and effective prediction of microRNA/target duplexes. RNA 10, 1507–1517 (2004). · DOI · Paper page
  21. Vella, M. C., Reinert, K. & Slack, F. J. Architecture of a validated microRNA:target interaction. Chem. Biol. 11, 1619–1623 (2004). · DOI
  22. Simon, J. A. & Kingston, R. E. Occupying chromatin: polycomb mechanisms for getting to genomic targets, stopping transcriptional traffic, and staying put. Mol. Cell 49, 808–824 (2013). · DOI
  23. Bilen, J., Liu, N., Burnett, B. G., Pittman, R. N. & Bonini, N. M. MicroRNA pathways modulate polyglutamine-induced neurodegeneration. Mol. Cell 24, 157–163 (2006). · DOI
  24. Huang da, W., Sherman, B. T. & Lempicki, R. A. Systematic and integrative analysis of large gene lists using DAVID bioinformatics resources. Nat. Protoc. 4, 44–57 (2009). · DOI · Paper page
  25. Bonini, N. M. Chaperoning brain degeneration. Proc. Natl Acad. Sci. USA 99(Suppl 4), 16407–16411 (2002). · DOI
  26. Bilen, J. & Bonini, N. M. Genome-wide screen for modifiers of ataxin-3 neurodegeneration in Drosophila. PLoS Genet. 3, 1950–1964 (2007). · DOI
  27. Vos, M. J. et al. HSPB7 is the most potent polyQ aggregation suppressor within the HSPB family of molecular chaperones. Hum. Mol. Genet. 19, 4677–4693 (2010). · DOI
  28. Cao, K., Chen-Plotkin, A. S., Plotkin, J. B. & Wang, L. S. Age-correlated gene expression in normal and neurodegenerative human brain tissues. PLoS ONE 5, pii: e13098 (2010). · DOI
  29. Lottaz, C., Yang, X., Scheid, S. & Spang, R. OrderedList—a bioconductor package for detecting similarity in ordered gene lists. Bioinformatics 22, 2315–2316 (2006). · DOI
  30. Ebert, M. S. & Sharp, P. A. Roles for microRNAs in conferring robustness to biological processes. Cell 149, 515–524 (2012). · DOI · Paper page
  31. Aldiri, I. & Vetter, M. L. PRC2 during vertebrate organogenesis: a complex in transition. Dev. Biol. 367, 91–99 (2012). · DOI
  32. Charmpilas, N., Kyriakakis, E. & Tavernarakis, N. Small heat shock proteins in ageing and age-related diseases. Cell Stress Chaperon-. 22, 481–492 (2017). · DOI
  33. Haslbeck, M. & Vierling, E. A first line of stress defense: small heat shock proteins and their function in protein homeostasis. J. Mol. Biol. 427, 1537–1548 (2015). · DOI
  34. Pasini, D., Bracken, A. P., Jensen, M. R., Lazzerini Denchi, E. & Helin, K. Suz12 is essential for mouse development and for EZH2 histone methyltransferase activity. EMBO J. 23, 4061–4071 (2004). · DOI
  35. Jones, R. S. & Gelbart, W. M. Genetic analysis of the enhancer of zeste locus and its role in gene regulation in Drosophila melanogaster. Genetics 126, 185–199 (1990). · DOI
  36. Ezhkova, E. et al. EZH1 and EZH2 cogovern histone H3K27 trimethylation and are essential for hair follicle homeostasis and wound repair. Genes Dev. 25, 485–498 (2011). · DOI · Paper page
  37. Duncan, I. M. Polycomblike: a gene that appears to be required for the normal expression of the bithorax and antennapedia gene complexes of Drosophila melanogaster. Genetics 102, 49–70 (1982). · DOI
  38. Birve, A. et al. Su(z)12, a novel Drosophila polycomb group gene that is conserved in vertebrates and plants. Development 128, 3371–3379 (2001). · DOI
  39. Shi, Y. et al. Structure of the PRC2 complex and application to drug discovery. Acta Pharmacol. Sin. 38, 963–976 (2017). · DOI
  40. Kim, K. H. & Roberts, C. W. Targeting EZH2 in cancer. Nat. Med. 22, 128–134 (2016). · DOI · Paper page
  41. Liu, N. et al. The exoribonuclease Nibbler controls 3′ end processing of microRNAs in Drosophila. Curr. Biol. 21, 1888–1893 (2011). · DOI
  42. Schneider, C. A., Rasband, W. S. & Eliceiri, K. W. NIH image to ImageJ: 25 years of image analysis. Nat. Methods 9, 671–675 (2012). · DOI · Paper page
  43. Shapiro, S. S. & Wilk, M. B. An analysis of variance test for normality (complete samples). Biometrika 52, 591 (1965). · DOI · Paper page
  44. Levene H. Contributions to Probability and Statistics: Essays in Honor of Harold Hotelling. (Stanford University Press, Stanford, CA 1960).
  45. Dobin, A. et al. STAR: ultrafast universal RNA-seq aligner. Bioinformatics 29, 15–21 (2013). · DOI · Paper page
  46. Anders, S., Pyl, P. T. & Huber, W. HTSeq—a Python framework to work with high-throughput sequencing data. Bioinformatics 31, 166–169 (2015). · DOI · Paper page
  47. Love, M. I., Huber, W. & Anders, S. Moderated estimation of fold change and dispersion for RNA-seq data with DESeq2. Genome Biol. 15, 550 (2014). · DOI · Paper page
  48. Durinck, S., Spellman, P. T., Birney, E. & Huber, W. Mapping identifiers for the integration of genomic datasets with the R/Bioconductor package biomaRt. Nat. Protoc. 4, 1184–1191 (2009). · DOI

Cited by

Sorted by citations

See all 56

Metadata

Authors
Kennerdell, J. R., Liu, N., & Bonini, N. M.
Venue
Nature Communications
Published
2018-10-10
Volume
9
Issue
1
ISSN
2041-1723
Cited by
56
References
10
Language
en

About these checks

Registry, retraction, Cites and statistics results are computed, not judged, with one exception: a printed reference that no index lists is read once by a model before it counts as a citation error. Claims are extracted by a model and kept only when their quote appears verbatim in the text; each cited source is then checked, with a model’s help, for whether it says what the claim relies on. Those verdicts can be wrong — read the claim’s quote and the cited source before relying on one.

Statistics and arithmetic are recomputed, not judged.

Confidence bands are shown only for fields calibrated on our annotated test set. None is calibrated yet, so no band is shown.

What counts as a claim ›How we measure confidence ›How we check this ›

Are you an author, or do you see a problem with this page? Request a review