

The DOI matches its Crossref record; 53 of the 53 references it cites were found in a registry or an index.
Heterochronic faecal transplantation boosts gut germinal centres in aged mice
Open accessAbstract
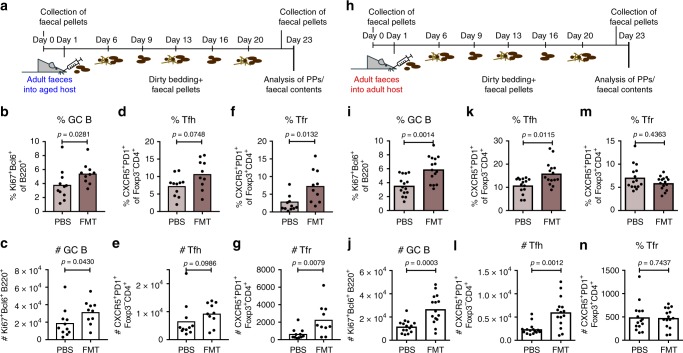
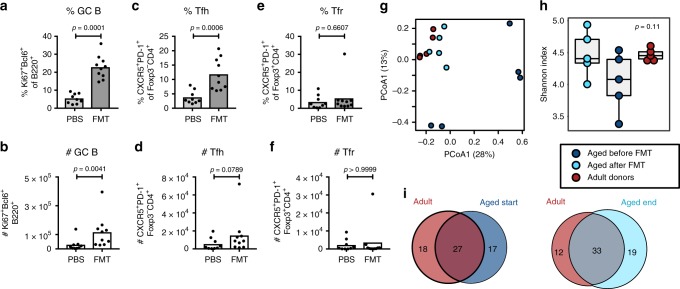
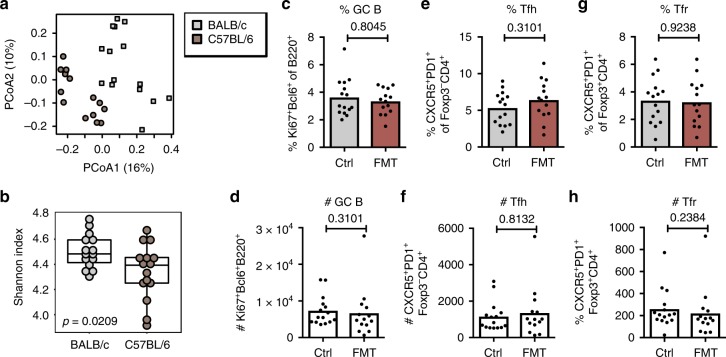
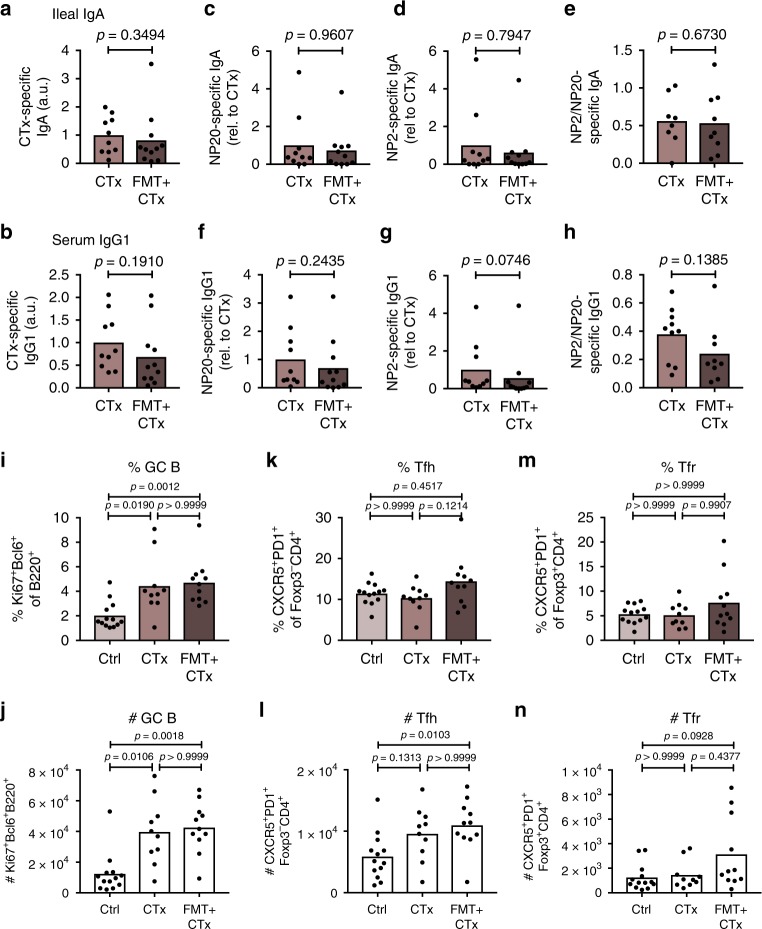
Ageing is a complex multifactorial process associated with a plethora of disorders, which contribute significantly to morbidity worldwide. One of the organs significantly affected by age is the gut. Age-dependent changes of the gut-associated microbiome have been linked to increased frailty and systemic inflammation. This change in microbial composition with age occurs in parallel with a decline in function of the gut immune system; however, it is not clear whether there is a causal link between the two. Here we report that the defective germinal centre reaction in Peyer’s patches of aged mice can be rescued by faecal transfers from younger adults into aged mice and by immunisations with cholera toxin, without affecting germinal centre reactions in peripheral lymph nodes. This demonstrates that the poor germinal centre reaction in aged animals is not irreversible, and that it is possible to improve this response in older individuals by providing appropriate stimuli.
Overview
The claims and statistics of this paper haven’t been checked yet.
Run the check — free, no account needed. It reads the open-access text and checks the sources it cites.
Integrity signals
Registry
Cites
Statistics
Figures
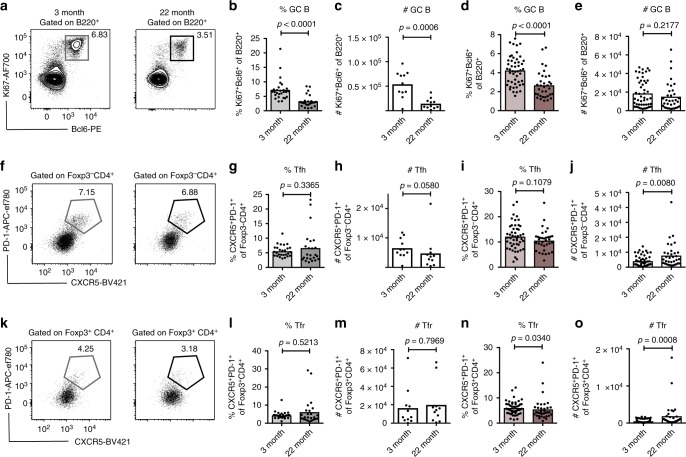
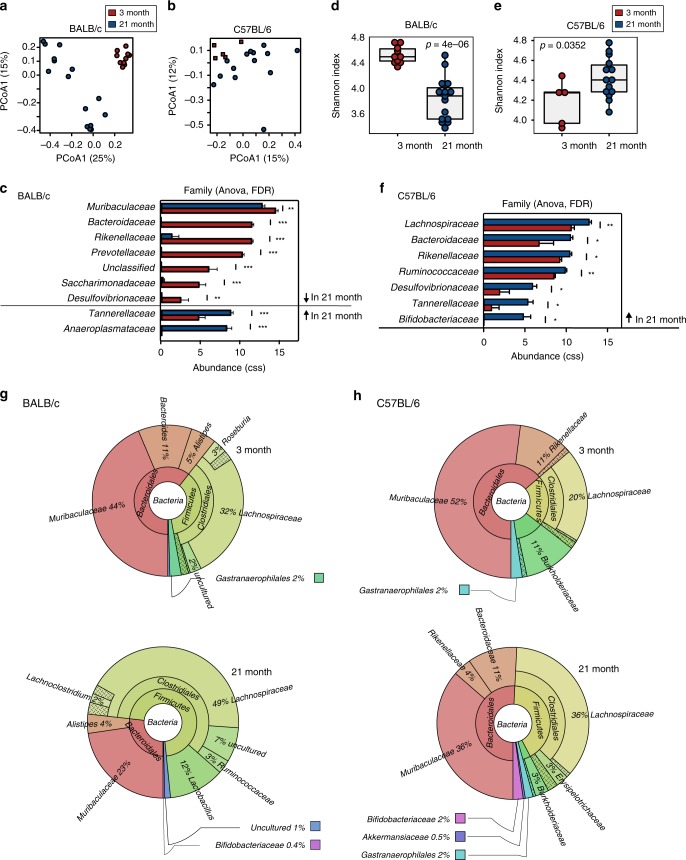
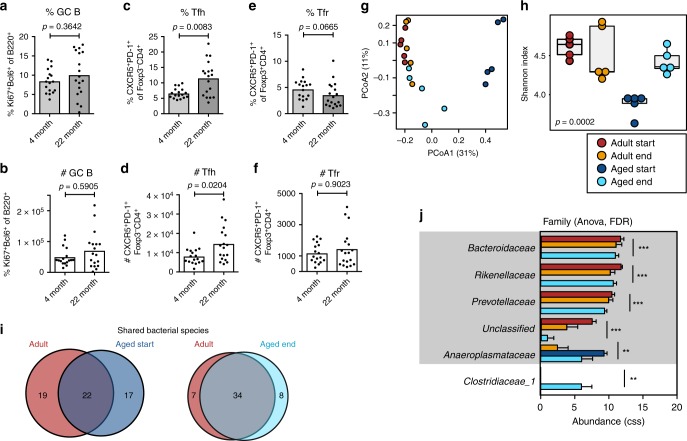
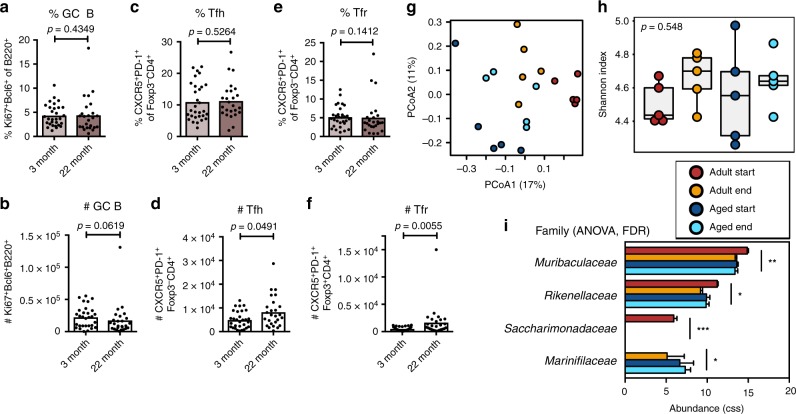
Verification
Claims the paper makes
The claims and statistics of this paper haven’t been checked yet.
Run the check — free, no account needed. It reads the open-access text and checks the sources it cites.
Claims other papers make about this one
Each is checked against this paper’s own text: does it say what the citing paper says it does?
The source backs part of the claim, not all of it — or backs it for a different population, condition or comparison.
In the citing paper
“These changes can adversely affect the host metabolism and immunity [25–27, 40, 64, 86, 110, 112, 118] and are associated with the development of cardiovascular, autoimmune, metabolic, and neurodegenerative disorders [17, 90, 122, 132].”
From Fecal microbiota transfer between young and aged mice reverses hallmarks of the aging gut, eye, and brain (2022) · cites this paper as [112]
Experimental — accuracy not yet measuredThe source backs part of the claim, not all of it — or backs it for a different population, condition or comparison.
In the citing paper
“the defective germinal center reaction in Peyer's patches of aged mice can be rescued by FMT from younger animals without affecting germinal center reactions in peripheral lymph nodes.”
From Hallmarks of aging: An expanding universe (2023) · cites this paper as [288]
Experimental — accuracy not yet measuredThe source backs part of the claim, not all of it — or backs it for a different population, condition or comparison.
In the citing paper
“| Dysbiosis | Mouse | Fecal microbiota transplantation | Improved germinal centre reactions in lymph nodes | 288 |”
From Hallmarks of aging: An expanding universe (2023) · cites this paper as [288]
Experimental — accuracy not yet measuredIn the citing paper
“Similar beneficial effects have been reported in aged mice receiving microbiota from young mice to extend life span [8, 61] or halt the functional decline in the mucosal immune system [112].”
From Fecal microbiota transfer between young and aged mice reverses hallmarks of the aging gut, eye, and brain (2022) · cites this paper as [112]
Self-check
Percentages, sums and reported differences re-computed from the paper’s own numbers.
The self-check needs the paper’s full text.
Citations
Cites
QIIME allows analysis of high-throughput community sequencing data
Caporaso, J. G., Kuczynski, J., Stombaugh, J., Bittinger, K., Bushman, F. D., Costello, E. K., Fierer, N., Peña, A. G., Goodrich, J. K., Gordon, J. I., et al. (2010) · Nature Methods · doi:10.1038/nmeth.f.303 · Cited by 34,887
The SILVA ribosomal RNA gene database project: improved data processing and web-based tools
Quast, C., Pruesse, E., Yilmaz, P., Gerken, J., Schweer, T., Yarza, P., Peplies, J., & Glöckner, F. O. (2012) · Nucleic Acids Research · doi:10.1093/nar/gks1219 · Cited by 33,055
Role of the microbiota in immunity and inflammation.
Belkaid, Y., & Hand, T. W. (2014) · Cell · doi:10.1016/j.cell.2014.03.011 · Cited by 5,385
Gut microbiota composition correlates with diet and health in the elderly
Claesson, M. J., Jeffery, I. B., Conde, S., Power, S. E., O’Connor, E. M., Cusack, S., Harris, H. M. B., Coakley, M., Lakshminarayanan, B., O’Sullivan, O., et al. (2012) · Nature · doi:10.1038/nature11319 · Cited by 3,314
Interactive metagenomic visualization in a Web browser
Ondov, B., Bergman, N. H., & Phillippy, A. M. (2011) · BMC Bioinformatics · doi:10.1186/1471-2105-12-385 · Cited by 2,123
Composition, variability, and temporal stability of the intestinal microbiota of the elderly
Claesson, M. J., Cusack, S., O'Sullivan, O., Greene-Diniz, R., de Weerd, H., Flannery, E., Marchesi, J. R., Falush, D., Dinan, T., Fitzgerald, G., et al. (2011) · Proceedings of the National Academy of Sciences · doi:10.1073/pnas.1000097107 · Cited by 1,754
Through Ageing, and Beyond: Gut Microbiota and Inflammatory Status in Seniors and Centenarians
Biagi, E., Nylund, L., Candela, M., Ostan, R., Bucci, L., Pini, E., Nikkïla, J., Monti, D., Satokari, R., Franceschi, C., et al. (2010) · PLoS ONE · doi:10.1371/journal.pone.0010667 · Cited by 1,483
Cattaneo, A., Cattane, N., Galluzzi, S., Provasi, S., Lopizzo, N., Festari, C., Ferrari, C., Guerra, U. P., Paghera, B., Muscio, C., et al. (2017) · Neurobiology of Aging · doi:10.1016/j.neurobiolaging.2016.08.019 · Cited by 1,382
Thevaranjan, N., Puchta, A., Schulz, C., Naidoo, A., Szamosi, J. C., Verschoor, C. P., Loukov, D., Schenck, L. P., Jury, J., Foley, K. P., et al. (2017) · Cell Host & Microbe · doi:10.1016/j.chom.2017.03.002 · Cited by 1,322
The twilight of immunity: emerging concepts in aging of the immune system
Nikolich-Žugich, J. (2018) · Nature Immunology · doi:10.1038/s41590-017-0006-x · Cited by 1,240
Cohabiting family members share microbiota with one another and with their dogs
Song, S. J., Lauber, C. L., Costello, E. K., Lozupone, C., Humphrey, G., Berg-Lyons, D., Caporaso, J. G., Knights, D., Clemente, J. C., Nakielny, S., et al. (2013) · eLife · doi:10.7554/elife.00458 · Cited by 1,120
Germinal Center B Cell Dynamics
Mesin, L., Ersching, J., & Victora, G. D. (2016) · Immunity · doi:10.1016/j.immuni.2016.09.001 · Cited by 1,028
Mueller, S., Saunier, K., Hanisch, C., Norin, E., Alm, L., Midtvedt, T., Cresci, A., Silvi, S., Orpianesi, C., Verdenelli, M. C., et al. (2006) · Applied and Environmental Microbiology · doi:10.1128/aem.72.2.1027-1033.2006 · Cited by 1,006
The Human Microbiota in Health and Disease
Wang, B., Yao, M., Lv, L., Ling, Z., & Li, L. (2017) · Engineering · doi:10.1016/j.eng.2017.01.008 · Cited by 916
Goodrich, J. K., Di Rienzi, S. C., Poole, A. C., Koren, O., Walters, W. A., Caporaso, J. G., Knight, R., & Ley, R. E. (2014) · Cell · doi:10.1016/j.cell.2014.06.037 · Cited by 714
FELASA working group on revision of guidelines for health monitoring of rodents and rabbits, Mähler (Convenor), M., Berard, M., Feinstein, R., Gallagher, A., Illgen-Wilcke, B., Pritchett-Corning, K., & Raspa, M. (2014) · Laboratory Animals · doi:10.1177/0023677213516312 · Cited by 646
Calypso: a user-friendly web-server for mining and visualizing microbiome–environment interactions
Zakrzewski, M., Proietti, C., Ellis, J. J., Hasan, S., Brion, M., Berger, B. W., & Krause, L. (2016) · Bioinformatics · doi:10.1093/bioinformatics/btw725 · Cited by 568
Innate and Adaptive Humoral Responses Coat Distinct Commensal Bacteria with Immunoglobulin A
Bunker, J. J., Flynn, T. M., Koval, J., Shaw, D. G., Meisel, M., McDonald, B. D., Ishizuka, I. E., Dent, A. L., Wilson, P. C., Jabrì, B., et al. (2015) · Immunity · doi:10.1016/j.immuni.2015.08.007 · Cited by 561
Kawamoto, S., Maruya, M., Kato, L. M., Suda, W., Atarashi, K., Doi, Y., Tsutsui, Y., Qin, H., Honda, K., Okada, T., et al. (2014) · Immunity · doi:10.1016/j.immuni.2014.05.016 · Cited by 531
Fecal microbiota transplantation: in perspective
Gupta, S., Allen‐Vercoe, E., & Petrof, E. O. (2015) · Therapeutic Advances in Gastroenterology · doi:10.1177/1756283x15607414 · Cited by 502
Hildebrand, F., Nguyen, T. L. A., Brinkman, B. M. N., Yunta, R. G., Cauwe, B., Vandenabeele, P., Liston, A., & Raes, J. (2013) · Genome biology · doi:10.1186/gb-2013-14-1-r4 · Cited by 478
Aging of the Immune System: How Much Can the Adaptive Immune System Adapt?
Weng, N. (2006) · Immunity · doi:10.1016/j.immuni.2006.05.001 · Cited by 476
Intestinal microbiota, diet and health
Power, S. E., O'Toole, P. W., Stanton, C., Ross, R. P., & Fitzgerald, G. F. (2014) · British Journal Of Nutrition · doi:10.1017/s0007114513002560 · Cited by 476
The Inhibitory Receptor PD-1 Regulates IgA Selection and Bacterial Composition in the Gut
Kawamoto, S., Tran, T. H., Maruya, M., Suzuki, K., Doi, Y., Tsutsui, Y., Kato, L. M., & Fagarasan, S. (2012) · Science · doi:10.1126/science.1217718 · Cited by 451
Regulation of life span by the gut microbiota in the short-lived African turquoise killifish
Smith, P., Willemsen, D., Popkes, M., Metge, F., Gandiwa, E., Reichard, M., & Valenzano, D. R. (2017) · eLife · doi:10.7554/elife.27014 · Cited by 423
(Dis)Trust your gut: the gut microbiome in age-related inflammation, health, and disease
Buford, T. W. (2017) · Microbiome · doi:10.1186/s40168-017-0296-0 · Cited by 409
Aged Gut Microbiota Contributes to Systemical Inflammaging after Transfer to Germ-Free Mice
Fransen, F., van Beek, A. A., Borghuis, T., Aidy, S. E., Hugenholtz, F., van der Gaast – de Jongh, C., Savelkoul, H. F. J., De Jonge, M. I., Boekschoten, M. V., Smidt, H., et al. (2017) · Frontiers in Immunology · doi:10.3389/fimmu.2017.01385 · Cited by 403
Bunker, J. J., & Bendelac, A. S. (2018) · Immunity · doi:10.1016/j.immuni.2018.08.011 · Cited by 402
Effects of Vendor and Genetic Background on the Composition of the Fecal Microbiota of Inbred Mice
Ericsson, A. C., Davis, J. W., Spollen, W. G., Bivens, N. J., Givan, S. A., Hagan, C. E., McIntosh, M., & Franklin, C. L. (2015) · PLoS ONE · doi:10.1371/journal.pone.0116704 · Cited by 321
Host Genetics and Gut Microbiome: Challenges and Perspectives
Kurilshikov, A., Wijmenga, C., Fu, J., & Zhernakova, A. (2017) · Trends in Immunology · doi:10.1016/j.it.2017.06.003 · Cited by 309
IgA Function in Relation to the Intestinal Microbiota
Macpherson, A. J., Yılmaz, B., Limenitakis, J. P., & Ganal-Vonarburg, S. C. (2018) · Annual Review of Immunology · doi:10.1146/annurev-immunol-042617-053238 · Cited by 299
Fransen, F., Zagato, E., Mazzini, E., Fosso, B., Manzari, C., Aidy, S. E., Chiavelli, A., D’Erchia, A. M., Sethi, M. K., Pabst, O., et al. (2015) · Immunity · doi:10.1016/j.immuni.2015.08.011 · Cited by 284
Wei, M., Shinkura, R., Doi, Y., Maruya, M., Fagarasan, S., & Honjo, T. (2011) · Nature Immunology · doi:10.1038/ni.1991 · Cited by 262
Biological aging and the human gut microbiota
Maffei, V. J., Kim, S., Blanchard, E., Luo, M., Jazwinski, S. M., Taylor, C. M., & Welsh, D. A. (2017) · The Journals of Gerontology Series A · doi:10.1093/gerona/glx042 · Cited by 219
Indoles from commensal bacteria extend healthspan
Sonowal, R., Swimm, A., Sahoo, A., Luo, L., Matsunaga, Y., Wu, Z., Bhingarde, J. A., Ejzak, E. A., Ranawade, A., Qadota, H., et al. (2017) · Proceedings of the National Academy of Sciences · doi:10.1073/pnas.1706464114 · Cited by 197
Rausch, P., Basic, M., Batra, A., Bischoff, S. C., Blaut, M., Clavel, T., Gläsner, J., Gopalakrishnan, S., Graßl, G. A., Günther, C., et al. (2016) · International Journal of Medical Microbiology · doi:10.1016/j.ijmm.2016.03.004 · Cited by 190
Bergqvist, P. J., Gärdby, E., Stensson, A., Bemark, M., & Lycke, N. Y. (2006) · The Journal of Immunology · doi:10.4049/jimmunol.177.11.7772 · Cited by 165
Diet, the intestinal microbiota, and immune health in aging
Clements, S. J., & Carding, S. R. (2016) · Critical Reviews in Food Science and Nutrition · doi:10.1080/10408398.2016.1211086 · Cited by 163
Yanagibashi, T., Hosono, A., Oyama, A., Tsuda, M., Suzuki, A., Hachimura, S., Takahashi, Y., Momose, Y., Itoh, K., Hirayama, K., et al. (2012) · Immunobiology · doi:10.1016/j.imbio.2012.07.033 · Cited by 158
Sage, P. T., Tan, C. L., Freeman, G. J., Haigis, M. C., & Sharpe, A. H. (2015) · Cell Reports · doi:10.1016/j.celrep.2015.06.015 · Cited by 145
Sakai, F., Hosoya, T., Ono-Ohmachi, A., Ukibe, K., Ogawa, A., Moriya, T., Kadooka, Y., Shiozaki, T., Nakagawa, H., Nakayama, Y., et al. (2014) · PLoS ONE · doi:10.1371/journal.pone.0105370 · Cited by 124
Obata, F., Fons, C., & Gould, A. P. (2018) · Nature Communications · doi:10.1038/s41467-018-03070-w · Cited by 119
Fostering of advanced mutualism with gut microbiota by Immunoglobulin A
Sutherland, D. B., Suzuki, K., & Fagarasan, S. (2016) · Immunological Reviews · doi:10.1111/imr.12384 · Cited by 115
Longevity extension in Drosophila through gut-brain communication
Westfall, S., Lomis, N., & Prakash, S. (2018) · Scientific Reports · doi:10.1038/s41598-018-25382-z · Cited by 113
Bergqvist, P. J., Stensson, A., Hazanov, L., Holmberg, A. H., Mattsson, J., Mehr, R., Bemark, M., & Lycke, N. Y. (2012) · Mucosal Immunology · doi:10.1038/mi.2012.56 · Cited by 103
Enteric pathogens through life stages
Kolling, G. L., Wu, M., & Guerrant, R. L. (2012) · Frontiers in Cellular and Infection Microbiology · doi:10.3389/fcimb.2012.00114 · Cited by 84
Probiotic Bacteria for Healthier Aging: Immunomodulation and Metabolism of Phytoestrogens
Landete, J. M., Gaya, P., Rodríguez, E., Langa, S., Peirotén, Á., Medina, M., & Arqués, J. L. (2017) · BioMed Research International · doi:10.1155/2017/5939818 · Cited by 76
Communication Between the Microbiota and Mammalian Immunity
Ost, K. S., & Round, J. L. (2018) · Annual Review of Microbiology · doi:10.1146/annurev-micro-090817-062307 · Cited by 75
Kaburagi, T., Yamano, T., Fukushima, Y., Yoshino, H., Mito, N., & Sato, K. (2007) · Nutrition · doi:10.1016/j.nut.2007.02.001 · Cited by 72
How T follicular helper cells and the germinal centre response change with age
Linterman, M. A. (2014) · Immunology & Cell Biology · doi:10.1038/icb.2013.77 · Cited by 69
Self-citationGärdby, E., Wrammert, J., Schön, K., Ekman, L., Leanderson, T., & Lycke, N. Y. (2003) · The Journal of Immunology · doi:10.4049/jimmunol.170.1.55 · Cited by 56
Regulatory T cells and control of the germinal centre response
Vanderleyden, I., Linterman, M. A., & Smith, K. G. C. (2014) · Arthritis Research & Therapy · doi:10.1186/s13075-014-0471-7 · Cited by 40
Self-citationShin, J. H., Gao, Y., Moore, J. H., Bolick, D. T., Kolling, G. L., Wu, M., & Warren, C. A. (2017) · The Journal of Infectious Diseases · doi:10.1093/infdis/jix414 · Cited by 33
Cited by
Sorted by citations
Hallmarks of aging: An expanding universe
López-Otín, C., Blasco, M. A., Partridge, L., Serrano, M., & Kroemer, G. (2023) · Cell · doi:10.1016/j.cell.2022.11.001 · Cited by 6,549
Meta-hallmarks of aging and cancer
López-Otín, C., Pietrocola, F., Roiz-Valle, D., Galluzzi, L., & Kroemer, G. (2023) · Cell Metabolism · doi:10.1016/j.cmet.2022.11.001 · Cited by 529
Parker, A., Romano, S., Ansorge, R., Aboelnour, A., Le Gall, G., Savva, G. M., Pontifex, M. G., Telatin, A., Baker, D., Jones, E., et al. (2022) · Microbiome · doi:10.1186/s40168-022-01243-w · Cited by 368
“Microbiota modulation can be induced by simply co-housing heterochronic groups of mice [112]; however, we chose to also deplete host gut microbiota by prior antibiotic cocktail administration, to maximize potential engraftment of the donor microbiota.”
BackgroundThe Gut Microbiota and Unhealthy Aging: Disentangling Cause from Consequence
DeJong, E. N., Surette, M. G., & Bowdish, D. M. E. (2020) · Cell Host & Microbe · doi:10.1016/j.chom.2020.07.013 · Cited by 370
Microbiota from young mice counteracts selective age-associated behavioral deficits
Boehme, M., Guzzetta, K. E., Bastiaanssen, T. F. S., van de Wouw, M., Moloney, G. M., Gual-Grau, A., Spichak, S., Olavarría-Ramírez, L., Fitzgerald, P., Morillas, E., et al. (2021) · Nature Aging · doi:10.1038/s43587-021-00093-9 · Cited by 313
Metadata
- Authors
- Stebegg, M., Silva-Cayetano, A., Innocentin, S., Jenkins, T. P., Cantacessi, C., Gilbert, C., & Linterman, M. A.
- Affiliations
- Babraham Institute (GB)
- University of Cambridge (GB)
- Corresponding author
- Linterman, Michelle A.
- ORCID
- Venue
- Nature Communications
- Published
- 2019-06-04
- Volume
- 10
- Issue
- 1
- Pages
- 2443-2443
- ISSN
- 2041-1723 (ISSN-L)
- PMC
- PMC6547660
- OpenAlex
- W2948768639
- Cited by
- 107
- References
- 53
- Citations by year
- 2026: 12 · 2025: 9 · 2024: 16 · 2023: 17 · 2022: 17 · 2021: 18 · 2020: 14 · 2019: 3
- FWCI
- 4.30
- Type
- journal article
- Language
- en
- Open access
- gold
- doi.org
- Locations
- Nature Communications (publishedVersion, cc-by)
- Europe PMC (PubMed Central) (publishedVersion, cc-by)
- PubMed Central (publishedVersion, cc-by)
- PubMed (publishedVersion)
- Minerva Access (University of Melbourne) (submittedVersion, cc-by)
- Apollo (University of Cambridge) (submittedVersion, cc-by)
- RePEc: Research Papers in Economics (submittedVersion)
- DOAJ (DOAJ: Directory of Open Access Journals) (submittedVersion, cc-by-sa)
- DOAJ (DOAJ: Directory of Open Access Journals) (submittedVersion)
- Apollo (cc-by)
- Funders
- Wellcome Trust
- European Commission (675395)
- Directorate for Biological Sciences
- Biotechnology and Biological Sciences Research Council (BBS/E/B/000C0407, BBS/E/B/000C0427)
- H2020 European Research Council (637801)
- Topics
- Life Sciences › Biochemistry, Genetics and Molecular Biology › Molecular Biology › Gut microbiota and health
- Life Sciences › Immunology and Microbiology › Immunology › T-cell and B-cell Immunology
- Life Sciences › Biochemistry, Genetics and Molecular Biology › Aging › Genetics, Aging, and Longevity in Model Organisms
- Keywords
- Peyer's patches, gut-associated lymphoid tissue, gut microbiota, immunosenescence, frailty, systemic inflammation, aged mice
- MeSH terms
- Gastrointestinal Microbiome, Fecal Microbiota Transplantation, Aging, Animals, Cholera Toxin, Female, Immunoglobulin A, Immunization, Nitrophenols, Peyer's Patches, Phenylacetates, Germinal Center, Mice, Dysbiosis
About these checks
Registry, retraction, Cites and statistics results are computed, not judged, with one exception: a printed reference that no index lists is read once by a model before it counts as a citation error. Claims are extracted by a model and kept only when their quote appears verbatim in the text; each cited source is then checked, with a model’s help, for whether it says what the claim relies on. Those verdicts can be wrong — read the claim’s quote and the cited source before relying on one.
Statistics and arithmetic are recomputed, not judged.
Confidence bands are shown only for fields calibrated on our annotated test set. None is calibrated yet, so no band is shown.
What counts as a claim ›How we measure confidence ›How we check this ›
Are you an author, or do you see a problem with this page? Request a review
