

The DOI matches its Crossref record; 13 of the 13 references it cites were found in a registry or an index.
Ancient genomes from northern China suggest links between subsistence changes and human migration
Abstract
Northern China harbored the world’s earliest complex societies based on millet farming, in two major centers in the Yellow (YR) and West Liao (WLR) River basins. Until now, their genetic histories have remained largely unknown. Here we present 55 ancient genomes dating to 7500-1700 BP from the YR, WLR, and Amur River (AR) regions. Contrary to the genetic stability in the AR, the YR and WLR genetic profiles substantially changed over time. The YR populations show a monotonic increase over time in their genetic affinity with present-day southern Chinese and Southeast Asians. In the WLR, intensification of farming in the Late Neolithic is correlated with increased YR affinity while the inclusion of a pastoral economy in the Bronze Age was correlated with increased AR affinity. Our results suggest a link between changes in subsistence strategy and human migration, and fuel the debate about archaeolinguistic signatures of past human migration.
Overview
The claims and statistics of this paper haven’t been checked yet.
Run the check — free, no account needed. It reads the open-access text and checks the sources it cites.
Integrity signals
Registry
Cites
Statistics
Figures
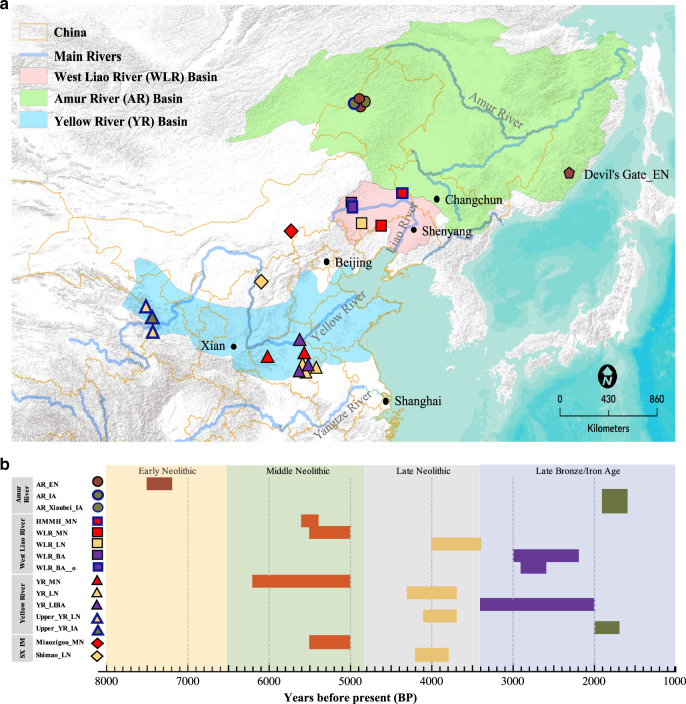
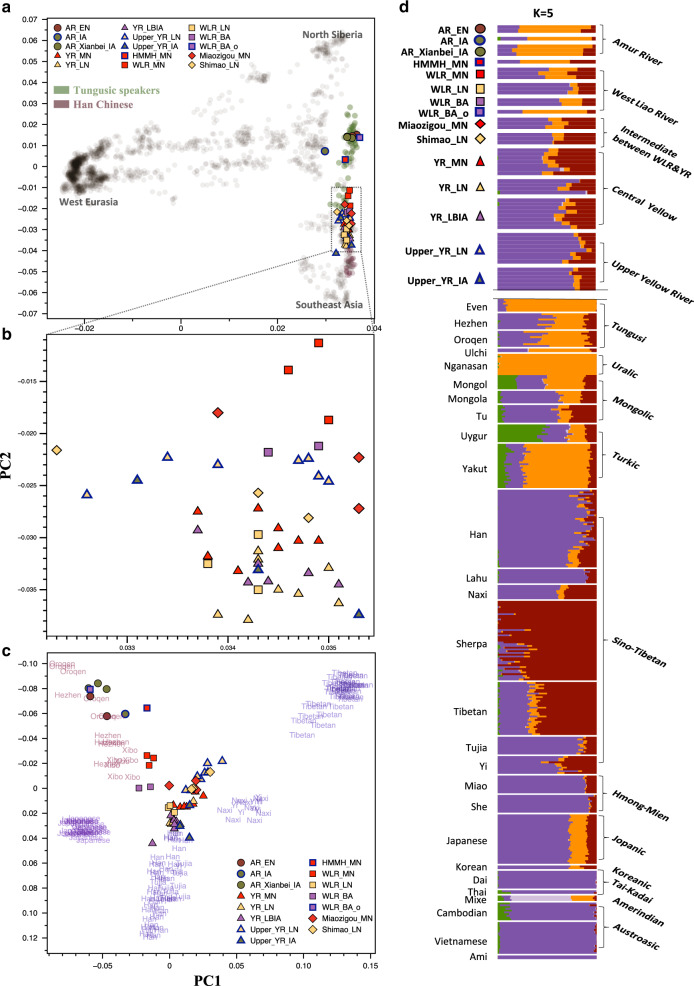
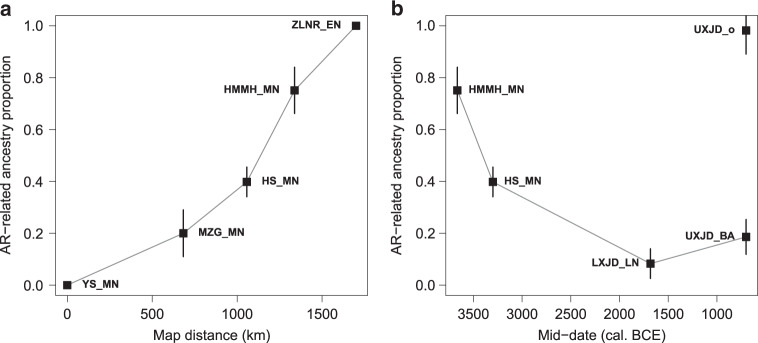
Verification
Claims the paper makes
The claims and statistics of this paper haven’t been checked yet.
Run the check — free, no account needed. It reads the open-access text and checks the sources it cites.
Claims other papers make about this one
Each is checked against this paper’s own text: does it say what the citing paper says it does?
In the citing paper
“During the Iron Age, a related lineage was identified in the Xianbei population of China (n=1) (Ning et al., 2020).”
From Y chromosome evidence confirms northeast Asian origin of Xinjiang Kazakhs and genetic influence from 18th century expansion of Kerey clan (2023) · cites this paper as Ning et al., 2020
Self-check
Percentages, sums and reported differences re-computed from the paper’s own numbers.
The self-check needs the paper’s full text.
Citations
Cites
Second-generation PLINK: rising to the challenge of larger and richer datasets
Chang, C. C., Chow, C. C., Tellier, L. C., Vattikuti, S., Purcell, S. M., & Lee, J. J. (2015) · Gigascience · doi:10.1186/s13742-015-0047-8 · Cited by 12,709
Population Structure and Eigenanalysis
Patterson, N., Price, A. L., & Reich, D. (2006) · PLoS Genetics · doi:10.1371/journal.pgen.0020190 · Cited by 5,280
ANGSD: Analysis of Next Generation Sequencing Data
Korneliussen, T. S., Albrechtsen, A., & Nielsen, R. (2014) · BMC Bioinformatics · doi:10.1186/s12859-014-0356-4 · Cited by 2,982
Ancient Admixture in Human History
Patterson, N., Moorjani, P., Luo, Y., Mallick, S., Rohland, N., Zhan, Y., Genschoreck, T., Webster, T., & Reich, D. (2012) · Genetics · doi:10.1534/genetics.112.145037 · Cited by 2,848
Massive migration from the steppe was a source for Indo-European languages in Europe
Haak, W., Lazaridis, I., Patterson, N., Rohland, N., Mallick, S., Llamas, B., Brandt, G., Nordenfelt, S., Harney, E., Stewardson, K., et al. (2015) · Nature · doi:10.1038/nature14317 · Cited by 1,940
Self-citationmapDamage2.0: fast approximate Bayesian estimates of ancient DNA damage parameters
Jónsson, H., Ginolhac, A., Schubert, M., Johnson, P. L. F., & Orlando, L. (2013) · Bioinformatics · doi:10.1093/bioinformatics/btt193 · Cited by 1,669
The Simons Genome Diversity Project: 300 genomes from 142 diverse populations
Mallick, S., Li, H., Lipson, M., Mathieson, I., Gymrek, M., Racimo, F., Zhao, M., Chennagiri, N., Nordenfelt, S., Tandon, A., et al. (2016) · Nature · doi:10.1038/nature18964 · Cited by 1,584
Self-citationGenome-wide patterns of selection in 230 ancient Eurasians
Mathieson, I., Lazaridis, I., Rohland, N., Mallick, S., Patterson, N., Roodenberg, S. A., Harney, E., Stewardson, K., Fernandes, D., Novak, M., et al. (2015) · Nature · doi:10.1038/nature16152 · Cited by 1,515
Self-citationDabney, J., Knapp, M., Glocke, I., Gansauge, M.-T., Weihmann, A., Nickel, B., Valdiosera, C., García, N., Pääbo, S., Arsuaga, J.-L., et al. (2013) · Proceedings of the National Academy of Sciences · doi:10.1073/pnas.1314445110 · Cited by 1,443
Upper Palaeolithic Siberian genome reveals dual ancestry of Native Americans
Raghavan, M., Skoglund, P., Graf, K. E., Metspalu, M., Albrechtsen, A., Moltke, I., Rasmussen, S., Stafford Jr, T. W., Orlando, L., Metspalu, E., et al. (2014) · Nature · doi:10.1038/nature12736 · Cited by 963
Research works printed but not linked: 44
- Zuo, X. et al. Dating rice remains through phytolith carbon-14 study reveals domestication at the beginning of the Holocene. Proc. Natl Acad. Sci. USA 114, 6486–6491 (2017). · DOI
- Stevens, C. J. & Fuller, D. Q. The spread of agriculture in eastern Asia: archaeological bases for hypothetical farmer/language dispersals. Lang. Dyn. Change 7, 152–186 (2017). · DOI
- Yang, X. et al. Early millet use in northern China. Proc. Natl Acad. Sci. USA 109, 3726–3730 (2012). · DOI
- Liu, X., Jones, M. K., Zhao, Z., Liu, G. & O’Connell, T. C. The earliest evidence of millet as a staple crop: new light on neolithic foodways in North China. Am. J. Phys. Anthropol. 149, 283–290 (2012). · DOI
- Zhao, Z. New archaeobotanic data for the study of the origins of agriculture in China. Curr. Anthropol. 52, S295–S306 (2011). · DOI
- Lu, H. et al. Earliest domestication of common millet (Panicum miliaceum) in East Asia extended to 10,000 years ago. Proc. Natl Acad. Sci. USA 106, 7367–7372 (2009). · DOI
- Diao, X. Production and genetic improvement of minor cereals in China. Crop J. 5, 103–114 (2017). · DOI
- Ma, Z., Yang, X., Zhang, C., Sun, Y. & Jia, X. Early millet use in West Liaohe area during early-middle Holocene. Sci. China Earth Sci. 59, 1554–1561 (2016). · DOI
- Jia, X. et al. Spatial and temporal variations in prehistoric human settlement and their influencing factors on the south bank of the Xar Moron River, Northeastern China. Front. Earth Sci. 11, 137–147 (2017). · DOI
- Peterson, C. E., Lu, X., Drennan, R. D. & Zhu, D. Hongshan chiefly communities in Neolithic northeastern China. Proc. Natl Acad. Sci. USA 107, 5756–5761 (2010). · DOI
- Hsu, C. China: A New Cultural History. (Columbia University Press, 2012).
- Zhang, H., Bevan, A. & Guo, D. The neolithic ceremonial complex at Niuheliang and Wider Hongshan Landscapes in Northeastern China. J. World Prehistory 26, 1–24 (2013). · DOI
- Zhang, M., Yan, S., Pan, W. & Jin, L. Phylogenetic evidence for Sino-Tibetan origin in northern China in the Late Neolithic. Nature 569, 112–115 (2019). · DOI
- Sagart, L. et al. Dated language phylogenies shed light on the ancestry of Sino-Tibetan. Proc. Natl Acad. Sci. 116, 10317–10322 (2019). · DOI
- Robbeets, M. & Bouckaert, R. Bayesian phylolinguistics reveals the internal structure of the Transeurasian family. J. Lang. Evol. 3, 145–162 (2018). · DOI
- Robbeets, M. The History of the debate. in Transeurasian Linguistics, Vol. 1, 225–229 (Routledge, London, 2017).
- Zhang, X., Liu, G., Wang, M. & Lv, P. Stable istopic analysis of human remains from Xinglonggou site (In Chinese). Nanfang Wenwu 4, 185–195 (2017).
- Cheung, C., Zhang, H., Hepburn, J. C., Yang, D. Y. & Richards, M. P. Stable isotope and dental caries data reveal abrupt changes in subsistence economy in ancient China in response to global climate change. PLoS ONE 14, e0218943 (2019). · DOI
- Jia, X. et al. The transition of human subsistence strategies in relation to climate change during the Bronze Age in the West Liao River Basin, Northeast China. Holocene 26, 781–789 (2016). · DOI
- Kuzmin, Y. V. The beginnings of prehistoric agriculture in the Russian Far East: Current evidence and concepts. Doc. Praehist. 40, 1–12 (2013). · DOI
- Black, L. People of the Amur and Maritime Regions. in Crossroads of Contenients: Cultures of Siberia and Alaska 24–31 (Smithsonian Institution Press, 1988).
- Jeong, C. et al. The genetic history of admixture across inner Eurasia. Nat. Ecol. Evol. 3, 966–976 (2019). · DOI · Paper page
- Jeong, C. et al. Bronze Age population dynamics and the rise of dairy pastoralism on the eastern Eurasian steppe. Proc. Natl Acad. Sci. USA 115, E11248–E11255 (2018). · DOI · Paper page
- Jeong, C. et al. Admixture facilitates genetic adaptations to high altitude in Tibet. Nat. Commun. 5, 3281 (2014). · DOI
- Li, J. Z. et al. Worldwide human relationships inferred from genome-wide patterns of variation. Science 319, 1100–1104 (2008). · DOI
- Wang, B. et al. On the origin of Tibetans and their genetic basis in adapting high-altitude environments. PLoS ONE 6, e17002 (2011). · DOI
- Kamberov, Y. G. et al. Modeling recent human evolution in mice by expression of a selected EDAR variant. Cell 152, 691–702 (2013). · DOI
- Yoshiura, K. et al. A SNP in the ABCC11 gene is the determinant of human earwax type. Nat. Genet. 38, 324–330 (2006). · DOI
- Kimura, R. et al. A common variation in EDAR is a genetic determinant of shovel-shaped incisors. Am. J. Hum. Genet. 85, 528–535 (2009). · DOI
- Alexander, D. H., Novembre, J. & Lange, K. Fast model-based estimation of ancestry in unrelated individuals. Genome Res. 19, 1655–1664 (2009). · DOI · Paper page
- Schraiber, J. G. Assessing the relationship of ancient and modern populations. Genetics 208, 383–398 (2018). · DOI
- Chen, F. H. et al. Agriculture facilitated permanent human occupation of the Tibetan Plateau after 3600 B.P. Science 347, 248–250 (2015). · DOI
- Jeong, C. et al. A longitudinal cline characterizes the genetic structure of human populations in the Tibetan plateau. PLoS ONE 12, e0175885 (2017). · DOI
- Robbeets, M. Proto-transeurasian: where and when? Man India 95, 921–946 (2017).
- Korlević, P. et al. Reducing microbial and human contamination in DNA extractions from ancient bones and teeth. BioTechniques 59, 87–93 (2015). · DOI · Paper page
- Schubert, M., Lindgreen, S. & Orlando, L. AdapterRemoval v2: rapid adapter trimming, identification, and read merging. BMC Res. Notes 9, 88 (2016). · DOI
- Li, H. & Durbin, R. Fast and accurate long-read alignment with Burrows–Wheeler transform. Bioinformatics 26, 589–595 (2010). · DOI · Paper page
- Peltzer, A. et al. EAGER: efficient ancient genome reconstruction. Genome Biol. 17, 60 (2016). · DOI · Paper page
- Jun, G., Wing, M. K., Abecasis, G. R. & Kang, H. M. An efficient and scalable analysis framework for variant extraction and refinement from population-scale DNA sequence data. Genome Res. 25, 918–925 (2015). · DOI · Paper page
- Kearse, M. et al. Geneious basic: an integrated and extendable desktop software platform for the organization and analysis of sequence data. Bioinforma. Oxf. Engl. 28, 1647–1649 (2012). · DOI
- Weissensteiner, H. et al. HaploGrep 2: mitochondrial haplogroup classification in the era of high-throughput sequencing. Nucleic Acids Res. 44, W58–W63 (2016). · DOI
- Lipatov, M., Sanjeev, K., Patro, R. & Veeramah, K. R. Maximum likelihood estimation of biological relatedness from low coverage sequencing data. Preprint at https://www.biorxiv.org/content/10.1101/023374v1 (2015). · DOI · Paper page
- Sikora, M. et al. The population history of northeastern Siberia since the Pleistocene. Nature 570, 182–188 (2019). · DOI · Paper page
- Siska, V. et al. Genome-wide data from two early Neolithic East Asian individuals dating to 7700 years ago. Sci. Adv. 3, e1601877 (2017). · DOI · Paper page
Cited by
Philippine Ayta possess the highest level of Denisovan ancestry in the world
Larena, M., McKenna, J., Sanchez-Quinto, F., Bernhardsson, C., Ebeo, C., Reyes, R., Casel, O., Huang, J.-Y., Hagada, K. P., Guilay, D., et al. (2021) · Current Biology · doi:10.1016/j.cub.2021.07.022 · Cited by 93
Wang, M., Sun, Q., Feng, Y., Wei, L.-H., Liu, K., Luo, L., Huang, Y., Zhou, K., Yuan, H., Lv, H., et al. (2025) · Journal of Genetics and Genomics · doi:10.1016/j.jgg.2024.11.012 · Cited by 19
Self-citationWang, B., Liang, J., Allen, E., Chang, X., Jiang, Z., Yu, Y., Shi, M., & Wen, S. (2023) · Frontiers in Ecology and Evolution · doi:10.3389/fevo.2023.1264718 · Cited by 1
Metadata
- Authors
- Ning, C., Li, T., Wang, K., Zhang, F., Li, T., Wu, X., Gao, S., Zhang, Q., Zhang, H., Hudson, M. J., Dong, G., Wu, S., Fang, Y., Liu, C., Feng, C., Li, W., Han, T., Li, R., Wei, J., Zhu, Y., Zhou, Y., Wang, C.-C., Fan, S., Xiong, Z., Sun, Z., Ye, M., Sun, L., Wu, X., Liang, F., Cao, Y., Wei, X., Zhu, H., Zhou, H., Krause, J., Robbeets, M., Jeong, C., & Cui, Y.
- Venue
- Nature Communications
- Published
- 2020-06-01
- Volume
- 11
- Issue
- 1
- ISSN
- 2041-1723
- PMC
- PMC7264253
- Cited by
- 305
- References
- 13
- Language
- en
About these checks
Registry, retraction, Cites and statistics results are computed, not judged, with one exception: a printed reference that no index lists is read once by a model before it counts as a citation error. Claims are extracted by a model and kept only when their quote appears verbatim in the text; each cited source is then checked, with a model’s help, for whether it says what the claim relies on. Those verdicts can be wrong — read the claim’s quote and the cited source before relying on one.
Statistics and arithmetic are recomputed, not judged.
Confidence bands are shown only for fields calibrated on our annotated test set. None is calibrated yet, so no band is shown.
What counts as a claim ›How we measure confidence ›How we check this ›
Are you an author, or do you see a problem with this page? Request a review
