Cited by 62

The DOI matches its Crossref record; 12 of the 12 references it cites were found in a registry or an index.

UBE4B, a microRNA-9 target gene, promotes autophagy-mediated Tau degradation

Subramanian, Manivannan, Hyeon, Seung Jae, Das, Tanuza, Suh, Yoon Seok, Kim, Yun Kyung, Lee, Jeong-Soo, Song, Eun Joo, Ryu, Hoon, Yu, Kweon·2021·Nature Communications

Abstract

The formation of hyperphosphorylated intracellular Tau tangles in the brain is a hallmark of Alzheimer’s disease (AD). Tau hyperphosphorylation destabilizes microtubules, promoting neurodegeneration in AD patients. To identify suppressors of tau -mediated AD, we perform a screen using a microRNA (miR) library in Drosophila and identify the miR-9 family as suppressors of human tau overexpression phenotypes. CG11070 , a miR-9a target gene, and its mammalian orthologue UBE4B , an E3/E4 ubiquitin ligase, alleviate eye neurodegeneration, synaptic bouton defects, and crawling phenotypes in Drosophila human tau overexpression models. Total and phosphorylated Tau levels also decrease upon CG11070 or UBE4B overexpression. In mammalian neuroblastoma cells, overexpression of UBE4B and STUB1 , which encodes the E3 ligase CHIP, increases the ubiquitination and degradation of Tau. In the Tau-BiFC mouse model, UBE4B and STUB 1 overexpression also increase oligomeric Tau degradation. Inhibitor assays of the autophagy and proteasome systems reveal that the autophagy-lysosome system is the major pathway for Tau degradation in this context. These results demonstrate that UBE4B, a miR-9 target gene, promotes autophagy-mediated Tau degradation together with STUB1, and is thus an innovative therapeutic approach for AD.

Overview

The claims and statistics of this paper haven’t been checked yet.

Run the check — free, no account needed. It reads the open-access text and checks the sources it cites.

A few free checks a day · papers already verified open instantly · results are public

Integrity signals

Registry

Crossref · 10.1038/s41467-021-23597-9

Cites

12 of 12 references verified0 citation errors · 0 not checkable

Statistics

Figures

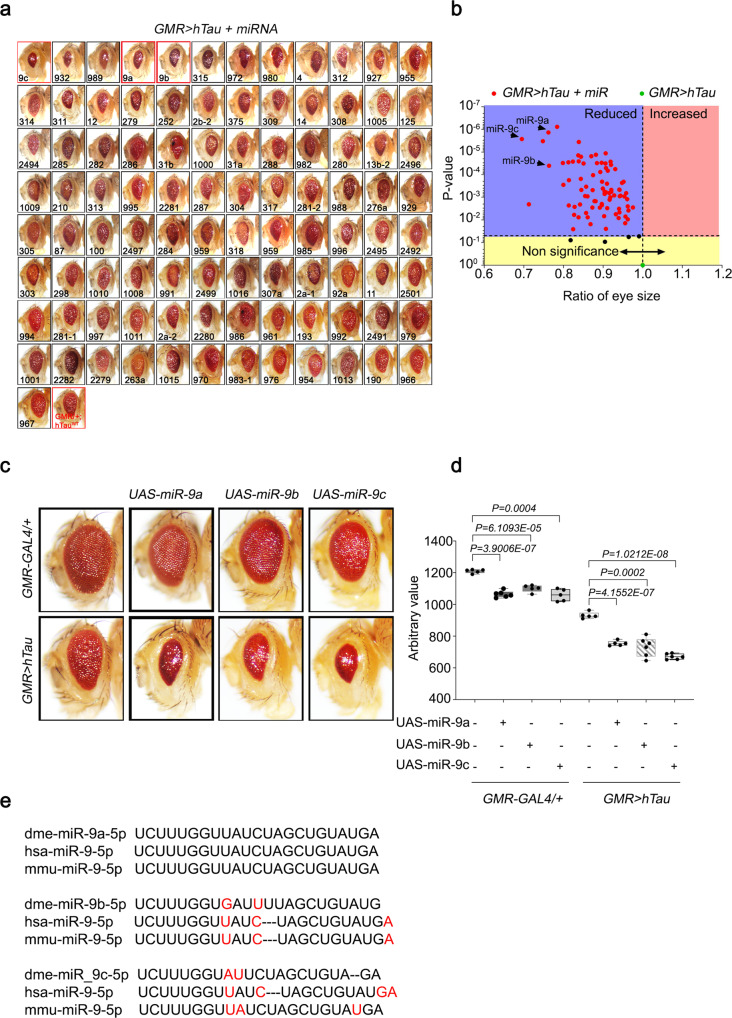
Fig. 1 Genome-wide Drosophila miRNA library screening identified miR-9 family miRNAs as modifiers of hTau in Drosophila eyes. a Screening of the miRNA library in GMR > hTau Drosophila eyes revealed significant phenotypic enhancement, as indicated by decreased eye size, in flies overexpressing miR-9 family miRNAs compared with GMR > hTau control flies. Eye sizes were arranged from smallest to largest. b Volcano plot of mean eye sizes in flies expressing various miRNAs in the GMR > hTau background versus their respective p-values derived from a one-way analysis of variance followed by pairwise t-tests and a Bonferroni correction for multiple comparisons. All points above the dotted line can be considered significant. This analysis identified that flies overexpressing miR-9 family miRNAs exhibited a severe Tau toxicity phenotype, as indicated by decreased eye size. N = 3 biologically independent experiments. c, d The overexpression of miR-9a, miR-9b, or miR-9c in GMR > hTau Drosophila eyes significantly reduced eye sizes relative to GMR > hTau Drosophila. N = 5 biologically independent experiments. Data are presented as the mean ± s.e.m. Statistical significance was determined with a two-tailed Student’s t-test. In the box plots the whiskers represent the 5th to 95th percentile range. e Alignment of mature Drosophila miR-9a, miR-9b, and miR-9c sequences with human and murine miR-9 sequences identified that miR-9a had 100% identity with mammalian miR-9 sequences. Statistical source data.
Fig. 1 Genome-wide Drosophila miRNA library screening identified miR-9 family miRNAs as modifiers of hTau in Drosophila eyes. a Screening of the miRNA library in GMR > hTau Drosophila eyes revealed significant phenotypic enhancement, as indicated by decreased eye size, in flies overexpressing miR-9 family miRNAs compared with GMR > hTau control flies. Eye sizes were arranged from smallest to largest. b Volcano plot of mean eye sizes in flies expressing various miRNAs in the GMR > hTau background versus their respective p-values derived from a one-way analysis of variance followed by pairwise t-tests and a Bonferroni correction for multiple comparisons. All points above the dotted line can be considered significant. This analysis identified that flies overexpressing miR-9 family miRNAs exhibited a severe Tau toxicity phenotype, as indicated by decreased eye size. N = 3 biologically independent experiments. c, d The overexpression of miR-9a, miR-9b, or miR-9c in GMR > hTau Drosophila eyes significantly reduced eye sizes relative to GMR > hTau Drosophila. N = 5 biologically independent experiments. Data are presented as the mean ± s.e.m. Statistical significance was determined with a two-tailed Student’s t-test. In the box plots the whiskers represent the 5th to 95th percentile range. e Alignment of mature Drosophila miR-9a, miR-9b, and miR-9c sequences with human and murine miR-9 sequences identified that miR-9a had 100% identity with mammalian miR-9 sequences. Statistical source data.CC BY · PubMed Central
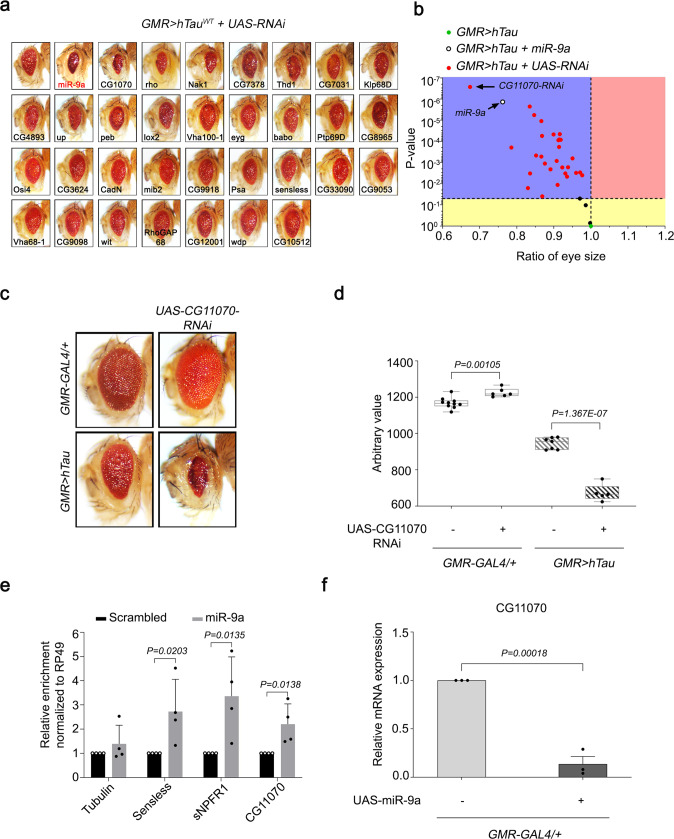
Fig. 2 CG11070, a miR-9a target identified from secondary screening, strongly modulated hTau in Drosophila eyes. a Screening of flies with RNAi knockdown of miR-9a targets in GMR > hTau Drosophila eyes identified a significant reduction in eye size in CG11070-RNAi flies relative to the control. b Volcano plot of mean eye sizes of flies expressing various miR-9a target gene RNAis in GMR > hTau flies versus their respective p-values derived from a one-way analysis of variance followed by pairwise t-tests and a Bonferroni correction for multiple comparisons. All points above the dotted line can be considered significant. CG11070-RNAi flies exhibited more severe ocular Tau toxicity, as demonstrated by decreased eye size. N = 3 biologically independent experiments. c, d The knockdown of CG11070 (CG11070-RNAi) in GMR > hTau flies significantly decreased eye size relative to GMR > hTau controls. N = 5 biologically independent experiments. In the box plots the whiskers represent the 5th to 95th percentile range. Data are presented as the mean ± s.e.m. Statistical significance was determined with a two-tailed Student’s t-test. e miRNA–mRNA–RISC pull-down assays in Drosophila S2 cells revealed that miR-9a bound to CG11070 mRNA. Transfection of miR-9a enriched CG11070 mRNA levels, similar to the known miR-9a targets senseless and sNPFR1, as demonstrated by qRT-PCR. N = 4 biologically independent experiments. Data are presented as the mean ± s.e.m. Statistical significance was determined with a two-tailed Student’s t-test. f Expression of miR-9a using GMR-GAL4 significantly decreased CG11070 expression. N = 3 biologically independent experiments. Data are presented as the mean ± s.e.m. Statistical significance was determined with a two-tailed Student’s t-test. Statistical source data.
Fig. 2 CG11070, a miR-9a target identified from secondary screening, strongly modulated hTau in Drosophila eyes. a Screening of flies with RNAi knockdown of miR-9a targets in GMR > hTau Drosophila eyes identified a significant reduction in eye size in CG11070-RNAi flies relative to the control. b Volcano plot of mean eye sizes of flies expressing various miR-9a target gene RNAis in GMR > hTau flies versus their respective p-values derived from a one-way analysis of variance followed by pairwise t-tests and a Bonferroni correction for multiple comparisons. All points above the dotted line can be considered significant. CG11070-RNAi flies exhibited more severe ocular Tau toxicity, as demonstrated by decreased eye size. N = 3 biologically independent experiments. c, d The knockdown of CG11070 (CG11070-RNAi) in GMR > hTau flies significantly decreased eye size relative to GMR > hTau controls. N = 5 biologically independent experiments. In the box plots the whiskers represent the 5th to 95th percentile range. Data are presented as the mean ± s.e.m. Statistical significance was determined with a two-tailed Student’s t-test. e miRNA–mRNA–RISC pull-down assays in Drosophila S2 cells revealed that miR-9a bound to CG11070 mRNA. Transfection of miR-9a enriched CG11070 mRNA levels, similar to the known miR-9a targets senseless and sNPFR1, as demonstrated by qRT-PCR. N = 4 biologically independent experiments. Data are presented as the mean ± s.e.m. Statistical significance was determined with a two-tailed Student’s t-test. f Expression of miR-9a using GMR-GAL4 significantly decreased CG11070 expression. N = 3 biologically independent experiments. Data are presented as the mean ± s.e.m. Statistical significance was determined with a two-tailed Student’s t-test. Statistical source data.CC BY · PubMed Central
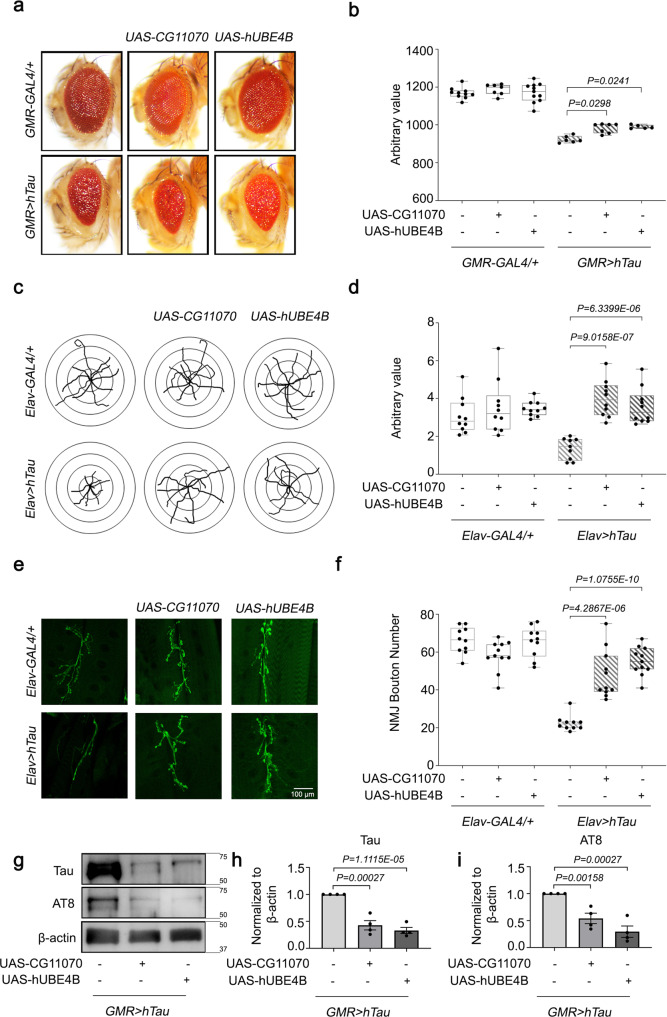
Fig. 3 The overexpression of Drosophila CG11070 and its mammalian orthologue UBE4B alleviated hTau phenotypes in Drosophila. a, b Eye-specific overexpression of Drosophila CG11070 or its mammalian orthologue UBE4B in GMR > hTau flies increased eye size relative to GMR > hTau controls. N = 5 biologically independent experiments. In the box plots the whiskers represent the 5th to 95th percentile range. c, d Neuronal overexpression of Drosophila CG11070 or its mammalian orthologue UBE4B using Elav-Gal4 in Elav > hTau flies significantly increased larval crawling. N = 10 biologically independent experiments. In the box plots the whiskers represent the 5th to 95th percentile range. e, f Neuronal overexpression of Drosophila CG11070 or its mammalian orthologue UBE4B using Elav-Gal4 in Elav > hTau flies significantly increased synaptic bouton numbers relative to Elav > hTau controls. Scale bar 100 µm. N = 10 biologically independent experiments. In the box plots the whiskers represent the 5th to 95th percentile range. g–i Western blotting revealed that ocular overexpression of Drosophila CG11070 or its mammalian orthologue UBE4B in GMR > hTau flies significantly reduced total and phosphorylated Tau protein levels relative to GMR > hTau controls. N = 4 biologically independent experiments. Data are presented as the mean ± s.e.m. Statistical significance was determined with a two-tailed Student’s t-test. Statistical source data.
Fig. 3 The overexpression of Drosophila CG11070 and its mammalian orthologue UBE4B alleviated hTau phenotypes in Drosophila. a, b Eye-specific overexpression of Drosophila CG11070 or its mammalian orthologue UBE4B in GMR > hTau flies increased eye size relative to GMR > hTau controls. N = 5 biologically independent experiments. In the box plots the whiskers represent the 5th to 95th percentile range. c, d Neuronal overexpression of Drosophila CG11070 or its mammalian orthologue UBE4B using Elav-Gal4 in Elav > hTau flies significantly increased larval crawling. N = 10 biologically independent experiments. In the box plots the whiskers represent the 5th to 95th percentile range. e, f Neuronal overexpression of Drosophila CG11070 or its mammalian orthologue UBE4B using Elav-Gal4 in Elav > hTau flies significantly increased synaptic bouton numbers relative to Elav > hTau controls. Scale bar 100 µm. N = 10 biologically independent experiments. In the box plots the whiskers represent the 5th to 95th percentile range. g–i Western blotting revealed that ocular overexpression of Drosophila CG11070 or its mammalian orthologue UBE4B in GMR > hTau flies significantly reduced total and phosphorylated Tau protein levels relative to GMR > hTau controls. N = 4 biologically independent experiments. Data are presented as the mean ± s.e.m. Statistical significance was determined with a two-tailed Student’s t-test. Statistical source data.CC BY · PubMed Central
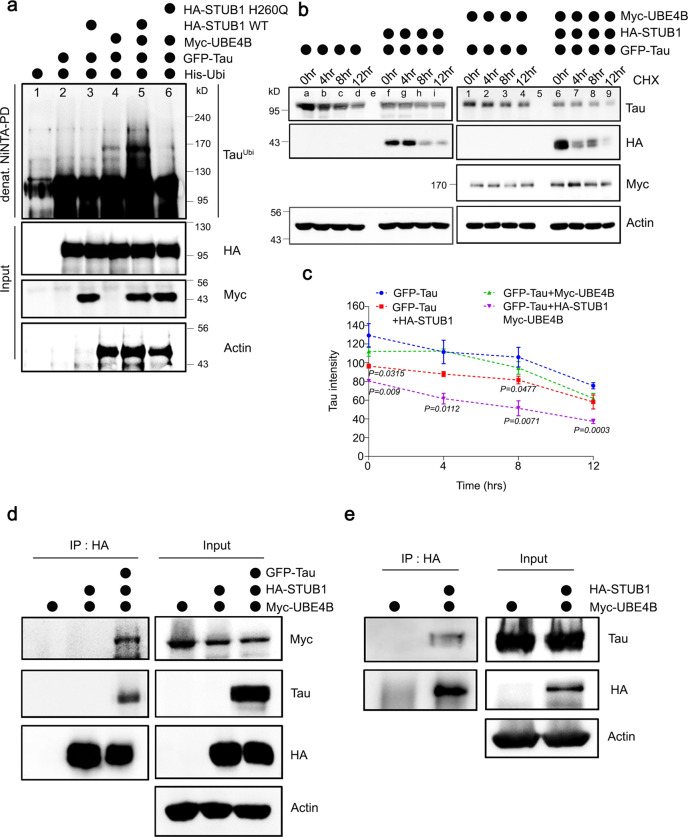
Fig. 4 Tau was ubiquitinated and degraded by UBE4B and STUB1 in mammalian neuroblastoma cells. a Tau was co-expressed with His-Ubiquitin, UBE4B, and STUB1 WT or dominant-negative mutant STUB1H260Q in SH-SY5Y neuroblastoma cells. Ubiquitinated Tau was significantly increased by co-expression of UBE4B and STUB1 (lane 5), but not by expression of UBE4B (lane 4) or STUB1 (lane 3) alone. Tau ubiquitination by co-expression of UBE4B and STUB1 required the ligase activity of STUB1 (lanes 5 and 6). b, c Tau protein degradation was enhanced by co-expression of UBE4B and STUB1 (lane 6–9) compared with expression of UBE4B (lane 1–4) or STUB1 (lane f–i) alone. Quantification of Tau levels was normalized to the amount of β-actin protein in each case. Data represent the mean ± s.e.m of three independent experiments (*P < 0.05, **P < 0.005, ***P < 0.001 two-tailed Student’s t-test). d UBE4B was co-expressed with HA-STUB1 and Tau in SH-SY5Y cells and immunoprecipitated on anti-HA-agarose beads. UBE4B did not directly interact with STUB1 in the absence of Tau, but indirectly interacted with STUB1 in the presence of Tau. e HA-UBE4B was co-expressed with Tau in SH-SY5Y cells and immunoprecipitated on anti-HA-agarose beads. Co-precipitated Tau was detected by Western blot, revealing that Tau directly interacted with UBE4B. All western blots were performed more than three times. Statistical source data.
Fig. 4 Tau was ubiquitinated and degraded by UBE4B and STUB1 in mammalian neuroblastoma cells. a Tau was co-expressed with His-Ubiquitin, UBE4B, and STUB1 WT or dominant-negative mutant STUB1H260Q in SH-SY5Y neuroblastoma cells. Ubiquitinated Tau was significantly increased by co-expression of UBE4B and STUB1 (lane 5), but not by expression of UBE4B (lane 4) or STUB1 (lane 3) alone. Tau ubiquitination by co-expression of UBE4B and STUB1 required the ligase activity of STUB1 (lanes 5 and 6). b, c Tau protein degradation was enhanced by co-expression of UBE4B and STUB1 (lane 6–9) compared with expression of UBE4B (lane 1–4) or STUB1 (lane f–i) alone. Quantification of Tau levels was normalized to the amount of β-actin protein in each case. Data represent the mean ± s.e.m of three independent experiments (*P < 0.05, **P < 0.005, ***P < 0.001 two-tailed Student’s t-test). d UBE4B was co-expressed with HA-STUB1 and Tau in SH-SY5Y cells and immunoprecipitated on anti-HA-agarose beads. UBE4B did not directly interact with STUB1 in the absence of Tau, but indirectly interacted with STUB1 in the presence of Tau. e HA-UBE4B was co-expressed with Tau in SH-SY5Y cells and immunoprecipitated on anti-HA-agarose beads. Co-precipitated Tau was detected by Western blot, revealing that Tau directly interacted with UBE4B. All western blots were performed more than three times. Statistical source data.CC BY · PubMed Central
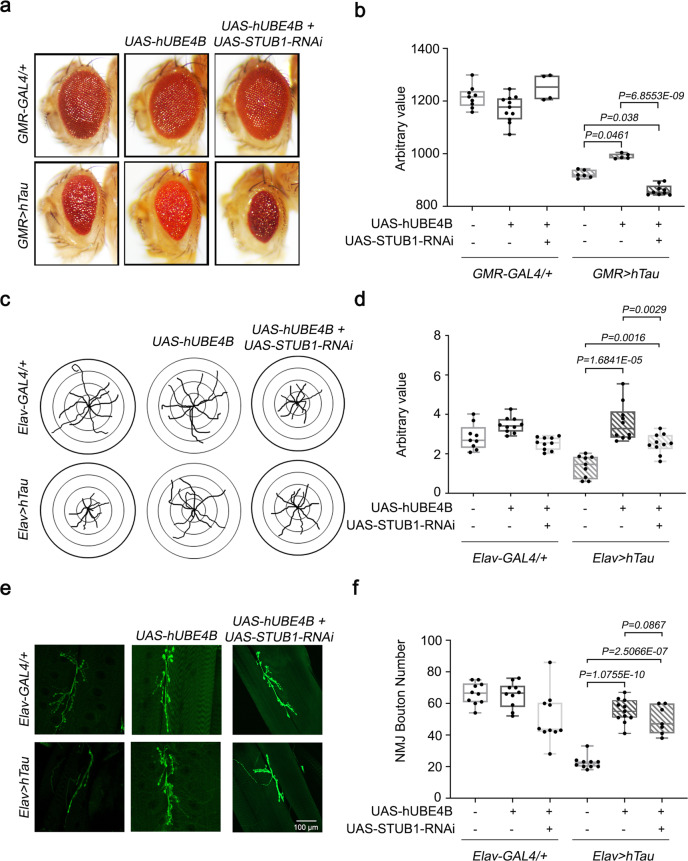
Fig. 5 STUB1 knockdown reduces UBE4B-mediated alleviated hTau phenotypes in Drosophila. a, b Eye-specific knockdown of Drosophila STUB1 significantly reduced eye size relative to GMR > hTau + hUBE4B flies. N = 5 biologically independent experiments. In the box plots the whiskers represent the 5th to 95th percentile range. c, d Neuronal knockdown of Drosophila STUB1 using Elav-Gal4 in Elav > hTau + hUBE4B flies significantly reduced larval crawling. N = 10 biologically independent experiments. In the box plots the whiskers represent the 5th to 95th percentile range. e, f Neuronal knock down of Drosophila STUB1 using Elav-Gal4 in Elav > hTau + hUBE4B flies significantly reduced synaptic bouton numbers relative to Elav > hTau controls. Scale bar 100 µm. N = 10 biologically independent experiments. In the box plots the whiskers represent the 5th to 95th percentile range. Data are presented as the mean ± s.e.m. Statistical significance was determined with two-tailed Student’s t-test. Statistical source data.
Fig. 5 STUB1 knockdown reduces UBE4B-mediated alleviated hTau phenotypes in Drosophila. a, b Eye-specific knockdown of Drosophila STUB1 significantly reduced eye size relative to GMR > hTau + hUBE4B flies. N = 5 biologically independent experiments. In the box plots the whiskers represent the 5th to 95th percentile range. c, d Neuronal knockdown of Drosophila STUB1 using Elav-Gal4 in Elav > hTau + hUBE4B flies significantly reduced larval crawling. N = 10 biologically independent experiments. In the box plots the whiskers represent the 5th to 95th percentile range. e, f Neuronal knock down of Drosophila STUB1 using Elav-Gal4 in Elav > hTau + hUBE4B flies significantly reduced synaptic bouton numbers relative to Elav > hTau controls. Scale bar 100 µm. N = 10 biologically independent experiments. In the box plots the whiskers represent the 5th to 95th percentile range. Data are presented as the mean ± s.e.m. Statistical significance was determined with two-tailed Student’s t-test. Statistical source data.CC BY · PubMed Central
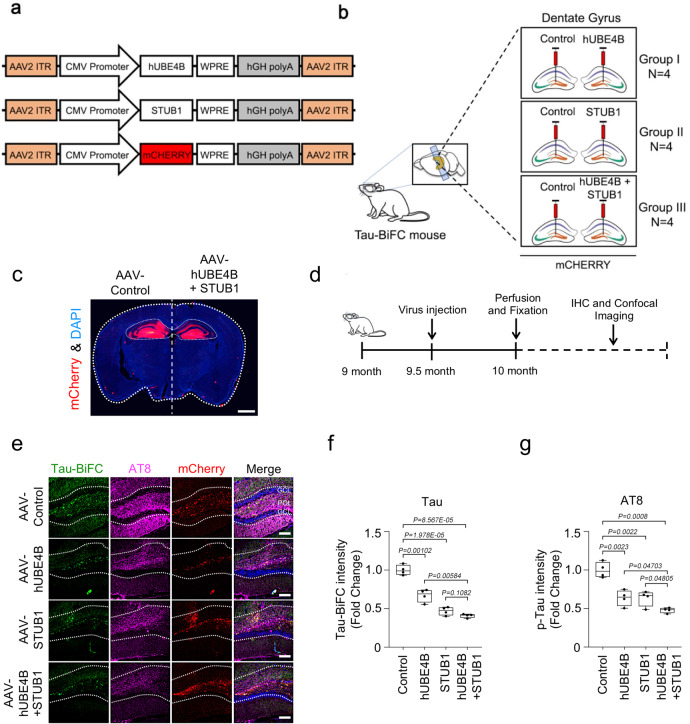
Fig. 6 Tau oligomers were degraded by UBE4B and STUB1 in the Tau-BiFC mouse model. a Schematic representation of AAV-CMV-mCherry and AAV-UBE4B-mCherry virus constructs. b Schematic illustration of AAV-CMV-mCherry or AAV-UBE4B-mCherry virus delivery into the dentate gyrus of Tau-BiFC mice. c A fluorescence staining image indicating the foci (red) of AAV-CMV-mCherry or AAV-UBE4B + STUB1-mCherry virus delivery in the dentate gyrus and hippocampus of Tau-BiFC mice. Scale bar (white), 1 mm. d Schematic illustration of the work flow for virus injection and pathological examination in Tau-BiFC mice. e AAV-UBE4B and AAV-STUB1 decreased oligomer Tau-BiFC and pTau (S202/T205) levels in the dentate gyrus compared with the control. GCL, granular cell layer; POL, polymorphic layer. Scale bars (white), 80 μm. These experiments were performed four times. f, g Densitometry analysis revealed that AAV-UBE4B and STUB1 significantly decreased both Tau-BiFC and pTau (S202/T205) levels in the dentate gyrus relative to the control (AAV-Cont N = 4; AAV-UBE4B N = 4; AAV-STUB1 N = 4; AAV-UBE4B + AAV-STUB1, N = 4; N = 4 biologically independent animals), respectively. In the box plots the whiskers represent the 5th to 95th percentile range. Data are presented as means as ± s.e.m. Statistical significance was determined with two-tailed Student’s t-test. Statistical source data.
Fig. 6 Tau oligomers were degraded by UBE4B and STUB1 in the Tau-BiFC mouse model. a Schematic representation of AAV-CMV-mCherry and AAV-UBE4B-mCherry virus constructs. b Schematic illustration of AAV-CMV-mCherry or AAV-UBE4B-mCherry virus delivery into the dentate gyrus of Tau-BiFC mice. c A fluorescence staining image indicating the foci (red) of AAV-CMV-mCherry or AAV-UBE4B + STUB1-mCherry virus delivery in the dentate gyrus and hippocampus of Tau-BiFC mice. Scale bar (white), 1 mm. d Schematic illustration of the work flow for virus injection and pathological examination in Tau-BiFC mice. e AAV-UBE4B and AAV-STUB1 decreased oligomer Tau-BiFC and pTau (S202/T205) levels in the dentate gyrus compared with the control. GCL, granular cell layer; POL, polymorphic layer. Scale bars (white), 80 μm. These experiments were performed four times. f, g Densitometry analysis revealed that AAV-UBE4B and STUB1 significantly decreased both Tau-BiFC and pTau (S202/T205) levels in the dentate gyrus relative to the control (AAV-Cont N = 4; AAV-UBE4B N = 4; AAV-STUB1 N = 4; AAV-UBE4B + AAV-STUB1, N = 4; N = 4 biologically independent animals), respectively. In the box plots the whiskers represent the 5th to 95th percentile range. Data are presented as means as ± s.e.m. Statistical significance was determined with two-tailed Student’s t-test. Statistical source data.CC BY · PubMed Central
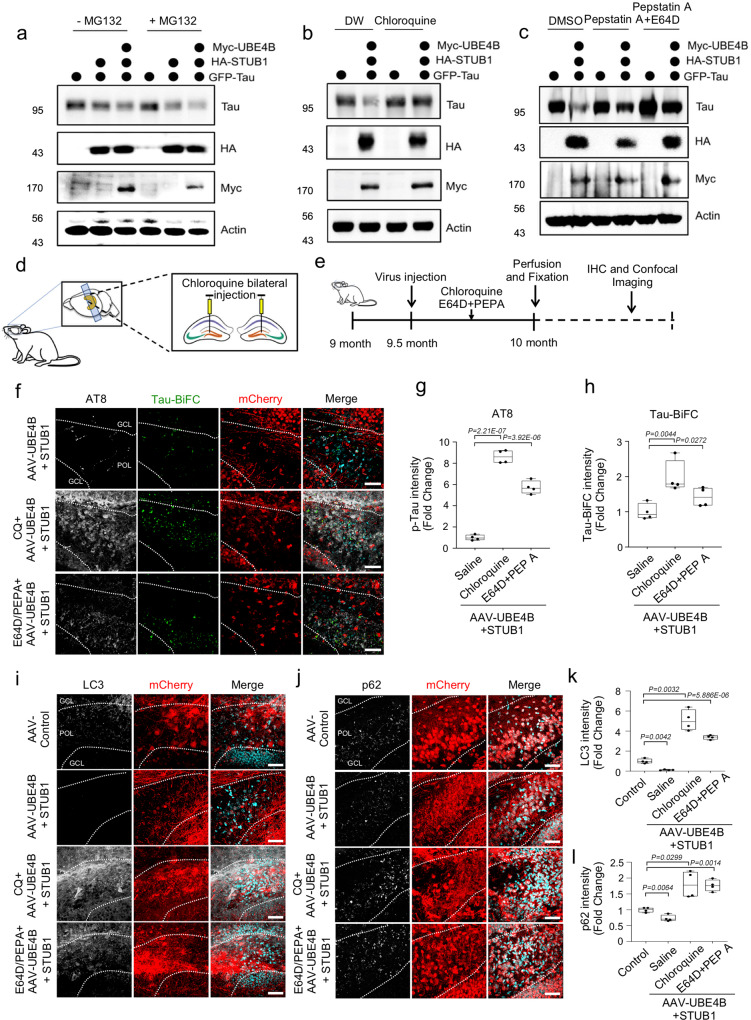
Fig. 7 Tau was degraded by UBE4B and STUB1 primarily via autophagy. a Treatment of SH-SY5Y cells with the proteasome inhibitor MG132 did not affect Tau degradation mediated by UBE4B/STUB1. b Treatment with chloroquine (CQ), an autophagy inhibitor, affected Tau degradation by UBE4B/STUB1. c Pepstatin A (PEPA) and E64D, autophagy inhibitors, inhibited Tau degradation by UBE4B/STUB1. All western blots were performed three times. d Schematic illustration of autophagy inhibitor injection to the dentate gyrus of Tau-BiFC mice. e Schematic illustration of the work flow for autophagy inhibitor injection and pathological examination in Tau-BiFC mice. f CQ and E64D plus PEPA (E64D + PEPA) increased pTau (S202/T205) levels in the dentate gyrus relative to saline-injected controls. GCL granular cell layer, POL polymorphic layer. g, h Densitometry analysis revealed that chloroquine and ED64 + PEPA significantly increased both pTau (S202/T205) and Tau-BiFC levels in the dentate gyrus relative to saline-injected controls (AAV-UBE4B + AAV-STUB1 (saline control), N = 4; CQ + AAV-UBE4B + AAV-STUB1, N = 4; E64D/PEPEA + AAV-UBE4B + AAV-STUB1, N = 4; N = 4 biologically independent animals). In the box plots the whiskers represent the 5th to 95th percentile range. i AAV-UBE4B and AAV-STUB1 decreased LC3 levels in the dentate gyrus relative to control. Scale bars (white): 40 μm. j AAV-UBE4B and AAV-STUB1 decreased p62 levels in the dentate gyrus relative to control. Scale bars (white): 40 μm. k Densitometry analysis revealed that autophagy inhibitors significantly increased LC3 levels in the dentate gyrus relative to control (AAV-Control, N = 4; AAV-UBE4B + AAV-STUB1, N = 4; CQ + AAV-UBE4B + AAV-STUB1, N = 4; E64D/PEPA + AAV-UBE4B + AAV-STUB1, N = 4; N = 4 biologically independent animals). In the box plots the whiskers represent the 5th to 95th percentile range. l Densitometry analysis revealed that autophagy inhibitors significantly increased p62 levels in the dentate gyrus relative to control (AAV-Control, N = 4; AAV-UBE4B + AAV-STUB1, N = 4; CQ + AAV-UBE4B + AAV-STUB1, N = 4; E64D/PEPA + AAV-UBE4B + AAV-STUB1, N = 4; N = 4 biologically independent animals). In the box plots the whiskers represent the 5th to 95th percentile range. Data are presented as means ± s.e.m. Statistical significance was determined with a two-tailed Student’s t-test. Statistical source data. Each exact p value was listed in Statistical source data.
Fig. 7 Tau was degraded by UBE4B and STUB1 primarily via autophagy. a Treatment of SH-SY5Y cells with the proteasome inhibitor MG132 did not affect Tau degradation mediated by UBE4B/STUB1. b Treatment with chloroquine (CQ), an autophagy inhibitor, affected Tau degradation by UBE4B/STUB1. c Pepstatin A (PEPA) and E64D, autophagy inhibitors, inhibited Tau degradation by UBE4B/STUB1. All western blots were performed three times. d Schematic illustration of autophagy inhibitor injection to the dentate gyrus of Tau-BiFC mice. e Schematic illustration of the work flow for autophagy inhibitor injection and pathological examination in Tau-BiFC mice. f CQ and E64D plus PEPA (E64D + PEPA) increased pTau (S202/T205) levels in the dentate gyrus relative to saline-injected controls. GCL granular cell layer, POL polymorphic layer. g, h Densitometry analysis revealed that chloroquine and ED64 + PEPA significantly increased both pTau (S202/T205) and Tau-BiFC levels in the dentate gyrus relative to saline-injected controls (AAV-UBE4B + AAV-STUB1 (saline control), N = 4; CQ + AAV-UBE4B + AAV-STUB1, N = 4; E64D/PEPEA + AAV-UBE4B + AAV-STUB1, N = 4; N = 4 biologically independent animals). In the box plots the whiskers represent the 5th to 95th percentile range. i AAV-UBE4B and AAV-STUB1 decreased LC3 levels in the dentate gyrus relative to control. Scale bars (white): 40 μm. j AAV-UBE4B and AAV-STUB1 decreased p62 levels in the dentate gyrus relative to control. Scale bars (white): 40 μm. k Densitometry analysis revealed that autophagy inhibitors significantly increased LC3 levels in the dentate gyrus relative to control (AAV-Control, N = 4; AAV-UBE4B + AAV-STUB1, N = 4; CQ + AAV-UBE4B + AAV-STUB1, N = 4; E64D/PEPA + AAV-UBE4B + AAV-STUB1, N = 4; N = 4 biologically independent animals). In the box plots the whiskers represent the 5th to 95th percentile range. l Densitometry analysis revealed that autophagy inhibitors significantly increased p62 levels in the dentate gyrus relative to control (AAV-Control, N = 4; AAV-UBE4B + AAV-STUB1, N = 4; CQ + AAV-UBE4B + AAV-STUB1, N = 4; E64D/PEPA + AAV-UBE4B + AAV-STUB1, N = 4; N = 4 biologically independent animals). In the box plots the whiskers represent the 5th to 95th percentile range. Data are presented as means ± s.e.m. Statistical significance was determined with a two-tailed Student’s t-test. Statistical source data. Each exact p value was listed in Statistical source data.CC BY · PubMed Central

Verification

Claims the paper makes

The claims and statistics of this paper haven’t been checked yet.

Run the check — free, no account needed. It reads the open-access text and checks the sources it cites.

A few free checks a day · papers already verified open instantly · results are public

Claims other papers make about this one

Each is checked against this paper’s own text: does it say what the citing paper says it does?

Self-check

Percentages, sums and reported differences re-computed from the paper’s own numbers.

The self-check needs the paper’s full text.

Citations

Cites

Show all 12 references

Research works printed but not linked: 54

  1. Haass, C. & Selkoe, D. J. Soluble protein oligomers in neurodegeneration: lessons from the Alzheimer’s amyloid beta-peptide. Nat. Rev. Mol. cell Biol. 8, 101–112 (2007). · DOI · Paper page
  2. Kadavath, H. et al. Tau stabilizes microtubules by binding at the interface between tubulin heterodimers. Proc. Natl Acad. Sci. USA 112, 7501–7506 (2015). · DOI · Paper page
  3. Sarkar, S. Neurofibrillary tangles mediated human neuronal tauopathies: insights from fly models. J. Genet. 97, 783–793 (2018). · DOI
  4. Sivanantharajah, L., Mudher, A. & Shepherd, D. An evaluation of Drosophila as a model system for studying tauopathies such as Alzheimer’s disease. J. Neurosci. Methods 319, 77–88 (2019). · DOI
  5. Kosmidis, S., Grammenoudi, S., Papanikolopoulou, K. & Skoulakis, E. M. Differential effects of Tau on the integrity and function of neurons essential for learning in Drosophila. J. Neurosci. 30, 464–477 (2010). · DOI
  6. Chanu, S. I. & Sarkar, S. Targeted downregulation of dMyc restricts neurofibrillary tangles mediated pathogenesis of human neuronal tauopathies in Drosophila. Biochimi biophys Acta Mol. Basis Dis. 1863, 2111–2119 (2017). · DOI
  7. Wittmann, C. W. et al. Tauopathy in Drosophila: neurodegeneration without neurofibrillary tangles. Science 293, 711–714 (2001). · DOI · Paper page
  8. Bartel, D. P. MicroRNAs: target recognition and regulatory functions. Cell 136, 215–233 (2009). · DOI · Paper page
  9. Brodersen, P. & Voinnet, O. Revisiting the principles of microRNA target recognition and mode of action. Nat. Rev. Mol. Cell Biol. 10, 141–148 (2009). · DOI
  10. Krutzfeldt, J. & Stoffel, M. MicroRNAs: a new class of regulatory genes affecting metabolism. Cell Metab. 4, 9–12 (2006). · DOI
  11. Lu, J. et al. MicroRNA expression profiles classify human cancers. Nature 435, 834–838 (2005). · DOI
  12. Schaefer, A. et al. Cerebellar neurodegeneration in the absence of microRNAs. J. Exp. Med. 204, 1553–1558 (2007). · DOI · Paper page
  13. Keller, J. N., Hanni, K. B. & Markesbery, W. R. Impaired proteasome function in Alzheimer’s disease. J. neurochem. 75, 436–439 (2000). · DOI · Paper page
  14. Myeku, N. et al. Tau-driven 26S proteasome impairment and cognitive dysfunction can be prevented early in disease by activating cAMP-PKA signaling. Nat. Med. 22, 46–53 https://doi.org/doi:10.1038/nm.4011 (2016). · DOI · Paper page
  15. Dolan, P. J. & Johnson, G. V. A caspase cleaved form of tau is preferentially degraded through the autophagy pathway. J. Biol. Chem. 285, 21978–21987 (2010). · DOI
  16. Suh, Y. S. et al. Genome-wide microRNA screening reveals that the evolutionary conserved miR-9a regulates body growth by targeting sNPFR1/NPYR. Nat. Commun. 6, 7693 (2015). · DOI
  17. Li, Y., Wang, F., Lee, J. A. & Gao, F. B. MicroRNA-9a ensures the precise specification of sensory organ precursors in Drosophila. Genes Dev. 20, 2793–2805 (2006). · DOI · Paper page
  18. Lee, B. I. et al. Photoexcited Porphyrins as a Strong Suppressor of beta-Amyloid Aggregation and Synaptic Toxicity. Angew. Chem. 54, 11472–11476 (2015). · DOI
  19. Lee, B. I., Suh, Y. S., Chung, Y. J., Yu, K. & Park, C. B. Shedding Light on Alzheimer’s beta-Amyloidosis: Photosensitized Methylene Blue Inhibits Self-Assembly of beta-Amyloid Peptides and Disintegrates Their Aggregates. Sci. Rep. 7, 7523 (2017). · DOI
  20. Hatakeyama, S. et al. U-box protein carboxyl terminus of Hsc70-interacting protein (CHIP) mediates poly-ubiquitylation preferentially on four-repeat Tau and is involved in neurodegeneration of tauopathy. J. neurochemistry 91, 299–307 (2004). · DOI
  21. Shimura, H., Schwartz, D., Gygi, S. P. & Kosik, K. S. CHIP-Hsc70 complex ubiquitinates phosphorylated tau and enhances cell survival. J. Biol. Chem. 279, 4869–4876 (2004). · DOI
  22. Shin, S. et al. Visualization of soluble tau oligomers in TauP301L-BiFC transgenic mice demonstrates the progression of tauopathy. Progress in neurobiology, 101782, https://doi.org/10.1016/j.pneurobio.2020.101782 (2020). · DOI
  23. Berger, Z. et al. Rapamycin alleviates toxicity of different aggregate-prone proteins. Hum. Mol. Genet. 15, 433–442 (2006). · DOI · Paper page
  24. Sarkar, S., Davies, J. E., Huang, Z., Tunnacliffe, A. & Rubinsztein, D. C. Trehalose, a novel mTOR-independent autophagy enhancer, accelerates the clearance of mutant huntingtin and alpha-synuclein. J. Biol. Chem. 282, 5641–5652 (2007). · DOI · Paper page
  25. Chen, X. et al. Promoting tau secretion and propagation by hyperactive p300/CBP via autophagy-lysosomal pathway in tauopathy. Mol. neurodegeneration 15, 2 (2020). · DOI · Paper page
  26. Wang, M., Qin, L. & Tang, B. MicroRNAs in Alzheimer’s Disease. Front. Genet. 10, 153 (2019). · DOI
  27. Absalon, S., Kochanek, D. M., Raghavan, V. & Krichevsky, A. M. MiR-26b, upregulated in Alzheimer’s disease, activates cell cycle entry, tau-phosphorylation, and apoptosis in postmitotic neurons. J. Neurosci.: Off. J. Soc. Neurosci. 33, 14645–14659 (2013). · DOI · Paper page
  28. Dickson, J. R., Kruse, C., Montagna, D. R., Finsen, B. & Wolfe, M. S. Alternative polyadenylation and miR-34 family members regulate tau expression. J. neurochemistry 127, 739–749 (2013). · DOI
  29. Ma, X., Liu, L. & Meng, J. MicroRNA-125b promotes neurons cell apoptosis and Tau phosphorylation in Alzheimer’s disease. Neurosci. Lett. 661, 57–62 (2017). · DOI
  30. Smith, P. Y. et al. miR-132/212 deficiency impairs tau metabolism and promotes pathological aggregation in vivo. Hum. Mol. Genet. 24, 6721–6735 (2015). · DOI · Paper page
  31. Wang, L. et al. Dihydrotanshinone I induced apoptosis and autophagy through caspase dependent pathway in colon cancer. Phytomedicine: Int. J. Phytother. phytopharmacology 22, 1079–1087 (2015). · DOI
  32. Zhao, Z. B. et al. MicroRNA-922 promotes tau phosphorylation by downregulating ubiquitin carboxy-terminal hydrolase L1 (UCHL1) expression in the pathogenesis of Alzheimer’s disease. Neuroscience 275, 232–237 (2014). · DOI
  33. Coolen, M., Katz, S. & Bally-Cuif, L. miR-9: a versatile regulator of neurogenesis. Front. Cell. Neurosci. 7, 220 (2013). · DOI · Paper page
  34. Delay, C., Mandemakers, W. & Hebert, S. S. MicroRNAs in Alzheimer’s disease. Neurobiol. Dis. 46, 285–290 (2012). · DOI · Paper page
  35. Kaneko, C. et al. Characterization of the mouse gene for the U-box-type ubiquitin ligase UFD2a. Biochemical biophysical Res. Commun. 300, 297–304 (2003). · DOI
  36. Morris, M. et al. Tau post-translational modifications in wild-type and human amyloid precursor protein transgenic mice. Nat. Neurosci. 18, 1183–1189 (2015). · DOI · Paper page
  37. Wu, H. et al. UBE4B promotes Hdm2-mediated degradation of the tumor suppressor p53. Nat. Med. 17, 347–355 (2011). · DOI
  38. Zeinab, R. A., Wu, H., Sergi, C. & Leng, R. UBE4B: a promising regulatory molecule in neuronal death and survival. Int. J. Mol. Sci. 13, 16865–16879 (2012). · DOI
  39. Matsumoto, M. et al. Molecular clearance of ataxin-3 is regulated by a mammalian E4. EMBO J. 23, 659–669 (2004). · DOI
  40. Babu, J. R., Geetha, T. & Wooten, M. W. Sequestosome 1/p62 shuttles polyubiquitinated tau for proteasomal degradation. J. neurochemistry 94, 192–203 (2005). · DOI · Paper page
  41. David, D. C. et al. Proteasomal degradation of tau protein. J. neurochemistry 83, 176–185 (2002). · DOI · Paper page
  42. Wong, E. S. et al. Autophagy-mediated clearance of aggresomes is not a universal phenomenon. Hum. Mol. Genet. 17, 2570–2582 (2008). · DOI
  43. Inoue, K. et al. Macroautophagy deficiency mediates age-dependent neurodegeneration through a phospho-tau pathway. Mol. neurodegeneration 7, 48 (2012). · DOI · Paper page
  44. Hamano, T. et al. Autophagic-lysosomal perturbation enhances tau aggregation in transfectants with induced wild-type tau expression. Eur. J. Neurosci. 27, 1119–1130 (2008). · DOI · Paper page
  45. Wang, Y. et al. Synergy and antagonism of macroautophagy and chaperone-mediated autophagy in a cell model of pathological tau aggregation. Autophagy 6, 182–183 (2010). · DOI · Paper page
  46. Kruger, U., Wang, Y., Kumar, S. & Mandelkow, E. M. Autophagic degradation of tau in primary neurons and its enhancement by trehalose. Neurobiol. aging 33, 2291–2305 (2012). · DOI · Paper page
  47. Rodriguez-Navarro, J. A. et al. Trehalose ameliorates dopaminergic and tau pathology in parkin deleted/tau overexpressing mice through autophagy activation. Neurobiol. Dis. 39, 423–438 (2010). · DOI · Paper page
  48. Tan, J. M. et al. Lysine 63-linked ubiquitination promotes the formation and autophagic clearance of protein inclusions associated with neurodegenerative diseases. Hum. Mol. Genet. 17, 431–439 (2008). · DOI
  49. Thrower, J. S., Hoffman, L., Rechsteiner, M. & Pickart, C. M. Recognition of the polyubiquitin proteolytic signal. EMBO J. 19, 94–102 (2000). · DOI
  50. Deng, Z. et al. Autophagy Receptors and Neurodegenerative Diseases. Trends cell Biol. 27, 491–504 (2017). · DOI
  51. Lippai, M. & Low, P. The role of the selective adaptor p62 and ubiquitin-like proteins in autophagy. BioMed. Res. Int. 2014, 832704 (2014). · DOI
  52. Mohanty, S. et al. The E3/E4 ubiquitin conjugation factor UBE4B interacts with and ubiquitinates the HTLV-1 Tax oncoprotein to promote NF-kappaB activation. PLoS Pathog. 16, e1008504 (2020). · DOI
  53. Tak, H. et al. Bimolecular fluorescence complementation; lighting-up tau-tau interaction in living cells. PloS one 8, e81682 (2013). · DOI
  54. Lee, J. et al. Remodeling of heterochromatin structure slows neuropathological progression and prolongs survival in an animal model of Huntington’s disease. Acta neuropathologica 134, 729–748 (2017). · DOI

Cited by

Sorted by citations

Metadata

Authors
Subramanian, M., Hyeon, S. J., Das, T., Suh, Y. S., Kim, Y. K., Lee, J.-S., Song, E. J., Ryu, H., & Yu, K.
Venue
Nature Communications
Published
2021-06-02
Volume
12
Issue
1
ISSN
2041-1723
Cited by
62
References
12
Language
en
Funders
  • Korea Research Institute of Bioscience and Biotechnology (KRIBB Research Initiative Program)
  • National Research Council of Science and Technology (CRC-15-04-KIST)
  • National Research Foundation of Korea (2015R1A5A1009024, 2019R1A2C2004149)

About these checks

Registry, retraction, Cites and statistics results are computed, not judged, with one exception: a printed reference that no index lists is read once by a model before it counts as a citation error. Claims are extracted by a model and kept only when their quote appears verbatim in the text; each cited source is then checked, with a model’s help, for whether it says what the claim relies on. Those verdicts can be wrong — read the claim’s quote and the cited source before relying on one.

Statistics and arithmetic are recomputed, not judged.

Confidence bands are shown only for fields calibrated on our annotated test set. None is calibrated yet, so no band is shown.

What counts as a claim ›How we measure confidence ›How we check this ›

Are you an author, or do you see a problem with this page? Request a review