

The DOI matches its Crossref record; 105 of the 105 references it cites were found in a registry or an index; 54 of the 64 sources its claims cite were checked for support.
Confronting false discoveries in single-cell differential expression
Open accessAbstract
Differential expression analysis in single-cell transcriptomics enables the dissection of cell-type-specific responses to perturbations such as disease, trauma, or experimental manipulation. While many statistical methods are available to identify differentially expressed genes, the principles that distinguish these methods and their performance remain unclear. Here, we show that the relative performance of these methods is contingent on their ability to account for variation between biological replicates. Methods that ignore this inevitable variation are biased and prone to false discoveries. Indeed, the most widely used methods can discover hundreds of differentially expressed genes in the absence of biological differences. Our results suggest an urgent need for a paradigm shift in the methods used to perform differential expression analysis in single-cell data.
Overview
AI snapshot
Written from the paper’s full text.
TL;DR
The paper benchmarks 14 differential expression methods on 18 ground-truth datasets and finds that pseudobulk methods, which aggregate cells within biological replicates, outperform single-cell methods. Methods that ignore between-replicate variation are biased toward highly expressed genes and can produce hundreds of false discoveries even without biological differences.
Key findings
- In 18 ground-truth datasets, all six top-performing DE methods aggregated cells within biological replicates to form pseudobulks; pseudobulk versus single-cell differences were highly significant and robust to concordance methodology.
- Single-cell DE methods were biased toward highly expressed genes: false positives were more highly expressed, abundant ERCC spike-ins were incorrectly called DE, and a compendium of 46 scRNA-seq datasets showed a systematic preference for highly expressed genes.
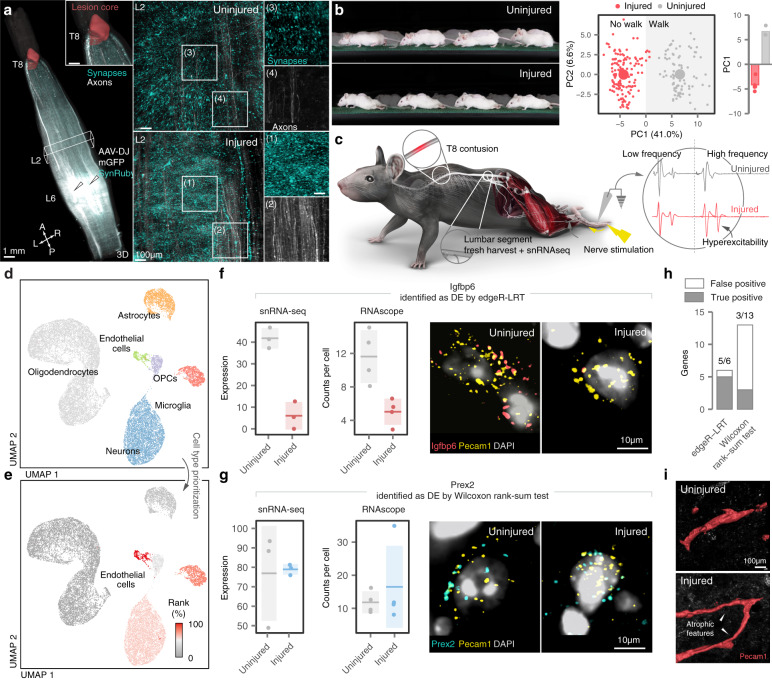
- Failing to account for biological replicates produced false discoveries: simulations identified hundreds of DE genes with no perturbation; random splits of unstimulated controls in 14 datasets produced excess false positives; spatial transcriptomics identified thousands of DE genes within each spinal cord region.
- In injured mouse spinal cord snRNA-seq (19,237 nuclei), RNAscope validated 5 of 6 genes called by edgeR-LRT versus 3 of 13 called by Wilcoxon rank-sum (p < 0.05, χ² test); GLMMs converged to pseudobulk performance in datasets of 500 or more cells and took an average of 13.5 h per cell type versus minutes for pseudobulk methods.
Methods
- Literature review of 500 recent scRNA-seq studies, of which 205 conducted DE analysis between biological conditions, identified 14 methods: 7 single-cell methods, 6 pseudobulk methods, and 1 linear mixed model.
- The study used 18 ground-truth datasets from four publications with matched bulk and scRNA-seq in the same purified cells, perturbations, and laboratories; concordance was measured by area under the concordance curve (AUCC) and rank correlation, with GO term enrichment, a 46-dataset scRNA-seq compendium, Splatter simulations, 14 control-group datasets, spatial transcriptomics, and spinal cord injury snRNA-seq plus RNAscope.
- Additional analyses disabled pseudobulk aggregation, created pseudo-replicates by shuffling replicates, compared variance between biological replicates and pseudo-replicates, and evaluated Poisson or negative binomial GLMMs.
Limitations
- The paper does not include a dedicated limitations section. It states that the enormous computational requirements of GLMMs prevented evaluation in the full ground-truth datasets, so downsampled datasets of 25–1,000 cells were used; the ground-truth resource was limited to 18 datasets from four publications.
- Evident from the text: simulations used parameters estimated from the Kang et al. dataset and may not capture all biological or technical heterogeneity; the in vivo RNAscope validation screened selected putatively DE genes rather than all DE genes; and human-versus-mouse variability conclusions rely on the assembled compendium datasets.
Model-written summary. Check it against the paper before relying on it.
Integrity signals
Registry
Cites
Statistics
Figures
Verification
Claims the paper makes
88 Own result · 47 Own interpretation · 14 Partly supported · 9 No basis given · 7 Supported · 5 Couldn’t confirm · 4 No full text of the sources · 3 Own method · 1 Mixed support · accuracy not yet measured
Some cited sources support this claim and some don’t — read each source’s verdict below.
In the paper
“Within our compendium, we identified a total of fourteen studies with control groups that included six or more samples5,6,15,49–59.”
§ Confronting false discoveries in single-cell differential expression > Methods > Analysis of published scRNA-seq control groups
What the sources say
- Supportedcites [5] source
The citation identifies a study eligible for the citing authors’ compendium, rather than attributing the tally of fourteen studies to Kang et al. In Methods > IFN-β stimulation and culture (page not provided), the paper reports eight untreated samples pooled as the control condition, meeting the six-sample threshold. (LLM, conf=0.92)
- Supportedcites [6] 2019, Single-cell transcriptomic analysis of Alzheimer’s disease, Nature source
The Methods section (‘Selection of individuals from the Religious Order Study (ROS) cohort’) says this study selected 24 no-pathology controls and 24 individuals with AD pathology. It therefore qualifies as a study with at least six control samples. The total of fourteen studies describes the citing authors’ compendium, not a finding attributed to this individual source. (LLM, conf=0.91)
- Supportedcites [15] source
The Results section (‘Lung aging atlas reveals deregulated transcriptional control’; page not provided) reports single-cell data from eight young mice and seven old mice. This supports citing the paper as one study with a control group of at least six samples; the total of fourteen studies is the citing authors’ count of their compendium, not a count attributed to this source alone. (LLM, conf=0.92)
- Supportedcites [49] 2020, Single-nucleus transcriptomics of the prefrontal cortex in major depressive disorder implicates oligodendrocyte precursor cells and excitatory neurons, Nat. Neu-rosci source
This paper is cited as one of the studies in the compendium, not as the source of the compendium-wide count. Its Table 1 reports 17 controls, exceeding the six-sample threshold. (LLM, conf=0.91)
- Supportedcites [50] source
The citation identifies this paper as one of the studies in the citing authors’ compendium with at least six control samples; the count of fourteen is the citing authors’ own tally. The Methods (Subjects and specimen collection) state that blood was collected from six asymptomatic control donors, and the Abstract likewise reports six healthy controls. (LLM, conf=0.92)
- Partly supportedcites [51] sourceExperimental — accuracy not yet measured
The Fig. 9 caption reports six Sham/Veh controls for behavioral tests, so this paper does contain a control group of six. But the Methods report only three Sham samples in the Drop-seq data and four per group selected for T4-treatment sequencing. The paper cannot establish the citing authors’ count of fourteen studies or show that this study had six control sequencing samples. (LLM, conf=0.84)
- Disputedcites [52] 2018, Single-cell RNA-seq uncovers a robust transcriptional response to morphine by glia, Cell Rep sourceExperimental — accuracy not yet measured
The cited paper is one study, so it cannot establish the compendium-wide total of fourteen. For its own control group, STAR⋆METHODS reports four mock-treatment biological replicates in the single-cell analysis, not six or more samples; its bulk RNA-seq analysis reports three mock-treatment replicates. (LLM, conf=0.86)
Checked by a reasoning model — may be wrong.
- Partly supportedcites [53] sourceExperimental — accuracy not yet measured
The study description (section labeled Abstract; page not provided) reports uninjured, intact-tail samples alongside amputated-tail samples, supporting its identification as a study with a control condition. It says there were at least two biological replicates per condition, but does not establish that the control group had six or more samples. The count of fourteen studies is the citing authors’ compendium count, not a finding attributed to this individual source. (LLM, conf=0.77)
- Supportedcites [54] 2019, Cell type-specific transcriptional programs in mouse prefrontal cortex during adolescence and addiction, Nat. Commun source
This citation identifies one study included in the citing authors’ compendium; it is not offered as evidence for the compendium-wide count of fourteen. The Methods (Animals; Tissue collection and library preparation, pages unavailable) report 12 mice in each saline and cocaine group, with two mice pooled per biological replicate, yielding six control replicates. (LLM, conf=0.91)
- Disputedcites [55] 2020, Single cell transcriptome profiling of the human alcohol-dependent brain, Hum. Mol. Genet sourceExperimental — accuracy not yet measured
The Results and Discussion section (page unavailable) says this study included four control donors, not six or more. The Conclusions section likewise describes seven donors in total: three with alcohol dependence and four controls. This source therefore cannot support its inclusion as a study meeting the stated control-group threshold; it does not address the compendium-wide count of fourteen. (LLM, conf=0.91)
Checked by a reasoning model — may be wrong.
plainn = 14- Asserted: passes — The authors put it forward as true.
- Checkable: passes — It can be checked against evidence.
- Load-bearing: passes — The paper’s conclusions depend on it.
- Based: passes — The paper gives a reason why it holds.
- Rests on an assumption: The 46 published scRNA-seq datasets in the compendium are representative of single-cell RNA-seq studies generally.
- Supported
Every source the paper cites for this claim was checked and supports it.
In the paper
“Moreover, comparisons to matching proteomics data 13 revealed that pseudobulk methods also more accurately predicted changes in protein abundance (Supplementary Fig. 1e-f ).”
What the sources say
- Supportedcites [13] 2018, Gene expression variability across cells and species shapes innate immunity, Nature source
Citation 13 is attached to the matching proteomics data, not to the pseudobulk-versus-single-cell comparison, which the citing authors report from their own Supplementary Fig. 1e–f. The source’s Methods (‘Cell state specific gene signatures’; page unavailable) describes matching its proteomics and RNA-seq data by gene name, supporting its identification as the data source. (LLM, conf=0.88)
plaincorrelational- Asserted: passes — The authors put it forward as true.
- Checkable: passes — It can be checked against evidence.
- Load-bearing: passes — The paper’s conclusions depend on it.
- Based: passes — The paper gives a reason why it holds.
- Supported
Every source the paper cites for this claim was checked and supports it.
In the paper
“Within the same experimental condition, replicates exhibit inherent differences in gene expression, which reflect both biological and technical factors 22 .”
What the sources say
- Supportedcites [22] source
The Discussion’s “Outlook” section describes biological and technical components of gene-expression variation among single-cell samples from the same biological condition. The Results section on batch effects also reports substantial variation between technical replicates from the same individual. Page numbers are not provided in our copy. (LLM, conf=0.89)
plaindirect- Asserted: passes — The authors put it forward as true.
- Checkable: passes — It can be checked against evidence.
- Load-bearing: passes — The paper’s conclusions depend on it.
- Based: passes — The paper gives a reason why it holds.
- Supported
Every source the paper cites for this claim was checked and supports it.
In the paper
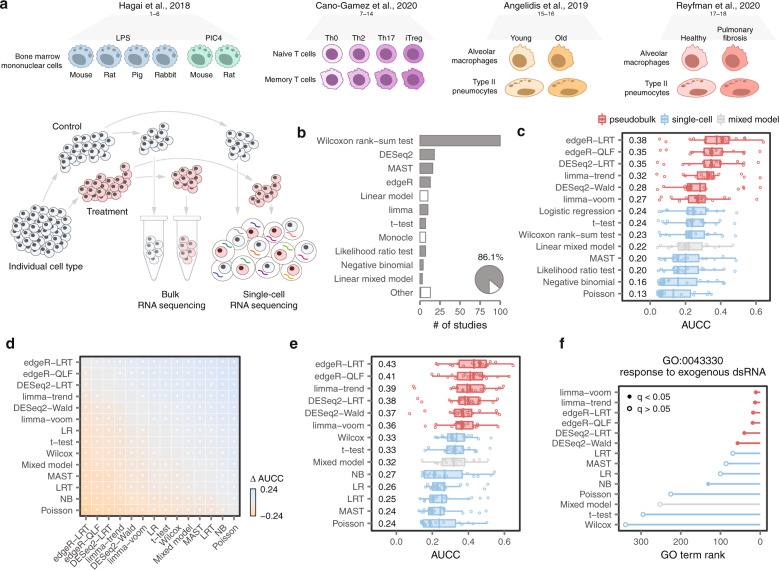
“This analysis immediately revealed that all six of the top-performing methods shared a common analytical property. These methods aggregated cells within a biological replicate, to form so-called ‘pseudobulks’, before applying a statistical test (Fig. 1c ) 18 .”
What the sources say
- Supportedcites [18] source
Section 3.1 describes summing counts across cells within each plate, then using those sums for DE testing with plates treated as replicates. The statement that six methods were top-performing is presented as the citing authors’ own analysis, not a finding attributed to this source. (LLM, conf=0.87)
plain- Asserted: passes — The authors put it forward as true.
- Checkable: passes — It can be checked against evidence.
- Load-bearing: passes — The paper’s conclusions depend on it.
- Based: passes — The paper gives a reason why it holds.
- Supported
The cited sources that could be checked couldn’t confirm or dispute this claim.
In the paper
“For example, single-cell methods failed to identify the relevant GO term when comparing mouse phagocytes stimulated with poly(I:C) 12 , a synthetic double-stranded RNA (Fig. 1f ).”
What the sources say
- Could not verifycites [12] sourceExperimental — accuracy not yet measured
The Methods section on bone marrow-derived phagocytes reports poly(I:C) stimulation of rodent cells and single-cell analysis, but does not report whether a GO term was identified. Searches for GO-term enrichment and a failure to identify a term found no passage addressing the claimed result. (LLM, conf=0.76)
plainSingle case- Asserted: passes — The authors put it forward as true.
- Checkable: passes — It can be checked against evidence.
- Load-bearing: passes — The paper’s conclusions depend on it.
- Based: passes — The paper gives a reason why it holds.
- Could not verify
The cited sources support only part of this claim — read each source’s verdict below.
In the paper
“An extensive survey of the literature identified a total of eighteen ‘gold standard’ datasets that met these criteria (Fig. 1a ) 12 – 15 .”
What the sources say
- Supportedcites [12] source
The Methods (Cross-species dermal fibroblast stimulation with dsRNA and IFNB; page unavailable) describe both bulk and single-cell RNA-seq of stimulated fibroblasts, including a shared main stimulation time point. The citation identifies this paper as a source of a qualifying dataset, not as the source of the citing authors’ literature survey or its total of eighteen datasets. (LLM, conf=0.86)
- Supportedcites [13] 2018, Gene expression variability across cells and species shapes innate immunity, Nature source
The citation identifies this paper as one of the datasets, rather than attributing the citing authors’ literature survey or total of eighteen to it. The Introduction and Results (Study design; page unavailable) describe bulk and single-cell profiling of purified CD4+ T-cell populations exposed to cytokine conditions, supporting that identification. (LLM, conf=0.87)
- Supportedcites [14] 2020, Single-cell transcriptomics identifies an effectorness gradient shaping the response of CD4+ T cells to cytokines, Nat. Commun source
This citation identifies one of the datasets in the citing authors’ eighteen-dataset survey; it does not attribute the survey’s total to Angelidis et al. The source’s Results (‘Cell type-specific effects of aging’; page unavailable) report scRNA-seq comparisons with bulk RNA-seq of flow-sorted epithelial cells and macrophages from young and old mice. (LLM, conf=0.86)
- Partly supportedcites [15] sourceExperimental — accuracy not yet measured
Split into 2 atoms — 0 confirmed, 1 partially supported, 0 disputed, 0 misattributed, 1 unverifiable. Expand the claim to see per-atom verdicts.
plain- Asserted: passes — The authors put it forward as true.
- Checkable: passes — It can be checked against evidence.
- Load-bearing: passes — The paper’s conclusions depend on it.
- Based: passes — The paper gives a reason why it holds.
- Supported
The cited sources support only part of this claim — read each source’s verdict below.
In the paper
“This unbiased analysis indicated that endothelial cells underwent the most profound transcriptional changes in the spinal cord below the injury (Fig. 5e ).”
What the sources say
- Partly supportedcites [27] sourceExperimental — accuracy not yet measured
The paper’s Abstract describes applying Augur to lumbar spinal-cord cells after injury, but its spinal-cord prioritization focuses on interneuron subtypes. The Abstract reports profound changes in endothelial cells in Alzheimer’s disease datasets, not in the spinal cord below an injury. It therefore supports the use of Augur in a spinal-cord injury setting, but not the attributed endothelial-cell finding. (LLM, conf=0.86)
- Not checked — no full text of the sourcecites [28] 2020, A curated database reveals trends in single-cell transcriptomics, Database source
hedgeddirect- Asserted: passes — The authors put it forward as true.
- Checkable: passes — It can be checked against evidence.
- Load-bearing: passes — The paper’s conclusions depend on it.
- Based: passes — The paper gives a reason why it holds.
- Partly supported
The cited sources support only part of this claim — read each source’s verdict below.
In the paper
“Several of the validated edgeR-LRT genes, including Slc7a11 and Igfbp6 , are involved in the response to hypoxia within endothelial cells, supporting the establishment of a chronically hypoxic state in the lumbar spinal cord 31 – 33 .”
What the sources say
- Partly supportedcites [31] sourceExperimental — accuracy not yet measured
The section “HIF regulates antioxidant defenses in hypoxic cells” (page unavailable) says hypoxia induces SLC7A11 expression in breast cancer cells. It does not establish that SLC7A11 or Igfbp6 responds to hypoxia in endothelial cells, and the retrieved passages do not address Igfbp6. (LLM, conf=0.88)
- Supportedcites [32] source
The Results section reports that hypoxia significantly increased IGFBP-6 expression in human endothelial cells, with similar induction observed in rat brain vessel endothelial cells. This supports the Igfbp6–endothelial hypoxia link for which this source is cited; the edgeR-LRT validation and lumbar spinal cord interpretation are the citing authors’ own findings and inference. (LLM, conf=0.92)
- Could not verifycites [33] sourceExperimental — accuracy not yet measured
The Results section, “Endogenous trace amines induce hypoxia after SCI” (page unavailable), reports chronic hypoxia in spinal cord tissue caudal to injury. But the paper’s mRNA analysis (Online Methods; page unavailable) does not identify Slc7a11 or Igfbp6 or describe either gene’s role in endothelial-cell responses to hypoxia. Searches for both gene names found no matching passage. (LLM, conf=0.75)
plaincorrelational- Asserted: passes — The authors put it forward as true.
- Checkable: passes — It can be checked against evidence.
- Load-bearing: unclear — It is unclear whether the paper’s conclusions depend on it.
- Based: passes — The paper gives a reason why it holds.
- Partly supported
The cited sources support only part of this claim — read each source’s verdict below.
In the paper
“However, these studies relied almost entirely on synthetic data, supplemented by a few illustrative case studies.”
What the sources say
- Supportedcites [18] source
Section 2.2 describes simulations used to test differential-expression methods, while Section 4.1 describes an analysis of one real mouse embryonic stem-cell dataset to assess the relevance of the simulation results. This supports the characterization of this paper as relying mainly on synthetic data with a real-data case study; it does not establish the same pattern for every study implied by “these studies.” (LLM, conf=0.88)
- Partly supportedcites [34] sourceExperimental — accuracy not yet measured
The Results (Simulation; no page available) describe this paper’s simulation study, and the Discussion (no page available) says it also examined a few independent real datasets. That supports the characterization of this paper’s approach, but the copy does not establish that previous studies generally relied almost entirely on synthetic data or used real data only as illustrative case studies. (LLM, conf=0.78)
plain- Asserted: passes — The authors put it forward as true.
- Checkable: passes — It can be checked against evidence.
- Load-bearing: passes — The paper’s conclusions depend on it.
- Based: passes — The paper gives a reason why it holds.
- Supported
The cited sources support only part of this claim — read each source’s verdict below.
In the paper
“the most widely used analysis packages in the field currently employ DE methods prone to false discoveries by default 35 , 36 .”
What the sources say
- Could not verifycites [35] sourceExperimental — accuracy not yet measured
The STAR Methods (Quantification and statistical analysis; page unavailable) describe differential-expression testing with Seurat’s FindMarkers, but specify a test rather than identifying its default. Our copy does not assess whether widely used packages’ default DE methods are prone to false discoveries (searched: false discoveries, false positives, and default DE tests). (LLM, conf=0.76)
- Partly supportedcites [36] sourceExperimental — accuracy not yet measured
The Results section ('SCANPY integrates canonical analysis methods in a scalable way'; page unavailable) says SCANPY identifies marker genes using differential expression tests. The Background also identifies established single-cell analysis frameworks. Neither passage says the most widely used packages employ such tests by default or that their methods are prone to false discoveries. (LLM, conf=0.78)
plaindirect- Asserted: passes — The authors put it forward as true.
- Checkable: passes — It can be checked against evidence.
- Load-bearing: passes — The paper’s conclusions depend on it.
- Based: passes — The paper gives a reason why it holds.
- Could not verify
- It may state two separate claims as one. 21
- Probably not a substantial claim. 21
- The quote only partly states this claim. 2
The cited sources support only part of this claim — read each source’s verdict below.
In the paper
“The presence of variability between replicates is unavoidable, and can be attributed to both technical factors and intrinsic biological differences 22 .”
What the sources say
- Partly supportedcites [22] sourceExperimental — accuracy not yet measured
The Results section, “Batch effects associated with UMI-based single cell data” (page unavailable), reports variation associated with both individual origin and technical C1 batches. The paper supports those two sources of variation in its single-cell study, but does not establish that variability between replicates is universally unavoidable. (LLM, conf=0.82)
plaindirect- Asserted: passes — The authors put it forward as true.
- Checkable: passes — It can be checked against evidence.
- Load-bearing: passes — The paper’s conclusions depend on it.
- Based: passes — The paper gives a reason why it holds.
It may state two separate claims as one.
- Partly supported
Every source the paper cites for this claim was checked and supports it.
In the paper
“By explicitly modeling variation both within and between biological replicates, mixed models should benefit from increased statistical power compared to pseudobulk methods 9 .”
What the sources say
- Supportedcites [9] 2020, muscat detects subpopulation-specific state transitions from multi-sample multi-condition singlecell transcriptomics data, Nat. Commun source
The Discussion says pseudobulk aggregation loses within-sample variance information and reports decreased power relative to mixed-effects models. The Power Analysis (Fig. 3) likewise reports a large loss of power for aggregation methods across many sample sizes. The supplied passages identify sections but do not give page numbers. (LLM, conf=0.94)
hedgedconditional- Asserted: passes — The authors put it forward as true.
- Checkable: passes — It can be checked against evidence.
- Load-bearing: passes — The paper’s conclusions depend on it.
- Based: passes — The paper gives a reason why it holds.
Probably not a substantial claim.
- Supported
The cited sources support only part of this claim — read each source’s verdict below.
In the paper
“Previous benchmarks of DE analysis methods for single-cell transcriptomics have relied heavily on simulated data, or else have compared the results of different methods in scenarios where no ground truth was available 10 , 17 .”
What the sources say
- Partly supportedcites [10] 2021, A practical solution to pseudoreplication bias in single-cell studies, Nat. Commun sourceExperimental — accuracy not yet measured
The Introduction describes this paper’s benchmark of 16 single-cell differential-state analysis methods using simulated data, so it supports the simulation-based part by example. Its discussion of earlier comparison studies (Introduction; page unavailable) does not say they relied heavily on simulations or compared methods without ground truth. The latter claim is not supported by this source. (LLM, conf=0.82)
- Not checked — no full text of the sourcecites [17] source
plain- Asserted: passes — The authors put it forward as true.
- Checkable: passes — It can be checked against evidence.
- Load-bearing: passes — The paper’s conclusions depend on it.
- Based: passes — The paper gives a reason why it holds.
It may state two separate claims as one.
- Partly supported
Every source the paper cites for this claim was checked and supports it.
In the paper
“The possibility that conflating variability between replicates with the biological effect of interest can lead to spurious findings has previously been recognized 18 , 34 .”
What the sources say
- Supportedcites [18] source
The Introduction says that variability between replicate plates can explain apparent differential expression between groups and that ignoring plate effects can produce spurious findings. Section 2.3 reports that plate effects led to false positives in the authors’ simulations. The supplied passages do not specify page numbers. (LLM, conf=0.93)
- Supportedcites [34] source
The Discussion says that pseudoreplication has been addressed repeatedly and that failing to account for correlation among non-independent replicates inflates type 1 errors and produces spurious results. It also reports false positives from treating cells within an individual as independent. The supplied passages have no page numbers. (LLM, conf=0.93)
plaindirect- Asserted: passes — The authors put it forward as true.
- Checkable: passes — It can be checked against evidence.
- Load-bearing: fails — The paper’s conclusions may not depend on it.
- Based: passes — The paper gives a reason why it holds.
Probably not a substantial claim. The paper’s conclusions may not depend on it.
- Supported
The cited sources support only part of this claim — read each source’s verdict below.
In the paper
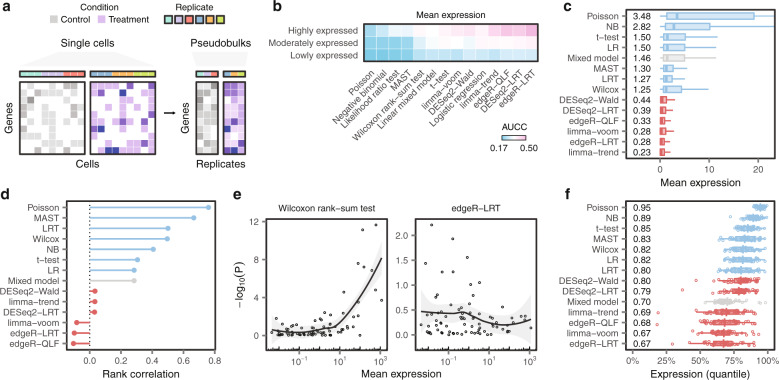
“Previous studies demonstrated that inferences about DE are generally more accurate for highly expressed genes19,20.”
§ Confronting false discoveries in single-cell differential expression > Results > Single-cell DE methods are biased towards highly expressed genes
What the sources say
- Could not verifycites [19] sourceExperimental — accuracy not yet measured
Section 4.2 discusses how summation affects DE rankings and the significance of genes driven by outlier cells, but it does not compare inference accuracy by gene expression level. Searches for highly and lowly expressed genes likewise found no passage in our copy establishing that DE inferences are generally more accurate for highly expressed genes. (LLM, conf=0.70)
- Partly supportedcites [20] sourceExperimental — accuracy not yet measured
The section “Most statistical analysis methods for RNA-seq suffer from high FDRs” reports that false-positive DE calls tended to involve genes with lower expression. The Discussion likewise links low-expression false positives to large datasets analyzed with parametric methods. This supports the direction of the claim, but the paper does not establish that DE inferences are generally more accurate for highly expressed genes across methods and conditions. (LLM, conf=0.82)
boostedcorrelational- Asserted: passes — The authors put it forward as true.
- Checkable: passes — It can be checked against evidence.
- Load-bearing: passes — The paper’s conclusions depend on it.
- Based: passes — The paper gives a reason why it holds.
Probably not a substantial claim.
- Could not verify
Every source the paper cites for this claim was checked and supports it.
In the paper
“The sparsity and heterogeneity of single-cell data initially encouraged the development of specialized statistical methods to identify differentially expressed mRNAs7,8.”
§ Confronting false discoveries in single-cell differential expression > Introduction
What the sources say
- Supportedcites [7] source
The Abstract describes drop-out events, technical noise and biological variability as challenges for differential-expression analysis. It then introduces a specialized Bayesian method for detecting differential expression in single-cell RNA-seq data, supporting the cited paraphrase. (LLM, conf=0.92)
- Supportedcites [8] source
The Background describes sparse, bimodal single-cell expression and biological variability as challenges for analysis. It also describes a specialized method developed to test differential gene expression while accounting for that pattern; the Conclusion identifies MAST as another such framework. (LLM, conf=0.91)
plaindirect- Asserted: passes — The authors put it forward as true.
- Checkable: passes — It can be checked against evidence.
- Load-bearing: fails — The paper’s conclusions may not depend on it.
- Based: passes — The paper gives a reason why it holds.
Probably not a substantial claim. The paper’s conclusions may not depend on it.
- Supported
The cited sources support only part of this claim — read each source’s verdict below.
In the paper
“The maturation of single-cell technologies now enables large-scale comparisons of cell states within complex tissues, thus providing the appropriate resolution to dissect cell-type-specific responses to perturbation5,6.”
§ Confronting false discoveries in single-cell differential expression > Introduction
What the sources say
- Partly supportedcites [5] sourceExperimental — accuracy not yet measured
The paper reports profiling thousands of cells and identifying cell-type-specific responses to IFN-β stimulation in peripheral blood immune cells (Abstract; page unavailable). It does not demonstrate large-scale comparisons within complex tissues: the same section says applying the method to solid tissue remains challenging. (LLM, conf=0.86)
- Supportedcites [6] 2019, Single-cell transcriptomic analysis of Alzheimer’s disease, Nature source
The Abstract describes profiling 80,660 single-nucleus transcriptomes across 48 brains and using the resulting cellular-level view to identify cell-type-specific responses to AD pathology. The Discussion reports pathology-responsive signatures across six major cell types and 40 subpopulations. This directly exemplifies the large-scale, cell-resolved comparison attributed to the source. (LLM, conf=0.91)
plaindirect- Asserted: passes — The authors put it forward as true.
- Checkable: passes — It can be checked against evidence.
- Load-bearing: fails — The paper’s conclusions may not depend on it.
- Based: passes — The paper gives a reason why it holds.
Probably not a substantial claim. The paper’s conclusions may not depend on it. It may state two separate claims as one.
- Partly supported
The cited sources that could be checked couldn’t confirm or dispute this claim.
In the paper
“We specifically focused on the lumbar spinal cord, since this region undergoes multifaceted changes that lead to the irreversible degradation of neuronal function25,26.”
§ Confronting false discoveries in single-cell differential expression > Results > True and false discoveries in the injured mouse spinal cord
What the sources say
- Not checked — no full text of the sourcecites [25] source
- Could not verifycites [26] Hao, Y. et al. Integrated analysis of multimodal single-cell data. Preprint at http://doi.org/10.1101/2020.10.12.335331 (2020). sourceExperimental — accuracy not yet measured
The Results passages concern immune-cell populations, and the Discussion describes multimodal single-cell analysis; neither addresses changes in the lumbar spinal cord or neuronal function after injury. Searches for the claimed spinal-cord injury and neuronal-degradation terms found no relevant passage in our copy. No page numbers were provided. (LLM, conf=0.78)
plaindirect- Asserted: passes — The authors put it forward as true.
- Checkable: passes — It can be checked against evidence.
- Load-bearing: passes — The paper’s conclusions depend on it.
- Based: passes — The paper gives a reason why it holds.
Probably not a substantial claim.
The cited sources support only part of this claim — read each source’s verdict below.
In the paper
“Several of the validated edgeR-LRT genes, including Slc7a11 and Igfbp6, are involved in the response to hypoxia within endothelial cells, supporting the establishment of a chronically hypoxic state in the lumbar spinal cord31–33.”
§ Confronting false discoveries in single-cell differential expression > Results > True and false discoveries in the injured mouse spinal cord
What the sources say
- Could not verifycites [31] sourceExperimental — accuracy not yet measured
The Methods (§2.1) describe single-cell qPCR datasets of T cells, and the Results (§3.5) evaluate a differential-expression LRT. Searches for Slc7a11, Igfbp6, endothelial hypoxia, and the lumbar spinal cord found no passage addressing the attributed biological claim. Page numbers were unavailable in our copy. (LLM, conf=0.75)
- Could not verifycites [32] sourceExperimental — accuracy not yet measured
The Results and discussion section describes DESeq2 analyses, including an example using rat dorsal root ganglion data, but does not address hypoxia in endothelial cells or the lumbar spinal cord. Searches for Slc7a11, Igfbp6, edgeR-LRT, and chronic hypoxia found no passage supporting the attributed claim. (LLM, conf=0.75)
- Partly supportedcites [33] sourceExperimental — accuracy not yet measured
The Introduction identifies edgeR as software for differential-expression analysis, supporting the reference to edgeR as a method. But the Model section describes an exact test, not an LRT, and the paper does not address Slc7a11, Igfbp6, endothelial hypoxia, or the lumbar spinal cord. It therefore cannot support the sentence’s biological conclusion. (LLM, conf=0.86)
plaincorrelational- Asserted: passes — The authors put it forward as true.
- Checkable: passes — It can be checked against evidence.
- Load-bearing: unclear — It is unclear whether the paper’s conclusions depend on it.
- Based: passes — The paper gives a reason why it holds.
It may state two separate claims as one.
- Could not verify
The cited sources support only part of this claim — read each source’s verdict below.
In the paper
“Previous benchmarks of DE analysis methods for single-cell transcriptomics have relied heavily on simulated data, or else have compared the results of different methods in scenarios where no ground truth was available10,17.”
§ Confronting false discoveries in single-cell differential expression > Methods > Ground-truth datasets
What the sources say
- Partly supportedcites [10] 2021, A practical solution to pseudoreplication bias in single-cell studies, Nat. Commun sourceExperimental — accuracy not yet measured
The Discussion (page not provided) says that papers evaluating single-cell-specific tools used simulations, supporting the simulated-data part of the claim. Our copy does not say that previous benchmarks compared methods without ground truth. (LLM, conf=0.83)
- Not checked — no full text of the sourcecites [17] source
plain- Asserted: passes — The authors put it forward as true.
- Checkable: passes — It can be checked against evidence.
- Load-bearing: passes — The paper’s conclusions depend on it.
- Based: passes — The paper gives a reason why it holds.
It may state two separate claims as one.
- Partly supported
A result the paper reports from its own data — it cites no other source for it, so there is none to check. The quote shows it is in the paper.
In the paper
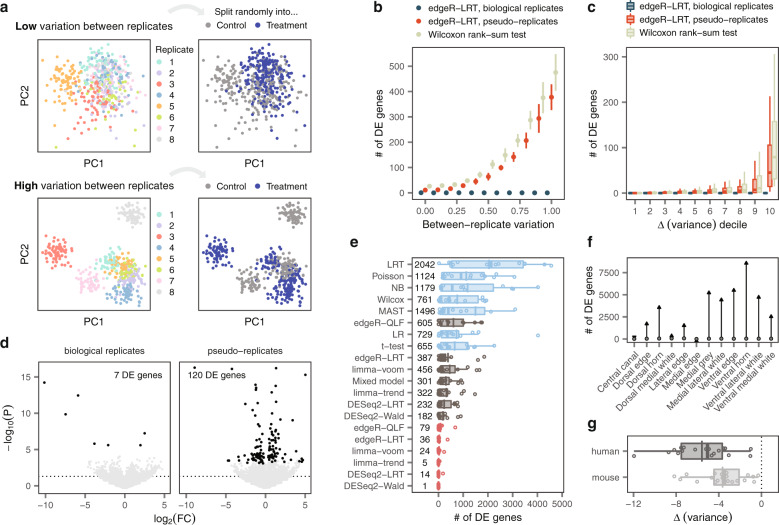
“This systematic analysis confirmed that single-cell methods produced a systematic excess of false positives compared to pseudobulk methods (Fig. 4e ).”
plaindirectn = 6- Asserted: passes — The authors put it forward as true.
- Checkable: passes — It can be checked against evidence.
- Load-bearing: passes — The paper’s conclusions depend on it.
- Based: passes — The paper gives a reason why it holds.
The quote only partly states this claim.
A result the paper reports from its own data — it cites no other source for it, so there is none to check. The quote shows it is in the paper.
In the paper
“Conversely, the Wilcoxon rank-sum test and edgeR-LRT each nominated an additional 44 and 12 genes as DE, respectively (Supplementary Fig. 9a ).”
plain- Asserted: passes — The authors put it forward as true.
- Checkable: passes — It can be checked against evidence.
- Load-bearing: passes — The paper’s conclusions depend on it.
- Based: passes — The paper gives a reason why it holds.
It may state two separate claims as one.
A result the paper reports from its own data — it cites no other source for it, so there is none to check. The quote shows it is in the paper.
In the paper
“We found that the injury triggered the aberrant growth of new synapses throughout lumbar segments, combined with the emergence of abnormal segmental reflexes (Fig. 5a and Supplementary Fig. 8a ).”
plaindirect- Asserted: passes — The authors put it forward as true.
- Checkable: passes — It can be checked against evidence.
- Load-bearing: unclear — It is unclear whether the paper’s conclusions depend on it.
- Based: passes — The paper gives a reason why it holds.
It may state two separate claims as one.
A result the paper reports from its own data — it cites no other source for it, so there is none to check. The quote shows it is in the paper.
In the paper
“The differences between pseudobulk and single-cell methods were highly significant (Fig. 1d ), and robust to the methodology used to quantify concordance (Supplementary Fig. 1a-d ).”
boostedcorrelational- Asserted: passes — The authors put it forward as true.
- Checkable: passes — It can be checked against evidence.
- Load-bearing: passes — The paper’s conclusions depend on it.
- Based: passes — The paper gives a reason why it holds.
It may state two separate claims as one.
A result the paper reports from its own data — it cites no other source for it, so there is none to check. The quote shows it is in the paper.
In the paper
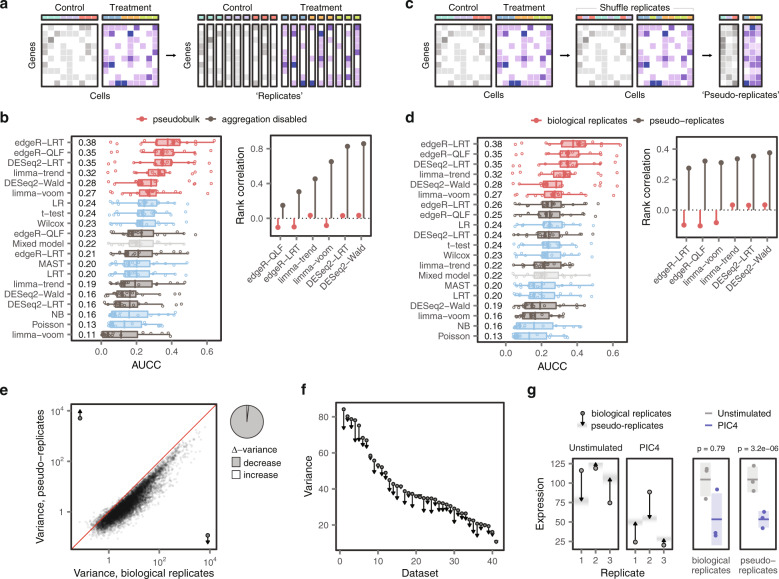
“This experiment induced a similar decrease in the performance of pseudobulk methods, combined with the re-emergence of a bias towards highly expressed genes (Fig. 3d and Supplementary Fig. 4d–f ).”
plaindirect- Asserted: passes — The authors put it forward as true.
- Checkable: passes — It can be checked against evidence.
- Load-bearing: passes — The paper’s conclusions depend on it.
- Based: passes — The paper gives a reason why it holds.
It may state two separate claims as one.
A result the paper reports from its own data — it cites no other source for it, so there is none to check. The quote shows it is in the paper.
In the paper
“Together, these methods have been used by almost 90% of recent studies (Fig. 1b ).”
plain- Asserted: passes — The authors put it forward as true.
- Checkable: passes — It can be checked against evidence.
- Load-bearing: fails — The paper’s conclusions may not depend on it.
- Based: passes — The paper gives a reason why it holds.
Probably not a substantial claim. The paper’s conclusions may not depend on it.
A result the paper reports from its own data — it cites no other source for it, so there is none to check. The quote shows it is in the paper.
In the paper
“Moreover, the computational resources required to fit the best-performing GLMMs were enormous. Even in downsampled datasets, DE analysis of a single cell type took an average of 13.5 h (Supplementary Fig. 10c-d ).”
plain- Asserted: passes — The authors put it forward as true.
- Checkable: passes — It can be checked against evidence.
- Load-bearing: passes — The paper’s conclusions depend on it.
- Based: passes — The paper gives a reason why it holds.
It may state two separate claims as one.
The paper states this without a source or data behind it here, so there is nothing to check it against. The quote shows it is in the paper.
In the paper
“we asked why mixed models failed to match the performance of pseudobulk methods.”
plain- Asserted: fails — The authors may not put it forward as true.
- Checkable: passes — It can be checked against evidence.
- Load-bearing: passes — The paper’s conclusions depend on it.
- Based: fails — The paper may give no reason why it holds.
Probably not a substantial claim. The authors may not put it forward as true. The paper may give no reason why it holds.
A result the paper reports from its own data — it cites no other source for it, so there is none to check. The quote shows it is in the paper.
In the paper
“In total, 205 of the 500 studies conducted DE analysis between biological conditions.”
plain- Asserted: passes — The authors put it forward as true.
- Checkable: passes — It can be checked against evidence.
- Load-bearing: fails — The paper’s conclusions may not depend on it.
- Based: passes — The paper gives a reason why it holds.
Probably not a substantial claim. The paper’s conclusions may not depend on it.
A result the paper reports from its own data — it cites no other source for it, so there is none to check. The quote shows it is in the paper.
In the paper
“Strikingly, single-cell methods identified hundreds of DE genes in the absence of any perturbation (Fig. 4b and Supplementary Fig. 4a).”
§ Confronting false discoveries in single-cell differential expression > Results > False discoveries in single-cell DE
plain- Asserted: passes — The authors put it forward as true.
- Checkable: passes — It can be checked against evidence.
- Load-bearing: passes — The paper’s conclusions depend on it.
- Based: passes — The paper gives a reason why it holds.
The quote only partly states this claim.
The paper states this without a source or data behind it here, so there is nothing to check it against. The quote shows it is in the paper.
In the paper
“In line with the expected consequences of chronic hypoxia, we detected the presence of numerous atrophic blood vessels below the level of injury (Fig. 5i).”
§ Confronting false discoveries in single-cell differential expression > Results > True and false discoveries in the injured mouse spinal cord
plain- Asserted: passes — The authors put it forward as true.
- Checkable: passes — It can be checked against evidence.
- Load-bearing: fails — The paper’s conclusions may not depend on it.
- Based: passes — The paper gives a reason why it holds.
Probably not a substantial claim. The paper’s conclusions may not depend on it.
A conclusion the paper draws from its own results — it cites no other source for it, so there is none to check. The quote shows it is in the paper.
In the paper
“This underestimation of the variance biases single-cell methods towards highly expressed genes, compromising their ability to generate biologically accurate results.”
plaindirect- Asserted: passes — The authors put it forward as true.
- Checkable: passes — It can be checked against evidence.
- Load-bearing: passes — The paper’s conclusions depend on it.
- Based: passes — The paper gives a reason why it holds.
It may state two separate claims as one.
A conclusion the paper draws from its own results — it cites no other source for it, so there is none to check. The quote shows it is in the paper.
In the paper
“Conversely, valid single-cell DE analysis that accounted for variation between biological replicates yielded reproducible conclusions that could be validated in vivo.”
hedgedcorrelational- Asserted: passes — The authors put it forward as true.
- Checkable: passes — It can be checked against evidence.
- Load-bearing: passes — The paper’s conclusions depend on it.
- Based: passes — The paper gives a reason why it holds.
It may state two separate claims as one.
A claim is checked only against the cited paper’s full text, never its abstract, and none is available for its sources.
In the paper
“This chaotic reorganization of circuits below the SCI has been linked to spasticity and neuronal dysfunction (Fig. 5b and Supplementary Fig. 8b-c ) 25 , 26 .”
What the sources say
plaincorrelational- Asserted: passes — The authors put it forward as true.
- Checkable: passes — It can be checked against evidence.
- Load-bearing: fails — The paper’s conclusions may not depend on it.
- Based: passes — The paper gives a reason why it holds.
Probably not a substantial claim. The paper’s conclusions may not depend on it.
A conclusion the paper draws from its own results — it cites no other source for it, so there is none to check. The quote shows it is in the paper.
In the paper
“Aggregating random groups of cells to form pseudo-replicates, or ignoring replicates altogether in comparisons of single cells, both introduced a bias towards highly expressed genes and a corresponding loss of performance.”
plaindirect- Asserted: passes — The authors put it forward as true.
- Checkable: passes — It can be checked against evidence.
- Load-bearing: passes — The paper’s conclusions depend on it.
- Based: passes — The paper gives a reason why it holds.
It may state two separate claims as one.
The paper states this without a source or data behind it here, so there is nothing to check it against. The quote shows it is in the paper.
In the paper
“Consequently, the pervasiveness of false discoveries in published analyses of single-cell data and the propensity for these false discoveries to affect the biological conclusions of a study have remained unclear.”
plain- Asserted: passes — The authors put it forward as true.
- Checkable: passes — It can be checked against evidence.
- Load-bearing: passes — The paper’s conclusions depend on it.
- Based: passes — The paper gives a reason why it holds.
Probably not a substantial claim. It may state two separate claims as one.
What the paper did — it cites no source for this, so there is none to check. The quote shows it is in the paper.
In the paper
“The enormous computational requirements of the GLMMs prevented us from evaluating these models in the full ground truth datasets; instead, we analyzed a series of downsampled datasets, each containing between 25 and 1,000 cells.”
plaindirect- Asserted: passes — The authors put it forward as true.
- Checkable: passes — It can be checked against evidence.
- Load-bearing: fails — The paper’s conclusions may not depend on it.
- Based: passes — The paper gives a reason why it holds.
Probably not a substantial claim. The paper’s conclusions may not depend on it. It may state two separate claims as one.
A conclusion the paper draws from its own results — it cites no other source for it, so there is none to check. The quote shows it is in the paper.
In the paper
“and are most likely to manifest in studies of human tissue”
hedgedcorrelational- Asserted: passes — The authors put it forward as true.
- Checkable: passes — It can be checked against evidence.
- Load-bearing: fails — The paper’s conclusions may not depend on it.
- Based: fails — The paper may give no reason why it holds.
Probably not a substantial claim. The paper’s conclusions may not depend on it. The paper may give no reason why it holds.
The paper states this without a source or data behind it here, so there is nothing to check it against. The quote shows it is in the paper.
In the paper
“We reasoned that the best possible approximation to the biological ground truth in a scRNA-seq experiment would consist of a matched bulk RNA-seq dataset in the same purified cell type, exposed to the same perturbation under identical experimental conditions, and sequenced in the same laboratory.”
hedged- Asserted: passes — The authors put it forward as true.
- Checkable: fails — It may be too vague to check against evidence.
- Load-bearing: passes — The paper’s conclusions depend on it.
- Based: fails — The paper may give no reason why it holds.
Probably not a substantial claim. It may be too vague to check against evidence. The paper may give no reason why it holds.
A conclusion the paper draws from its own results — it cites no other source for it, so there is none to check. The quote shows it is in the paper.
In the paper
“suggesting that inference at the level of biological replicates is critical to understand the cellular and molecular basis for human disease.”
hedgeddirect- Asserted: passes — The authors put it forward as true.
- Checkable: fails — It may be too vague to check against evidence.
- Load-bearing: passes — The paper’s conclusions depend on it.
- Based: passes — The paper gives a reason why it holds.
Probably not a substantial claim. It may be too vague to check against evidence.
A conclusion the paper draws from its own results — it cites no other source for it, so there is none to check. The quote shows it is in the paper.
In the paper
“Understanding these mechanisms led us to discover that the same fundamental issues affect other high-dimensional assays, including spatial transcriptomics”
plaindirect- Asserted: passes — The authors put it forward as true.
- Checkable: passes — It can be checked against evidence.
- Load-bearing: fails — The paper’s conclusions may not depend on it.
- Based: fails — The paper may give no reason why it holds.
Probably not a substantial claim. The paper’s conclusions may not depend on it. The paper may give no reason why it holds.
The paper states this without a source or data behind it here, so there is nothing to check it against. The quote shows it is in the paper.
In the paper
“However, simulations require specifying a model from which synthetic patterns of differential expression are generated.”
§ Confronting false discoveries in single-cell differential expression > Introduction
plain- Asserted: passes — The authors put it forward as true.
- Checkable: passes — It can be checked against evidence.
- Load-bearing: passes — The paper’s conclusions depend on it.
- Based: passes — The paper gives a reason why it holds.
Probably not a substantial claim.
A conclusion the paper draws from its own results — it cites no other source for it, so there is none to check. The quote shows it is in the paper.
In the paper
“Methods that ignore this inevitable variation are biased and prone to false discoveries.”
§ Confronting false discoveries in single-cell differential expression > Abstract
plaindirect- Asserted: passes — The authors put it forward as true.
- Checkable: passes — It can be checked against evidence.
- Load-bearing: passes — The paper’s conclusions depend on it.
- Based: passes — The paper gives a reason why it holds.
It may state two separate claims as one.
In the paper
“Single-cell RNA-seq (scRNA-seq) enables the quantification of RNA abundance at the resolution of individual cells4.”
§ Confronting false discoveries in single-cell differential expression > Introduction
What the sources say
- Not checked — no full text of the sourcecites [4] 2018, From tissues to cell types and back: single-cell gene expression analysis of tissue architecture, Annu. Rev. Biomed. Data Sci source
plaindirect- Asserted: passes — The authors put it forward as true.
- Checkable: passes — It can be checked against evidence.
- Load-bearing: fails — The paper’s conclusions may not depend on it.
- Based: passes — The paper gives a reason why it holds.
Probably not a substantial claim. The paper’s conclusions may not depend on it.
A conclusion the paper draws from its own results — it cites no other source for it, so there is none to check. The quote shows it is in the paper.
In the paper
“Aggregating random groups of cells to form pseudo-replicates, or ignoring replicates altogether in comparisons of single cells, both introduced a bias towards highly expressed genes and a corresponding loss of performance.”
§ Confronting false discoveries in single-cell differential expression > Results > DE analysis of single-cell data must account for biological replicates
plaindirect- Asserted: passes — The authors put it forward as true.
- Checkable: passes — It can be checked against evidence.
- Load-bearing: passes — The paper’s conclusions depend on it.
- Based: passes — The paper gives a reason why it holds.
It may state two separate claims as one.
A conclusion the paper draws from its own results — it cites no other source for it, so there is none to check. The quote shows it is in the paper.
In the paper
“We recognized that both experiments entailed a loss of information about biological replicates.”
§ Confronting false discoveries in single-cell differential expression > Results > DE analysis of single-cell data must account for biological replicates
plaindirect- Asserted: passes — The authors put it forward as true.
- Checkable: passes — It can be checked against evidence.
- Load-bearing: passes — The paper’s conclusions depend on it.
- Based: passes — The paper gives a reason why it holds.
It may state two separate claims as one.
A conclusion the paper draws from its own results — it cites no other source for it, so there is none to check. The quote shows it is in the paper.
In the paper
“While we show that accounting for biological replicates is critical for any DE analysis, this result stresses the paramount importance of addressing this issue in single-cell studies of human tissue.”
§ Confronting false discoveries in single-cell differential expression > Results > False discoveries in single-cell DE
boosteddirect- Asserted: passes — The authors put it forward as true.
- Checkable: passes — It can be checked against evidence.
- Load-bearing: passes — The paper’s conclusions depend on it.
- Based: passes — The paper gives a reason why it holds.
It may state two separate claims as one.
A conclusion the paper draws from its own results — it cites no other source for it, so there is none to check. The quote shows it is in the paper.
In the paper
“This underestimation of the variance biases single-cell methods towards highly expressed genes, compromising their ability to generate biologically accurate results.”
§ Confronting false discoveries in single-cell differential expression > Results > DE analysis of single-cell data must account for biological replicates
plaindirect- Asserted: passes — The authors put it forward as true.
- Checkable: passes — It can be checked against evidence.
- Load-bearing: passes — The paper’s conclusions depend on it.
- Based: passes — The paper gives a reason why it holds.
It may state two separate claims as one.
What the paper did — it cites no source for this, so there is none to check. The quote shows it is in the paper.
In the paper
“To evaluate the concordance of DE analysis, we used k = 500 except where otherwise noted, but found our results were insensitive to the precise value of k.”
§ Confronting false discoveries in single-cell differential expression > Methods > Measuring concordance between single-cell and bulk RNA-seq
plain- Asserted: passes — The authors put it forward as true.
- Checkable: passes — It can be checked against evidence.
- Load-bearing: fails — The paper’s conclusions may not depend on it.
- Based: passes — The paper gives a reason why it holds.
Probably not a substantial claim. The paper’s conclusions may not depend on it.
What the paper did — it cites no source for this, so there is none to check. The quote shows it is in the paper.
In the paper
“The enormous computational requirements of the GLMMs prevented us from evaluating these models in the full ground truth datasets; instead, we analyzed a series of downsampled datasets, each containing between 25 and 1,000 cells.”
§ Confronting false discoveries in single-cell differential expression > Methods > Mixed models
plaindirect- Asserted: passes — The authors put it forward as true.
- Checkable: passes — It can be checked against evidence.
- Load-bearing: fails — The paper’s conclusions may not depend on it.
- Based: passes — The paper gives a reason why it holds.
Probably not a substantial claim. The paper’s conclusions may not depend on it. It may state two separate claims as one.
The authors state this as an assumption.
The closest possible approximation to the experimental ground truth can be obtained from matched bulk and scRNA-seq performed on the same population of purified cells, exposed to the same perturbations, and sequenced in the same laboratories.
“We posited that the closest possible approximation to this ground truth could be obtained from matched bulk and scRNA-seq performed on the same population of purified cells, exposed to the same perturbations, and sequenced in the same laboratories.”
The paper relies on this without support.
Measurements of gene expression in single cells are inherently sparse.
“Measurements of gene expression in single cells are inherently sparse.”
The paper relies on this without support.
Many factors that produce variability between biological replicates can be minimized in animal models, including genetic background, environment, intensity and timing of the biological perturbation, and sample processing.
“Many of the factors that produce this variability between replicates can be minimized in animal models, including the genetic background, environment, intensity and timing of the biological perturbation, and sample processing.”
The paper relies on this without support.
Sources of variation between biological replicates are inherently more difficult to control in experiments involving human subjects.
“In contrast, these sources of variation are inherently more difficult to control in experiments involving human subjects.”
The paper relies on this without support.
The pervasiveness of false discoveries in published analyses of single-cell data and the propensity for these false discoveries to affect the biological conclusions of a study have remained unclear.
“Consequently, the pervasiveness of false discoveries in published analyses of single-cell data and the propensity for these false discoveries to affect the biological conclusions of a study have remained unclear.”
The paper relies on this without support.
The 500 most recent entries in the curated database are representative of scRNA-seq studies published in the past two years.
“we limited our analysis to the 500 most recently published studies”
The paper relies on this without support.
The 18 ground truth datasets are representative of single-cell experiments for assessing DE methods.
“which led us to compile a resource of eighteen ground truth datasets from four publications12–15”
The paper relies on this without support.
The 46 published scRNA-seq datasets in the compendium are representative of single-cell RNA-seq studies generally.
“We assembled a compendium of 46 published single-cell or single-nucleus RNA-seq studies (Supplementary Fig. 3), and performed DE analyses across this compendium to establish the generality of our conclusions.”
The paper relies on this without support.
Randomly splitting a control group into artificial control and treatment groups creates a valid null distribution for DE analysis.
“For each of these studies, we split the control group randomly into artificial ‘control’ and ‘treatment’ groups, and performed DE analysis.”
Claims other papers make about this one
Each is checked against this paper’s own text: does it say what the citing paper says it does?
The source backs part of the claim, not all of it — or backs it for a different population, condition or comparison.
In the citing paper
“Demultiplexing of pooled scRNA-seq is required to associate metadata with individual samples to account for between sample variation, replicate strengthened differential expression analysis, and confirmation of sample representation across scRNA-seq datasets and cell clusters (Squair et al, 2021; Zimmerman et al, 2021).”
From Evaluation of genetic demultiplexing of single-cell sequencing data from model species (2023) · cites this paper as Squair et al, 2021
Experimental — accuracy not yet measuredThe cited source says what the claim attributes to it.
In the citing paper
“Two benchmarking studies, one applying the aforementioned simulation tool and one using different example data sets, demonstrated that the “pseudobulk” approach in combination with classical differential gene expression methods such as edgeR44 and limma-voom45 outperforms single cell specific methods and mixed models in multi sample DE analysis43,46.”
From scPower accelerates and optimizes the design of multi-sample single cell transcriptomic studies (2021) · cites this paper as [46]
The cited source says what the claim attributes to it.
In the citing paper
“DGE analysis was conducted using a pseudobulk approach to mitigate Type I error inflation [25].”
From Cardiac Macrophages Exhibit Dynamic Heterogeneity and Functional Specialization During Experimental Autoimmune Myocarditis. (2026) · cites this paper as [25]
The cited source says what the claim attributes to it.
In the citing paper
“This is a serious drawback as the lack of biological replicates has also been shown to be a major cause of false discoveries (Hicks et al, 2018; Squair et al, 2021).”
From Evaluation of genetic demultiplexing of single-cell sequencing data from model species (2023) · cites this paper as Squair et al, 2021
The check wasn’t confident either way, so it gives no verdict — never disputed.
In the citing paper
“suggesting that, given a sufficient sample size, pseudo-bulk expression profiles are likely suitable for co-expression network analysis.”
From hdWGCNA identifies co-expression networks in high-dimensional transcriptomics data (2023) · cites this paper as [17]
Experimental — accuracy not yet measured
In the citing paper
“On the one hand, modeling pseudobulk counts has been demonstrated to prevent pseudo-replication bias36,37.”
From Transcriptome-wide analysis of differential expression in perturbation atlases (2025) · cites this paper as [36]
In the citing paper
“In single cell differential expression analyses, a failure to account for biological variability across supra-cellular sampling units (i.e. animal, donor, etc.) can lead to overestimation of effects; this phenomenon is referred to as “pseudoreplication bias” 36,37.”
From Transcriptome-wide analysis of differential expression in perturbation atlases (2025) · cites this paper as [36]
In the citing paper
“Previous benchmark study showed that Seurat18, DESeq226, edgeR27, and Limma25 are among the top methods in discovering differentially expressed genes using single-cell data28.”
From ASGARD is a single-cell guided pipeline to aid repurposing of drugs (2023) · cites this paper as [28]
In the citing paper
“Single-cell-specific methods were found to systematically underestimate the variance of gene expression and to be prone to wrongly labelling highly expressed genes as differentially expressed86.”
From Best practices for single-cell analysis across modalities (2023) · cites this paper as [86]
In the citing paper
“Pseudoreplication leads to an inflated false discovery rate (FDR) as DGE methods do not account for the inherent correlation of replicates (cells from the same individual)86–88.”
From Best practices for single-cell analysis across modalities (2023) · cites this paper as [86]
In the citing paper
“but methods designed for bulk RNA-seq data perform favourably84–86.”
From Best practices for single-cell analysis across modalities (2023) · cites this paper as [86]
Self-check
Percentages, sums and reported differences re-computed from the paper’s own numbers.
Each contradiction between two passages listed here was confirmed by an independent check.
Rated minor: it would not touch a result — a value no result rests on, a p-value that stays on the same side of the significance level, or a conflict that is clerical, resolved elsewhere in the paper, or outside its own findings.
In the paper
§ Confronting false discoveries in single-cell differential expression > Results > False discoveries in single-cell DE
“we calculated the variability between replicates within 41 human and mouse scRNA-seq datasets.”
§ Confronting false discoveries in single-cell differential expression > Methods > Analysis of published scRNA-seq control groups
“we computed the mean ∆-variance across all genes in the 38 human or mouse scRNA-seq datasets in our compendium (n = 18 human datasets and 20 mouse datasets).”
Rated minor: it would not touch a result — a value no result rests on, a p-value that stays on the same side of the significance level, or a conflict that is clerical, resolved elsewhere in the paper, or outside its own findings.
In the paper
§ Confronting false discoveries in single-cell differential expression > Methods > Application to spinal cord injury
“7 genes identified by edgeR-LRT (Slc7a11, catalog no. 422511; Gjb2, catalog no. 518881; Pi16, catalog no. 451311; Rbp4, catalog no. 508501; Col1a1, catalog no. 319371; Igfbp6, catalog no. 425721).”
§ Confronting false discoveries in single-cell differential expression > Results > True and false discoveries in the injured mouse spinal cord
“RNAscope validated five of the six genes called as DE by edgeR-LRT.”
Citations
Cites
Moderated estimation of fold change and dispersion for RNA-seq data with DESeq2
Love, M. I., Huber, W., & Anders, S. (2014) · Genome Biology · doi:10.1186/s13059-014-0550-8 · Cited by 95,106
Subramanian, A., Tamayo, P., Mootha, V. K., Mukherjee, S., Ebert, B. L., Gillette, M. A., Paulovich, A., Pomeroy, S. L., Golub, T. R., Lander, E. S., et al. (2005) · Proceedings of the National Academy of Sciences · doi:10.1073/pnas.0506580102 · Cited by 53,625
Robinson, M. D., McCarthy, D. J., & Smyth, G. K. (2010) · Bioinformatics · doi:10.1093/bioinformatics/btp616 · Cited by 41,364
limma powers differential expression analyses for RNA-sequencing and microarray studies
Ritchie, M. E., Phipson, B., Wu, D., Hu, Y., Law, C. W., Shi, W., & Smyth, G. K. (2015) · Nucleic Acids Research · doi:10.1093/nar/gkv007 · Cited by 40,458
Integrated analysis of multimodal single-cell data
Hao, Y., Hao, S., Andersen-Nissen, E., Mauck, W. M., Zheng, S., Butler, A., Lee, M. J., Wilk, A. J., Darby, C., Zagar, M., et al. (2020) · doi:10.1101/2020.10.12.335331 · Cited by 15,508
Comprehensive Integration of Single-Cell Data
Stuart, T., Butler, A., Hoffman, P., Hafemeister, C., Papalexi, E., Mauck, W. M., Hao, Y., Stoeckius, M., Smibert, P., & Satija, R. (2019) · Cell · doi:10.1016/j.cell.2019.05.031 · Cited by 15,453
RNA-Seq: a revolutionary tool for transcriptomics
Wang, Z., Gerstein, M., & Snyder, M. (2009) · Nature Reviews Genetics · doi:10.1038/nrg2484 · Cited by 13,174
SCANPY: large-scale single-cell gene expression data analysis
Wolf, F. A., Angerer, P., & Theis, F. J. (2018) · Genome Biology · doi:10.1186/s13059-017-1382-0 · Cited by 8,881
voom: precision weights unlock linear model analysis tools for RNA-seq read counts
Law, C. W., Chen, Y., Shi, W., & Smyth, G. K. (2014) · Genome Biology · doi:10.1186/gb-2014-15-2-r29 · Cited by 6,155
McCarthy, D. J., Chen, Y., & Smyth, G. K. (2012) · Nucleic Acids Research · doi:10.1093/nar/gks042 · Cited by 5,195
Research works printed but not linked: 1
- 10.1007/978-1-4939-3578-9$\_$19 · DOI
Cited by
Sorted by citations
Best practices for single-cell analysis across modalities
Heumos, L., Schaar, A. C., Lance, C., Litinetskaya, A., Drost, F., Zappia, L., Lücken, M. D., Strobl, D. C., Henao, J., Curion, F., et al. (2023) · Nature Reviews Genetics · doi:10.1038/s41576-023-00586-w · Cited by 1,051
An integrated cell atlas of the lung in health and disease
Sikkema, L., Ramírez-Suástegui, C., Strobl, D. C., Gillett, T. E., Zappia, L., Madissoon, E., Markov, N. S., Zaragosi, L., Ji, Y., Ansari, M., et al. (2023) · Nature Medicine · doi:10.1038/s41591-023-02327-2 · Cited by 930
“Modeling these covariates at the cell level (that is, treating single cells as independent samples even when they come from the same sample) has been shown to inflate P values 104,105 .”
BackgroundhdWGCNA identifies co-expression networks in high-dimensional transcriptomics data
Morabito, S., Reese, F., Rahimzadeh, N., Miyoshi, E., & Swarup, V. (2023) · Cell Reports Methods · doi:10.1016/j.crmeth.2023.100498 · Cited by 773
APOE4/4 is linked to damaging lipid droplets in Alzheimer’s disease microglia
Haney, M. S., Pálovics, R., Munson, C. N., Long, C., Johansson, P. K., Yip, O., Dong, W., Rawat, E., West, E., Schlachetzki, J. C. M., et al. (2024) · Nature · doi:10.1038/s41586-024-07185-7 · Cited by 536
“We summed the raw counts per patient sample and hence derived ‘pseu-dobulk’ samples 47 from the single-cell counts.”
Maturation and circuit integration of transplanted human cortical organoids
Revah, O., Gore, F., Kelley, K. W., Andersen, J., Sakai, N., Chen, X., Li, M.-Y., Birey, F., Yang, X., Saw, N. L., et al. (2022) · Nature · doi:10.1038/s41586-022-05277-w · Cited by 504
Gene regulatory network inference in the era of single-cell multi-omics
Badia-i-Mompel, P., Wessels, L., Müller‐Dott, S., Trimbour, R., Flores, R. O. R., Argelaguet, R., & Sáez-Rodríguez, J. (2023) · Nature Reviews Genetics · doi:10.1038/s41576-023-00618-5 · Cited by 507
“Strategies that aggregate similar cells into pseudo-bulk profiles or metacells 146,157,158 have been reported to be beneficial 87 .”
BackgroundSalcher, S., Sturm, G., Horvath, L., Untergasser, G., Kuempers, C., Fotakis, G., Panizzolo, E., Martowicz, A., Trebo, M., Pall, G., et al. (2022) · Cancer Cell · doi:10.1016/j.ccell.2022.10.008 · Cited by 503
“Differential gene expression testing We used DESeq2(119) on pseudo-bulk samples for differential expression testing which has been demonstrated to perform well and properly correct for false discoveries.(120) For each cell-type and patient, we summed up transcript counts for each gene.”
Marsh, S. E., Walker, A. J., Kamath, T., Dissing-Olesen, L., Hammond, T. R., de Soysa, T. Y., Young, A. M. H., Murphy, S., Abdulraouf, A., Nadaf, N., et al. (2022) · Nature Neuroscience · doi:10.1038/s41593-022-01022-8 · Cited by 431
Marsh, S. E., Kamath, T., Walker, A. J., Dissing-Olesen, L., Hammond, T. R., Young, A. M. H., Abdulraouf, A., Nadaf, N., Dufort, C., Murphy, S., et al. (2020) · doi:10.1101/2020.12.03.408542 · Cited by 430
Li, J., Wu, C., Hu, H., Qin, G., Wu, X., Bai, F., Zhang, J., Cai, Y., Huang, Y. J., Wang, C., et al. (2023) · Cancer Cell · doi:10.1016/j.ccell.2023.04.011 · Cited by 388
Mapping the developing human immune system across organs
Suo, C., Dann, E., Goh, I., Jardine, L., Kleshchevnikov, V., Park, J.-E., Botting, R. A., Stephenson, E., Engelbert, J., Tuong, Z. K., et al. (2022) · Science · doi:10.1126/science.abo0510 · Cited by 323
“Briefly, single-cell expression profiles were first aggregated into pseudobulk expression profiles x̂ for each cell type c and sample s [as recommended by (85, 86)].”
MethodThe neurons that restore walking after paralysis
Kathe, C., Skinnider, M. A., Hutson, T. H., Regazzi, N., Gautier, M., Demesmaeker, R., Komi, S., Ceto, S., James, N. D., Cho, N., et al. (2022) · Nature · doi:10.1038/s41586-022-05385-7 · Cited by 304
Self-citationDistinct cellular dynamics associated with response to CAR-T therapy for refractory B cell lymphoma
Haradhvala, N. J., Leick, M. B., Maurer, K., Gohil, S. H., Larson, R. C., Yao, N., Gallagher, K., Katsis, K., Frigault, M. J., Southard, J., et al. (2022) · Nature Medicine · doi:10.1038/s41591-022-01959-0 · Cited by 290
Microfluidics-free single-cell genomics with templated emulsification
Clark, I. C., Fontanez, K. M., Meltzer, R. H., Xue, Y., Hayford, C. E., May-Zhang, A. A., D’Amato, C., Osman, A., Zhang, J. Q., Hettige, P., et al. (2023) · Nature Biotechnology · doi:10.1038/s41587-023-01685-z · Cited by 243
“…implications for data quality and biological discovery in single-cell experiments because the detection of true positives and reduction in false positives in differential expression analysis is improved by incorporating replicates and statistical methods that account for biological variability 58 .”
Fasolino, M., Schwartz, G. W., Patil, A. R., Mongia, A., Golson, M. L., Wang, Y. J., Morgan, A. R., Liu, C., Schug, J., Liu, J., et al. (2022) · Nature Metabolism · doi:10.1038/s42255-022-00531-x · Cited by 225
A cellular taxonomy of the adult human spinal cord
Yadav, A., Matson, K. J. E., Li, L., Hua, I., Petrescu, J., Kang, K., Alkaslasi, M. R., Lee, D. I., Hasan, S., Galuta, A., et al. (2023) · Neuron · doi:10.1016/j.neuron.2023.01.007 · Cited by 220
Self-citationTrem2 promotes foamy macrophage lipid uptake and survival in atherosclerosis
Patterson, M. T., Firulyova, M. M., Xu, Y., Hillman, H., Bishop, C., Zhu, A., Hickok, G. H., Schrank, P. R., Ronayne, C. E., Caillot, Z., et al. (2023) · Nature Cardiovascular Research · doi:10.1038/s44161-023-00354-3 · Cited by 204
“Because differential expression tests in scRNA-seq are biased and prone to report many false positives 55 , we decided to use the pseudobulk approach to test differential expression using DESeq2.”
MethodFan, Y., Bian, X., Meng, X., Li, L., Fu, L., Zhang, Y., Wang, L., Zhang, Y., Gao, D., Guo, X., et al. (2024) · Annals of the Rheumatic Diseases · doi:10.1136/ard-2023-224420 · Cited by 191
Brassinosteroid gene regulatory networks at cellular resolution in the Arabidopsis root
Nolan, T. M., Vukašinović, N., Hsu, C., Zhang, J., Vanhoutte, I., Shahan, R., Taylor, I. W., Greenstreet, L., Heitz, M., Afanassiev, A., et al. (2023) · Science · doi:10.1126/science.adf4721 · Cited by 188
Accurate and fast cell marker gene identification with COSG
Dai, M., Pei, X., & Wang, X. (2022) · Briefings in Bioinformatics · doi:10.1093/bib/bbab579 · Cited by 160
Upper cortical layer–driven network impairment in schizophrenia
Batiuk, M. Y., Tyler, T., Dragičević, K., Mei, S., Rydbirk, R., Petukhov, V., Deviatiiarov, R. M., Sedmak, D., Frank, E., Feher, V., et al. (2022) · Science Advances · doi:10.1126/sciadv.abn8367 · Cited by 151
Squair, J. W., Milano, M., de Coucy, A., Gautier, M., Skinnider, M. A., James, N. D., Cho, N., Lasne, A., Kathe, C., Hutson, T. H., et al. (2023) · Science · doi:10.1126/science.adi6412 · Cited by 149
Self-citationZhang, J. M., Ubas, A. A., de Borja, R., Svensson, V., Thomas, N., Thakar, N., Lai, I. K., Winters, A. F., Khan, U., Jones, M. G., et al. (2025) · bioRxiv (Cold Spring Harbor Laboratory) · doi:10.1101/2025.02.20.639398 · Cited by 146
“UMI counts for single cells in plate 6 (7,285,856 cells) and plate 14 (6,201,077 cells) were aggregated into 'pseudobulk' UMI counts for each (cell line, treatment) pair (Squair et al. 2021), yielding 4,800 pseudobulk profiles for plate 6 and 4,796 for plate 14.”
Nguyen, E. M., Taniguchi, H., Chan, J. M., Zhan, Y. A., Chen, X., Qiu, J. J., de Stanchina, E., Allaj, V., Shah, N., Uddin, F. Z., et al. (2022) · Journal of Thoracic Oncology · doi:10.1016/j.jtho.2022.05.014 · Cited by 144
Single-cell and spatial atlases of spinal cord injury in the Tabulae Paralytica
Skinnider, M. A., Gautier, M., Teo, A. Y. Y., Kathe, C., Hutson, T. H., Laskaratos, A., de Coucy, A., Regazzi, N., Aureli, V., James, N. D., et al. (2024) · Nature · doi:10.1038/s41586-024-07504-y · Cited by 137
“We then used the clustree package 15 to link clusters across adjacent resolutions into a hierarchical clustering tree, as previously described 8,30,48 .”
InfluentialSelf-citationBrowaeys, R., Gilis, J., Sang-aram, C., Bleser, P. D., Hoste, L., Tavernier, S. J., Lambrechts, D., Seurinck, R., & Saeys, Y. (2023) · bioRxiv (Cold Spring Harbor Laboratory) · doi:10.1101/2023.06.13.544751 · Cited by 136
Jakobsen, N. A., Turkalj, S., Zeng, A. G. X., Stoilova, B., Metzner, M., Rahmig, S., Nagree, M. S., Shah, S., Moore, R., Usukhbayar, B., et al. (2024) · Cell Stem Cell · doi:10.1016/j.stem.2024.05.010 · Cited by 130
Systematic benchmarking of imaging spatial transcriptomics platforms in FFPE tissues
Wang, H., Huang, R., Nelson, J., Gao, C., Tran, M., Yeaton, A. H., Krishna, S., Felt, K. D., Pfaff, K. L., Bowman, T., et al. (2025) · Nature Communications · doi:10.1038/s41467-025-64990-y · Cited by 138
Natural and targeted circuit reorganization after spinal cord injury
Anderson, M. A., Squair, J. W., Gautier, M., Hutson, T. H., Kathe, C., Barraud, Q., Bloch, J., & Courtine, G. (2022) · Nature Neuroscience · doi:10.1038/s41593-022-01196-1 · Cited by 126
Self-citationCaglayan, E., Liu, Y., & Konopka, G. (2022) · Neuron · doi:10.1016/j.neuron.2022.09.010 · Cited by 123
A comparison of marker gene selection methods for single-cell RNA sequencing data
Pullin, J. M., & McCarthy, D. J. (2022) · doi:10.1101/2022.05.09.490241 · Cited by 122
“In the context of scRNA-seq data, the 46 term DE gene does not have a unique meaning; it can refer to genes found in a comparison between cells 47 in different clusters in the same sample [12,13] or in the same cluster between different samples [4,14,15], or to 48 a comparison between arbitrary groups of cells [16].”
MethodMurphy, A. E., & Skene, N. (2022) · Nature Communications · doi:10.1038/s41467-022-35519-4 · Cited by 121
“Pseudobulk approaches were also found to be top performing in a recent review by Squair et al., 6 .”
Poscablo, D. M., Worthington, A. K., Smith‐Berdan, S., Rommel, M. G. E., Manso, B. A., Adili, R., Mok, L., Reggiardo, R. E., Cool, T., Mogharrab, R., et al. (2024) · Cell · doi:10.1016/j.cell.2024.04.018 · Cited by 120
A brain cell atlas integrating single-cell transcriptomes across human brain regions
Chen, X., Huang, Y., Huang, L., Huang, Z., Hao, Z.-Z., Xu, L., Xu, N., Li, Z., Mou, Y., Ye, M., et al. (2024) · Nature Medicine · doi:10.1038/s41591-024-03150-z · Cited by 118
Conserved and divergent gene regulatory programs of the mammalian neocortex
Zemke, N. R., Armand, E. J., Wang, W., Lee, S. Y., Zhou, J., Li, Y. E., Liu, H., Tian, W., Nery, J. R., Castanon, R., et al. (2023) · Nature · doi:10.1038/s41586-023-06819-6 · Cited by 117
“We performed analysis using previous recommendations 87 .”
MethodLuo, Y., Xia, Y., Liu, D., Li, X., Li, H., Liu, J., Zhou, D., Dong, Y. J., Li, X., Qian, Y., et al. (2024) · Cell · doi:10.1016/j.cell.2024.06.013 · Cited by 120
Single-cell transcriptomics reveal how root tissues adapt to soil stress
Zhu, M., Hsu, C., Ogorek, L. L. P., Taylor, I. W., Cavera, S. L., de Oliveira, D. M., Verma, L., Mehra, P., Mijar, M., Sadanandom, A., et al. (2025) · Nature · doi:10.1038/s41586-025-08941-z · Cited by 116
Junttila, S., Smolander, J., & Elo, L. L. (2022) · Briefings in Bioinformatics · doi:10.1093/bib/bbac286 · Cited by 109
“[10] compared naïve methods, pseudobulk methods and one mixed-model method (muscat_MM).”
MethodscPower accelerates and optimizes the design of multi-sample single cell transcriptomic studies
Schmid, K. T., Höllbacher, B., Cruceanu, C., Böttcher, A., Lickert, H., Binder, E. B., Theis, F. J., & Heinig, M. (2021) · Nature Communications · doi:10.1038/s41467-021-26779-7 · Cited by 108
Profound phenotypic and epigenetic heterogeneity of the HIV-1-infected CD4+ T cell reservoir
Wu, V. H., Nordin, J. M. L., Nguyen, S., Joy, J. P., Mampe, F., Estrada, P. M. D. R., Torres-Ruiz, F., González-Navarro, M., Luna-Villalobos, Y. A., Ávila‐Ríos, S., et al. (2022) · Nature Immunology · doi:10.1038/s41590-022-01371-3 · Cited by 103
“Manual annotations were then used to subset cells for downstream ADT differential expression analysis between HIV+ and HIV- cells using Seurat FindMarkers (using “DESeq2” for the findMarkerMethod parameter) to limit false discoveries (Squair et al., 2021) and the subset of features that were significantly different fr…”
MethodModelling viral encephalitis caused by herpes simplex virus 1 infection in cerebral organoids
Rybak‐Wolf, A., Wyler, E., Pentimalli, T. M., Legnini, I., Oliveras, A., Glažar, P., Loewa, A., Kim, S. J., Kaufer, B. B., Woehler, A., et al. (2023) · Nature Microbiology · doi:10.1038/s41564-023-01405-y · Cited by 100
An integrated cell atlas of the human lung in health and diseasePreprint
Sikkema, L., Strobl, D. C., Zappia, L., et al. (2022) · bioRxiv (Cold Spring Harbor Laboratory) · doi:10.1101/2022.03.10.483747 · Cited by 97
Diversity of Reactive Astrogliosis in CNS Pathology: Heterogeneity or Plasticity?
Moulson, A. J., Squair, J. W., Franklin, R. J. M., Tetzlaff, W., & Assinck, P. (2021) · Frontiers in Cellular Neuroscience · doi:10.3389/fncel.2021.703810 · Cited by 97
“, 2021b), and to avoid false positives that have the potential to drive research in unfruitful directions (Squair et al., 2021).”
BackgroundSelf-citationDu, H., Li, S., Lu, J., Tang, L.-Z., Jiang, X., He, X., Liang, J., Liao, X., Cui, T., Huang, Y., et al. (2023) · Burns & Trauma · doi:10.1093/burnst/tkad020 · Cited by 91
“HDMECs were isolated from the total cells and subjected to differential gene expression analysis using the pseudobulk method [28].”
MethodTzec-Interián, J. A., González‐Padilla, D., & Góngora‐Castillo, E. (2025) · Quantitative Biology · doi:10.1002/qub2.78 · Cited by 89
snRNA-seq stratifies multiple sclerosis patients into distinct white matter glial responses
Macnair, W., Calini, D., Agirre, E., Bryois, J., Jäkel, S., Smith, R. S., Kukanja, P., Stokar-Regenscheit, N., Ott, V., Foo, L. C., et al. (2025) · Neuron · doi:10.1016/j.neuron.2024.11.016 · Cited by 88
Delineating mouse β-cell identity during lifetime and in diabetes with a single cell atlas
Hrovatin, K., Bastidas-Ponce, A., Bakhti, M., Zappia, L., Büttner, M., Salinno, C., Sterr, M., Böttcher, A., Migliorini, A., Lickert, H., et al. (2023) · Nature Metabolism · doi:10.1038/s42255-023-00876-x · Cited by 89
Seyfferth, C., Eekhout, T., Shi, D., Neumann, M., Berg, L. S., Ke, Y., Shahan, R., Cox, K. L., Gómez-Cano, F., Nelissen, H., et al. (2024) · The Plant Cell · doi:10.1093/plcell/koae003 · Cited by 88
“This higher coverage in turn helps to outweigh the bias of differential expression analysis tools toward highly expressed genes ( Squair et al. 2021) and data set-specific noise (Fischer and Gillis 2021).”
BackgroundJackson, Z., Hong, C., Schauner, R., Dropulić, B., Caimi, P. F., Lima, M. J. G. D., Giraudo, M. F., Gupta, K., Reese, J., Hwang, T. H., et al. (2022) · Cancer Discovery · doi:10.1158/2159-8290.cd-21-1586 · Cited by 85
Asian diversity in human immune cells
Kock, K. H., Tan, L. M., Han, K. Y., Ando, Y., Jevapatarakul, D., Chatterjee, A., Lin, Q. X. X., Buyamin, E. V., Sonthalia, R., Rajagopalan, D., et al. (2025) · Cell · doi:10.1016/j.cell.2025.02.017 · Cited by 85
Pertpy: an end-to-end framework for perturbation analysis
Heumos, L., Ji, Y., May, L. T., Green, T. D., Peidli, S., Zhang, X., Wu, X., Ostner, J., Schumacher, A., Hrovatin, K., et al. (2025) · Nature Methods · doi:10.1038/s41592-025-02909-7 · Cited by 85
Transcriptional linkage analysis with in vivo AAV-Perturb-seq
Santinha, A. J., Klingler, E., Kuhn, M., Farouni, R., Lagler, S., Kalamakis, G., Lischetti, U., Jabaudon, D., & Platt, R. J. (2023) · Nature · doi:10.1038/s41586-023-06570-y · Cited by 84
“We used pseudobulk rather than single-cell-specific methods given that it is less biased towards highly expressed genes and less prone to false-positives 20 (Extended Data Fig.”
MethodCD200+ fibroblasts form a pro-resolving mesenchymal network in arthritis
Rauber, S., Mohammadian, H., Schmidkonz, C., Atzinger, A., Soare, A., Treutlein, C., Kemble, S., Mahony, C. B., Geisthoff, M., Angeli, M. R., et al. (2024) · Nature Immunology · doi:10.1038/s41590-024-01774-4 · Cited by 83
“To avoid analytical bias due to unrelated exclusion of certain fibroblast subtypes 21 , we integrated 33 scRNA-seq datasets (newly generated and existing public datasets; Supplementary Table 1 and Supplementary Fig 1a–e) from different arthritis models and their controls, resulting in a total of…”
Lee, C. Y. C., Kennedy, B. C., Richoz, N., Dean, I., Tuong, Z. K., Gaspal, F., Li, Z., Willis, C., Hasegawa, T., Whiteside, S. K., et al. (2024) · Nature Communications · doi:10.1038/s41467-024-44787-1 · Cited by 82
Wang, N., Zhang, S., Langfelder, P., Ramanathan, L., Gao, F., Plascencia, M., Vaca, R., Gu, X., Deng, L., Dionisio, L. E., et al. (2025) · Cell · doi:10.1016/j.cell.2025.01.031 · Cited by 84
“…genotypes (Figure S2D), and Q140/Msh3-hom significantly move the dysregulated transcriptomes in MSNs toward those of WT. Pseudobulk DEG analyses 30,31 (Figure 2D; Figure S2E; Table S3; STAR Methods) revealed 3,145 and 2,641 DEGs, respectively (FDR < 0.1; Figure 2D) in D1-and D2-MSN clusters…”
InfluentialBenchmarking integration of single-cell differential expression
Hai, N. C. T., Baik, B., Yoon, S., Park, T., & Nam, D. (2023) · Nature Communications · doi:10.1038/s41467-023-37126-3 · Cited by 78
“We also tested pseudobulk methods which exhibited good false discovery controls and overall discriminatory abilities in a recent study 26 .”
MethodInfluentialTosoni, G., Ayyildiz, D., Bryois, J., Macnair, W., Fitzsimons, C. P., Lucassen, P. J., & Salta, E. (2023) · Neuron · doi:10.1016/j.neuron.2023.03.010 · Cited by 79
“Overall, the discrepancies across datasets (Figure S4) may indicate that distinct studies, using different sample stratification, sampling and lysis protocols, and computational pipelines, either identify diverse subpopulations and cell states involved in the neurogenic process or, alternatively, detect the same popul…”
ResultMetacells untangle large and complex single-cell transcriptome networks
Bilous, M., Tran, L., Cianciaruso, C., Gabriel, A. A., Michel, H., Carmona, S. J., Pittet, M. J., & Gfeller, D. (2022) · BMC Bioinformatics · doi:10.1186/s12859-022-04861-1 · Cited by 75
“To this end, we capitalized on a dataset ( Mouse_DE ) generated to benchmark DE between conditions (treated vs untreated) in scRNA-seq data compared to bulk RNA-seq [35].”
MethodPathophysiological insights into HFpEF from studies of human cardiac tissue
Fayyaz, A. U., Eltony, M., Prokop, L. J., Koepp, K. E., Borlaug, B. A., Dasari, S., Bois, M. C., Margulies, K. B., Maleszewski, J. J., Wang, Y., et al. (2024) · Nature Reviews Cardiology · doi:10.1038/s41569-024-01067-1 · Cited by 75
“The analytical techniques for such multiomics approaches are complex, omics method-dependent and beyond the scope of this Review, but require thorough consideration of sample size and care to differentiate between normal biological variability and pathophysiological changes 103–106 .”
Taniguchi, H., Chakraborty, S., Takahashi, N., Banerjee, A., Caeser, R., Zhan, Y. A., Tischfield, S. E., Chow, A. T., Nguyen, E. M., Quintanal-Villalonga, À., et al. (2024) · Science Advances · doi:10.1126/sciadv.ado4618 · Cited by 75
Hoffman, G. E., Lee, D., Bendl, J. M., Prashant, N. M., Hong, A., Casey, C., Alvia, M., Shao, Z., Argyriou, S., Therrien, K., et al. (2026) · Nature Communications · doi:10.1038/s41467-026-75680-8 · Cited by 75
Hautz, T., Salcher, S., Fodor, M., Sturm, G., Ebner, S., Mair, A., Trebo, M., Untergasser, G., Sopper, S., Cardini, B., et al. (2023) · Nature Communications · doi:10.1038/s41467-023-37674-8 · Cited by 74
“We used DESeq2 93 on pseudo-bulk samples for differential expression testing which has been demonstrated to perform well and properly correct for false discoveries 94 .”
Generating human neural diversity with a multiplexed morphogen screen in organoids
Amin, N. D., Kelley, K. W., Kaganovsky, K., Onesto, M. M., Hao, J., Miura, Y., McQueen, J. P., Reis, N., Narazaki, G., Li, T., et al. (2024) · Cell stem cell · doi:10.1016/j.stem.2024.10.016 · Cited by 72
Rodríguez-Quiroz, R., & Valdebenito‐Maturana, B. (2022) · Communications Biology · doi:10.1038/s42003-022-04020-5 · Cited by 71
“To this end, we adopted a pseudobulk approach in which expression of genes and TEs per each cell cluster was aggregated, and then, edgeR was used to statistically test for differences (method reviewed by Squair et al. 45 ).”
MethodVanrobaeys, Y. S., Peterson, Z. J., Walsh, E. N., Chatterjee, S., Lin, L., Lyons, L. C., Nickl‐Jockschat, T., & Abel, T. G. (2023) · Nature Communications · doi:10.1038/s41467-023-42751-z · Cited by 75
“Rank-sum tests have been the most widely used approach in the fi eld of single-cell transcriptomics 70 because it is assumed that every cell (or spot for spatial transcriptomics) is an identical replicate that de fi nes the sample size of the statistics and this approach generates fewer false…”
Bailey, J. I., Puritz, C. H., Senkow, K. J., Markov, N. S., Diaz, E., Jonasson, E., Yu, Z., Swaminathan, S., Lu, Z., Fenske, S. W., et al. (2024) · Nature Immunology · doi:10.1038/s41590-024-01975-x · Cited by 71
“To take advantage of the multiple participants in each condition and avoid P -value inflation inherent to approaches where each cell is treated as an independent observation, we summed RNA transcript counts for each participant on a per-cell-type level (pseudobulk approach) 58 .”
MethodA genetic disorder reveals a hematopoietic stem cell regulatory network co-opted in leukemia
Voit, R. A., Tao, L., Yu, F., Cato, L. D., Cohen, B., Fleming, T. J., Antoszewski, M., Liao, X., Fiorini, C., Nandakumar, S. K., et al. (2022) · Nature Immunology · doi:10.1038/s41590-022-01370-4 · Cited by 70
Transcriptome-wide analysis of differential expression in perturbation atlases
Nadig, A., Replogle, J. M., Pogson, A. N., Murthy, M., McCarroll, S. A., Weissman, J. S., Robinson, E. B., & O’Connor, L. J. (2025) · Nature Genetics · doi:10.1038/s41588-025-02169-3 · Cited by 70
“In single-cell differential expression analyses, a failure to account for biological variability across supracellular sampling units (that is animal, donor, and so on) can lead to overestimation of effects; this phenomenon is referred to as ‘pseudoreplication bias’ 36,37 .”
Glioma-neuronal circuit remodeling induces regional immunosuppression
Nejo, T., Krishna, S., Yamamichi, A., Lakshmanachetty, S., Jimenez, C., Lee, K. Y., Baker, D. L., Young, J. S., Chen, T., Phyu, S. M., et al. (2025) · Nature Communications · doi:10.1038/s41467-025-60074-z · Cited by 72
“Additionally, gene signature score analysis was also performed with pseudo-bulk approach 65 .”
Jiang, L., Dalgarno, C., Papalexi, E., Mascio, I., Wessels, H., Yun, H., Iremadze, N., Lithwick‐Yanai, G., Lipson, D., & Satija, R. (2025) · Nature Cell Biology · doi:10.1038/s41556-025-01622-z · Cited by 77
Defining and benchmarking open problems in single-cell analysis
Luecken, M. D., Gigante, S., Burkhardt, D. B., Cannoodt, R., Strobl, D. C., Markov, N. S., Zappia, L., Palla, G., Lewis, W., Dimitrov, D., et al. (2025) · Nature Biotechnology · doi:10.1038/s41587-025-02694-w · Cited by 77
Gustafsson, J., Anton, M., Roshanzamir, F., Jörnsten, R. J., Kerkhoven, E. J., Robinson, J. L., & Nielsen, J. (2023) · Proceedings of the National Academy of Sciences · doi:10.1073/pnas.2217868120 · Cited by 69
“For example, differential expression analysis with single-cell data is known to produce false positives if the variation is measured across cells when not accounting for sample origin (22).”
BackgroundscRNA‐seq data analysis method to improve analysis performance
Lu, J., Sheng, Y., Qian, W., Pan, M., Zhao, X., & Ge, Q. (2023) · IET Nanobiotechnology · doi:10.1049/nbt2.12115 · Cited by 66
“, for differential expression analysis [78].”
Decoding gene regulation in the mouse embryo using single-cell multi-omicsPreprint
Argelaguet, R., Lohoff, T., Li, J., Nakhuda, A., Drage, D., Krueger, F., Velten, L., Clark, S. J., & Reik, W. (2022) · bioRxiv (Cold Spring Harbor Laboratory) · doi:10.1101/2022.06.15.496239 · Cited by 64
“11.0)(Thorvaldsdottir et al., 2013) Differential RNA expression and chromatin accessibility Following the guidelines from previous studies (Squair et al., 2021), we performed differential analysis using pseudo-bulk replicates for each cell type (and genotype, in the Brachyury KO study).”
BackgroundMethodInfluentialVoigt, A. P., Mullin, N. K., Mulfaul, K., Lozano, L. P., Wiley, L. A., Flamme‐Wiese, M. J., Boese, E. A., Han, I. C., Scheetz, T. E., Stone, E. M., et al. (2022) · Human Molecular Genetics · doi:10.1093/hmg/ddac043 · Cited by 64
“In a recent experiment, scRNA-seq was used to compare gene expression between severe spinal cord contusion (n = 3) and control (n = 3) mice from the same genetic background (57).”
BackgroundMethodNeuronal identity defines α-synuclein and tau toxicity
Praschberger, R., Kuenen, S., Schoovaerts, N., Kaempf, N., Singh, J., Janssens, J., Swerts, J., Nachman, E., Calatayud, C., Aerts, S., et al. (2023) · Neuron · doi:10.1016/j.neuron.2023.02.033 · Cited by 66
Stepwise-edited, human melanoma models reveal mutations’ effect on tumor and microenvironment
Hodis, E., Triglia, E. T., Kwon, J., Biancalani, T., Zakka, L. R., Parkar, S., Hütter, J.-C., Buffoni, L., Delorey, T. M., Phillips, D., et al. (2022) · Science · doi:10.1126/science.abi8175 · Cited by 61
Identification of visual cortex cell types and species differences using single-cell RNA sequencing
Wei, J.-R., Hao, Z.-Z., Xu, C., Huang, M., Tang, L., Xu, N., Liu, R., Shen, Y., Teichmann, S. A., Miao, Z., et al. (2022) · Nature Communications · doi:10.1038/s41467-022-34590-1 · Cited by 61
Single nuclei transcriptomics in human and non-human primate striatum in opioid use disorder
Phan, B. N., Ray, M. H., Xue, X., Fu, C., Fenster, R. J., Kohut, S. J., Bergman, J., Haber, S. N., McCullough, K. M., Fish, M. K., et al. (2024) · Nature Communications · doi:10.1038/s41467-024-45165-7 · Cited by 63
Chang, H.-W., Lee, E. M., Wang, Y., Zhou, C., Pruss, K. M., Henrissat, S., Chen, R. Y., Kao, C.-Y., Hibberd, M. C., Lynn, H. M., et al. (2024) · Nature Microbiology · doi:10.1038/s41564-024-01628-7 · Cited by 60
“Cross-condition differential gene expression analysis was performed based on a ‘pseudobulk’ strategy: for each cell cluster, gene counts were aggregated to obtain sample-level counts; each pseudo-bulked sample served as an input for edgeR-based differential gene expression analysis 65,66 .”
Tillmon, H., Soteros, B. M., Shen, L., Cong, Q., Wollet, M., General, J., Chin, H., Lee, J. B., Carreno, F. R., Morilak, D. A., et al. (2024) · Nature Communications · doi:10.1038/s41467-024-54007-5 · Cited by 58
“Pseudobulk analysis of differentially expressed genes (DEGs) between thecontrolandCORTconditionswereperformedwithLibra 118 withthe edgeR-LRT algorithm, and the results were plotted in a volcano plot using the EnhancedVolcano R package 119 .”
ASGARD is a single-cell guided pipeline to aid repurposing of drugs
He, B., Xiao, Y., Liang, H., Huang, Q., Du, Y., Li, Y., Garmire, D., Sun, D., & Garmire, L. X. (2023) · Nature Communications · doi:10.1038/s41467-023-36637-3 · Cited by 57
Boyeau, P., Regier, J., Gayoso, A., Jordan, M. I., Lopez, R., & Yosef, N. (2023) · Proceedings of the National Academy of Sciences · doi:10.1073/pnas.2209124120 · Cited by 56
Andreadou, M., Ingelfinger, F., Feo, D. D., Cramer, T. L. M., Tuzlak, S., Friebel, E., Schreiner, B., Eede, P., Schneeberger, S., Geesdorf, M., et al. (2023) · Nature Neuroscience · doi:10.1038/s41593-023-01435-z · Cited by 56
Valkiers, S., de Vrij, N., Gielis, S., Verbandt, S., Ogunjimi, B., Laukens, K., & Meysman, P. (2022) · ImmunoInformatics · doi:10.1016/j.immuno.2022.100009 · Cited by 56
Chou, E. L., Chaffin, M. D., Simonson, B., Pirruccello, J. P., Akkad, A.-D., Nekoui, M., Cardenas, C. L. L., Bedi, K. C., Nash, C. A., Juric, D., et al. (2022) · Arteriosclerosis Thrombosis and Vascular Biology · doi:10.1161/atvbaha.122.317953 · Cited by 56
HumanIslets.com: Improving accessibility, integration, and usability of human research islet data
Ewald, J., Lu, Y. P., Ellis, C. E., Worton, J., Kolic, J., Sasaki, S., Zhang, D., dos Santos, T., Spigelman, A. F., Bautista, A., et al. (2024) · Cell Metabolism · doi:10.1016/j.cmet.2024.09.001 · Cited by 54
Liu, X., Yuan, M., Xiang, Q., Li, Z., Xu, F., Chen, W., Chen, J., Huang, J., Yu, N., Zhou, Z., et al. (2022) · Cell Discovery · doi:10.1038/s41421-022-00402-5 · Cited by 55
A single-cell atlas of IL-23 inhibition in cutaneous psoriasis distinguishes clinical response
Wu, D., Hailer, A., Wang, S., Yuan, M., Chan, J. S., Kurdi, A., Han, D., Ali, H., D’Angio, H. B., Mayer, A. T., et al. (2024) · Science Immunology · doi:10.1126/sciimmunol.adi2848 · Cited by 53
“Differential expression analysis was performed between disease groups on a per cluster basis using edgeR on patient-level pseudo-bulk data ( 35 ).”
Methodİş, Ö., Wang, X., Reddy, J. S., Min, Y., Yılmaz, E., Bhattarai, P., Patel, T., Bergman, J., Quicksall, Z., Heckman, M. G., et al. (2024) · Nature Communications · doi:10.1038/s41467-024-48926-6 · Cited by 55
“Given the increased number of participants in this integrated analysis, we applied negative binomial generalized linear mixed effects model for differential expression analysis 117 .”
Pauli, J., Garger, D., Peymani, F., Wettich, J. L., Sachs, N., Wirth, J., Steiger, K., Hillig, C., Zhang, H., Tabas, I. A., et al. (2025) · Nature Communications · doi:10.1038/s41467-025-67679-4 · Cited by 52
Interneuron diversity in the human dorsal striatum
Garma, L. D., Harder, L., Barba-Reyes, J. M., Salas, S. M., Díez-Salguero, M., Nilsson, M. F., Serrano‐Pozo, A., Hyman, B. T., & Muñoz‐Manchado, A. B. (2024) · Nature Communications · doi:10.1038/s41467-024-50414-w · Cited by 56
“The Libra python library 85 was used to perform the data aggregation and the differential expression analysis, whichwasdone using the edgeR-LRT method 86 .”
Advances in single-cell long-read sequencing technologies
Gupta, P., O’Neill, H., Wolvetang, E. J., Chatterjee, A., & Gupta, I. (2024) · NAR Genomics and Bioinformatics · doi:10.1093/nargab/lqae047 · Cited by 51
“Differential gene expression analysis on single-cell data (short-read) poses significant challenges owing to low expression and variability, which requires judicious selection of the best-suited method ( 98 ).”
MethodGuess, T. E., Potts, C. R., Bhat, P., Cartailler, J. A., Brooks, A., Holt, C., Yenamandra, A., Wheeler, F. C., Savona, M. R., Cartailler, J.-P., et al. (2022) · Blood Cancer Discovery · doi:10.1158/2643-3230.bcd-21-0128 · Cited by 50
Towards a consensus atlas of human and mouse adipose tissue at single-cell resolution
Loft, A., Emont, M. P., Weinstock, A., Divoux, A., Ghosh, A., Wagner, A., Hertzel, A. V., Maniyadath, B., Deplancke, B., Liu, B., et al. (2025) · Nature Metabolism · doi:10.1038/s42255-025-01296-9 · Cited by 53
Revealing cell vulnerability in Alzheimer’s disease by single-cell transcriptomics
Saura, C. A., Deprada-Fernandez, Á., Capilla-López, M. D., & Parra‐Damas, A. (2022) · Seminars in Cell and Developmental Biology · doi:10.1016/j.semcdb.2022.05.007 · Cited by 48
Hoffman, G. E., Lee, D., Bendl, J. M., et al. (2023) · bioRxiv (Cold Spring Harbor Laboratory) · doi:10.1101/2023.03.17.533005 · Cited by 48
“Yet statistical modeling of cell-level counts is challenging due to the low read depth and pervasive dropout effects 18,21 , and it is essential to model the fact that multiple cells are sampled from the same subject 19,20,22 .”
Immune checkpoint landscape of human atherosclerosis and influence of cardiometabolic factors
Durán, J. G. B., Das, D., Gildea, M. A., Amadori, L., Gourvest, M., Kaur, R., Eberhardt, N., Smyrnis, P., Cılhoroz, B., Sajja, S., et al. (2024) · Nature Cardiovascular Research · doi:10.1038/s44161-024-00563-4 · Cited by 48
“Canonical marker gene expression computed via the pseudobulk method developed by Squair et al. 76 was used to identify and label the subclusters found within each major cell group.”
Mitchel, J., Gordon, M. G., Perez, R. K., Biederstedt, E., Bueno, R., Ye, C., & Kharchenko, P. V. (2024) · Nature Biotechnology · doi:10.1038/s41587-024-02411-z · Cited by 48
Phillips, R. A., Tuscher, J. J., Fitzgerald, N. D., Wan, E., Zipperly, M. E., Duke, C. G., Ianov, L., & Day, J. J. (2023) · Molecular and Cellular Neuroscience · doi:10.1016/j.mcn.2023.103849 · Cited by 49
Metadata
- Authors
- Squair, J. W., Gautier, M., Kathe, C., Anderson, M. A., James, N. D., Hutson, T. H., Hudelle, R., Qaiser, T., Matson, K. J. E., Barraud, Q., Levine, A. J., La Manno, G., Skinnider, M. A., & Courtine, G.
- Affiliations
- University of British Columbia (CA)
- Centre Hospitalier Universitaire Vaudois (CH)
- National Institute of Neurological Disorders and Stroke (US)
- Corresponding author
- Skinnider, Michael A.
- Courtine, Grégoire
- ORCID
- Venue
- Nature Communications
- Publisher
- openRxiv
- Published
- 2021-03-12
- Volume
- 12
- Issue
- 1
- Pages
- 5692-5692
- ISSN
- 2041-1723 (ISSN-L)
- PMC
- PMC8479118
- OpenAlex
- W3202649987
- Cited by
- 1,086
- References
- 104
- Citations by year
- 2026: 396 · 2025: 214 · 2024: 231 · 2023: 145 · 2022: 86 · 2021: 12
- FWCI
- 34.62
- Type
- journal article
- Language
- en
- Open access
- gold
- doi.org
- Licence
- Locations
- Nature Communications (publishedVersion, cc-by)
- bioRxiv (Cold Spring Harbor Laboratory) (submittedVersion)
- PubMed Central (publishedVersion, cc-by)
- PubMed (publishedVersion)
- SERVAL (Université de Lausanne) (publishedVersion, cc-by)
- IRIS (submittedVersion, cc-by)
- RePEc: Research Papers in Economics (submittedVersion)
- DOAJ (DOAJ: Directory of Open Access Journals) (submittedVersion, cc-by-sa)
- Infoscience (Ecole Polytechnique Fédérale de Lausanne) (submittedVersion, cc-by-nc-nd)
- Funders
- National Science Foundation
- Wings for Life
- Compute Canada
- Western Canada Research Grid
- Wyss Center for Bio and Neuroengineering
- Schweizerischer Nationalfonds zur Förderung der Wissenschaftlichen Forschung (185728, 192558, 193445, 190495, 310030)
- University of British Columbia
- National Institutes of Health
- Canadian Institutes of Health Research
- National Supercomputing Center, Korea Institute of Science and Technology Information
- National Institute of Neurological Disorders and Stroke
- H2020 European Research Council (682999)
- Topics
- Life Sciences › Biochemistry, Genetics and Molecular Biology › Molecular Biology › Single-cell and spatial transcriptomics
- Life Sciences › Biochemistry, Genetics and Molecular Biology › Molecular Biology › Gene expression and cancer classification
- Life Sciences › Biochemistry, Genetics and Molecular Biology › Molecular Biology › Bioinformatics and Genomic Networks
- Keywords
- single-cell differential expression, false discovery, biological replicates, comparison of statistical methods, differentially expressed genes, spinal cord injury, mouse spinal cord, cell type-specific responses, false positives
- MeSH terms
- Data Accuracy, Biological Variation, Population, Biological Variation, Individual, RNA-Seq, Animals, Gene Expression Regulation, Humans, Rabbits, Swine, Models, Statistical, Mice, Rats, Single-Cell Analysis, Datasets as Topic
About these checks
Registry, retraction, Cites and statistics results are computed, not judged, with one exception: a printed reference that no index lists is read once by a model before it counts as a citation error. Claims are extracted by a model and kept only when their quote appears verbatim in the text; each cited source is then checked, with a model’s help, for whether it says what the claim relies on. Those verdicts can be wrong — read the claim’s quote and the cited source before relying on one.
A language model drew the claims from the paper on 2026-10-10, under version 3 of the claim definition (model deepseek-v4.1-flash, prompt extract-v3).
A second model labelled each claim on 2026-10-10 (model jev-1.13-20260917, definition revision gold-guideline-v0.2).
Cited sources are checked with a language model’s help (gpt-6-sol).
Statistics and arithmetic are recomputed, not judged.
Confidence bands are shown only for fields calibrated on our annotated test set. None is calibrated yet, so no band is shown.
What counts as a claim ›How we measure confidence ›How we check this ›
Are you an author, or do you see a problem with this page? Request a review
