

The DOI matches its Crossref record; 114 of the 114 references it cites were found in a registry or an index; 11 of the 88 sources its claims cite were checked for support.
scPower accelerates and optimizes the design of multi-sample single cell transcriptomic studies
Open accessPublished version of a preprint
Abstract
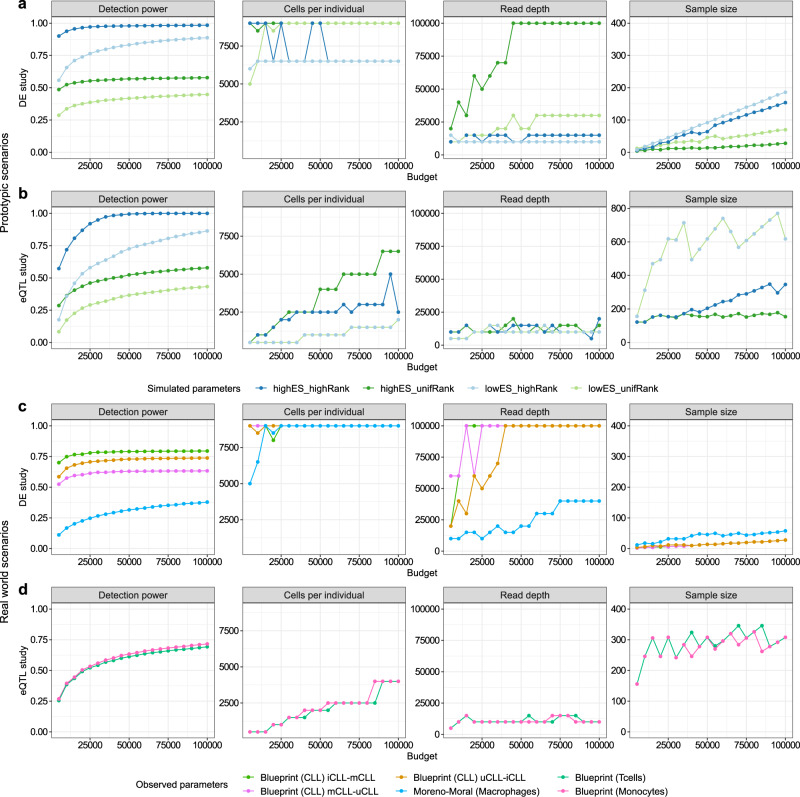
Single cell RNA-seq has revolutionized transcriptomics by providing cell type resolution for differential gene expression and expression quantitative trait loci (eQTL) analyses. However, efficient power analysis methods for single cell data and inter-individual comparisons are lacking. Here, we present scPower; a statistical framework for the design and power analysis of multi-sample single cell transcriptomic experiments. We modelled the relationship between sample size, the number of cells per individual, sequencing depth, and the power of detecting differentially expressed genes within cell types. We systematically evaluated these optimal parameter combinations for several single cell profiling platforms, and generated broad recommendations. In general, shallow sequencing of high numbers of cells leads to higher overall power than deep sequencing of fewer cells. The model, including priors, is implemented as an R package and is accessible as a web tool. scPower is a highly customizable tool that experimentalists can use to quickly compare a multitude of experimental designs and optimize for a limited budget.
Overview
AI snapshot
Written from the paper’s full text.
TL;DR
scPower is an analytic power-analysis framework for designing multi-sample single-cell transcriptomic experiments analyzed with pseudobulk, modeling sample size, cells per individual, and read depth to detect DEGs/eQTLs and rare cell types. It is implemented as an R package and web tool and is orders of magnitude faster than simulation-based methods.
Key findings
- Shallow sequencing of high numbers of cells generally yields higher overall power than deep sequencing of fewer cells; the number of cells per individual is a major determinant of power.
- Predicted and observed numbers of expressed genes were highly correlated (all r² > 0.9 in training and independent PBMC validation; r² = 0.995 for Drop-seq and r² = 0.991 for Smart-seq2).
- Example maximum overall detection power was 74% for DE genes (iCLL vs mCLL priors; 3000 cells per cell type and individual, total balanced sample size 20, FDR-adjusted) and 64% for eQTL genes (200 individuals, 3000 cells per cell type and individual; Blueprint T cell priors).
- Runtime and memory were much lower than simulations: Fig. 3c–e took 8 days for powsimR, 3 days for muscat, and less than a minute for scPower; 20 samples with 3000 cells per sample used 48 GB for powsimR and 35 GB for muscat versus few MB for scPower. Budget examples found optimal DE parameters of 1200 cells in 4 samples at 30,000 reads for 10,000€, and optimal eQTL parameters of 1500 cells in 242 samples at 10,000 reads for 30,000€.
Methods
- Analytic framework for pseudobulk multi-sample comparisons: models expression probability using negative binomial and gamma-mixture priors, and DE/eQTL power using negative binomial regression and linear models/F-tests with FDR or FWER adjustment.
- Priors were derived from single-cell atlases: 10X PBMC training data from 14 healthy individuals, an independent PBMC validation set, Drop-seq lung data, and Smart-seq2 pancreas data; effect sizes came from FACS-sorted bulk RNA-seq DEG and eQTL studies.
- Benchmarked against powsimR and muscat simulations and a self-implemented eQTL simulation; cost optimization evaluated sample size, cells per sample, and read depth under fixed budgets.
Limitations
- Stated: data-driven priors reliably assess power only for sample sizes smaller than or roughly equal to the pilot data; larger samples may identify new significant DEGs with lower effect sizes not included in the priors. Priors affect the optimal design and should be selected carefully.
- Stated: the pseudobulk approach requires a discrete cell type definition, so continuous annotations such as pseudotime would need discretization. The default doublet rate is a lower bound, and actual experiments may have higher doublet rates and fewer usable cells; expression threshold choice also influences optimal parameters.
- Stated: recommendations are optimized for differential expression between individuals; other applications such as co-expression analysis, rare cell type annotation, and variance QTL detection may have different optimal designs, and variance QTLs were not addressed due to lack of data-driven priors.
Model-written summary. Check it against the paper before relying on it.
Integrity signals
Registry
Cites
Statistics
Figures
Verification
Claims the paper makes
59 Not checked yet · 48 No basis given · 35 Own result · 33 Own interpretation · 22 Own method · 3 Supported · 2 Partly supported · 1 Supported so far · accuracy not yet measured
The cited sources support only part of this claim — read each source’s verdict below.
In the paper
“Two benchmarking studies, one applying the aforementioned simulation tool and one using different example data sets, demonstrated that the “pseudobulk” approach in combination with classical differential gene expression methods such as edgeR44 and limma-voom45 outperforms single cell specific methods and mixed models in multi sample DE analysis43,46.”
§ scPower accelerates and optimizes the design of multi-sample single cell transcriptomic studies > Introduction
What the sources say
- Partly supportedcites [43] Crowell, H. L. et al. muscat detects subpopulation-specific state transitions from multi-sample multi-condition single-cell transcriptomics data. Nat. Commun. 11, 6077 (2020). sourceExperimental — accuracy not yet measured
The Results (‘Aggregation vs. non-aggregation methods’) confirm that the benchmark tested pseudobulk counts with edgeR and limma-voom against single-cell methods. The Results (‘Performance of DS detection’) report that most pseudobulk approaches and cell-level mixed models performed generally well; pseudobulk methods were faster, but the paper does not establish the claimed blanket superiority over mixed models in differential-expression detection. (LLM, conf=0.84)
- Supportedcites [46] Squair, J. W. et al. Confronting false discoveries in single-cell differential expression. https://doi.org/10.1101/2021.03.12.435024. source
The Results section, “Pseudobulk methods outperform generic and specialized single-cell DE methods,” reports that all six top-performing methods aggregated cells by biological replicate and that methods comparing individual cells performed poorly. The Methods section, “Differential expression analysis methods,” identifies edgeR and limma-voom among the pseudobulk methods and a linear mixed model among the methods compared. (LLM, conf=0.92)
boosteddirect- Asserted: passes — The authors put it forward as true.
- Checkable: passes — It can be checked against evidence.
- Load-bearing: passes — The paper’s conclusions depend on it.
- Based: passes — The paper gives a reason why it holds.
- Partly supported
The cited sources support only part of this claim — read each source’s verdict below.
In the paper
“However, we observe in our own data set as well as in published studies47,78 slightly higher doublet rates than shown in77.”
§ scPower accelerates and optimizes the design of multi-sample single cell transcriptomic studies > Results > scPower maximizes detection power for a fixed budget by optimizing experimental parameters
What the sources say
- Supportedcites [47] Kang, H. M. et al. Multiplexed droplet single-cell RNA-sequencing using natural genetic variation. Nat. Biotechnol. 36, 89–94 (2018). source
The source reports doublet rates of 5.0%, 5.2%, and 7.1% in its assessment of real data, as well as higher rates under other loading conditions. The claim that the citing authors’ data and other studies show slightly higher rates is their comparison, not a finding attributed to this source. (LLM, conf=0.88)
- Partly supportedcites [78] van der Wijst, M. G. P. et al. Single-cell RNA sequencing identifies celltype-specific cis-eQTLs and co-expression QTLs. Nat. Genet. 50, 493–497 (2018). sourceExperimental — accuracy not yet measured
The Online Methods section on Demuxlet reports doublet rates of 17.5% and 21.1% in two sample pools, compared with an expected 3–4%. It attributes those unusually high rates to a probable sample mix-up and excludes the affected samples; it does not establish that ordinary doublet rates were only slightly higher than those in reference 77. (LLM, conf=0.83)
- Not checked yetcites [77] 10X Genomics. User Guides — 10x Genomics. 10x Genomics https://www.10xgenomics.com/resources/user-guides/ (2019).
plain- Asserted: passes — The authors put it forward as true.
- Checkable: passes — It can be checked against evidence.
- Load-bearing: passes — The paper’s conclusions depend on it.
- Based: passes — The paper gives a reason why it holds.
- Supported
Every source the paper cites for this claim was checked and supports it.
In the paper
“Most likely, multiple independent library preparations in individual cells lead to an improved sampling of the transcriptome as compared to fewer independent libraries sequenced more deeply, an effect that has previously been analyzed in the context of variant detection79.”
§ scPower accelerates and optimizes the design of multi-sample single cell transcriptomic studies > Discussion
What the sources say
- Supportedcites [79] Heinrich, V. et al. The allele distribution in next-generation sequencing data sets is accurately described as the result of a stochastic branching process. Nucleic Acids Res. 40, 2426–2431 (2012). source
The Results and Discussion section (‘Influence of allele frequency variance on error rates in heterozygous variant detection’; page unavailable) reports that, beyond 30× sequencing depth, deeper sequencing did not further reduce the false-negative rate, whereas technical replication did. The citation is attached to that previously analyzed effect in variant detection; the proposed application to transcriptome sampling is the citing authors’ own inference. (LLM, conf=0.91)
hedgeddirect- Asserted: passes — The authors put it forward as true.
- Checkable: passes — It can be checked against evidence.
- Load-bearing: unclear — It is unclear whether the paper’s conclusions depend on it.
- Based: passes — The paper gives a reason why it holds.
- Supported
The sources with a verdict support this claim; the rest weren’t checked yet, have no full text we could read, or their verdicts aren’t rated yet.
In the paper
“Specifically, we found the optimal read depths to be ~10,000 in most evaluations, which is relatively low compared to previous recommendations34–36,80,81.”
§ scPower accelerates and optimizes the design of multi-sample single cell transcriptomic studies > Discussion
What the sources say
- Supportedcites [34] Wu, A. R. et al. Quantitative assessment of single-cell RNA-sequencing methods. Nat. Methods 11, 41–46 (2014). source
The citing authors present ~10,000 reads as their own finding and cite this paper for the comparison with earlier sequencing depths. In Results, “Nanoliter sample preparation improves RNA-seq sensitivity,” the source reports that most genes were detected within 500,000 reads and detection approached saturation at roughly 2 million reads—both substantially above 10,000. (LLM, conf=0.87)
- Supportedcites [35] Svensson, V. et al. Power analysis of single-cell RNA-sequencing experiments. Nat. Methods 14, 381–387 (2017). source
The citation supports the comparison with previous recommendations, not the citing authors’ own finding of an optimum near 10,000 reads. In Results, the source recommends 1 million reads per sample as a target for saturated gene detection—substantially higher than 10,000. (LLM, conf=0.93)
- Supportedcites [36] Ziegenhain, C. et al. Comparative analysis of single-cell RNA sequencing methods. Mol. Cell 65, 631–643.e4 (2017). source
The cited paper is offered as a previous recommendation, not as the source of the citing authors’ ~10,000-read result. In “Single-Cell Libraries Are Sequenced to a Reasonable Level of Saturation at One Million Reads,” it calls one million reads per cell a reasonable sequencing depth, substantially higher than ~10,000. (LLM, conf=0.91)
- Supportedcites [80] Lafzi, A., Moutinho, C., Picelli, S. & Heyn, H. Tutorial: guidelines for the experimental design of single-cell RNA sequencing studies. Nat. Protoc. 13, 2742–2757 (2018). source
The citing authors describe ~10,000 reads as their own finding; this source is cited for the previous recommendations used for comparison. In “2. Single-cell RNA sequencing” (p. 10), the source gives depths below 100,000 reads per cell for high-throughput microfluidic experiments and approximately 500,000 for many microtiter-plate formats, supporting the comparison. (LLM, conf=0.90)
- Not checked yetcites [81] 10x Genomics. What is the recommended sequencing depth for Single Cell 3′ and 5' Gene Expression libraries? 10X Genomics https://kb.10xgenomics.com/hc/en-us/articles/115002022743-What-is-the-recommended-sequencing-depth-for-Single-Cell-3-and-5-Gene-Expression-libraries- (2020).
plain- Asserted: passes — The authors put it forward as true.
- Checkable: passes — It can be checked against evidence.
- Load-bearing: passes — The paper’s conclusions depend on it.
- Based: passes — The paper gives a reason why it holds.
- Supported
Every source the paper cites for this claim was checked and supports it.
In the paper
“The gene expression distribution of each cell type was modeled separately because there are deviations in RNA content between different cell types33.”
§ scPower accelerates and optimizes the design of multi-sample single cell transcriptomic studies > Methods > Expression probability model
What the sources say
- Supportedcites [33] Monaco, G. et al. RNA-Seq signatures normalized by mRNA abundance allow absolute deconvolution of human immune cell types. Cell Rep. 26, 1627–1640.e7 (2019). source
The Results section (Transcriptome Composition, mRNA Abundance; page not provided) states that total mRNA abundance can vary greatly among cell types. It also reports different RNA yields per cell across immune cell types, supporting the attributed claim. (LLM, conf=0.94)
plain- Asserted: passes — The authors put it forward as true.
- Checkable: passes — It can be checked against evidence.
- Load-bearing: passes — The paper’s conclusions depend on it.
- Based: passes — The paper gives a reason why it holds.
- Supported
The paper states this without a source or data behind it here, so there is nothing to check it against. The quote shows it is in the paper.
In the paper
“In general, shallow sequencing of high numbers of cells leads to higher overall power than deep sequencing of fewer cells.”
§ scPower accelerates and optimizes the design of multi-sample single cell transcriptomic studies > Abstract
plaindirect- Asserted: passes — The authors put it forward as true.
- Checkable: passes — It can be checked against evidence.
- Load-bearing: passes — The paper’s conclusions depend on it.
- Based: passes — The paper gives a reason why it holds.
A result the paper reports from its own data — it cites no other source for it, so there is none to check. The quote shows it is in the paper.
In the paper
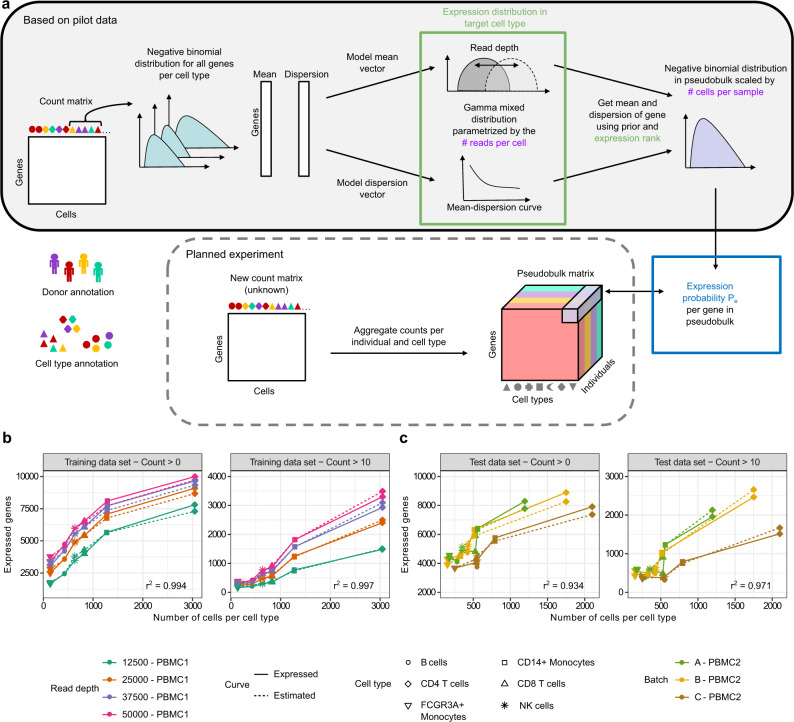
“The observed numbers of expressed genes (solid lines) are closely matched by the expectation under our model (dashed lines), shown here with example cutoffs of counts greater than ten and zero.”
§ scPower accelerates and optimizes the design of multi-sample single cell transcriptomic studies > Results > scPower accurately models the number of detectable genes per cell type
plaincorrelational- Asserted: passes — The authors put it forward as true.
- Checkable: passes — It can be checked against evidence.
- Load-bearing: passes — The paper’s conclusions depend on it.
- Based: passes — The paper gives a reason why it holds.
A result the paper reports from its own data — it cites no other source for it, so there is none to check. The quote shows it is in the paper.
In the paper
“The comparison for varying numbers of individuals shows that the number of cells required for each individual is most strongly affected by the frequency of the cell type and only to a smaller degree by the number of individuals.”
§ scPower accelerates and optimizes the design of multi-sample single cell transcriptomic studies > Results > Power analysis framework for scRNA-seq experimental design
plaindirect- Asserted: passes — The authors put it forward as true.
- Checkable: passes — It can be checked against evidence.
- Load-bearing: passes — The paper’s conclusions depend on it.
- Based: passes — The paper gives a reason why it holds.
A result the paper reports from its own data — it cites no other source for it, so there is none to check. The quote shows it is in the paper.
In the paper
“Subsampling of our data shows that the number of expressed genes per cell type depends on the number of cells of the cell type and the read depth (Fig. 2b, c).”
§ scPower accelerates and optimizes the design of multi-sample single cell transcriptomic studies > Results > scPower accurately models the number of detectable genes per cell type
plaincorrelational- Asserted: passes — The authors put it forward as true.
- Checkable: passes — It can be checked against evidence.
- Load-bearing: passes — The paper’s conclusions depend on it.
- Based: passes — The paper gives a reason why it holds.
In the paper
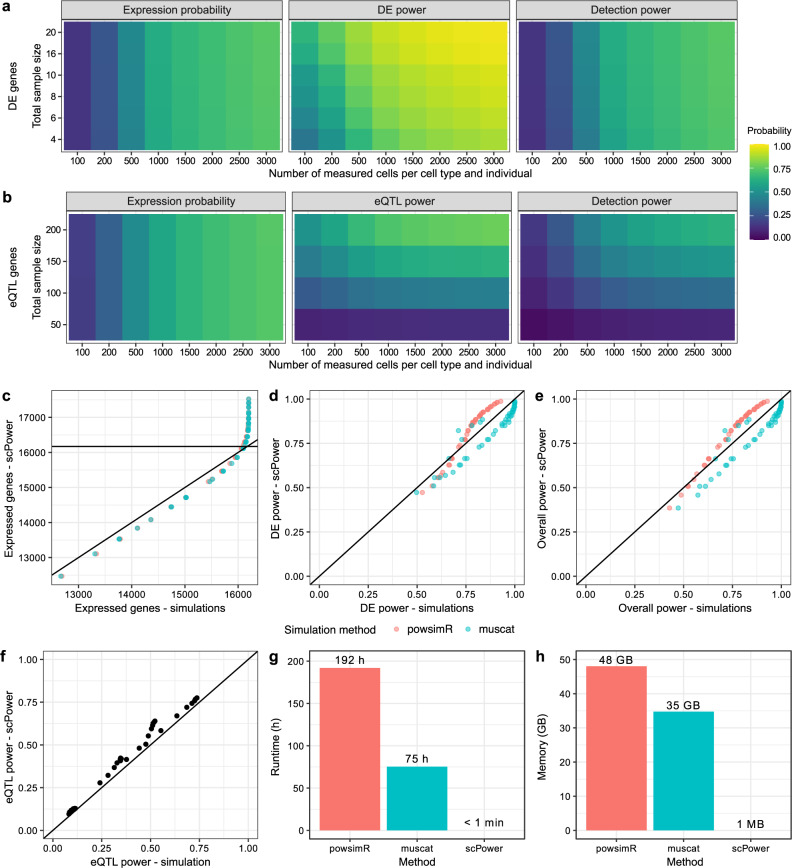
“Using fold changes from a study comparing CLL subtypes iCLL vs mCLL53 as effect size priors (sample size of 6, 84 DEGs with median absolute log fold change of 2.8) we find a maximum overall detection power of 74% (Fig. 3a).”
§ scPower accelerates and optimizes the design of multi-sample single cell transcriptomic studies > Results > scPower models the power to detect differentially expressed genes and expression quantitative trait genes
What the sources say
- Not checked yetcites [53] Rendeiro, A. F. et al. Chromatin accessibility maps of chronic lymphocytic leukaemia identify subtype-specific epigenome signatures and transcription regulatory networks. Nat. Commun. 7, 11938 (2016). source
plainn = 10- Asserted: passes — The authors put it forward as true.
- Checkable: passes — It can be checked against evidence.
- Load-bearing: unclear — It is unclear whether the paper’s conclusions depend on it.
- Based: passes — The paper gives a reason why it holds.
- Probably not a substantial claim. 63
- It may state two separate claims as one. 66
- The quote only partly states this claim. 2
Every source the paper cites for this claim was checked and supports it.
In the paper
“A first analytic exploration of different experimental designs for single cell eQTL studies showed the importance of the optimizing parameters for a restricted budget50, as shallow sequencing of more samples can increase the effective sample size.”
§ scPower accelerates and optimizes the design of multi-sample single cell transcriptomic studies > Introduction
What the sources say
- Supportedcites [50] Mandric, I. et al. Optimized design of single-cell RNA sequencing experiments for cell-type-specific eQTL analysis. Nat. Commun. 11, 5504 (2020). source
Split into 2 atoms — 2 confirmed, 0 partially supported, 0 disputed, 0 misattributed, 0 unverifiable. Expand the claim to see per-atom verdicts.
plaindirect- Asserted: passes — The authors put it forward as true.
- Checkable: passes — It can be checked against evidence.
- Load-bearing: passes — The paper’s conclusions depend on it.
- Based: passes — The paper gives a reason why it holds.
Probably not a substantial claim. It may state two separate claims as one.
- Supported
The paper states this without a source or data behind it here, so there is nothing to check it against. The quote shows it is in the paper.
In the paper
“For large mean values, the power is estimated analytically, for small mean values, this approximation can be imprecise and instead simulations are used that take the discrete nature of scRNA-seq into account.”
§ scPower accelerates and optimizes the design of multi-sample single cell transcriptomic studies > Results > scPower models the power to detect differentially expressed genes and expression quantitative trait genes
plaincorrelational- Asserted: passes — The authors put it forward as true.
- Checkable: passes — It can be checked against evidence.
- Load-bearing: passes — The paper’s conclusions depend on it.
- Based: passes — The paper gives a reason why it holds.
It may state two separate claims as one.
The paper states this without a source or data behind it here, so there is nothing to check it against. The quote shows it is in the paper.
In the paper
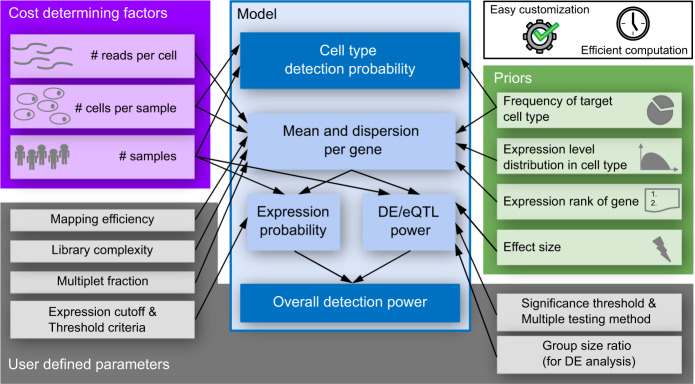
“In addition, both the expression probability and the DE/eQTL power depend on the mean and dispersion of expression levels of gene .”
§ scPower accelerates and optimizes the design of multi-sample single cell transcriptomic studies > Results > Power analysis framework for scRNA-seq experimental design
plaincorrelational- Asserted: passes — The authors put it forward as true.
- Checkable: passes — It can be checked against evidence.
- Load-bearing: passes — The paper’s conclusions depend on it.
- Based: unclear — It is unclear why the paper says it holds.
It may state two separate claims as one.
A result the paper reports from its own data — it cites no other source for it, so there is none to check. The quote shows it is in the paper.
In the paper
“For this parameter combination and prior, the DE power would reach even 98% for all DE genes of the study, however, only 74% are likely to be expressed.”
§ scPower accelerates and optimizes the design of multi-sample single cell transcriptomic studies > Results > scPower models the power to detect differentially expressed genes and expression quantitative trait genes
hedgedn = 10- Asserted: passes — The authors put it forward as true.
- Checkable: passes — It can be checked against evidence.
- Load-bearing: unclear — It is unclear whether the paper’s conclusions depend on it.
- Based: passes — The paper gives a reason why it holds.
It may state two separate claims as one.
A result the paper reports from its own data — it cites no other source for it, so there is none to check. The quote shows it is in the paper.
In the paper
“Similar detection ranges are found for the comparison of other CLL subtypes in the same study, while the detection power in a study of systemic sclerosis vs control were much lower with values up to 30% (Supplementary Fig. S10).”
§ scPower accelerates and optimizes the design of multi-sample single cell transcriptomic studies > Results > scPower models the power to detect differentially expressed genes and expression quantitative trait genes
plain- Asserted: passes — The authors put it forward as true.
- Checkable: passes — It can be checked against evidence.
- Load-bearing: unclear — It is unclear whether the paper’s conclusions depend on it.
- Based: passes — The paper gives a reason why it holds.
It may state two separate claims as one.
None of the sources cited for this claim have been checked yet.
In the paper
“In contrast to the other technologies, the Smart-seq2 data showed zero-inflation on the single cell level (see also68,69), but aggregation to pseudobulk removed the excess of zero values.”
§ scPower accelerates and optimizes the design of multi-sample single cell transcriptomic studies > Results > scPower models the power to detect differentially expressed genes and expression quantitative trait genes
What the sources say
plaindirect- Asserted: passes — The authors put it forward as true.
- Checkable: passes — It can be checked against evidence.
- Load-bearing: passes — The paper’s conclusions depend on it.
- Based: passes — The paper gives a reason why it holds.
It may state two separate claims as one.
A result the paper reports from its own data — it cites no other source for it, so there is none to check. The quote shows it is in the paper.
In the paper
“This power is reached with the experimental parameters of 3000 cells per cell type and individual, a total balanced sample size of 20, i.e., 10 individuals per group, and FDR adjusted p values.”
§ scPower accelerates and optimizes the design of multi-sample single cell transcriptomic studies > Results > scPower models the power to detect differentially expressed genes and expression quantitative trait genes
plaindirectn = 10- Asserted: passes — The authors put it forward as true.
- Checkable: passes — It can be checked against evidence.
- Load-bearing: unclear — It is unclear whether the paper’s conclusions depend on it.
- Based: passes — The paper gives a reason why it holds.
It may state two separate claims as one.
The paper states this without a source or data behind it here, so there is nothing to check it against. The quote shows it is in the paper.
In the paper
“In contrast to simulation-based methods, our analytic method can efficiently test a multitude of design options, making it suitable for the optimization of experimental parameters.”
§ scPower accelerates and optimizes the design of multi-sample single cell transcriptomic studies > Introduction
plaindirect- Asserted: passes — The authors put it forward as true.
- Checkable: passes — It can be checked against evidence.
- Load-bearing: passes — The paper’s conclusions depend on it.
- Based: passes — The paper gives a reason why it holds.
It may state two separate claims as one.
A result the paper reports from its own data — it cites no other source for it, so there is none to check. The quote shows it is in the paper.
In the paper
“Overall, the DE power increases with higher number of measured cells and higher sample sizes, while the expression probability is mainly influenced by the number of measured cells.”
§ scPower accelerates and optimizes the design of multi-sample single cell transcriptomic studies > Results > scPower models the power to detect differentially expressed genes and expression quantitative trait genes
plaindirectn = 10- Asserted: passes — The authors put it forward as true.
- Checkable: passes — It can be checked against evidence.
- Load-bearing: passes — The paper’s conclusions depend on it.
- Based: passes — The paper gives a reason why it holds.
It may state two separate claims as one.
The paper states this without a source or data behind it here, so there is nothing to check it against. The quote shows it is in the paper.
In the paper
“Furthermore, powsimR and muscat differ slightly, caused by different modelling assumptions.”
§ scPower accelerates and optimizes the design of multi-sample single cell transcriptomic studies > Results > scPower estimations are supported by simulations
plaindirect- Asserted: passes — The authors put it forward as true.
- Checkable: passes — It can be checked against evidence.
- Load-bearing: fails — The paper’s conclusions may not depend on it.
- Based: passes — The paper gives a reason why it holds.
Probably not a substantial claim. The paper’s conclusions may not depend on it.
The paper states this without a source or data behind it here, so there is nothing to check it against. The quote shows it is in the paper.
In the paper
“For our DE example, this results in a percentage threshold of 50% due to the balanced DE design.”
§ scPower accelerates and optimizes the design of multi-sample single cell transcriptomic studies > Results > scPower maximizes detection power for a fixed budget by optimizing experimental parameters
plaindirect- Asserted: passes — The authors put it forward as true.
- Checkable: passes — It can be checked against evidence.
- Load-bearing: fails — The paper’s conclusions may not depend on it.
- Based: passes — The paper gives a reason why it holds.
Probably not a substantial claim. The paper’s conclusions may not depend on it.
A result the paper reports from its own data — it cites no other source for it, so there is none to check. The quote shows it is in the paper.
In the paper
“Running simulations with different DE methods showed that the observed power also depends on analysis choices such as the DE method with scPower estimates being most accurate when using edgeR (Supplementary Fig. S13).”
§ scPower accelerates and optimizes the design of multi-sample single cell transcriptomic studies > Results > scPower estimations are supported by simulations
plaindirect- Asserted: passes — The authors put it forward as true.
- Checkable: passes — It can be checked against evidence.
- Load-bearing: unclear — It is unclear whether the paper’s conclusions depend on it.
- Based: passes — The paper gives a reason why it holds.
It may state two separate claims as one.
The paper states this without a source or data behind it here, so there is nothing to check it against. The quote shows it is in the paper.
In the paper
“In addition the installation of scPower is easier due to less dependencies: 11 dependencies of scPower vs. 82 dependencies of powsimR and 28 dependencies of muscat.”
§ scPower accelerates and optimizes the design of multi-sample single cell transcriptomic studies > Results > scPower estimations are supported by simulations
plaindirect- Asserted: passes — The authors put it forward as true.
- Checkable: passes — It can be checked against evidence.
- Load-bearing: fails — The paper’s conclusions may not depend on it.
- Based: passes — The paper gives a reason why it holds.
Probably not a substantial claim. The paper’s conclusions may not depend on it.
A result the paper reports from its own data — it cites no other source for it, so there is none to check. The quote shows it is in the paper.
In the paper
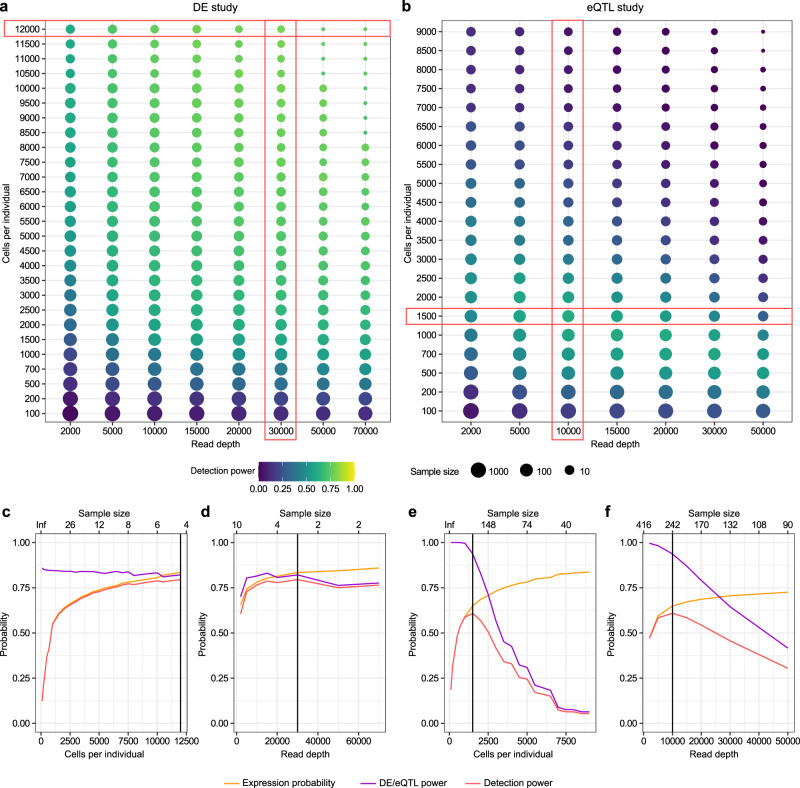
“For the DE study with this specific prior combination, the optimal parameters are measuring 1200 cells in 4 samples with a read depth of 30,000.”
§ scPower accelerates and optimizes the design of multi-sample single cell transcriptomic studies > Results > scPower maximizes detection power for a fixed budget by optimizing experimental parameters
plaindirectn = 4- Asserted: passes — The authors put it forward as true.
- Checkable: passes — It can be checked against evidence.
- Load-bearing: passes — The paper’s conclusions depend on it.
- Based: passes — The paper gives a reason why it holds.
The quote only partly states this claim.
- The authors state this as an assumption: The counts of each gene in each cell type follow a negative binomial distribution.
- The authors state this as an assumption: The sum of gene counts follows a negative binomial distribution with parameters altered by the number of cells per cell type and donor.
- The authors state this as an assumption: The distribution of mean values over all genes in a cell type is a mixture of a zero component and two left-censored gamma distributions.
- The authors state this as an assumption: The relationship between mean UMI counts per cell and the gamma parameters is linear.
- The authors state this as an assumption: The number of transcriptome mapped reads is linearly related to the logarithm of the mean UMI counts per cell, with increasing read depth leading to saturation of UMIs.
- The authors state this as an assumption: Overall detection power is the product of expression probability and power to detect DEGs/eQTLs, as both are conditionally independent given expression mean.
A result the paper reports from its own data — it cites no other source for it, so there is none to check. The quote shows it is in the paper.
In the paper
“For the simulation-based methods the memory requirements increase with larger sample size and numbers of cells, leading for example for 20 samples and 3000 cells per sample to 48GB used memory for powsimR and 35GB used memory for muscat compared to the parameter-independent requirements of scPower of few MB (Fig. 3h).”
§ scPower accelerates and optimizes the design of multi-sample single cell transcriptomic studies > Results > scPower estimations are supported by simulations
plaindirectn = 20- Asserted: passes — The authors put it forward as true.
- Checkable: passes — It can be checked against evidence.
- Load-bearing: passes — The paper’s conclusions depend on it.
- Based: passes — The paper gives a reason why it holds.
It may state two separate claims as one.
The paper states this without a source or data behind it here, so there is nothing to check it against. The quote shows it is in the paper.
In the paper
“but due to the fixed budget this goes hand in hand with measuring less samples which decreases the DE power.”
§ scPower accelerates and optimizes the design of multi-sample single cell transcriptomic studies > Results > scPower maximizes detection power for a fixed budget by optimizing experimental parameters
plaindirectn = 4- Asserted: passes — The authors put it forward as true.
- Checkable: passes — It can be checked against evidence.
- Load-bearing: passes — The paper’s conclusions depend on it.
- Based: passes — The paper gives a reason why it holds.
It may state two separate claims as one.
A result the paper reports from its own data — it cites no other source for it, so there is none to check. The quote shows it is in the paper.
In the paper
“The Blueprint eQTL data set also contains eQTLs from monocytes where we observe the same trend and found a maximal detection power of 65% (Supplementary Fig. S11).”
§ scPower accelerates and optimizes the design of multi-sample single cell transcriptomic studies > Results > scPower models the power to detect differentially expressed genes and expression quantitative trait genes
plain- Asserted: passes — The authors put it forward as true.
- Checkable: passes — It can be checked against evidence.
- Load-bearing: unclear — It is unclear whether the paper’s conclusions depend on it.
- Based: passes — The paper gives a reason why it holds.
It may state two separate claims as one.
The paper states this without a source or data behind it here, so there is nothing to check it against. The quote shows it is in the paper.
In the paper
“Increasing the number of cells per individual increases both the expression probability and the eQTL power by shifting the expression mean of the pseudo bulk counts to higher values.”
§ scPower accelerates and optimizes the design of multi-sample single cell transcriptomic studies > Results > scPower models the power to detect differentially expressed genes and expression quantitative trait genes
plaindirect- Asserted: passes — The authors put it forward as true.
- Checkable: passes — It can be checked against evidence.
- Load-bearing: passes — The paper’s conclusions depend on it.
- Based: passes — The paper gives a reason why it holds.
It may state two separate claims as one.
A result the paper reports from its own data — it cites no other source for it, so there is none to check. The quote shows it is in the paper.
In the paper
“The analytic calculations of scPower are orders of magnitude faster than the simulation-based approaches: calculations for Fig. 3c–e took 8 days for powsimR, 3 days for muscat and less than a minute for scPower (Fig. 3g).”
§ scPower accelerates and optimizes the design of multi-sample single cell transcriptomic studies > Results > scPower estimations are supported by simulations
plaindirect- Asserted: passes — The authors put it forward as true.
- Checkable: passes — It can be checked against evidence.
- Load-bearing: passes — The paper’s conclusions depend on it.
- Based: passes — The paper gives a reason why it holds.
It may state two separate claims as one.
A result the paper reports from its own data — it cites no other source for it, so there is none to check. The quote shows it is in the paper.
In the paper
“For the eQTL study with this specific prior combination, the optimal parameters are measuring 1500 cells in 242 samples with a read depth of 10,000.”
§ scPower accelerates and optimizes the design of multi-sample single cell transcriptomic studies > Results > scPower maximizes detection power for a fixed budget by optimizing experimental parameters
plainn = 242- Asserted: passes — The authors put it forward as true.
- Checkable: passes — It can be checked against evidence.
- Load-bearing: passes — The paper’s conclusions depend on it.
- Based: passes — The paper gives a reason why it holds.
The quote only partly states this claim.
- The authors state this as an assumption: The counts of each gene in each cell type follow a negative binomial distribution.
- The authors state this as an assumption: The sum of gene counts follows a negative binomial distribution with parameters altered by the number of cells per cell type and donor.
- The authors state this as an assumption: The distribution of mean values over all genes in a cell type is a mixture of a zero component and two left-censored gamma distributions.
- The authors state this as an assumption: The relationship between mean UMI counts per cell and the gamma parameters is linear.
- The authors state this as an assumption: The number of transcriptome mapped reads is linearly related to the logarithm of the mean UMI counts per cell, with increasing read depth leading to saturation of UMIs.
- The authors state this as an assumption: Overall detection power is the product of expression probability and power to detect DEGs/eQTLs, as both are conditionally independent given expression mean.
A result the paper reports from its own data — it cites no other source for it, so there is none to check. The quote shows it is in the paper.
In the paper
“For the Drop-seq lung data we observe similar trends as for the 10X PBMC data set, with the number of cells per individual being the major determinant of power.”
§ scPower accelerates and optimizes the design of multi-sample single cell transcriptomic studies > Results > scPower generalizes across tissues and scRNAseq technologies
plaindirect- Asserted: passes — The authors put it forward as true.
- Checkable: passes — It can be checked against evidence.
- Load-bearing: passes — The paper’s conclusions depend on it.
- Based: passes — The paper gives a reason why it holds.
It may state two separate claims as one.
A result the paper reports from its own data — it cites no other source for it, so there is none to check. The quote shows it is in the paper.
In the paper
“Using FWER adjustment for DE power changes the observed overall power, but leads to very similar optimal parameter combinations and the same trends overall (Supplementary Fig. S17).”
§ scPower accelerates and optimizes the design of multi-sample single cell transcriptomic studies > Results > scPower maximizes detection power for a fixed budget by optimizing experimental parameters
plaindirect- Asserted: passes — The authors put it forward as true.
- Checkable: passes — It can be checked against evidence.
- Load-bearing: unclear — It is unclear whether the paper’s conclusions depend on it.
- Based: passes — The paper gives a reason why it holds.
It may state two separate claims as one.
A result the paper reports from its own data — it cites no other source for it, so there is none to check. The quote shows it is in the paper.
In the paper
“In contrast to 10X Genomics and Drop-seq, the optimal number of reads per cell is much higher and the number of cells per individual and sample size is only increased at higher budgets for both the prototypic and data driven priors.”
§ scPower accelerates and optimizes the design of multi-sample single cell transcriptomic studies > Results > scPower generalizes across tissues and scRNAseq technologies
plaindirect- Asserted: passes — The authors put it forward as true.
- Checkable: passes — It can be checked against evidence.
- Load-bearing: passes — The paper’s conclusions depend on it.
- Based: passes — The paper gives a reason why it holds.
It may state two separate claims as one.
The paper states this without a source or data behind it here, so there is nothing to check it against. The quote shows it is in the paper.
In the paper
“where small effect sizes require large sample sizes.”
§ scPower accelerates and optimizes the design of multi-sample single cell transcriptomic studies > Results > scPower maximizes detection power for a fixed budget by optimizing experimental parameters
plaindirect- Asserted: passes — The authors put it forward as true.
- Checkable: passes — It can be checked against evidence.
- Load-bearing: passes — The paper’s conclusions depend on it.
- Based: passes — The paper gives a reason why it holds.
Probably not a substantial claim.
A result the paper reports from its own data — it cites no other source for it, so there is none to check. The quote shows it is in the paper.
In the paper
“For eQTL scenarios, increasing the sample size first is more beneficial than increasing the read depth (Fig. 5b,d), which remains relatively low (10,000 reads per cell).”
§ scPower accelerates and optimizes the design of multi-sample single cell transcriptomic studies > Results > scPower maximizes detection power for a fixed budget by optimizing experimental parameters
plaindirect- Asserted: passes — The authors put it forward as true.
- Checkable: passes — It can be checked against evidence.
- Load-bearing: passes — The paper’s conclusions depend on it.
- Based: passes — The paper gives a reason why it holds.
It may state two separate claims as one.
The paper states this without a source or data behind it here, so there is nothing to check it against. The quote shows it is in the paper.
In the paper
“In addition, analytical models require only a small amount of memory independent of the assessed experimental parameters, while simulation of data sets with larger sample sizes lead to increasing memory usage.”
§ scPower accelerates and optimizes the design of multi-sample single cell transcriptomic studies > Discussion
plaindirect- Asserted: passes — The authors put it forward as true.
- Checkable: passes — It can be checked against evidence.
- Load-bearing: passes — The paper’s conclusions depend on it.
- Based: passes — The paper gives a reason why it holds.
It may state two separate claims as one.
The paper states this without a source or data behind it here, so there is nothing to check it against. The quote shows it is in the paper.
In the paper
“The optimal sample size is mostly dependent on the effect size, with low effect sizes requiring large sample sizes and consequently optimal setting with high sample size typically lead to low sequencing depth and relatively low number of cells.”
§ scPower accelerates and optimizes the design of multi-sample single cell transcriptomic studies > Discussion
plaindirect- Asserted: passes — The authors put it forward as true.
- Checkable: passes — It can be checked against evidence.
- Load-bearing: passes — The paper’s conclusions depend on it.
- Based: passes — The paper gives a reason why it holds.
It may state two separate claims as one.
The paper states this without a source or data behind it here, so there is nothing to check it against. The quote shows it is in the paper.
In the paper
“In general, priors affect the optimal design and should therefore be selected carefully.”
§ scPower accelerates and optimizes the design of multi-sample single cell transcriptomic studies > Discussion
plaindirect- Asserted: passes — The authors put it forward as true.
- Checkable: passes — It can be checked against evidence.
- Load-bearing: fails — The paper’s conclusions may not depend on it.
- Based: passes — The paper gives a reason why it holds.
Probably not a substantial claim. The paper’s conclusions may not depend on it.
The paper states this without a source or data behind it here, so there is nothing to check it against. The quote shows it is in the paper.
In the paper
“The identified optimal thresholds are low and increase the number of detectable genes.”
§ scPower accelerates and optimizes the design of multi-sample single cell transcriptomic studies > Discussion
plaindirect- Asserted: passes — The authors put it forward as true.
- Checkable: passes — It can be checked against evidence.
- Load-bearing: unclear — It is unclear whether the paper’s conclusions depend on it.
- Based: passes — The paper gives a reason why it holds.
It may state two separate claims as one.
The paper states this without a source or data behind it here, so there is nothing to check it against. The quote shows it is in the paper.
In the paper
“The choice of a threshold on the number of reads required for a gene to be called expressed also influences the choice of optimal parameters.”
§ scPower accelerates and optimizes the design of multi-sample single cell transcriptomic studies > Discussion
plaindirect- Asserted: passes — The authors put it forward as true.
- Checkable: passes — It can be checked against evidence.
- Load-bearing: fails — The paper’s conclusions may not depend on it.
- Based: passes — The paper gives a reason why it holds.
Probably not a substantial claim. The paper’s conclusions may not depend on it.
A result the paper reports from its own data — it cites no other source for it, so there is none to check. The quote shows it is in the paper.
In the paper
“These percentages correspond to 1–10 reads per million sequenced, which translates to 1–5 UMI counts for a median of around 5000 UMI counts per cell in our data set.”
§ scPower accelerates and optimizes the design of multi-sample single cell transcriptomic studies > Discussion
plaindirect- Asserted: passes — The authors put it forward as true.
- Checkable: passes — It can be checked against evidence.
- Load-bearing: unclear — It is unclear whether the paper’s conclusions depend on it.
- Based: passes — The paper gives a reason why it holds.
It may state two separate claims as one.
The paper states this without a source or data behind it here, so there is nothing to check it against. The quote shows it is in the paper.
In the paper
“However, for genes with small mean values, i.e., only very few non-zero counts, this normalization might not be effective and the power is overestimated by the analytical power calculation based on the F-test.”
§ scPower accelerates and optimizes the design of multi-sample single cell transcriptomic studies > Methods > Power analysis for expression quantitative trait loci
hedgedconditional- Asserted: passes — The authors put it forward as true.
- Checkable: passes — It can be checked against evidence.
- Load-bearing: passes — The paper’s conclusions depend on it.
- Based: passes — The paper gives a reason why it holds.
It may state two separate claims as one.
In the paper
“Since the Taylor approximation of the dispersion parameter45 was not accurate enough, we used instead a numerical optimization.”
§ scPower accelerates and optimizes the design of multi-sample single cell transcriptomic studies > Methods > Power analysis for expression quantitative trait loci
What the sources say
- Not checked yetcites [45] Law, C. W., Chen, Y., Shi, W. & Smyth, G. K. voom: Precision weights unlock linear model analysis tools for RNA-seq read counts. Genome Biol. 15, R29 (2014). source
plaindirect- Asserted: passes — The authors put it forward as true.
- Checkable: passes — It can be checked against evidence.
- Load-bearing: unclear — It is unclear whether the paper’s conclusions depend on it.
- Based: passes — The paper gives a reason why it holds.
It may state two separate claims as one.
A result the paper reports from its own data — it cites no other source for it, so there is none to check. The quote shows it is in the paper.
In the paper
“A similar standard deviation was also observed in the pilot data.”
§ scPower accelerates and optimizes the design of multi-sample single cell transcriptomic studies > Methods > Simulation of effect sizes and gene rank distributions
plain- Asserted: passes — The authors put it forward as true.
- Checkable: passes — It can be checked against evidence.
- Load-bearing: fails — The paper’s conclusions may not depend on it.
- Based: fails — The paper may give no reason why it holds.
Probably not a substantial claim. The paper’s conclusions may not depend on it. The paper may give no reason why it holds.
A result the paper reports from its own data — it cites no other source for it, so there is none to check. The quote shows it is in the paper.
In the paper
“We observed for the parameter of the DEseq dispersion model a linear relationship with the read depth, which was not visible for Drop-seq and 10X Genomics.”
§ scPower accelerates and optimizes the design of multi-sample single cell transcriptomic studies > Methods > Evaluation of Drop-seq and Smart-seq2 data
plaincorrelational- Asserted: passes — The authors put it forward as true.
- Checkable: passes — It can be checked against evidence.
- Load-bearing: unclear — It is unclear whether the paper’s conclusions depend on it.
- Based: passes — The paper gives a reason why it holds.
It may state two separate claims as one.
None of the sources cited for this claim have been checked yet.
In the paper
“In scRNA-seq experiments, individual cells are typically not sequenced to saturation, leading to sparse count matrices, where only highly expressed genes are detected with counts greater than zero.”
§ scPower accelerates and optimizes the design of multi-sample single cell transcriptomic studies > Introduction
What the sources say
- Not checked yetcites [34] Wu, A. R. et al. Quantitative assessment of single-cell RNA-sequencing methods. Nat. Methods 11, 41–46 (2014). source
- Not checked yetcites [35] Svensson, V. et al. Power analysis of single-cell RNA-sequencing experiments. Nat. Methods 14, 381–387 (2017). source
- Not checked yetcites [36] Ziegenhain, C. et al. Comparative analysis of single-cell RNA sequencing methods. Mol. Cell 65, 631–643.e4 (2017). source
plaindirect- Asserted: passes — The authors put it forward as true.
- Checkable: passes — It can be checked against evidence.
- Load-bearing: passes — The paper’s conclusions depend on it.
- Based: passes — The paper gives a reason why it holds.
It may state two separate claims as one.
In the paper
“In addition, the overall number of transcripts as well as the number of transcripts of individual genes can be highly cell type specific33.”
§ scPower accelerates and optimizes the design of multi-sample single cell transcriptomic studies > Introduction
What the sources say
- Not checked yetcites [33] Monaco, G. et al. RNA-Seq signatures normalized by mRNA abundance allow absolute deconvolution of human immune cell types. Cell Rep. 26, 1627–1640.e7 (2019). source
plaincorrelational- Asserted: passes — The authors put it forward as true.
- Checkable: passes — It can be checked against evidence.
- Load-bearing: passes — The paper’s conclusions depend on it.
- Based: passes — The paper gives a reason why it holds.
It may state two separate claims as one.
A conclusion the paper draws from its own results — it cites no other source for it, so there is none to check. The quote shows it is in the paper.
In the paper
“Potential weaker effect sizes that would be identified with larger sample sizes could not be considered in the priors, which leads to a low required sample size for the power estimation.”
§ scPower accelerates and optimizes the design of multi-sample single cell transcriptomic studies > Results > scPower models the power to detect differentially expressed genes and expression quantitative trait genes
hedgeddirect- Asserted: passes — The authors put it forward as true.
- Checkable: passes — It can be checked against evidence.
- Load-bearing: unclear — It is unclear whether the paper’s conclusions depend on it.
- Based: passes — The paper gives a reason why it holds.
It may state two separate claims as one.
A conclusion the paper draws from its own results — it cites no other source for it, so there is none to check. The quote shows it is in the paper.
In the paper
“Smaller absolute fold changes in this study decrease the DE power and therefore also the overall detection power.”
§ scPower accelerates and optimizes the design of multi-sample single cell transcriptomic studies > Results > scPower models the power to detect differentially expressed genes and expression quantitative trait genes
plaindirect- Asserted: passes — The authors put it forward as true.
- Checkable: passes — It can be checked against evidence.
- Load-bearing: unclear — It is unclear whether the paper’s conclusions depend on it.
- Based: passes — The paper gives a reason why it holds.
It may state two separate claims as one.
The paper states this without a source or data behind it here, so there is nothing to check it against. The quote shows it is in the paper.
In the paper
“However, the analysis provided no generalizable tool that can be applied on other data sets and is missing an exact power estimation based on effect size priors. Furthermore, it is not applicable for DEG analysis.”
§ scPower accelerates and optimizes the design of multi-sample single cell transcriptomic studies > Introduction
plain- Asserted: passes — The authors put it forward as true.
- Checkable: passes — It can be checked against evidence.
- Load-bearing: passes — The paper’s conclusions depend on it.
- Based: passes — The paper gives a reason why it holds.
It may state two separate claims as one.
What the paper did — it cites no source for this, so there is none to check. The quote shows it is in the paper.
In the paper
“We verified that all our training data sets could be modelled by negative binomial distributions after pseudobulk transformation and found no evidence of zero inflation (Supplementary Table S4).”
§ scPower accelerates and optimizes the design of multi-sample single cell transcriptomic studies > Results > scPower models the power to detect differentially expressed genes and expression quantitative trait genes
plain- Asserted: passes — The authors put it forward as true.
- Checkable: passes — It can be checked against evidence.
- Load-bearing: passes — The paper’s conclusions depend on it.
- Based: passes — The paper gives a reason why it holds.
It may state two separate claims as one.
The paper states this without a source or data behind it here, so there is nothing to check it against. The quote shows it is in the paper.
In the paper
“In order to identify a gene as an DEG/eQTL gene, it must be both expressed and exceeding the significance cutoff.”
§ scPower accelerates and optimizes the design of multi-sample single cell transcriptomic studies > Results > Power analysis framework for scRNA-seq experimental design
plain- Asserted: passes — The authors put it forward as true.
- Checkable: passes — It can be checked against evidence.
- Load-bearing: passes — The paper’s conclusions depend on it.
- Based: fails — The paper may give no reason why it holds.
Probably not a substantial claim. The paper may give no reason why it holds. It may state two separate claims as one.
A conclusion the paper draws from its own results — it cites no other source for it, so there is none to check. The quote shows it is in the paper.
In the paper
“This introduces a dependency between the eQTL power and the expression mean and thus eQTL power is considered conditional on the mean.”
§ scPower accelerates and optimizes the design of multi-sample single cell transcriptomic studies > Results > scPower models the power to detect differentially expressed genes and expression quantitative trait genes
plaincorrelational- Asserted: passes — The authors put it forward as true.
- Checkable: passes — It can be checked against evidence.
- Load-bearing: passes — The paper’s conclusions depend on it.
- Based: passes — The paper gives a reason why it holds.
It may state two separate claims as one.
The paper states this without a source or data behind it here, so there is nothing to check it against. The quote shows it is in the paper.
In the paper
“In addition, handling more complex designs is not easily accomplished with simulation based methods, but could be achieved with analytical power analysis methods.”
§ scPower accelerates and optimizes the design of multi-sample single cell transcriptomic studies > Introduction
hedgedconditional- Asserted: passes — The authors put it forward as true.
- Checkable: passes — It can be checked against evidence.
- Load-bearing: passes — The paper’s conclusions depend on it.
- Based: passes — The paper gives a reason why it holds.
It may state two separate claims as one.
The paper states this without a source or data behind it here, so there is nothing to check it against. The quote shows it is in the paper.
In the paper
“Contrary to DE analysis, there currently exists no power estimation method for single cell eQTL that explicitly accounts for specific effect size priors.”
§ scPower accelerates and optimizes the design of multi-sample single cell transcriptomic studies > Results > scPower estimations are supported by simulations
plain- Asserted: passes — The authors put it forward as true.
- Checkable: passes — It can be checked against evidence.
- Load-bearing: passes — The paper’s conclusions depend on it.
- Based: fails — The paper may give no reason why it holds.
Probably not a substantial claim. The paper may give no reason why it holds.
In the paper
“We followed the recommendation of edgeR75 that the expression cutoff should correspond to the percentage of samples in the smaller group.”
§ scPower accelerates and optimizes the design of multi-sample single cell transcriptomic studies > Results > scPower maximizes detection power for a fixed budget by optimizing experimental parameters
What the sources say
- Not checked yetcites [75] Chen, Y., Lun, A. T. L. & Smyth, G. K. From reads to genes to pathways: differential expression analysis of RNA-Seq experiments using Rsubread and the edgeR quasi-likelihood pipeline. F1000Res. 5, 1438 (2016).
plaincorrelational- Asserted: passes — The authors put it forward as true.
- Checkable: passes — It can be checked against evidence.
- Load-bearing: fails — The paper’s conclusions may not depend on it.
- Based: passes — The paper gives a reason why it holds.
Probably not a substantial claim. The paper’s conclusions may not depend on it.
None of the sources cited for this claim have been checked yet.
In the paper
“However, under the assumptions of an unconfounded experimental design with batches containing both controls and cases, batch effects can be removed by adding a batch covariate to the regression model71. This increases the power compared to non-batch corrected analyses72–74.”
§ scPower accelerates and optimizes the design of multi-sample single cell transcriptomic studies > Results > scPower estimations are supported by simulations
What the sources say
- Not checked yetcites [71] Chen, W. et al. A comparison of methods accounting for batch effects in differential expression analysis of UMI count based single cell RNA sequencing. Comput. Struct. Biotechnol. J. 18, 861–873 (2020). source
- Not checked yetcites [72] Hernández, A. V., Steyerberg, E. W. & Habbema, J. D. F. Covariate adjustment in randomized controlled trials with dichotomous outcomes increases statistical power and reduces sample size requirements. J. Clin. Epidemiol. 57, 454–460 (2004). source
- Not checked yetcites [73] Stegle, O., Parts, L., Piipari, M., Winn, J. & Durbin, R. Using probabilistic estimation of expression residuals (PEER) to obtain increased power and interpretability of gene expression analyses. Nat. Protoc. 7, 500–507 (2012). source
- Not checked yetcites [74] Kahan, B. C., Jairath, V., Doré, C. J. & Morris, T. P. The risks and rewards of covariate adjustment in randomized trials: an assessment of 12 outcomes from 8 studies. Trials 15, 139 (2014). source
plaindirect- Asserted: passes — The authors put it forward as true.
- Checkable: passes — It can be checked against evidence.
- Load-bearing: passes — The paper’s conclusions depend on it.
- Based: passes — The paper gives a reason why it holds.
It may state two separate claims as one.
- The authors state this as an assumption: An unconfounded experimental design with batches containing both controls and cases is assumed for batch effect correction.
A conclusion the paper draws from its own results — it cites no other source for it, so there is none to check. The quote shows it is in the paper.
In the paper
“In this case, a conservative power estimation can be achieved by setting the expected cell type frequency to the frequency of the smaller group. This represents a good lower bound estimation, especially in cases with small sample sizes.”
§ scPower accelerates and optimizes the design of multi-sample single cell transcriptomic studies > Results > scPower estimations are supported by simulations
plaindirect- Asserted: passes — The authors put it forward as true.
- Checkable: passes — It can be checked against evidence.
- Load-bearing: passes — The paper’s conclusions depend on it.
- Based: passes — The paper gives a reason why it holds.
It may state two separate claims as one.
The paper states this without a source or data behind it here, so there is nothing to check it against. The quote shows it is in the paper.
In the paper
“For the eQTL example, we consider an eQTL with a minor allele frequency of 0.05, which is a common lower threshold for genetic variants tested for associations.”
§ scPower accelerates and optimizes the design of multi-sample single cell transcriptomic studies > Results > scPower maximizes detection power for a fixed budget by optimizing experimental parameters
plain- Asserted: passes — The authors put it forward as true.
- Checkable: passes — It can be checked against evidence.
- Load-bearing: fails — The paper’s conclusions may not depend on it.
- Based: fails — The paper may give no reason why it holds.
Probably not a substantial claim. The paper’s conclusions may not depend on it. The paper may give no reason why it holds.
A conclusion the paper draws from its own results — it cites no other source for it, so there is none to check. The quote shows it is in the paper.
In the paper
“This allows only to measure much fewer cells, even though a higher number of samples and cells would be beneficial.”
§ scPower accelerates and optimizes the design of multi-sample single cell transcriptomic studies > Results > scPower generalizes across tissues and scRNAseq technologies
plaindirect- Asserted: passes — The authors put it forward as true.
- Checkable: passes — It can be checked against evidence.
- Load-bearing: passes — The paper’s conclusions depend on it.
- Based: passes — The paper gives a reason why it holds.
It may state two separate claims as one.
A conclusion the paper draws from its own results — it cites no other source for it, so there is none to check. The quote shows it is in the paper.
In the paper
“In general, we observe that Smart-seq2 experiments are not less powerful per se, but the significantly higher cost in the multi-sample setting leads to less powerful designs when restricting the budget.”
§ scPower accelerates and optimizes the design of multi-sample single cell transcriptomic studies > Results > scPower generalizes across tissues and scRNAseq technologies
plaindirect- Asserted: passes — The authors put it forward as true.
- Checkable: passes — It can be checked against evidence.
- Load-bearing: passes — The paper’s conclusions depend on it.
- Based: passes — The paper gives a reason why it holds.
It may state two separate claims as one.
A conclusion the paper draws from its own results — it cites no other source for it, so there is none to check. The quote shows it is in the paper.
In the paper
“Our power analysis framework is applicable to data sets for other tissues besides PBMC and to other single cell technologies besides 10X Genomics.”
§ scPower accelerates and optimizes the design of multi-sample single cell transcriptomic studies > Results > scPower generalizes across tissues and scRNAseq technologies
plain- Asserted: passes — The authors put it forward as true.
- Checkable: passes — It can be checked against evidence.
- Load-bearing: passes — The paper’s conclusions depend on it.
- Based: passes — The paper gives a reason why it holds.
It may state two separate claims as one.
A conclusion the paper draws from its own results — it cites no other source for it, so there is none to check. The quote shows it is in the paper.
In the paper
“Our model generalizes across different tissues and scRNAseq technologies and provides the means to easily design experiments that maximize the number of biological discoveries.”
§ scPower accelerates and optimizes the design of multi-sample single cell transcriptomic studies > Discussion
plaindirect- Asserted: passes — The authors put it forward as true.
- Checkable: passes — It can be checked against evidence.
- Load-bearing: passes — The paper’s conclusions depend on it.
- Based: passes — The paper gives a reason why it holds.
It may state two separate claims as one.
A conclusion the paper draws from its own results — it cites no other source for it, so there is none to check. The quote shows it is in the paper.
In the paper
“indicating that strong effects can be detected with relatively few samples, while the detection of expression requires deeper sequencing.”
§ scPower accelerates and optimizes the design of multi-sample single cell transcriptomic studies > Results > scPower maximizes detection power for a fixed budget by optimizing experimental parameters
hedgedcorrelational- Asserted: passes — The authors put it forward as true.
- Checkable: passes — It can be checked against evidence.
- Load-bearing: passes — The paper’s conclusions depend on it.
- Based: passes — The paper gives a reason why it holds.
It may state two separate claims as one.
What the paper did — it cites no source for this, so there is none to check. The quote shows it is in the paper.
In the paper
“We validated the doublet detection and donor identification of Demuxlet using our PBMC data set by comparing the expression of sex specific genes with the sex of the assigned donor (Supplementary Fig. S2b) and found high concordance after doublet removal, also for run 5, which was overloaded with 25,000 cells.”
§ scPower accelerates and optimizes the design of multi-sample single cell transcriptomic studies > Results > scPower maximizes detection power for a fixed budget by optimizing experimental parameters
plaincorrelational- Asserted: passes — The authors put it forward as true.
- Checkable: passes — It can be checked against evidence.
- Load-bearing: unclear — It is unclear whether the paper’s conclusions depend on it.
- Based: passes — The paper gives a reason why it holds.
It may state two separate claims as one.
A conclusion the paper draws from its own results — it cites no other source for it, so there is none to check. The quote shows it is in the paper.
In the paper
“This transformatively enables the evaluation of many experimental design options in a short time and thus to identify optimal experimental parameters for a limited budget.”
§ scPower accelerates and optimizes the design of multi-sample single cell transcriptomic studies > Discussion
boosteddirect- Asserted: passes — The authors put it forward as true.
- Checkable: passes — It can be checked against evidence.
- Load-bearing: passes — The paper’s conclusions depend on it.
- Based: passes — The paper gives a reason why it holds.
It may state two separate claims as one.
A conclusion the paper draws from its own results — it cites no other source for it, so there is none to check. The quote shows it is in the paper.
In the paper
“These recommendations match our optimal determined parameters.”
§ scPower accelerates and optimizes the design of multi-sample single cell transcriptomic studies > Discussion
plain- Asserted: passes — The authors put it forward as true.
- Checkable: passes — It can be checked against evidence.
- Load-bearing: fails — The paper’s conclusions may not depend on it.
- Based: passes — The paper gives a reason why it holds.
Probably not a substantial claim. The paper’s conclusions may not depend on it.
In the paper
“However, in a systematic analysis of spike-in expression it has been shown that the accuracy of the measurements is not strongly dependent on the sequencing depth and consistently high for a read depth of 10,000 reads per cell35.”
§ scPower accelerates and optimizes the design of multi-sample single cell transcriptomic studies > Discussion
What the sources say
- Not checked yetcites [35] Svensson, V. et al. Power analysis of single-cell RNA-sequencing experiments. Nat. Methods 14, 381–387 (2017). source
plain- Asserted: passes — The authors put it forward as true.
- Checkable: passes — It can be checked against evidence.
- Load-bearing: passes — The paper’s conclusions depend on it.
- Based: passes — The paper gives a reason why it holds.
It may state two separate claims as one.
A conclusion the paper draws from its own results — it cites no other source for it, so there is none to check. The quote shows it is in the paper.
In the paper
“In contrast, our approach provides gene level and overall power estimates based on prior data and we provide a generalizable tool for analytic power analysis of single cell DE and eQTL studies.”
§ scPower accelerates and optimizes the design of multi-sample single cell transcriptomic studies > Discussion
plain- Asserted: passes — The authors put it forward as true.
- Checkable: passes — It can be checked against evidence.
- Load-bearing: passes — The paper’s conclusions depend on it.
- Based: passes — The paper gives a reason why it holds.
It may state two separate claims as one.
In the paper
“While the (negative binomial) regression model for pseudobulk is currently the most powerful method for assessing individual level differential expression43, it requires a discrete cell type definition and our approach is tightly linked to it.”
§ scPower accelerates and optimizes the design of multi-sample single cell transcriptomic studies > Discussion
What the sources say
- Not checked yetcites [43] Crowell, H. L. et al. muscat detects subpopulation-specific state transitions from multi-sample multi-condition single-cell transcriptomics data. Nat. Commun. 11, 6077 (2020). source
plain- Asserted: passes — The authors put it forward as true.
- Checkable: passes — It can be checked against evidence.
- Load-bearing: fails — The paper’s conclusions may not depend on it.
- Based: passes — The paper gives a reason why it holds.
Probably not a substantial claim. The paper’s conclusions may not depend on it.
None of the sources cited for this claim have been checked yet.
In the paper
“Shallow sequencing of more cells has been recommended for extracting the gene expression programs required for annotations, because it has achieved equal accuracy as deeper sequencing of fewer cells50,82.”
§ scPower accelerates and optimizes the design of multi-sample single cell transcriptomic studies > Discussion
What the sources say
- Not checked yetcites [50] Mandric, I. et al. Optimized design of single-cell RNA sequencing experiments for cell-type-specific eQTL analysis. Nat. Commun. 11, 5504 (2020). source
- Not checked yetcites [82] Heimberg, G., Bhatnagar, R., El-Samad, H. & Thomson, M. Low dimensionality in gene expression data enables the accurate extraction of transcriptional programs from shallow sequencing. Cell Syst. 2, 239–250 (2016). source
plain- Asserted: passes — The authors put it forward as true.
- Checkable: passes — It can be checked against evidence.
- Load-bearing: passes — The paper’s conclusions depend on it.
- Based: passes — The paper gives a reason why it holds.
Probably not a substantial claim.
In the paper
“A first analytic investigation of power optimization in single cell eQTL studies50 has been done, but suffered from several limitations.”
§ scPower accelerates and optimizes the design of multi-sample single cell transcriptomic studies > Discussion
What the sources say
- Not checked yetcites [50] Mandric, I. et al. Optimized design of single-cell RNA sequencing experiments for cell-type-specific eQTL analysis. Nat. Commun. 11, 5504 (2020). source
plain- Asserted: passes — The authors put it forward as true.
- Checkable: passes — It can be checked against evidence.
- Load-bearing: passes — The paper’s conclusions depend on it.
- Based: passes — The paper gives a reason why it holds.
It may state two separate claims as one.
None of the sources cited for this claim have been checked yet.
In the paper
“To ensure sufficient power for cell type annotation, our framework scPower can be combined with specific power analysis tools for cell type annotation38,82.”
§ scPower accelerates and optimizes the design of multi-sample single cell transcriptomic studies > Discussion
What the sources say
- Not checked yetcites [38] Abrams, D., Kumar, P., Karuturi, R. K. M. & George, J. A computational method to aid the design and analysis of single cell RNA-seq experiments for cell type identification. BMC Bioinforma. 20, 275 (2019). source
- Not checked yetcites [82] Heimberg, G., Bhatnagar, R., El-Samad, H. & Thomson, M. Low dimensionality in gene expression data enables the accurate extraction of transcriptional programs from shallow sequencing. Cell Syst. 2, 239–250 (2016). source
plaindirect- Asserted: passes — The authors put it forward as true.
- Checkable: passes — It can be checked against evidence.
- Load-bearing: fails — The paper’s conclusions may not depend on it.
- Based: passes — The paper gives a reason why it holds.
Probably not a substantial claim. The paper’s conclusions may not depend on it.
In the paper
“For this reason, best practice guidelines for differential gene expression with RNA-seq recommend cutoffs that remove between 19 and 33% of lowly expressed genes, depending on the analysis pipeline84.”
§ scPower accelerates and optimizes the design of multi-sample single cell transcriptomic studies > Discussion
What the sources say
- Not checked yetcites [84] SEQC/MAQC-III Consortium. A comprehensive assessment of RNA-seq accuracy, reproducibility and information content by the Sequencing Quality Control Consortium. Nat. Biotechnol. 32, 903–914 (2014). source
plain- Asserted: passes — The authors put it forward as true.
- Checkable: passes — It can be checked against evidence.
- Load-bearing: fails — The paper’s conclusions may not depend on it.
- Based: passes — The paper gives a reason why it holds.
Probably not a substantial claim. The paper’s conclusions may not depend on it.
None of the sources cited for this claim have been checked yet.
In the paper
“The human cell atlas project has made it its goal to build a reference map of healthy human cells by iteratively sampling the cells with increasing resolution61,85.”
§ scPower accelerates and optimizes the design of multi-sample single cell transcriptomic studies > Discussion
What the sources say
- Not checked yetcites [61] Regev, A. et al. The human cell atlas. Elife 6, e27041 (2017). source
- Not checked yetcites [85] Regev, A. et al. The human cell atlas white paper. arXiv [q-bio.TO] (2018).
plain- Asserted: passes — The authors put it forward as true.
- Checkable: passes — It can be checked against evidence.
- Load-bearing: fails — The paper’s conclusions may not depend on it.
- Based: passes — The paper gives a reason why it holds.
Probably not a substantial claim. The paper’s conclusions may not depend on it.
A conclusion the paper draws from its own results — it cites no other source for it, so there is none to check. The quote shows it is in the paper.
In the paper
“Our gene expression probability model is cell type specific and has to be fitted based on realistic pilot data.”
§ scPower accelerates and optimizes the design of multi-sample single cell transcriptomic studies > Discussion
plain- Asserted: passes — The authors put it forward as true.
- Checkable: passes — It can be checked against evidence.
- Load-bearing: passes — The paper’s conclusions depend on it.
- Based: fails — The paper may give no reason why it holds.
Probably not a substantial claim. The paper may give no reason why it holds. It may state two separate claims as one.
In the paper
“Lastly, we did not address the power for the detection of variance QTLs (quantitative trait loci associated with gene expression variance across cells) from scRNAseq data48 due to the lack of data driven priors for the effect sizes.”
§ scPower accelerates and optimizes the design of multi-sample single cell transcriptomic studies > Discussion
What the sources say
- Not checked yetcites [48] Sarkar, A. K. et al. Discovery and characterization of variance QTLs in human induced pluripotent stem cells. PLoS Genet 15, e1008045 (2019). source
plaindirect- Asserted: passes — The authors put it forward as true.
- Checkable: passes — It can be checked against evidence.
- Load-bearing: fails — The paper’s conclusions may not depend on it.
- Based: passes — The paper gives a reason why it holds.
Probably not a substantial claim. The paper’s conclusions may not depend on it.
A conclusion the paper draws from its own results — it cites no other source for it, so there is none to check. The quote shows it is in the paper.
In the paper
“When using our approach, the user should keep in mind that our experimental design recommendations are optimized for differential expression between individuals.”
§ scPower accelerates and optimizes the design of multi-sample single cell transcriptomic studies > Discussion
plain- Asserted: passes — The authors put it forward as true.
- Checkable: passes — It can be checked against evidence.
- Load-bearing: passes — The paper’s conclusions depend on it.
- Based: passes — The paper gives a reason why it holds.
Probably not a substantial claim.
In the paper
“While the (negative binomial) regression model for pseudobulk is currently the most powerful method for assessing individual level differential expression43, it requires a discrete cell type definition and our approach is tightly linked to it.”
§ scPower accelerates and optimizes the design of multi-sample single cell transcriptomic studies > Discussion
What the sources say
- Not checked yetcites [43] Crowell, H. L. et al. muscat detects subpopulation-specific state transitions from multi-sample multi-condition single-cell transcriptomics data. Nat. Commun. 11, 6077 (2020). source
plaincorrelational- Asserted: passes — The authors put it forward as true.
- Checkable: passes — It can be checked against evidence.
- Load-bearing: passes — The paper’s conclusions depend on it.
- Based: passes — The paper gives a reason why it holds.
It may state two separate claims as one.
In the paper
“In our examples we used a threshold of >10 and >3 reads, however, some eQTL analyses of bulk RNAseq data advocate using >0 reads70.”
§ scPower accelerates and optimizes the design of multi-sample single cell transcriptomic studies > Discussion
What the sources say
- Not checked yetcites [70] Lappalainen, T. et al. Transcriptome and genome sequencing uncovers functional variation in humans. Nature 501, 506–511 (2013). source
plain- Asserted: passes — The authors put it forward as true.
- Checkable: passes — It can be checked against evidence.
- Load-bearing: fails — The paper’s conclusions may not depend on it.
- Based: passes — The paper gives a reason why it holds.
Probably not a substantial claim. The paper’s conclusions may not depend on it.
The paper states this without a source or data behind it here, so there is nothing to check it against. The quote shows it is in the paper.
In the paper
“For instance, co-expression analysis requires a high number of quantified genes per cell, especially when one is interested in cell type specific co-expression and comparison of such co-expression relations between individuals.”
§ scPower accelerates and optimizes the design of multi-sample single cell transcriptomic studies > Discussion
plaindirect- Asserted: passes — The authors put it forward as true.
- Checkable: passes — It can be checked against evidence.
- Load-bearing: fails — The paper’s conclusions may not depend on it.
- Based: fails — The paper may give no reason why it holds.
Probably not a substantial claim. The paper’s conclusions may not depend on it. The paper may give no reason why it holds.
A conclusion the paper draws from its own results — it cites no other source for it, so there is none to check. The quote shows it is in the paper.
In the paper
“Thus, actual experiments might result in higher doublet rates and lower number of usable cells.”
§ scPower accelerates and optimizes the design of multi-sample single cell transcriptomic studies > Discussion
hedgedconditional- Asserted: passes — The authors put it forward as true.
- Checkable: passes — It can be checked against evidence.
- Load-bearing: unclear — It is unclear whether the paper’s conclusions depend on it.
- Based: passes — The paper gives a reason why it holds.
It may state two separate claims as one.
A conclusion the paper draws from its own results — it cites no other source for it, so there is none to check. The quote shows it is in the paper.
In the paper
“This will create high quality priors that will further broaden the applicability of scPower.”
§ scPower accelerates and optimizes the design of multi-sample single cell transcriptomic studies > Discussion
plaindirect- Asserted: passes — The authors put it forward as true.
- Checkable: fails — It may be too vague to check against evidence.
- Load-bearing: fails — The paper’s conclusions may not depend on it.
- Based: passes — The paper gives a reason why it holds.
Probably not a substantial claim. It may be too vague to check against evidence. The paper’s conclusions may not depend on it.
A conclusion the paper draws from its own results — it cites no other source for it, so there is none to check. The quote shows it is in the paper.
In the paper
“We have shown that our model can be applied to data generated with 10X Genomics, Drop-seq and Smart-seq2 and we are confident that it is applicable to similar technology platforms.”
§ scPower accelerates and optimizes the design of multi-sample single cell transcriptomic studies > Discussion
boosted- Asserted: passes — The authors put it forward as true.
- Checkable: passes — It can be checked against evidence.
- Load-bearing: passes — The paper’s conclusions depend on it.
- Based: passes — The paper gives a reason why it holds.
It may state two separate claims as one.
In the paper
“Furthermore, the power to annotate new rare cell types by clustering analysis of scRNA-seq data might have different optimal parameters38.”
§ scPower accelerates and optimizes the design of multi-sample single cell transcriptomic studies > Discussion
What the sources say
- Not checked yetcites [38] Abrams, D., Kumar, P., Karuturi, R. K. M. & George, J. A computational method to aid the design and analysis of single cell RNA-seq experiments for cell type identification. BMC Bioinforma. 20, 275 (2019). source
hedged- Asserted: passes — The authors put it forward as true.
- Checkable: passes — It can be checked against evidence.
- Load-bearing: fails — The paper’s conclusions may not depend on it.
- Based: passes — The paper gives a reason why it holds.
Probably not a substantial claim. The paper’s conclusions may not depend on it.
A conclusion the paper draws from its own results — it cites no other source for it, so there is none to check. The quote shows it is in the paper.
In the paper
“Other applications might result in very different optimal experimental designs.”
§ scPower accelerates and optimizes the design of multi-sample single cell transcriptomic studies > Discussion
hedged- Asserted: passes — The authors put it forward as true.
- Checkable: fails — It may be too vague to check against evidence.
- Load-bearing: fails — The paper’s conclusions may not depend on it.
- Based: passes — The paper gives a reason why it holds.
Probably not a substantial claim. It may be too vague to check against evidence. The paper’s conclusions may not depend on it.
A conclusion the paper draws from its own results — it cites no other source for it, so there is none to check. The quote shows it is in the paper.
In the paper
“We are convinced that scPower will provide the foundation for building rational experimental design of interindividual gene expression comparisons with cell type resolution across a wide range of organ systems.”
§ scPower accelerates and optimizes the design of multi-sample single cell transcriptomic studies > Discussion
boosteddirect- Asserted: passes — The authors put it forward as true.
- Checkable: fails — It may be too vague to check against evidence.
- Load-bearing: passes — The paper’s conclusions depend on it.
- Based: fails — The paper may give no reason why it holds.
Probably not a substantial claim. It may be too vague to check against evidence. The paper may give no reason why it holds.
What the paper did — it cites no source for this, so there is none to check. The quote shows it is in the paper.
In the paper
“DE/eQTL power is computed using a significance threshold corrected for multiple testing, controlling either the family-wise error rate (FWER) or the false discovery rate (FDR).”
§ scPower accelerates and optimizes the design of multi-sample single cell transcriptomic studies > Methods > Overall detection power
plain- Asserted: passes — The authors put it forward as true.
- Checkable: passes — It can be checked against evidence.
- Load-bearing: passes — The paper’s conclusions depend on it.
- Based: passes — The paper gives a reason why it holds.
Probably not a substantial claim.
In the paper
“Lung cell type specific priors were obtained from a DE study of freshly isolated airway epithelial cells of asthma patients and healthy controls55.”
§ scPower accelerates and optimizes the design of multi-sample single cell transcriptomic studies > Methods > Pilot data sets
What the sources say
- Not checked yetcites [55] Nicodemus-Johnson, J. et al. DNA methylation in lung cells is associated with asthma endotypes and genetic risk. JCI Insight 1, e90151 (2016). source
plain- Asserted: passes — The authors put it forward as true.
- Checkable: passes — It can be checked against evidence.
- Load-bearing: passes — The paper’s conclusions depend on it.
- Based: passes — The paper gives a reason why it holds.
Probably not a substantial claim.
In the paper
“A DE study analyzing age-dependent gene regulation in human pancreas56 was used to get pancreas cell type specific priors.”
§ scPower accelerates and optimizes the design of multi-sample single cell transcriptomic studies > Methods > Pilot data sets
What the sources say
- Not checked yetcites [56] Arda, H. E. et al. Age-dependent pancreatic gene regulation reveals mechanisms governing human β cell function. Cell Metab. 23, 909–920 (2016). source
plaindirect- Asserted: passes — The authors put it forward as true.
- Checkable: passes — It can be checked against evidence.
- Load-bearing: passes — The paper’s conclusions depend on it.
- Based: passes — The paper gives a reason why it holds.
Probably not a substantial claim.
In the paper
“We used FDR adjustment for the DE power and followed the approach of the GTEx consortium63 based on FWER adjustment for the eQTL power.”
§ scPower accelerates and optimizes the design of multi-sample single cell transcriptomic studies > Methods > Overall detection power
What the sources say
- Not checked yetcites GTEx consortium63
plain- Asserted: passes — The authors put it forward as true.
- Checkable: passes — It can be checked against evidence.
- Load-bearing: fails — The paper’s conclusions may not depend on it.
- Based: passes — The paper gives a reason why it holds.
Probably not a substantial claim. The paper’s conclusions may not depend on it. It may state two separate claims as one.
In the paper
“For eQTLs we followed the approach of the GTEX consortium63, which assumes that for each gene on average 10 independent (uncorrelated) SNPs are tested in a genome-wide cis eQTL analysis.”
§ scPower accelerates and optimizes the design of multi-sample single cell transcriptomic studies > Methods > Overall detection power
What the sources say
- Not checked yetcites GTEx consortium63
plain- Asserted: passes — The authors put it forward as true.
- Checkable: passes — It can be checked against evidence.
- Load-bearing: passes — The paper’s conclusions depend on it.
- Based: passes — The paper gives a reason why it holds.
Probably not a substantial claim.
What the paper did — it cites no source for this, so there is none to check. The quote shows it is in the paper.
In the paper
“The expected number of true positives is directly derived from the power we reach for . Summing up the gene-wise power (at ) yields the expected number of significant DEGs/eQTLs .”
§ scPower accelerates and optimizes the design of multi-sample single cell transcriptomic studies > Methods > Overall detection power
plaindirect- Asserted: passes — The authors put it forward as true.
- Checkable: passes — It can be checked against evidence.
- Load-bearing: passes — The paper’s conclusions depend on it.
- Based: passes — The paper gives a reason why it holds.
It may state two separate claims as one.
The paper states this without a source or data behind it here, so there is nothing to check it against. The quote shows it is in the paper.
In the paper
“In contrast to the Bonferroni correction, which depends only on the number of tests, the FDR correction depends on the p value distribution of all genes.”
§ scPower accelerates and optimizes the design of multi-sample single cell transcriptomic studies > Methods > Overall detection power
plaindirect- Asserted: passes — The authors put it forward as true.
- Checkable: passes — It can be checked against evidence.
- Load-bearing: passes — The paper’s conclusions depend on it.
- Based: passes — The paper gives a reason why it holds.
It may state two separate claims as one.
In the paper
“For the population level, we followed in most of our analyses the recommendation of edgeR75 that the expression cutoff should correspond to the percentage of samples in the smaller group.”
§ scPower accelerates and optimizes the design of multi-sample single cell transcriptomic studies > Methods > Expression cutoffs and threshold criteria
What the sources say
- Not checked yetcites [75] Chen, Y., Lun, A. T. L. & Smyth, G. K. From reads to genes to pathways: differential expression analysis of RNA-Seq experiments using Rsubread and the edgeR quasi-likelihood pipeline. F1000Res. 5, 1438 (2016).
plaincorrelational- Asserted: passes — The authors put it forward as true.
- Checkable: passes — It can be checked against evidence.
- Load-bearing: fails — The paper’s conclusions may not depend on it.
- Based: passes — The paper gives a reason why it holds.
Probably not a substantial claim. The paper’s conclusions may not depend on it.
What the paper did — it cites no source for this, so there is none to check. The quote shows it is in the paper.
In the paper
“As our analytic method outputs the power without computing the p values, we can not apply the FDR correction directly and use the method of Jung.”
§ scPower accelerates and optimizes the design of multi-sample single cell transcriptomic studies > Methods > Overall detection power
plaindirect- Asserted: passes — The authors put it forward as true.
- Checkable: passes — It can be checked against evidence.
- Load-bearing: passes — The paper’s conclusions depend on it.
- Based: passes — The paper gives a reason why it holds.
It may state two separate claims as one.
In the paper
“More complex experimental designs can be addressed using the method of95.”
§ scPower accelerates and optimizes the design of multi-sample single cell transcriptomic studies > Methods > Power analysis for differential expression
What the sources say
- Not checked yetcites [95] Lyles, R. H., Lin, H.-M. & Williamson, J. M. A practical approach to computing power for generalized linear models with nominal, count, or ordinal responses. Stat. Med. 26, 1632–1648 (2007). source
plaindirect- Asserted: passes — The authors put it forward as true.
- Checkable: passes — It can be checked against evidence.
- Load-bearing: fails — The paper’s conclusions may not depend on it.
- Based: passes — The paper gives a reason why it holds.
Probably not a substantial claim. The paper’s conclusions may not depend on it.
What the paper did — it cites no source for this, so there is none to check. The quote shows it is in the paper.
In the paper
“The three main components of our statistical framework were evaluated in the comparison, the expression probability (by comparing the number of expressed genes), the power (here according to the definition of powsimR, i.e., the power of all genes expressed in the simulated data) and the overall detection power.”
§ scPower accelerates and optimizes the design of multi-sample single cell transcriptomic studies > Methods > Comparison with simulation-based power analysis tools
plain- Asserted: passes — The authors put it forward as true.
- Checkable: passes — It can be checked against evidence.
- Load-bearing: fails — The paper’s conclusions may not depend on it.
- Based: passes — The paper gives a reason why it holds.
Probably not a substantial claim. The paper’s conclusions may not depend on it.
A conclusion the paper draws from its own results — it cites no other source for it, so there is none to check. The quote shows it is in the paper.
In the paper
“An important limitation of the simulation based frameworks is here that the number of expressed genes in the simulation tools can never be larger than the number of expressed genes in the training data set, while scPower can also approximate expression of unseen genes with smaller mean values and so estimate more expressed genes than seen in the pilot data.”
§ scPower accelerates and optimizes the design of multi-sample single cell transcriptomic studies > Methods > Comparison with simulation-based power analysis tools
plaindirect- Asserted: passes — The authors put it forward as true.
- Checkable: passes — It can be checked against evidence.
- Load-bearing: passes — The paper’s conclusions depend on it.
- Based: passes — The paper gives a reason why it holds.
It may state two separate claims as one.
None of the sources cited for this claim have been checked yet.
In the paper
“To validate our model, we compared the DE power estimations of our framework with two simulation-based tools, called powsimR and muscat40,43.”
§ scPower accelerates and optimizes the design of multi-sample single cell transcriptomic studies > Methods > Comparison with simulation-based power analysis tools
What the sources say
- Not checked yetcites powsimR
- Not checked yetcites muscat40,43
plain- Asserted: passes — The authors put it forward as true.
- Checkable: passes — It can be checked against evidence.
- Load-bearing: passes — The paper’s conclusions depend on it.
- Based: passes — The paper gives a reason why it holds.
Probably not a substantial claim.
In the paper
“We used eQTL effect and sample sizes from the Blueprint study on bulk RNA-seq of FACS sorted Monocytes and T cells57.”
§ scPower accelerates and optimizes the design of multi-sample single cell transcriptomic studies > Methods > Pilot data sets
What the sources say
- Not checked yetcites [57] Chen, L. et al. Genetic drivers of epigenetic and transcriptional variation in human immune. Cells Cell 167, 1398–1414.e24 (2016). source
plain- Asserted: passes — The authors put it forward as true.
- Checkable: passes — It can be checked against evidence.
- Load-bearing: passes — The paper’s conclusions depend on it.
- Based: passes — The paper gives a reason why it holds.
Probably not a substantial claim.
What the paper did — it cites no source for this, so there is none to check. The quote shows it is in the paper.
In the paper
“We choose a cut-off of mean count < 5 and estimate the power for genes with smaller mean values based on simulation instead of the F-test to increase accuracy for small count values.”
§ scPower accelerates and optimizes the design of multi-sample single cell transcriptomic studies > Methods > Power analysis for expression quantitative trait loci
plaindirect- Asserted: passes — The authors put it forward as true.
- Checkable: passes — It can be checked against evidence.
- Load-bearing: passes — The paper’s conclusions depend on it.
- Based: passes — The paper gives a reason why it holds.
It may state two separate claims as one.
In the paper
“For genes with high expression level, the power to detect an eQTL is calculated analytically using an F-test and depends on the sample size , the coefficient of determination of the locus and the chosen significance threshold .”
§ scPower accelerates and optimizes the design of multi-sample single cell transcriptomic studies > Methods > Power analysis for expression quantitative trait loci
What the sources say
- Not checked yetcites [20] Cohen, J. Statistical power analysis for the behavioral sciences. (Hillsdale, 1989).
plaincorrelational- Asserted: passes — The authors put it forward as true.
- Checkable: passes — It can be checked against evidence.
- Load-bearing: passes — The paper’s conclusions depend on it.
- Based: passes — The paper gives a reason why it holds.
It may state two separate claims as one.
What the paper did — it cites no source for this, so there is none to check. The quote shows it is in the paper.
In the paper
“The simulation-based methods perform random sampling of their count matrices and therefore the simulation was repeated 25 times for each parameter combination to generate stable results.”
§ scPower accelerates and optimizes the design of multi-sample single cell transcriptomic studies > Methods > Comparison with simulation-based power analysis tools
plaindirect- Asserted: passes — The authors put it forward as true.
- Checkable: passes — It can be checked against evidence.
- Load-bearing: fails — The paper’s conclusions may not depend on it.
- Based: passes — The paper gives a reason why it holds.
Probably not a substantial claim. The paper’s conclusions may not depend on it. It may state two separate claims as one.
The paper states this without a source or data behind it here, so there is nothing to check it against. The quote shows it is in the paper.
In the paper
“In the eQTL case, the definition of groups depends on the genotype and is therefore not directly chosen by the user.”
§ scPower accelerates and optimizes the design of multi-sample single cell transcriptomic studies > Methods > Expression cutoffs and threshold criteria
plaindirect- Asserted: passes — The authors put it forward as true.
- Checkable: passes — It can be checked against evidence.
- Load-bearing: fails — The paper’s conclusions may not depend on it.
- Based: passes — The paper gives a reason why it holds.
Probably not a substantial claim. The paper’s conclusions may not depend on it.
In the paper
“The reported power of powsimR includes only genes, which are expressed in the simulated data set (count > 0).”
§ scPower accelerates and optimizes the design of multi-sample single cell transcriptomic studies > Methods > Comparison with simulation-based power analysis tools
What the sources say
- Not checked yetcites powsimR
plain- Asserted: passes — The authors put it forward as true.
- Checkable: passes — It can be checked against evidence.
- Load-bearing: fails — The paper’s conclusions may not depend on it.
- Based: passes — The paper gives a reason why it holds.
Probably not a substantial claim. The paper’s conclusions may not depend on it.
In the paper
“Alternatively, for DE analysis the significance threshold can be adjusted for the false discovery rate using the method of Jung22.”
§ scPower accelerates and optimizes the design of multi-sample single cell transcriptomic studies > Methods > Overall detection power
What the sources say
- Not checked yetcites Jung22
plain- Asserted: passes — The authors put it forward as true.
- Checkable: passes — It can be checked against evidence.
- Load-bearing: passes — The paper’s conclusions depend on it.
- Based: passes — The paper gives a reason why it holds.
Probably not a substantial claim.
None of the sources cited for this claim have been checked yet.
In the paper
“powsimR is not designed for multi-sample comparison and for both methods the option to apply a vector of log-fold changes with matching expression ranks was not available.”
§ scPower accelerates and optimizes the design of multi-sample single cell transcriptomic studies > Methods > Comparison with simulation-based power analysis tools
What the sources say
- Not checked yetcites powsimR
- Not checked yetcites muscat40,43
plain- Asserted: passes — The authors put it forward as true.
- Checkable: passes — It can be checked against evidence.
- Load-bearing: fails — The paper’s conclusions may not depend on it.
- Based: passes — The paper gives a reason why it holds.
Probably not a substantial claim. The paper’s conclusions may not depend on it. It may state two separate claims as one.
What the paper did — it cites no source for this, so there is none to check. The quote shows it is in the paper.
In the paper
“However, our framework allows for any combination of power analysis and multiple testing method.”
§ scPower accelerates and optimizes the design of multi-sample single cell transcriptomic studies > Methods > Overall detection power
plain- Asserted: passes — The authors put it forward as true.
- Checkable: passes — It can be checked against evidence.
- Load-bearing: fails — The paper’s conclusions may not depend on it.
- Based: fails — The paper may give no reason why it holds.
Probably not a substantial claim. The paper’s conclusions may not depend on it. The paper may give no reason why it holds.
The paper states this without a source or data behind it here, so there is nothing to check it against. The quote shows it is in the paper.
In the paper
“The overall detection power for DEGs/eQTLs is the product of the expression probability and power to detect DEGs/eQTLs, as both probabilities are conditionally independent given the expression mean of the gene.”
§ scPower accelerates and optimizes the design of multi-sample single cell transcriptomic studies > Methods > Overall detection power
plaincorrelational- Asserted: passes — The authors put it forward as true.
- Checkable: passes — It can be checked against evidence.
- Load-bearing: passes — The paper’s conclusions depend on it.
- Based: fails — The paper may give no reason why it holds.
Probably not a substantial claim. The paper may give no reason why it holds. It may state two separate claims as one.
- The authors state this as an assumption: Overall detection power is the product of expression probability and power to detect DEGs/eQTLs, as both are conditionally independent given expression mean.
None of the sources cited for this claim have been checked yet.
In the paper
“To get realistic estimates for effect sizes (fold changes), data sets from FACS sorted bulk RNA-seq studies were taken53,54.”
§ scPower accelerates and optimizes the design of multi-sample single cell transcriptomic studies > Methods > Pilot data sets
What the sources say
- Not checked yetcites [53] Rendeiro, A. F. et al. Chromatin accessibility maps of chronic lymphocytic leukaemia identify subtype-specific epigenome signatures and transcription regulatory networks. Nat. Commun. 7, 11938 (2016). source
- Not checked yetcites [54] Moreno-Moral, A. et al. Changes in macrophage transcriptome associate with systemic sclerosis and mediate GSDMA contribution to disease risk. Ann. Rheum. Dis. 77, 596–601 (2018). source
plain- Asserted: passes — The authors put it forward as true.
- Checkable: passes — It can be checked against evidence.
- Load-bearing: passes — The paper’s conclusions depend on it.
- Based: passes — The paper gives a reason why it holds.
Probably not a substantial claim.
In the paper
“For large count values, it has been shown that normalized log transformed counts have a constant variance independent of the mean value and can be analyzed with linear models45.”
§ scPower accelerates and optimizes the design of multi-sample single cell transcriptomic studies > Methods > Power analysis for expression quantitative trait loci
What the sources say
- Not checked yetcites [45] Law, C. W., Chen, Y., Shi, W. & Smyth, G. K. voom: Precision weights unlock linear model analysis tools for RNA-seq read counts. Genome Biol. 15, R29 (2014). source
plain- Asserted: passes — The authors put it forward as true.
- Checkable: passes — It can be checked against evidence.
- Load-bearing: passes — The paper’s conclusions depend on it.
- Based: passes — The paper gives a reason why it holds.
It may state two separate claims as one.
What the paper did — it cites no source for this, so there is none to check. The quote shows it is in the paper.
In the paper
“However, as there was no data available to model the linear increase of the doublet rate during overloading correctly, the doublet rate was modeled instead as a constant factor and the library preparation costs were estimated per cell.”
§ scPower accelerates and optimizes the design of multi-sample single cell transcriptomic studies > Methods > Evaluation of Drop-seq and Smart-seq2 data
plaindirect- Asserted: passes — The authors put it forward as true.
- Checkable: passes — It can be checked against evidence.
- Load-bearing: fails — The paper’s conclusions may not depend on it.
- Based: passes — The paper gives a reason why it holds.
Probably not a substantial claim. The paper’s conclusions may not depend on it. It may state two separate claims as one.
The paper states this without a source or data behind it here, so there is nothing to check it against. The quote shows it is in the paper.
In the paper
“The Drop-seq technology is also a droplet-based technique, similar to 10X Genomics.”
§ scPower accelerates and optimizes the design of multi-sample single cell transcriptomic studies > Methods > Evaluation of Drop-seq and Smart-seq2 data
plaincorrelational- Asserted: passes — The authors put it forward as true.
- Checkable: passes — It can be checked against evidence.
- Load-bearing: fails — The paper’s conclusions may not depend on it.
- Based: fails — The paper may give no reason why it holds.
Probably not a substantial claim. The paper’s conclusions may not depend on it. The paper may give no reason why it holds.
None of the sources cited for this claim have been checked yet.
In the paper
“A second effect of doublets is that the read distribution is shifted, as doublets contain more reads than singlets.”
§ scPower accelerates and optimizes the design of multi-sample single cell transcriptomic studies > Methods > Cost calculation and parameter optimization for a given budget
plaindirect- Asserted: passes — The authors put it forward as true.
- Checkable: passes — It can be checked against evidence.
- Load-bearing: passes — The paper’s conclusions depend on it.
- Based: passes — The paper gives a reason why it holds.
Probably not a substantial claim.
In the paper
“It fits one negative binomial distribution separately for each sample and subpopulation in the training data set.”
§ scPower accelerates and optimizes the design of multi-sample single cell transcriptomic studies > Methods > Comparison with simulation-based power analysis tools
What the sources say
- Not checked yetcites muscat40,43
plain- Asserted: passes — The authors put it forward as true.
- Checkable: passes — It can be checked against evidence.
- Load-bearing: fails — The paper’s conclusions may not depend on it.
- Based: passes — The paper gives a reason why it holds.
Probably not a substantial claim. The paper’s conclusions may not depend on it.
In the paper
“Another difference to powsimR is that muscat provides different scenarios for simulating differential expression besides the shift of the mean expression (called DE in muscat). Additionally, they simulate genes with different proportions of low and high expression-state (DP), differential modality (DM) or changes in both proportions and modality (DB).”
§ scPower accelerates and optimizes the design of multi-sample single cell transcriptomic studies > Methods > Comparison with simulation-based power analysis tools
What the sources say
- Not checked yetcites muscat40,43
plain- Asserted: passes — The authors put it forward as true.
- Checkable: passes — It can be checked against evidence.
- Load-bearing: fails — The paper’s conclusions may not depend on it.
- Based: passes — The paper gives a reason why it holds.
Probably not a substantial claim. The paper’s conclusions may not depend on it.
The paper states this without a source or data behind it here, so there is nothing to check it against. The quote shows it is in the paper.
In the paper
“Smart-seq2 is a plate-based technique, which produces full length transcripts and read counts instead of UMI counts.”
§ scPower accelerates and optimizes the design of multi-sample single cell transcriptomic studies > Methods > Evaluation of Drop-seq and Smart-seq2 data
plaindirect- Asserted: passes — The authors put it forward as true.
- Checkable: passes — It can be checked against evidence.
- Load-bearing: passes — The paper’s conclusions depend on it.
- Based: passes — The paper gives a reason why it holds.
Probably not a substantial claim. It may state two separate claims as one.
In the paper
“muscat: was specifically implemented for multi-sample comparisons, in contrast to powsimR.”
§ scPower accelerates and optimizes the design of multi-sample single cell transcriptomic studies > Methods > Comparison with simulation-based power analysis tools
What the sources say
- Not checked yetcites muscat40,43
plain- Asserted: passes — The authors put it forward as true.
- Checkable: passes — It can be checked against evidence.
- Load-bearing: fails — The paper’s conclusions may not depend on it.
- Based: passes — The paper gives a reason why it holds.
Probably not a substantial claim. The paper’s conclusions may not depend on it.
What the paper did — it cites no source for this, so there is none to check. The quote shows it is in the paper.
In the paper
“Both data sets were subsampled to investigate the effect of the read depth.”
§ scPower accelerates and optimizes the design of multi-sample single cell transcriptomic studies > Methods > Evaluation of Drop-seq and Smart-seq2 data
plain- Asserted: passes — The authors put it forward as true.
- Checkable: passes — It can be checked against evidence.
- Load-bearing: fails — The paper’s conclusions may not depend on it.
- Based: passes — The paper gives a reason why it holds.
Probably not a substantial claim. The paper’s conclusions may not depend on it.
What the paper did — it cites no source for this, so there is none to check. The quote shows it is in the paper.
In the paper
“We compared the budget restricted power to our PBMC 10X Genomics results, using the same simulated effect sizes and distribution ranks as well as matched observed priors from FACS sorted bulk studies.”
§ scPower accelerates and optimizes the design of multi-sample single cell transcriptomic studies > Methods > Evaluation of Drop-seq and Smart-seq2 data
plain- Asserted: passes — The authors put it forward as true.
- Checkable: passes — It can be checked against evidence.
- Load-bearing: passes — The paper’s conclusions depend on it.
- Based: passes — The paper gives a reason why it holds.
Probably not a substantial claim.
What the paper did — it cites no source for this, so there is none to check. The quote shows it is in the paper.
In the paper
“We applied the simulation-based methods to further validate the scPower estimations in regards to two different real life scenarios that can affect the power: batch effects and differences of cell proportions between the groups.”
§ scPower accelerates and optimizes the design of multi-sample single cell transcriptomic studies > Methods > Comparison with simulation-based power analysis tools
plain- Asserted: passes — The authors put it forward as true.
- Checkable: passes — It can be checked against evidence.
- Load-bearing: passes — The paper’s conclusions depend on it.
- Based: passes — The paper gives a reason why it holds.
Probably not a substantial claim.
What the paper did — it cites no source for this, so there is none to check. The quote shows it is in the paper.
In the paper
“Model priors, i.e., effect sizes and gene rank distributions, were derived from FACS sorted bulk RNA-seq to get realistic assumptions.”
§ scPower accelerates and optimizes the design of multi-sample single cell transcriptomic studies > Methods > Simulation of effect sizes and gene rank distributions
plaindirect- Asserted: passes — The authors put it forward as true.
- Checkable: passes — It can be checked against evidence.
- Load-bearing: passes — The paper’s conclusions depend on it.
- Based: passes — The paper gives a reason why it holds.
Probably not a substantial claim.
None of the sources cited for this claim have been checked yet.
In the paper
“Following the approach of37, we model the doublet rate linear dependent on the number of recovered cells, using the values from the 10X User guide of V377.”
§ scPower accelerates and optimizes the design of multi-sample single cell transcriptomic studies > Methods > Cost calculation and parameter optimization for a given budget
What the sources say
- Not checked yetcites [37] Hafemeister, C. How Many Cells. https://satijalab.org/howmanycells (2019).
- Not checked yetcites V377
plaindirect- Asserted: passes — The authors put it forward as true.
- Checkable: passes — It can be checked against evidence.
- Load-bearing: passes — The paper’s conclusions depend on it.
- Based: passes — The paper gives a reason why it holds.
Probably not a substantial claim.
What the paper did — it cites no source for this, so there is none to check. The quote shows it is in the paper.
In the paper
“In addition, we simulated different extreme prior distributions to evaluate their influence on the optimal experimental parameters.”
§ scPower accelerates and optimizes the design of multi-sample single cell transcriptomic studies > Methods > Simulation of effect sizes and gene rank distributions
plain- Asserted: passes — The authors put it forward as true.
- Checkable: passes — It can be checked against evidence.
- Load-bearing: fails — The paper’s conclusions may not depend on it.
- Based: passes — The paper gives a reason why it holds.
Probably not a substantial claim. The paper’s conclusions may not depend on it.
The paper states this without a source or data behind it here, so there is nothing to check it against. The quote shows it is in the paper.
In the paper
“The overall experimental cost for a 10X Genomics experiment is the sum of the library preparation cost and the sequencing cost.”
§ scPower accelerates and optimizes the design of multi-sample single cell transcriptomic studies > Methods > Cost calculation and parameter optimization for a given budget
plain- Asserted: passes — The authors put it forward as true.
- Checkable: passes — It can be checked against evidence.
- Load-bearing: passes — The paper’s conclusions depend on it.
- Based: passes — The paper gives a reason why it holds.
Probably not a substantial claim.
The paper states this without a source or data behind it here, so there is nothing to check it against. The quote shows it is in the paper.
In the paper
“Doublets also appear in Smart-seq2, but as a constant factor, not increasing with a higher number of cells per individual.”
§ scPower accelerates and optimizes the design of multi-sample single cell transcriptomic studies > Methods > Evaluation of Drop-seq and Smart-seq2 data
hedged- Asserted: passes — The authors put it forward as true.
- Checkable: passes — It can be checked against evidence.
- Load-bearing: fails — The paper’s conclusions may not depend on it.
- Based: fails — The paper may give no reason why it holds.
Probably not a substantial claim. The paper’s conclusions may not depend on it. The paper may give no reason why it holds. It may state two separate claims as one.
In the paper
“powsimR: uses training data to fit the parameters of the expression distributions for each cell type and gene.”
§ scPower accelerates and optimizes the design of multi-sample single cell transcriptomic studies > Methods > Comparison with simulation-based power analysis tools
What the sources say
- Not checked yetcites powsimR
plaindirect- Asserted: passes — The authors put it forward as true.
- Checkable: passes — It can be checked against evidence.
- Load-bearing: fails — The paper’s conclusions may not depend on it.
- Based: passes — The paper gives a reason why it holds.
Probably not a substantial claim. The paper’s conclusions may not depend on it.
None of the sources cited for this claim have been checked yet.
In the paper
“Two data sets of the human cell atlas were used for that, a Drop-seq data set measured in lung tissue52 and a Smart-seq2 data set measured in pancreas tissue51.”
§ scPower accelerates and optimizes the design of multi-sample single cell transcriptomic studies > Methods > Evaluation of Drop-seq and Smart-seq2 data
What the sources say
- Not checked yetcites [52] Vieira Braga, F. A. et al. A cellular census of human lungs identifies novel cell states in health and in asthma. Nat. Med. 25, 1153–1163 (2019). source
- Not checked yetcites [51] Enge, M. et al. Single-cell analysis of human pancreas reveals transcriptional signatures of aging and somatic mutation patterns. Cell 171, 321–330.e14 (2017). source
plain- Asserted: passes — The authors put it forward as true.
- Checkable: passes — It can be checked against evidence.
- Load-bearing: passes — The paper’s conclusions depend on it.
- Based: passes — The paper gives a reason why it holds.
Probably not a substantial claim. It may state two separate claims as one.
The paper states this without a source or data behind it here, so there is nothing to check it against. The quote shows it is in the paper.
In the paper
“The log fold changes for the DE studies were modeled as normally distributed.”
§ scPower accelerates and optimizes the design of multi-sample single cell transcriptomic studies > Methods > Simulation of effect sizes and gene rank distributions
plain- Asserted: passes — The authors put it forward as true.
- Checkable: passes — It can be checked against evidence.
- Load-bearing: fails — The paper’s conclusions may not depend on it.
- Based: passes — The paper gives a reason why it holds.
Probably not a substantial claim. The paper’s conclusions may not depend on it.
The authors state this as an assumption.
An unconfounded experimental design with batches containing both controls and cases is assumed for batch effect correction.
“under the assumptions of an unconfounded experimental design with batches containing both controls and cases, batch effects can be removed by adding a batch covariate to the regression model71.”
The authors state this as an assumption.
The counts of each gene in each cell type follow a negative binomial distribution.
“We assume a negative binomial distribution () for the counts of each gene in each cell type with and .”
The authors state this as an assumption.
The sum of gene counts follows a negative binomial distribution with parameters altered by the number of cells per cell type and donor.
“The sum of gene counts follows a negative binomial distribution where the parameters are altered by the number of cells per cell type and donor to and .”
The authors state this as an assumption.
The distribution of mean values over all genes in a cell type is a mixture of a zero component and two left-censored gamma distributions.
“To generalize the expression probability model also for unseen data sets, the distribution of the mean values over all genes in a cell type is modelled as a mixture distribution with three components, a zero component and two left-censored gamma distributions 7”
The authors state this as an assumption.
The relationship between mean UMI counts per cell and the gamma parameters is linear.
“The relationship between the mean UMI counts per cell and the gamma parameters (mean and standard deviation of the two gamma distributions) is linear and values are estimated by linear regression, fitted over the gamma distribution for each run and all subsampled runs.”
The authors state this as an assumption.
The number of transcriptome mapped reads is linearly related to the logarithm of the mean UMI counts per cell, with increasing read depth leading to saturation of UMIs.
“The number of transcriptome mapped reads is linearly related to the logarithm of the mean UMI counts per cell, with an increasing read depth leading to a saturation of UMIs.”
The authors state this as an assumption.
The residuals in the eQTL power calculation are i.i.d. normally distributed.
“This power calculation assumes that the residuals are i.i.d. normally distributed.”
The authors state this as an assumption.
Genotypes are generated according to Hardy-Weinberg equilibrium.
“A random genotype vector with of length is generated with the expected number of each genotype according to Hardy Weinberg equilibrium.”
The authors state this as an assumption.
Gene expression counts are sampled from a negative binomial distribution parameterized for each genotype.
“The associated gene expression count vector is sampled from a negative binomial distribution parameterized for each genotype with mean and dispersion .”
The authors state this as an assumption.
Overall detection power is the product of expression probability and power to detect DEGs/eQTLs, as both are conditionally independent given expression mean.
“The overall detection power for DEGs/eQTLs is the product of the expression probability and power to detect DEGs/eQTLs, as both probabilities are conditionally independent given the expression mean of the gene.”
The authors state this as an assumption.
Nearly all doublets are detectable using Demuxlet and Scrublet and discarded during preprocessing of the data set.
“We assume that nearly all doublets are detectable using Demuxlet and Scrublet and discarded during the preprocessing of the data set.”
The authors state this as an assumption.
Doublets contain 80% more reads than singlets.
“Again following the approach of37, we assume that doublets contain 80% more reads than singlets.”
The paper relies on this without support.
No simulation-based power analysis for eQTLs exists (and also no other method).
“As no simulation-based power analysis for eQTLs exists (and also no other method), we benchmarked the eQTL power with our own simulation tool (described in the methods section Power analysis for expression quantitative trait loci).”
Claims other papers make about this one
Each is checked against this paper’s own text: does it say what the citing paper says it does?
The source backs part of the claim, not all of it — or backs it for a different population, condition or comparison.
In the citing paper
“Finally, the power to detect differentially expressed genes with AD or β-amyloid depends strongly on numbers of independent samples [62].”
From Characterisation of premature cell senescence in Alzheimer's disease using single nuclear transcriptomics (2024) · cites this paper as [62]
Experimental — accuracy not yet measured
Citations
Cites
Moderated estimation of fold change and dispersion for RNA-seq data with DESeq2
Love, M. I., Huber, W., & Anders, S. (2014) · Genome Biology · doi:10.1186/s13059-014-0550-8 · Cited by 95,106
Statistical power analysis for the behavioral sciences
Cohen, J. (1990) · Computers Environment and Urban Systems · doi:10.1016/0198-9715(90)90050-4 · Cited by 65,417
Robinson, M. D., McCarthy, D. J., & Smyth, G. K. (2010) · Bioinformatics · doi:10.1093/bioinformatics/btp616 · Cited by 41,364
limma powers differential expression analyses for RNA-sequencing and microarray studies
Ritchie, M. E., Phipson, B., Wu, D., Hu, Y., Law, C. W., Shi, W., & Smyth, G. K. (2015) · Nucleic Acids Research · doi:10.1093/nar/gkv007 · Cited by 40,458
Fast unfolding of communities in large networks
Blondel, V. D., Guillaume, J.-L., Lambiotte, R., & Lefebvre, E. (2008) · Journal of Statistical Mechanics: Theory and Experiment · doi:10.1088/1742-5468/2008/10/p10008 · Cited by 21,424
Differential expression analysis for sequence count data
Anders, S., & Huber, W. (2010) · Genome Biology · doi:10.1186/gb-2010-11-10-r106 · Cited by 15,581
SCANPY: large-scale single-cell gene expression data analysis
Wolf, F. A., Angerer, P., & Theis, F. J. (2018) · Genome Biology · doi:10.1186/s13059-017-1382-0 · Cited by 8,881
Self-citationMassively parallel digital transcriptional profiling of single cells
Zheng, G. X. Y., Terry, J. M., Belgrader, P., Ryvkin, P., Bent, Z. W., Wilson, R., Ziraldo, S. B., Wheeler, T. D., McDermott, G. P., Zhu, J., et al. (2017) · Nature Communications · doi:10.1038/ncomms14049 · Cited by 7,353
Highly parallel genome-wide expression profiling of individual cells using nanoliter droplets.
Macosko, E. Z., Basu, A., Satija, R., Nemesh, J., Shekhar, K., Goldman, M., Tirosh, I., Bialas, A. R., Kamitaki, N., Martersteck, E. M., et al. (2015) · Cell · doi:10.1016/j.cell.2015.05.002 · Cited by 7,110
voom: precision weights unlock linear model analysis tools for RNA-seq read counts
Law, C. W., Chen, Y., Shi, W., & Smyth, G. K. (2014) · Genome Biology · doi:10.1186/gb-2014-15-2-r29 · Cited by 6,155
The GTEx Consortium atlas of genetic regulatory effects across human tissues
The GTEx Consortium, Aguet, F., Anand, S., Ardlie, K. G., Gabriel, S., Getz, G. A., Graubert, A., Hadley, K., Handsaker, R. E., Huang, K. H., et al. (2020) · Science · doi:10.1126/science.aaz1776 · Cited by 5,547
Multiple comparisons among means
Dunn, O. J. (1961) · Journal of the American Statistical Association · doi:10.1080/01621459.1961.10482090 · Cited by 5,006
Genetic effects on gene expression across human tissues
GTEx Consortium (2017) · Nature · doi:10.1038/nature24277 · Cited by 4,036
mRNA-Seq whole-transcriptome analysis of a single cell
Tang, F., Barbacioru, C., Wang, Y., Nordman, E., Lee, C., Xu, N., Wang, X., Bodeau, J., Tuch, B. B., Siddiqui, A., et al. (2009) · Nature Methods · doi:10.1038/nmeth.1315 · Cited by 3,969
Finak, G., McDavid, A., Yajima, M., Deng, J., Gersuk, V., Shalek, A. K., Slichter, C. K., Miller, H. W., McElrath, M. J., Prlic, M., et al. (2015) · Genome Biology · doi:10.1186/s13059-015-0844-5 · Cited by 3,159
Scrublet: computational identification of cell doublets in single-cell transcriptomic data
Wolock, S. L., Lopez, R., & Klein, A. M. (2018) · doi:10.1101/357368 · Cited by 2,758
Scrublet: computational identification of cell doublets in single-cell transcriptomic data
Wolock, S. L., Lopez, R., & Klein, A. M. (2019) · Cell Systems · doi:10.1016/j.cels.2018.11.005 · Cited by 2,758
Deep generative modeling for single-cell transcriptomics
Lopez, R., Regier, J., Cole, M. B., Jordan, M. I., & Yosef, N. (2018) · Nature Methods · doi:10.1038/s41592-018-0229-2 · Cited by 2,530
Regev, A., Teichmann, S. A., Lander, E. S., Amit, I., Benoist, C., Birney, E., Bodenmiller, B., Campbell, P., Carninci, P., Clatworthy, M., et al. (2017) · eLife · doi:10.7554/elife.27041 · Cited by 2,232
Self-citationCurrent best practices in single-cell RNA-seq analysis: a tutorial
Luecken, M. D., & Theis, F. J. (2019) · Molecular Systems Biology · doi:10.15252/msb.20188746 · Cited by 2,231
Self-citationRNA sequencing: the teenage years
Stark, R., Grzelak, M., & Hadfield, J. (2019) · Nature Reviews Genetics · doi:10.1038/s41576-019-0150-2 · Cited by 2,041
Transcriptome and genome sequencing uncovers functional variation in humans
The Geuvadis Consortium, Lappalainen, T., Sammeth, M., Friedländer, M. R., ‘t Hoen, P. A. C., Monlong, J., Rivas, M. A., Gonzàlez-Porta, M., Kurbatova, N., Griebel, T., et al. (2013) · Nature · doi:10.1038/nature12531 · Cited by 1,888
Recovering Gene Interactions from Single-Cell Data Using Data Diffusion
van Dijk, D., Sharma, R., Nainys, J., Yim, K., Kathail, P., Carr, A. J., Burdziak, C., Moon, K. R., Chaffer, C. L., Pattabiraman, D., et al. (2018) · Cell · doi:10.1016/j.cell.2018.05.061 · Cited by 1,829
Massively parallel single-cell RNA-seq for marker-free decomposition of tissues into cell types
Jaitin, D. A., Kenigsberg, E., Keren-Shaul, H., Elefant, N., Paul, F., Zaretsky, I., Mildner, A., Cohen, N., Jung, S., Tanay, A., et al. (2014) · Science · doi:10.1126/science.1247651 · Cited by 1,795
Wolf, F. A., Hamey, F. K., Plass, M., Solana, J., Dahlin, J. S., Göttgens, B., Rajewsky, N., Simon, L., & Theis, F. J. (2019) · Genome Biology · doi:10.1186/s13059-019-1663-x · Cited by 1,698
Self-citationComparative Analysis of Single-Cell RNA Sequencing Methods
Ziegenhain, C., Vieth, B., Parekh, S., Reinius, B., Guillaumet-Adkins, A., Smets, M., Leonhardt, H., Heyn, H., Hellmann, I., & Enard, W. (2017) · Molecular Cell · doi:10.1016/j.molcel.2017.01.023 · Cited by 1,494
Regev, A., Teichmann, S. A., Lander, E. S., Amit, I., Benoist, C. O., Birney, E., Bodenmiller, B., & al, E. (2017) · Zurich Open Repository and Archive (University of Zurich) · doi:10.5167/uzh-162597 · Cited by 1,457
Bayesian approach to single-cell differential expression analysis
Kharchenko, P. V., Silberstein, L., & Scadden, D. T. (2014) · Nature Methods · doi:10.1038/nmeth.2967 · Cited by 1,348
Eleven grand challenges in single-cell data science
Lähnemann, D., Köster, J., Szczurek, E., McCarthy, D. J., Hicks, S. C., Robinson, M. D., Vallejos, C. A., Campbell, K. R., Beerenwinkel, N., Mahfouz, A., et al. (2020) · Genome Biology · doi:10.1186/s13059-020-1926-6 · Cited by 1,327
Self-citationChen, Y., Lun, A. T. L., & Smyth, G. K. (2016) · F1000Research · doi:10.12688/f1000research.8987.2 · Cited by 1,272
Computational and analytical challenges in single-cell transcriptomics
Stegle, O., Teichmann, S. A., & Marioni, J. C. (2015) · Nature Reviews Genetics · doi:10.1038/nrg3833 · Cited by 1,170
Multiplexed droplet single-cell RNA-sequencing using natural genetic variation
Kang, H. M., Subramaniam, M., Targ, S., Nguyen, M., Maliskova, L., McCarthy, E., Wan, E., Wong, S., Byrnes, L., Lanata, C. M., et al. (2018) · Nature Biotechnology · doi:10.1038/nbt.4042 · Cited by 1,101
Confronting false discoveries in single-cell differential expression
Squair, J. W., Gautier, M., Kathe, C., Anderson, M. A., James, N. D., Hutson, T. H., Hudelle, R., Qaiser, T., Matson, K. J. E., Barraud, Q., et al. (2021) · doi:10.1101/2021.03.12.435024 · Cited by 1,086
Single-cell RNA-seq denoising using a deep count autoencoder
Eraslan, G., Simon, L. M., Mircea, M., Mueller, N. S., & Theis, F. J. (2019) · Nature Communications · doi:10.1038/s41467-018-07931-2 · Cited by 1,084
Self-citationLun, A. T. L., Riesenfeld, S. J., Andrews, T. S., Dao, T. P., Gomes, T., Jamboree, P. I. T. 1. H. C. A., & Marioni, J. C. (2019) · Genome biology · doi:10.1186/s13059-019-1662-y · Cited by 1,072
Stegle, O., Parts, L., Piipari, M., Winn, J., & Durbin, R. (2012) · Nature Protocols · doi:10.1038/nprot.2011.457 · Cited by 1,049
Exponential scaling of single-cell RNA-seq in the past decade
Svensson, V., Vento-Tormo, R., & Teichmann, S. A. (2018) · Nature Protocols · doi:10.1038/nprot.2017.149 · Cited by 1,034
SEQC/MAQC-III Consortium (2014) · Nature Biotechnology · doi:10.1038/nbt.2957 · Cited by 983
Monaco, G., Lee, B., Xu, W., Mustafah, S., Hwang, Y. Y., Carré, C., Burdin, N., Visan, L., Ceccarelli, M., Poidinger, M., et al. (2019) · Cell Reports · doi:10.1016/j.celrep.2019.01.041 · Cited by 958
Comparative Analysis of Single-Cell RNA Sequencing MethodsPreprint
Ziegenhain, C., Vieth, B., Parekh, S., et al. (2016) · bioRxiv · doi:10.1101/035758 · Cited by 951
Splatter: simulation of single-cell RNA sequencing data
Zappia, L., Phipson, B., & Oshlack, A. (2017) · Genome Biology · doi:10.1186/s13059-017-1305-0 · Cited by 905
Massively parallel digital transcriptional profiling of single cellsPreprint
Zheng, G. X. Y., Terry, J. M., Belgrader, P., et al. (2016) · bioRxiv (Cold Spring Harbor Laboratory) · doi:10.1101/065912 · Cited by 897
A cellular census of human lungs identifies novel cell states in health and in asthma
Vieira Braga, F. A., Kar, G., Berg, M., Carpaij, O. A., Polanski, K., Simon, L. M., Brouwer, S., Gomes, T., Hesse, L., Jiang, J., et al. (2019) · Nature Medicine · doi:10.1038/s41591-019-0468-5 · Cited by 896
Self-citationMapping complex disease traits with global gene expression
Cookson, W., Liang, L., Abecasis, G., Moffatt, M., & Lathrop, M. (2009) · Nature Reviews Genetics · doi:10.1038/nrg2537 · Cited by 849
Bias, robustness and scalability in single-cell differential expression analysis
Soneson, C., & Robinson, M. D. (2018) · Nature Methods · doi:10.1038/nmeth.4612 · Cited by 770
Independent filtering increases detection power for high-throughput experiments
Bourgon, R., Gentleman, R. C., & Huber, W. K. (2010) · Proceedings of the National Academy of Sciences · doi:10.1073/pnas.0914005107 · Cited by 731
Multiple Comparisons Among Means
Dunn, O. J. (1961) · Journal of the American Statistical Association · doi:10.2307/2282330 · Cited by 710
Quantitative assessment of single-cell RNA-sequencing methods
Wu, A. R., Neff, N. F., Kalisky, T., Dalerba, P., Treutlein, B., Rothenberg, M. E., Mburu, F. M., Mantalas, G. L., Sim, S., Clarke, M. F., et al. (2014) · Nature Methods · doi:10.1038/nmeth.2694 · Cited by 696
Genetic Drivers of Epigenetic and Transcriptional Variation in Human Immune Cells
Chen, L., Ge, B., Casale, F. P., Vasquez, L., Kwan, T., Garrido-Martín, D., Watt, S., Yan, Y., Kundu, K., Ecker, S., et al. (2016) · Cell · doi:10.1016/j.cell.2016.10.026 · Cited by 679 · cited 1×
“The effect sizes for the eQTL and DE power were taken from published studies, accessible in the supplement of Chen et al. 2016 (https://doi.org/10.1016/j.cell.2016.10.026), Rendeiro et al. 2016 (https://doi.org/10.1038/ncomms11938), Moreno-Moral et al. 2018…”
MethodInfluentialDNA microarrays in drug discovery and development
Debouck, C. M., & Goodfellow, P. N. (1999) · Nature Genetics · doi:10.1038/4475 · Cited by 654
Revealing the vectors of cellular identity with single-cell genomics
Wagner, A., Regev, A., & Yosef, N. (2016) · Nature Biotechnology · doi:10.1038/nbt.3711 · Cited by 632
Systems genetics approaches to understand complex traits
Civelek, M., & Lusis, A. J. (2014) · Nature Reviews Genetics · doi:10.1038/nrg3575 · Cited by 621
Power analysis of single-cell RNA-sequencing experiments
Svensson, V., Natarajan, K. N., Ly, L.-H., Miragaia, R. J., Labalette, C., Macaulay, I. C., Cvejic, A., & Teichmann, S. A. (2017) · Nature Methods · doi:10.1038/nmeth.4220 · Cited by 568
Enge, M., Arda, H. E., Mignardi, M., Beausang, J., Bottino, R., Kim, S. K., & Quake, S. R. (2017) · Cell · doi:10.1016/j.cell.2017.09.004 · Cited by 568
Cell type–specific genetic regulation of gene expression across human tissues
Kim-Hellmuth, S., Aguet, F., Oliva, M., Muñoz-Aguirre, M., Kasela, S., Wucher, V., Castel, S. E., Hamel, A. R., Viñuela, A., Roberts, A. L., et al. (2020) · Science · doi:10.1126/science.aaz8528 · Cited by 541
Crowell, H. L., Soneson, C., Germain, P.-L., Calini, D., Collin, L., Raposo, C., Malhotra, D., & Robinson, M. D. (2020) · Nature Communications · doi:10.1038/s41467-020-19894-4 · Cited by 515
Kahan, B. C., Jairath, V., Doré, C. J., & Morris, T. P. (2014) · Trials · doi:10.1186/1745-6215-15-139 · Cited by 497
Gene expression profiling of alveolar rhabdomyosarcoma with cDNA microarrays.
Khan, J. I., Simon, R., Bittner, M. L., Chen, Y., Leighton, S. B., Pohida, T. J., Smith, P. D., Jiang, Y. Y., Gooden, G. C., Trent, J. M., et al. (1998) · PubMed · Cited by 437
Single-cell RNA sequencing identifies celltype-specific cis-eQTLs and co-expression QTLs
Study, L. C., van der Wijst, M. G. P., BIOS Consortium, Brugge, H., de Vries, D. H., Deelen, P., Swertz, M. A., & Franke, L. (2018) · Nature Genetics · doi:10.1038/s41588-018-0089-9 · Cited by 399
MetaCell: analysis of single-cell RNA-seq data using K-nn graph partitions
Baran, Y., Bercovich, A., Sebé-Pedrós, A., Lubling, Y., Giladi, A., Chomsky, E., Meir, Z., Hoichman, M., Lifshitz, A., & Tanay, A. (2019) · Genome biology · doi:10.1186/s13059-019-1812-2 · Cited by 392
The GTEx Consortium atlas of genetic regulatory effects across human tissuesPreprint
Aguet, F., Barbeira, A., Bonazzola, R., Brown, A. A., Castel, S. E., Jo, B., Kasela, S., Kim-Hellmuth, S., Liang, Y., Oliva, M., et al. (2019) · bioRxiv (Cold Spring Harbor Laboratory) · doi:10.1101/787903 · Cited by 386
Droplet scRNA-seq is not zero-inflated
Svensson, V. (2019) · doi:10.1101/582064 · Cited by 356
Calculating Sample Size Estimates for RNA Sequencing Data
Hart, S. N., Therneau, T. M., Zhang, Y., Poland, G. A., & Kocher, J.-P. (2013) · Journal of Computational Biology · doi:10.1089/cmb.2012.0283 · Cited by 341
Cuomo, A. S. E., Seaton, D. D., McCarthy, D. J., Martinez, I., Bonder, M. J., Garcia-Bernardo, J., Amatya, S., Madrigal, P., Isaacson, A., Buettner, F., et al. (2020) · Nature Communications · doi:10.1038/s41467-020-14457-z · Cited by 331
Computational methods for theidentification of differential and coordinated gene expression
Claverie, J. (1999) · Human Molecular Genetics · doi:10.1093/hmg/8.10.1821 · Cited by 287
Wang, T., Li, B., Nelson, C. E., & Nabavi, S. (2019) · BMC Bioinformatics · doi:10.1186/s12859-019-2599-6 · Cited by 286
A statistical approach for identifying differential distributions in single-cell RNA-seq experiments
Korthauer, K. D., Chu, L.-F., Newton, M. A., Li, Y., Thomson, J., Stewart, R., & Kendziorski, C. (2016) · Genome Biology · doi:10.1186/s13059-016-1077-y · Cited by 273
The Genotype-Tissue Expression (GTEx) project
Lonsdale, J., Thomas, J., Salvatore, M., Phillips, R., Lo, E., Shad, S., Hasz, R., Walters, G., Garcia, F., Young, N., et al. (2013) · Nature Genetics · doi:10.1038/ng.2653 · Cited by 263
Power analysis and sample size estimation for RNA-Seq differential expression
Ching, T., Huang, S., & Garmire, L. X. (2014) · RNA · doi:10.1261/rna.046011.114 · Cited by 263
Hernández, A. V., Steyerberg, E. W., & Habbema, J. D. F. (2004) · Journal of Clinical Epidemiology · doi:10.1016/j.jclinepi.2003.09.014 · Cited by 258
Age-Dependent Pancreatic Gene Regulation Reveals Mechanisms Governing Human β Cell Function
Arda, H. E., Li, L., Tsai, J., Torre, E. A., Rosli, Y., Peiris, H., Spitale, R. C., Dai, C., Gu, X., Qu, K., et al. (2016) · Cell Metabolism · doi:10.1016/j.cmet.2016.04.002 · Cited by 222 · cited 1×
“…accessible in the supplement of Chen et al. 2016 (https://doi.org/10.1016/j.cell.2016.10.026), Rendeiro et al. 2016 (https://doi.org/10.1038/ncomms11938), Moreno-Moral et al. 2018 (https://doi.org/10.1136/annrheumdis-2017-212454) and Arda et al, 2016 (https://doi.org/ 10.1016/j.cmet.2016.04.002).”
InfluentialSingle cells make big data: New challenges and opportunities in transcriptomics
Angerer, P., Simon, L. M., Tritschler, S., Wolf, F., Fischer, D. S., & Theis, F. J. (2017) · Current Opinion in Systems Biology · doi:10.1016/j.coisb.2017.07.004 · Cited by 218
Self-citationTutorial: guidelines for the experimental design of single-cell RNA sequencing studies
Lafzi, A., Moutinho, C., Picelli, S., & Heyn, H. (2018) · Nature Protocols · doi:10.1038/s41596-018-0073-y · Cited by 218
The single-cell eQTLGen consortium
van der Wijst, M. G. P., de Vries, D., Groot, H. E., Trynka, G., Hon, C.-C., Bonder, M. J., Stegle, O., Nawijn, M. C., Idaghdour, Y., van der Harst, P., et al. (2020) · eLife · doi:10.7554/elife.52155 · Cited by 218
Self-citationData denoising with transfer learning in single-cell transcriptomics
Wang, J., Agarwal, D., Huang, M. C., Hu, G., Zhou, Z., Ye, C., & Zhang, N. R. (2019) · Nature Methods · doi:10.1038/s41592-019-0537-1 · Cited by 190
DNA methylation in lung cells is associated with asthma endotypes and genetic risk
Nicodemus-Johnson, J., Myers, R. A., Sakabe, N. J., Sobreira, D. R., Hogarth, D. K., Naureckas, E. T., Sperling, A. I., Solway, J., White, S. R., Nobrega, M. A., et al. (2016) · JCI Insight · doi:10.1172/jci.insight.90151 · Cited by 180
Exponential scaling of single-cell RNA-seq in the last decadePreprint
Svensson, V., Vento‐Tormo, R., & Teichmann, S. A. (2017) · arXiv (Cornell University) · doi:10.48550/arxiv.1704.01379 · Cited by 169
Heimberg, G., Bhatnagar, R., El-Samad, H., & Thomson, M. (2016) · Cell Systems · doi:10.1016/j.cels.2016.04.001 · Cited by 156
powsimR: power analysis for bulk and single cell RNA-seq experiments
Vieth, B., Ziegenhain, C., Parekh, S., Enard, W., & Hellmann, I. (2017) · Bioinformatics · doi:10.1093/bioinformatics/btx435 · Cited by 155
Liu, P., & Hwang, J. T. G. (2007) · Bioinformatics · doi:10.1093/bioinformatics/btl664 · Cited by 153
Rendeiro, A. F., Schmidl, C., Strefford, J. C., Walewska, R., Davis, Z., Farlik, M., Oscier, D., & Bock, C. (2016) · Nature Communications · doi:10.1038/ncomms11938 · Cited by 146 · cited 1×
“…eQTL and DE power were taken from published studies, accessible in the supplement of Chen et al. 2016 (https://doi.org/10.1016/j.cell.2016.10.026), Rendeiro et al. 2016 (https://doi.org/10.1038/ncomms11938), Moreno-Moral et al. 2018 (https://doi.org/10.1136/annrheumdis-2017-212454) and Arda et…”
MethodInfluentialScotty: a web tool for designing RNA-Seq experiments to measure differential gene expression
Busby, M. A., Stewart, C., Miller, C. A., Grzeda, K. R., & Marth, G. T. (2013) · Bioinformatics · doi:10.1093/bioinformatics/btt015 · Cited by 140
Bi, R., & Liu, P. (2016) · BMC Bioinformatics · doi:10.1186/s12859-016-0994-9 · Cited by 126
PROPER: comprehensive power evaluation for differential expression using RNA-seq
Wu, H., Wang, C., & Wu, Z. J. (2014) · Bioinformatics · doi:10.1093/bioinformatics/btu640 · Cited by 114
Sample size for FDR-control in microarray data analysis
Jung, S. (2005) · Computer applications in the biosciences · doi:10.1093/bioinformatics/bti456 · Cited by 113
UMI-count modeling and differential expression analysis for single-cell RNA sequencing
Chen, W., Li, Y., Easton, J., Finkelstein, D., Wu, G., & Chen, X. (2018) · Genome Biology · doi:10.1186/s13059-018-1438-9 · Cited by 113
Sample size calculation for comparing two negative binomial rates
Zhu, H., & Lakkis, H. (2014) · Statistics in Medicine · doi:10.1002/sim.5947 · Cited by 97
Comparison of methods to detect differentially expressed genes between single-cell populations
Jaakkola, M. K., Seyednasrollah, F., Mehmood, A., & Elo, L. L. (2016) · Briefings in Bioinformatics · doi:10.1093/bib/bbw057 · Cited by 86
McEnhancer: predicting gene expression via semi-supervised assignment of enhancers to target genes
Hafez, D., Calviello, A. K., Krueger, S., Hwang, Y.-C., Wang, L., Zinzen, R. P., & Ohler, U. (2017) · Genome biology · doi:10.1186/s13059-017-1316-x · Cited by 86
Moreno-Moral, A., Bagnati, M., Koturan, S., Ko, J.-H., Fonseca, C., Harmston, N., Game, L., Martin, J., Ong, V., Abraham, D. J., et al. (2018) · Annals of the Rheumatic Diseases · doi:10.1136/annrheumdis-2017-212454 · Cited by 78 · cited 1×
“…accessible in the supplement of Chen et al. 2016 (https://doi.org/10.1016/j.cell.2016.10.026), Rendeiro et al. 2016 (https://doi.org/10.1038/ncomms11938), Moreno-Moral et al. 2018 (https://doi.org/10.1136/annrheumdis-2017-212454) and Arda et al, 2016 (https://doi.org/ 10.1016/j.cmet.2016.04.002).”
InfluentialA statistical simulator scDesign for rational scRNA-seq experimental design
Li, W. V., & Li, J. J. (2019) · Bioinformatics · doi:10.1093/bioinformatics/btz321 · Cited by 74
Discovery and characterization of variance QTLs in human induced pluripotent stem cells
Sarkar, A. K., Tung, P.-Y., Blischak, J. D., Burnett, J. E., Li, Y. I., Stephens, M., & Gilad, Y. (2019) · PLOS Genetics · doi:10.1371/journal.pgen.1008045 · Cited by 72
Sample size determination for the false discovery rate
Pounds, S. B., & Cheng, C. (2005) · Bioinformatics · doi:10.1093/bioinformatics/bti699 · Cited by 69
Design and analysis of comparative microarray experiments
Speed, T. P. (2003) · doi:10.1201/9780203011232-9 · Cited by 67
Brückl, T. M., Spoormaker, V. I., Sämann, P. G., Brem, A., Henco, L., Czamara, D., Elbau, I., Grandi, N. C., Jollans, L., Kühnel, A., et al. (2020) · BMC Psychiatry · doi:10.1186/s12888-020-02541-z · Cited by 66
Self-citationStatistical Analysis of Gene Expression Microarray Data.
Edwards, D. (2004) · Biometrics · doi:10.1111/j.0006-341x.2004.172_2.x · Cited by 65
Optimized design of single-cell RNA sequencing experiments for cell-type-specific eQTL analysis
Mandric, I., Schwarz, T., Majumdar, A., Hou, K., Briscoe, L., Perez, R., Subramaniam, M., Hafemeister, C., Satija, R., Ye, C. J., et al. (2020) · Nature Communications · doi:10.1038/s41467-020-19365-w · Cited by 62
MetaCell: analysis of single cell RNA-seq data using k-NN graph partitionsPreprint
Baran, Y., Sebé-Pedrós, A., Lubling, Y., et al. (2018) · bioRxiv (Cold Spring Harbor Laboratory) · doi:10.1101/437665 · Cited by 61
Lyles, R. H., Lin, H., & Williamson, J. M. (2007) · Statistics in Medicine · doi:10.1002/sim.2617 · Cited by 57
SCOPIT: sample size calculations for single-cell sequencing experiments
Davis, A., Gao, R., & Navin, N. E. (2019) · BMC Bioinformatics · doi:10.1186/s12859-019-3167-9 · Cited by 57
The birth of a human-specific neural gene by incomplete duplication and gene fusion
Dougherty, M. L., Nuttle, X., Penn, O., Nelson, B. J., Huddleston, J., Baker, C. A., Harshman, L., Duyzend, M., Ventura, M., Antonacci, F., et al. (2017) · Genome biology · doi:10.1186/s13059-017-1163-9 · Cited by 51
Chen, W., Zhang, S., Williams, J., Ju, B., Shaner, B., Easton, J., Wu, G., & Chen, X. (2020) · Computational and Structural Biotechnology Journal · doi:10.1016/j.csbj.2020.03.026 · Cited by 44
Heinrich, V., Stange, J., Dickhaus, T., Imkeller, P., Krüger, U., Bauer, S., Mundlos, S., Robinson, P. N., Hecht, J., & Krawitz, P. M. (2012) · Nucleic Acids Research · doi:10.1093/nar/gkr1073 · Cited by 43
Crowell, H. L., Soneson, C., Germain, P.-L., et al. (2019) · bioRxiv · doi:10.1101/713412 · Cited by 40
Simulation, power evaluation and sample size recommendation for single-cell RNA-seq
Su, K., Wu, Z. J., & Wu, H. (2020) · Bioinformatics · doi:10.1093/bioinformatics/btaa607 · Cited by 35
Feasibility of sample size calculation for RNA-seq studies
Poplawski, A., & Binder, H. (2016) · Briefings in Bioinformatics · doi:10.1093/bib/bbw144 · Cited by 33
Jc, P. (1972) · PubMed · Cited by 27
Effect of decreased O2 affinity of hemoglobin on work performance during exercise in healthy humans.
Farber, M. O., Sullivan, T. Y., Fineberg, N. S., Carlone, S., & Manfredi, F. (1984) · PubMed · Cited by 22
General power and sample size calculations for high-dimensional genomic data
van Iterson, M., van de Wiel, M. A., Boer, J. M., & de Menezes, R. X. (2013) · Statistical Applications in Genetics and Molecular Biology · doi:10.1515/sagmb-2012-0046 · Cited by 21
Abrams, D., Kumar, P., Karuturi, R. K. M., & George, J. (2019) · BMC Bioinformatics · doi:10.1186/s12859-019-2817-2 · Cited by 13
Cuomo, A. S. E., Seaton, D. D., McCarthy, D. J., Martinez, I., Bonder, M. J., Garcia‐Bernardo, J., Amatya, S., Madrigal, P., Isaacson, A., Buettner, F., et al. (2020) · Nature Communications · doi:10.1038/s41467-020-15098-y · Cited by 12
Li, C.-I., & Shyr, Y. (2016) · Statistical Applications in Genetics and Molecular Biology · doi:10.1515/sagmb-2016-0008 · Cited by 7
Optimal design of single-cell RNA sequencing experiments for cell-type-specific eQTL analysisPreprint
Mandric, I., Schwarz, T., Majumdar, A., et al. (2019) · bioRxiv (Cold Spring Harbor Laboratory) · doi:10.1101/766972 · Cited by 5
heiniglab/scPower: First release
Matthiasheinig, & KatharinaSchmid (2021) · Zenodo (CERN European Organization for Nuclear Research) · doi:10.5281/zenodo.5552752 · Cited by 1
Cited by
Sorted by citations
Spatial components of molecular tissue biology
Palla, G., Fischer, D. S., Regev, A., & Theis, F. J. (2022) · Nature Biotechnology · doi:10.1038/s41587-021-01182-1 · Cited by 318
“This problem has been investigated in the context of dissociation-based assays 177,178 but is yet unexplored for spatial molecular data. conclusions Spatial profiling carries the promise of connecting variation in high-dimensional single-cell omics datasets with interpretable biological phenomena…”
Self-citationDestVI identifies continuums of cell types in spatial transcriptomics data
Lopez, R., Li, B., Keren-Shaul, H., Boyeau, P., Kedmi, M., Pilzer, D., Jelinski, A., Yofe, I., David, E., Wagner, A., et al. (2022) · Nature Biotechnology · doi:10.1038/s41587-022-01272-8 · Cited by 276
“In general, we suggest that users of DestVI prepare their single-cell RNA sequencing data according to power analysis tools [69].”
MethodSingle-cell transcriptomics for the assessment of cardiac disease
Miranda, A. M. A., Janbandhu, V., Maatz, H., Kanemaru, K., Cranley, J., Teichmann, S. A., Hübner, N., Schneider, M. D., Harvey, R. P., & Noseda, M. (2023) · Nature Reviews Cardiology · doi:10.1038/s41569-022-00805-7 · Cited by 117
Oelen, R., de Vries, D. H., Brugge, H., Gordon, M. G., Vochteloo, M., Ye, C., Westra, H.-J., Franke, L., & van der Wijst, M. G. P. (2022) · Nature Communications · doi:10.1038/s41467-022-30893-5 · Cited by 120
“However, since the statistical power to detect such DE effects is correlated with the number of cells within a subcell type 32 , likely some of the subcell type speci fi city remains undetectable.”
BackgroundOptimizing expression quantitative trait locus mapping workflows for single-cell studies
Cuomo, A. S. E., Alvari, G., Azodi, C. B. D., McCarthy, D. J., & Bonder, M. J. (2021) · Genome biology · doi:10.1186/s13059-021-02407-x · Cited by 73
Metadata
- Authors
- Schmid, K. T., Höllbacher, B., Cruceanu, C., Böttcher, A., Lickert, H., Binder, E. B., Theis, F. J., & Heinig, M.
- Affiliations
- Helmholtz Munich (DE)
- Max Planck Institute of Psychiatry (DE)
- Emory University (US)
- Corresponding author
- Heinig, Matthias
- ORCID
- Venue
- Nature Communications
- Published
- 2021-11-16
- Volume
- 12
- Issue
- 1
- Pages
- 6625-6625
- ISSN
- 2041-1723 (ISSN-L)
- PMC
- PMC8595682
- OpenAlex
- W3211534834
- Semantic Scholar
- 1aeafd4db890f4a11c64061242fe173d416cfdaf
- Cited by
- 108
- References
- 110
- Citations by year
- 2026: 19 · 2025: 24 · 2024: 26 · 2023: 13 · 2022: 19 · 2021: 6
- FWCI
- 5.02
- Type
- journal article
- Language
- en
- Open access
- gold
- doi.org
- Locations
- Nature Communications (publishedVersion, cc-by)
- bioRxiv (Cold Spring Harbor Laboratory) (acceptedVersion, cc-by-nc-nd)
- Research Square (acceptedVersion, cc-by)
- PubMed Central (publishedVersion, cc-by)
- PubMed (publishedVersion)
- MPG.PuRe (Max Planck Society) (submittedVersion, other-oa)
- PuSH - Publication Server of Helmholtz Zentrum München (submittedVersion, cc-by)
- RePEc: Research Papers in Economics (submittedVersion)
- DOAJ (DOAJ: Directory of Open Access Journals) (submittedVersion, cc-by-sa)
- mediaTUM (Technical University of Munich) (submittedVersion, other-oa)
- Site cant be reached (submittedVersion, cc-by)
- Funders
- Silicon Valley Community Foundation (182835)
- Chan Zuckerberg Initiative (182835)
- Bundesministerium für Bildung und Forschung (01IS18053A, 01IS18036A)
- Helmholtz Zentrum München
- Topics
- Life Sciences › Biochemistry, Genetics and Molecular Biology › Molecular Biology › Single-cell and spatial transcriptomics
- Life Sciences › Biochemistry, Genetics and Molecular Biology › Molecular Biology › Gene expression and cancer classification
- Life Sciences › Biochemistry, Genetics and Molecular Biology › Molecular Biology › Genomics and Phylogenetic Studies
- Keywords
- single-cell RNA sequencing, statistical power analysis, sample size optimization, sequencing depth, expression quantitative trait loci, R package, web-based tool
- MeSH terms
- Exome Sequencing, Humans, Research Design, Gene Expression, Sequence Analysis, RNA, Sample Size, Gene Expression Profiling, Quantitative Trait Loci, Single-Cell Analysis, Transcriptome
About these checks
Registry, retraction, Cites and statistics results are computed, not judged, with one exception: a printed reference that no index lists is read once by a model before it counts as a citation error. Claims are extracted by a model and kept only when their quote appears verbatim in the text; each cited source is then checked, with a model’s help, for whether it says what the claim relies on. Those verdicts can be wrong — read the claim’s quote and the cited source before relying on one.
A language model drew the claims from the paper on 2026-10-10, under version 3 of the claim definition (model deepseek-v4.1-flash, prompt extract-v3).
A second model labelled each claim on 2026-10-10 (model jev-1.13-20260917, definition revision gold-guideline-v0.2).
Cited sources are checked with a language model’s help (gpt-6-sol).
Statistics and arithmetic are recomputed, not judged.
Confidence bands are shown only for fields calibrated on our annotated test set. None is calibrated yet, so no band is shown.
What counts as a claim ›How we measure confidence ›How we check this ›
Are you an author, or do you see a problem with this page? Request a review
