

The DOI matches its Crossref record; 75 of the 76 references it cites were found in a registry or an index.
Discovery of drug-omics associations in type 2 diabetes with generative deep-learning models
Open accessAbstract
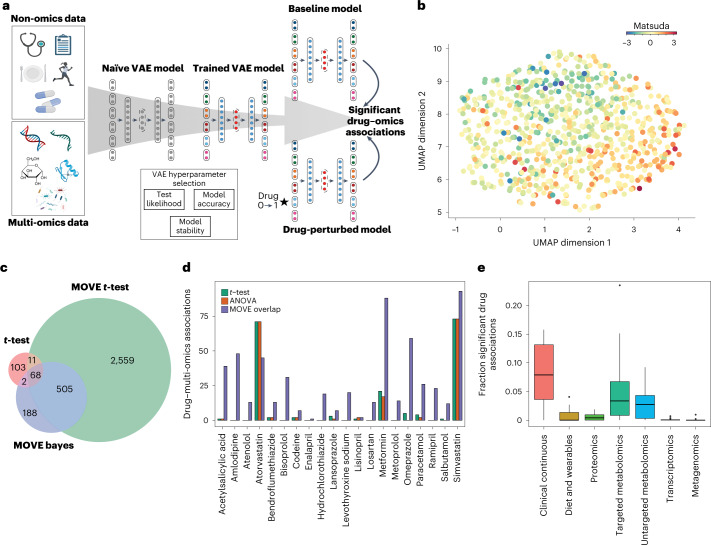
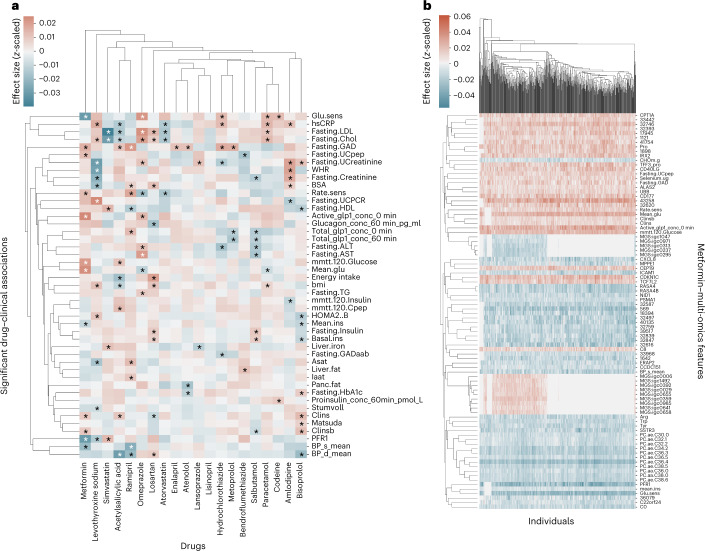
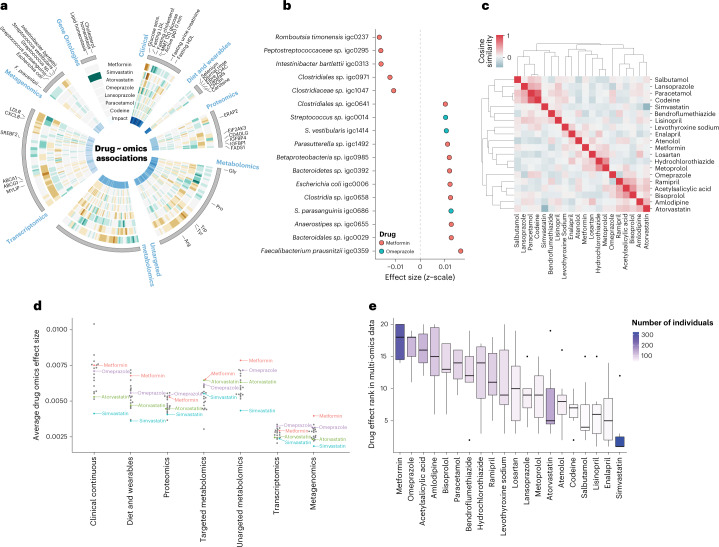
The application of multiple omics technologies in biomedical cohorts has the potential to reveal patient-level disease characteristics and individualized response to treatment. However, the scale and heterogeneous nature of multi-modal data makes integration and inference a non-trivial task. We developed a deep-learning-based framework, multi-omics variational autoencoders (MOVE), to integrate such data and applied it to a cohort of 789 people with newly diagnosed type 2 diabetes with deep multi-omics phenotyping from the DIRECT consortium. Using in silico perturbations, we identified drug–omics associations across the multi-modal datasets for the 20 most prevalent drugs given to people with type 2 diabetes with substantially higher sensitivity than univariate statistical tests. From these, we among others, identified novel associations between metformin and the gut microbiota as well as opposite molecular responses for the two statins, simvastatin and atorvastatin. We used the associations to quantify drug–drug similarities, assess the degree of polypharmacy and conclude that drug effects are distributed across the multi-omics modalities.
Overview
The claims and statistics of this paper haven’t been checked yet.
Run the check — free, no account needed. It reads the open-access text and checks the sources it cites.
Integrity signals
Registry
Cites
Statistics
Figures
Verification
Claims the paper makes
The claims and statistics of this paper haven’t been checked yet.
Run the check — free, no account needed. It reads the open-access text and checks the sources it cites.
Claims other papers make about this one
Each is checked against this paper’s own text: does it say what the citing paper says it does?
The cited source says what the claim attributes to it.
In the citing paper
“The integration of multi-omics datasets with the drug usage information has been used to identify drug-associated individual omics features, quantifying the drug response effects [18].”
From Challenges in AI-driven Biomedical Multimodal Data Fusion and Analysis (2025) · cites this paper as [18]
The cited source says what the claim attributes to it.
In the citing paper
“Additionally, Froguel et al. introduced a multi-omics variational autoencoders (MOVE) framework for identifying the associations between drug usage and multi-omics data features, helping characterize the drug effects on type 2 diabetes [18].”
From Challenges in AI-driven Biomedical Multimodal Data Fusion and Analysis (2025) · cites this paper as [18]
The cited source says what the claim attributes to it.
In the citing paper
“The MOVE framework utilized a perturbation-based approach to identify significant drug-related multimodal features in type 2 diabetes, providing a framework for interpreting biomedical multimodal datasets [18].”
From Challenges in AI-driven Biomedical Multimodal Data Fusion and Analysis (2025) · cites this paper as [18]
The cited source says what the claim attributes to it.
In the citing paper
“Although the perturbation-based method has been effective in characterizing the most drug-responsive omics features [18], there is still a need for further research and discussions to improve cross-modal interpretation by refining model designs.”
From Challenges in AI-driven Biomedical Multimodal Data Fusion and Analysis (2025) · cites this paper as [18]
Self-check
Percentages, sums and reported differences re-computed from the paper’s own numbers.
The self-check needs the paper’s full text.
Citations
Cites
Controlling the False Discovery Rate: A Practical and Powerful Approach to Multiple Testing
Benjamini, Y., & Hochberg, Y. (1995) · Journal of the Royal Statistical Society Series B: Statistical Methodology · doi:10.1111/j.2517-6161.1995.tb02031.x · Cited by 109,482
Adam: A Method for Stochastic Optimization
Kingma, D. P., & Ba, J. (2014) · arXiv · doi:10.48550/arxiv.1412.6980 · Cited by 98,946
SciPy 1.0: fundamental algorithms for scientific computing in Python
Virtanen, P., Gommers, R., Oliphant, T. E., Haberland, M., Reddy, T., Cournapeau, D., Burovski, E., Peterson, P., Weckesser, W., Bright, J., et al. (2020) · Nature Methods · doi:10.1038/s41592-019-0686-2 · Cited by 38,430
PyTorch: An Imperative Style, High-Performance Deep Learning Library
Paszke, A., Gross, S., Massa, F., Lerer, A., Bradbury, J., Chanan, G., Killeen, T., Lin, Z., Gimelshein, N., Antiga, L., et al. (2019) · arXiv · doi:10.48550/arxiv.1912.01703 · Cited by 31,473
Auto-Encoding Variational Bayes
Kingma, D. P., & Welling, M. (2013) · arXiv · doi:10.48550/arxiv.1312.6114 · Cited by 20,067
Reduction in the incidence of type 2 diabetes with lifestyle intervention or metformin
(2002) · New England Journal of Medicine · doi:10.1056/nejmoa012512 · Cited by 19,011
Kass, R. E., & Raftery, A. E. (1995) · Journal of the American Statistical Association · doi:10.1080/01621459.1995.10476572 · Cited by 12,558
SciPy 1.0: fundamental algorithms for scientific computing in Python
Virtanen, P., Gommers, R., Oliphant, T. E., Haberland, M., Reddy, T., Cournapeau, D., Burovski, E., Peterson, P., Weckesser, W., Bright, J., et al. (2019) · Apollo - University of Cambridge Repository · doi:10.17863/cam.64134 · Cited by 10,460
Cholesterol Treatment Trialists' (CTT) Collaboration (2010) · The Lancet · doi:10.1016/s0140-6736(10)61350-5 · Cited by 6,550
The Reactome pathway Knowledgebase
Fabregat, A., Sidiropoulos, K., Garapati, P., Gillespie, M., Hausmann, K., Haw, R., Jassal, B., Jupe, S., Korninger, F., McKay, S., et al. (2016) · Nucleic Acids Research · doi:10.1093/nar/gkv1351 · Cited by 5,605
Research works printed but not linked: 5
- Mattei, P.-A. & Frellsen, J. MIWAE: deep generative modelling and imputation of incomplete data. In Proceedings of the 36th International Conference on Machine Learning 4413–4423 (PMLR, 2019).
- Lopez, R., Boyeau, P., Yosef, N., Jordan, M. I. & Regier, J. Decision-making with auto-encoding variational Bayes. In Proceedings of the 34th International Conference on Neural Information Processing Systems 5081–5092 (Curran Associates Inc., 2020).
- Lundberg, S. M. & Lee, S.-I. A unified approach to interpreting model predictions. in Advances in Neural Information Processing Systems 30 (eds Guyon, I. et al.) 4765–4774 (Curran Associates, 2017).
- Srivastava, N., Hinton, G., Krizhevsky, A., Sutskever, I. & Salakhutdinov, R. Dropout: a simple way to prevent neural networks from overfitting. J. Mach. Learn. Res. 15, 1929–1958 (2014).
- Maas, A. L., Hannun, A. Y. & Ng, A. Y. Rectifier nonlinearities improve neural network acoustic models. In Proc. 30th International Conference on Machine Learning (eds Dasgupta, S. & McAllester, D.) (JMLR, 2013).
Cited by
Sorted by citations
Small molecule metabolites: discovery of biomarkers and therapeutic targets
Qiu, S., Cai, Y., Yao, H., Lin, C., Xie, Y., Tang, S., & Zhang, A. (2023) · Signal Transduction and Targeted Therapy · doi:10.1038/s41392-023-01399-3 · Cited by 993
Artificial intelligence in drug development
Zhang, K., Yang, X., Wang, Y., Yu, Y., Huang, N., Li, G. L., Li, X., Wu, J. C., & Yang, S. (2025) · Nature Medicine · doi:10.1038/s41591-024-03434-4 · Cited by 585
The promise of digital healthcare technologies
Yeung, A. W. K., Torkamani, A., Butte, A. J., Glicksberg, B. S., Schuller, B. W., Rodríguez, B., Ting, D. S. W., Bates, D. W., Schaden, E., Peng, H., et al. (2023) · Frontiers in Public Health · doi:10.3389/fpubh.2023.1196596 · Cited by 284
Self-citationPathology of pain and its implications for therapeutic interventions
Cao, B., Xu, Q., Shi, Y., Zhao, R., Li, H., Zheng, J., Liu, F., Wan, Y., & Wei, B. (2024) · Signal Transduction and Targeted Therapy · doi:10.1038/s41392-024-01845-w · Cited by 236
Multi-Omics Integration for the Design of Novel Therapies and the Identification of Novel Biomarkers
Ivanisevic, T., & Sewduth, R. (2023) · Proteomes · doi:10.3390/proteomes11040034 · Cited by 118
Metadata
- Authors
- Allesøe, R. L., Lundgaard, A. T., Hernández Medina, R., Aguayo-Orozco, A., Johansen, J., Nissen, J. N., Brorsson, C., Mazzoni, G., Niu, L., Biel, J. H., Leal Rodríguez, C., Brasas, V., Webel, H., Benros, M. E., Pedersen, A. G., Chmura, P. J., Jacobsen, U. P., Mari, A., Koivula, R., Mahajan, A., Vinuela, A., Tajes, J. F., Sharma, S., Haid, M., Hong, M.-G., Musholt, P. B., De Masi, F., Vogt, J., Pedersen, H. K., Gudmundsdottir, V., Jones, A., Kennedy, G., Bell, J., Thomas, E. L., Frost, G., Thomsen, H., Hansen, E., Hansen, T. H., Vestergaard, H., Muilwijk, M., Blom, M. T., ‘t Hart, L. M., Pattou, F., Raverdy, V., Brage, S., Kokkola, T., Heggie, A., McEvoy, D., Mourby, M., Kaye, J., Hattersley, A., McDonald, T., Ridderstråle, M., Walker, M., Forgie, I., Giordano, G. N., Pavo, I., Ruetten, H., Pedersen, O., Hansen, T., Dermitzakis, E., Franks, P. W., Schwenk, J. M., Adamski, J., McCarthy, M. I., Pearson, E., Banasik, K., Rasmussen, S., Brunak, S., IMI DIRECT Consortium, Froguel, P., Thomas, C. E., Haussler, R., Beulens, J., Rutters, F., Nijpels, G., van Oort, S., Groeneveld, L., Elders, P., Giorgino, T., Rodriquez, M., Nice, R., Perry, M., Bianzano, S., Graefe-Mody, U., Hennige, A., Grempler, R., Baum, P., Stærfeldt, H.-H., Shah, N., Teare, H., Ehrhardt, B., Tillner, J., Dings, C., Lehr, T., Scherer, N., Sihinevich, I., Cabrelli, L., Loftus, H., Bizzotto, R., Tura, A., Dekkers, K., van Leeuwen, N., Groop, L., Slieker, R., Ramisch, A., Jennison, C., McVittie, I., Frau, F., Steckel-Hamann, B., Adragni, K., Thomas, M., Pasdar, N. A., Fitipaldi, H., Kurbasic, A., Mutie, P., Pomares-Millan, H., Bonnefond, A., Canouil, M., Caiazzo, R., Verkindt, H., Holl, R., Kuulasmaa, T., Deshmukh, H., Cederberg, H., Laakso, M., Vangipurapu, J., Dale, M., Thorand, B., Nicolay, C., Fritsche, A., Hill, A., Hudson, M., Thorne, C., Allin, K., Arumugam, M., Jonsson, A., Engelbrechtsen, L., Forman, A., Dutta, A., Sondertoft, N., Fan, Y., Gough, S., Robertson, N., McRobert, N., Wesolowska-Andersen, A., Brown, A., Davtian, D., Dawed, A., Donnelly, L., Palmer, C., White, M., Ferrer, J., Whitcher, B., Artati, A., Prehn, C., Adam, J., Grallert, H., Gupta, R., Sackett, P. W., Nilsson, B., Tsirigos, K., Eriksen, R., Jablonka, B., Uhlen, M., Gassenhuber, J., Baltauss, T., de Preville, N., Klintenberg, M., & Abdalla, M.
- Affiliations
- University of Copenhagen (DK)
- Technical University of Denmark (DK)
- Centre for Human Genetics (GB)
- Helmholtz Munich (DE)
- Science for Life Laboratory (SE)
- Sanofi (Germany) (DE)
- University of Exeter (GB)
- University of Dundee (GB)
- University of Westminster (GB)
- Imperial College London (GB)
- Herlev Hospital (DK)
- Amsterdam Public Health (NL)
- Inserm (FR)
- University of Eastern Finland (FI)
- Newcastle University (GB)
- Royal Victoria Infirmary (GB)
- University of Oxford (GB)
- Lund University (SE)
- Eli Lilly (United States) (US)
- University of Geneva (CH)
- Harvard University (US)
- University of Ljubljana (SI)
- Institut de Recherches Internationales Servier (France) (FR)
- Royal Devon & Exeter NHS Foundation Trust (GB)
- Boehringer Ingelheim (Germany) (DE)
- University of Bath (GB)
- Saarland University (DE)
- Leiden University Medical Center (NL)
- Universität Ulm (DE)
- Eli Lilly (Germany) (DE)
- University of Tübingen (DE)
- Centro de Investigación Biomédica en Red Diabetes y Enfermedades Metabólicas Asociadas (ES)
- Corresponding author
- Rasmussen, Simon
- Brunak, Søren
- ORCID
- Allesøe, Rosa Lundbye
- Lundgaard, Agnete Troen
- Hernández Medina, Ricardo
- Johansen, Joachim
- Nissen, Jakob Nybo
- Brorsson, Caroline
- Mazzoni, Gianluca
- Niu, Lili
- Biel, Jorge Hernansanz
- Leal Rodríguez, Cristina
- Brasas, Valentas
- Webel, Henry
- Benros, Michael Eriksen
- Pedersen, Anders Gorm
- Chmura, Piotr Jaroslaw
- Jacobsen, Ulrik Plesner
- Mari, Andrea
- Koivula, Robert
- Mahajan, Anubha
- Vinuela, Ana
- Sharma, Sapna
- Haid, Mark
- Hong, Mun-Gwan
- Vogt, Josef
- Jones, Angus
- Kennedy, Gwen
- Bell, Jimmy
- Thomas, E. Louise
- Frost, Gary
- Thomsen, Henrik
- Hansen, Tue Haldor
- Vestergaard, Henrik
- Muilwijk, Mirthe
- Blom, Marieke T.
- Raverdy, Violeta
- Kokkola, Tarja
- Heggie, Alison
- McEvoy, Donna
- Mourby, Miranda
- Kaye, Jane
- Hattersley, Andrew
- McDonald, Timothy
- Ridderstråle, Martin
- Walker, Mark
- Forgie, Ian
- Giordano, Giuseppe N.
- Pavo, Imre
- Pedersen, Oluf
- Hansen, Torben
- Franks, Paul W.
- Schwenk, Jochen M.
- Adamski, Jerzy
- Pearson, Ewan
- Banasik, Karina
- Rasmussen, Simon
- Brunak, Søren
- Froguel, Philippe
- Thomas, Cecilia Engel
- Beulens, Joline
- Rutters, Femke
- Nijpels, Giel
- van Oort, Sabine
- Groeneveld, Lenka
- Elders, Petra
- Bianzano, Susanna
- Hennige, Anita
- Grempler, Rolf
- Baum, Patrick
- Shah, Nisha
- Teare, Harriet
- Ehrhardt, Beate
- Tillner, Joachim
- Dings, Christiane
- Lehr, Thorsten
- Bizzotto, Roberto
- Dekkers, Koen
- Slieker, Roderick
- Ramisch, Anna
- Jennison, Christopher
- Frau, Francesca
- Adragni, Kofi
- Thomas, Melissa
- Fitipaldi, Hugo
- Kurbasic, Azra
- Mutie, Pascal
- Caiazzo, Robert
- Holl, Reinhard
- Kuulasmaa, Teemu
- Deshmukh, Harshal
- Cederberg, Henna
- Laakso, Markku
- Vangipurapu, Jagadish
- Dale, Matilda
- Thorand, Barbara
- Fritsche, Andreas
- Hudson, Michelle
- Arumugam, Manimozhiyan
- Engelbrechtsen, Line
- Dutta, Avirup
- Fan, Yong
- Brown, Andrew
- Dawed, Adem
- Donnelly, Louise
- White, Margaret
- Ferrer, Jorge
- Whitcher, Brandon
- Prehn, Cornelia
- Adam, Jonathan
- Grallert, Harald
- Gupta, Ramneek
- Sackett, Peter Wad
- Nilsson, Birgitte
- Tsirigos, Konstantinos
- Eriksen, Rebeca
- Gassenhuber, Johann
- Abdalla, Moustafa
- Venue
- Nature Biotechnology
- Published
- 2023-01-02
- Volume
- 41
- Issue
- 3
- Pages
- 399-408
- ISSN
- 0733-222X (ISSN-L)
- 1087-0156
- 1546-1696
- PMC
- PMC10017515
- OpenAlex
- W4313455000
- Cited by
- 111
- References
- 76
- Citations by year
- 2026: 25 · 2025: 35 · 2024: 34 · 2023: 17
- FWCI
- 9.89
- Type
- journal article
- Language
- en
- Update notices
- correction (2023-05-02)
- Open access
- hybrid
- doi.org
- Locations
- Nature Biotechnology (publishedVersion, cc-by)
- PubMed Central (publishedVersion, cc-by)
- PubMed (publishedVersion)
- Discovery Research Portal (University of Dundee) (publishedVersion, cc-by)
- Amsterdam UMC (VU Amsterdam) - Institutional Repository (publishedVersion, other-oa)
- Research at the University of Copenhagen (University of Copenhagen) (publishedVersion, cc-by)
- Repositori digital de la UPF (Universitat Pompeu Fabra) (acceptedVersion, cc-by)
- WestminsterResearch (University of Westminster) (acceptedVersion, cc-by)
- Pure Amsterdam UMC (submittedVersion, cc-by)
- Technical University of Denmark, DTU Orbit (Technical University of Denmark, DTU) (submittedVersion, cc-by)
- Leiden Repository (Leiden University) (submittedVersion, cc-by)
- Apollo (University of Cambridge) (submittedVersion, cc-by)
- CNR ExploRA (submittedVersion, cc-by)
- Data Archiving and Networked Services (DANS) (submittedVersion, other-oa)
- Data Archiving and Networked Services (DANS) (submittedVersion, cc-by)
- HAL (submittedVersion)
- LillOA (Université de Lille (University Of Lille)) (submittedVersion, cc-by)
- Lund University Publications (Lund University) (submittedVersion)
- mediaTUM – the media and publications repository of the Technical University Munich (Technical University Munich) (submittedVersion)
- Apollo (cc-by)
- Apollo
- Funders
- Novo Nordisk Fonden (NNF14CC0001, NNF17OC0027594)
- Innovative Medicines Initiative (115317)
- Topics
- Life Sciences › Biochemistry, Genetics and Molecular Biology › Molecular Biology › Bioinformatics and Genomic Networks
- Life Sciences › Pharmacology, Toxicology and Pharmaceutics › Drug Discovery › Computational Drug Discovery Methods
- Physical Sciences › Computer Science › Artificial Intelligence › Machine Learning in Healthcare
- Keywords
- type 2 diabetes, multi-omics integration, variational autoencoder, metformin, gut microbiota, statins, simvastatin, atorvastatin, polypharmacy, drug-drug similarity
- MeSH terms
- Deep Learning, Algorithms, Diabetes Mellitus, Type 2, Humans
About these checks
Registry, retraction, Cites and statistics results are computed, not judged, with one exception: a printed reference that no index lists is read once by a model before it counts as a citation error. Claims are extracted by a model and kept only when their quote appears verbatim in the text; each cited source is then checked, with a model’s help, for whether it says what the claim relies on. Those verdicts can be wrong — read the claim’s quote and the cited source before relying on one.
Statistics and arithmetic are recomputed, not judged.
Confidence bands are shown only for fields calibrated on our annotated test set. None is calibrated yet, so no band is shown.
What counts as a claim ›How we measure confidence ›How we check this ›
Are you an author, or do you see a problem with this page? Request a review
