

The DOI matches its Crossref record; 52 of the 58 references it cites were found in a registry or an index; 15 of the 21 sources its claims cite were checked for support.
Oligodendrocytes produce amyloid-β and contribute to plaque formation alongside neurons in Alzheimer’s disease model mice
Open accessPublished version of a preprint
Abstract
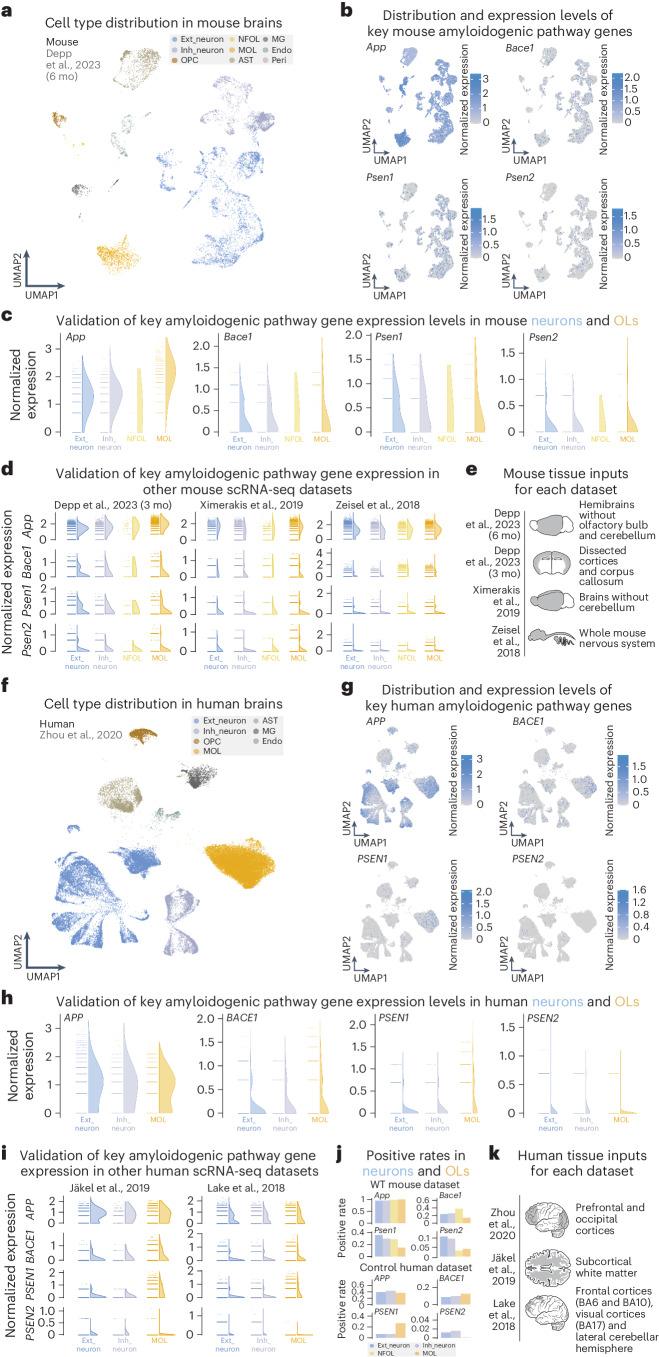
Amyloid-β (Aβ) is thought to be neuronally derived in Alzheimer’s disease (AD). However, transcripts of amyloid precursor protein ( APP ) and amyloidogenic enzymes are equally abundant in oligodendrocytes (OLs). By cell-type-specific deletion of Bace1 in a humanized knock-in AD model, APP NLGF , we demonstrate that OLs and neurons contribute to Aβ plaque burden. For rapid plaque seeding, excitatory projection neurons must provide a threshold level of Aβ. Ultimately, our findings are relevant for AD prevention and therapeutic strategies.
Overview
AI snapshot
Written from the paper’s full text.
TL;DR
Oligodendrocytes express amyloidogenic machinery and contribute to Aβ plaque burden in a humanized APP knock-in AD mouse model, but excitatory neurons must supply a threshold level of Aβ for rapid plaque seeding. Cell-type-specific Bace1 deletion shows oligodendroglial Aβ accounts for roughly 30% of plaque burden, while neuronal Aβ drives most plaque formation.
Key findings
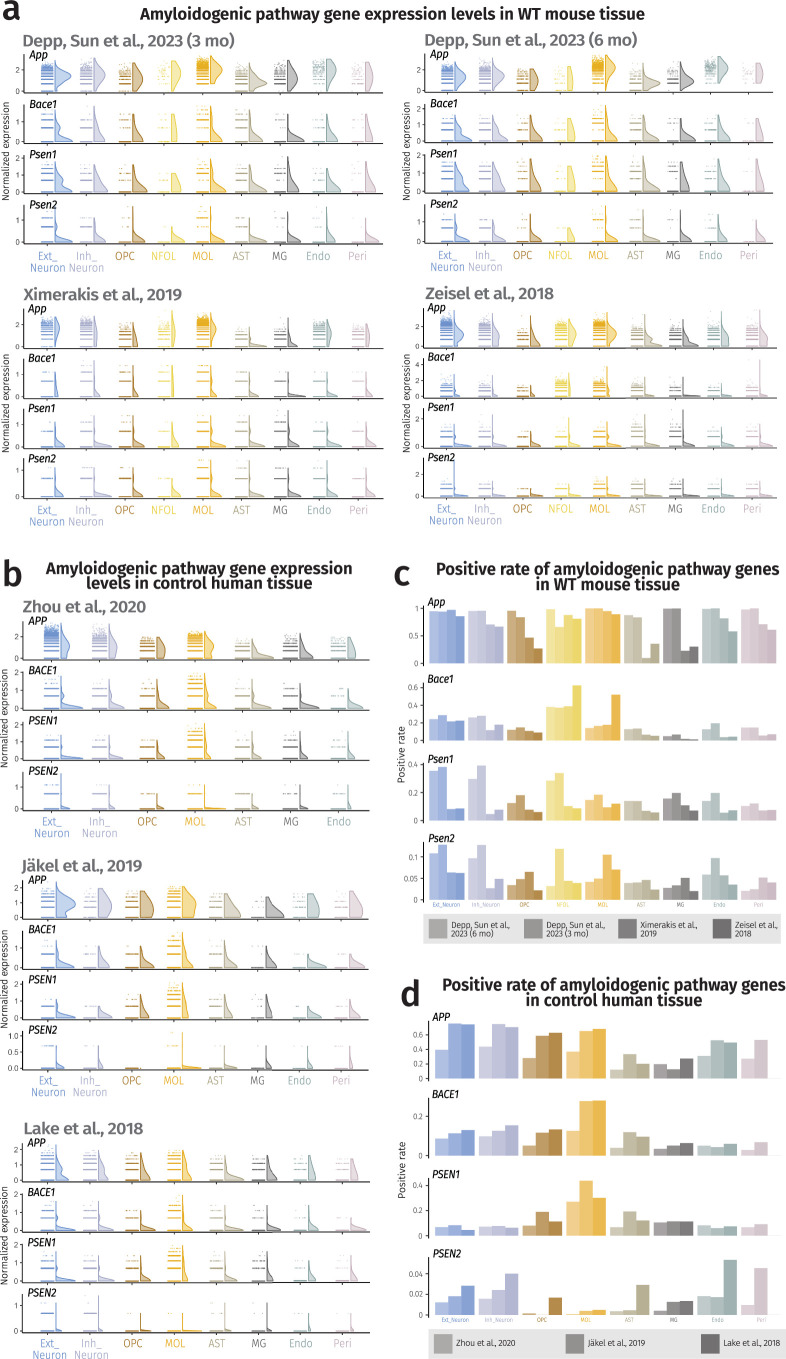
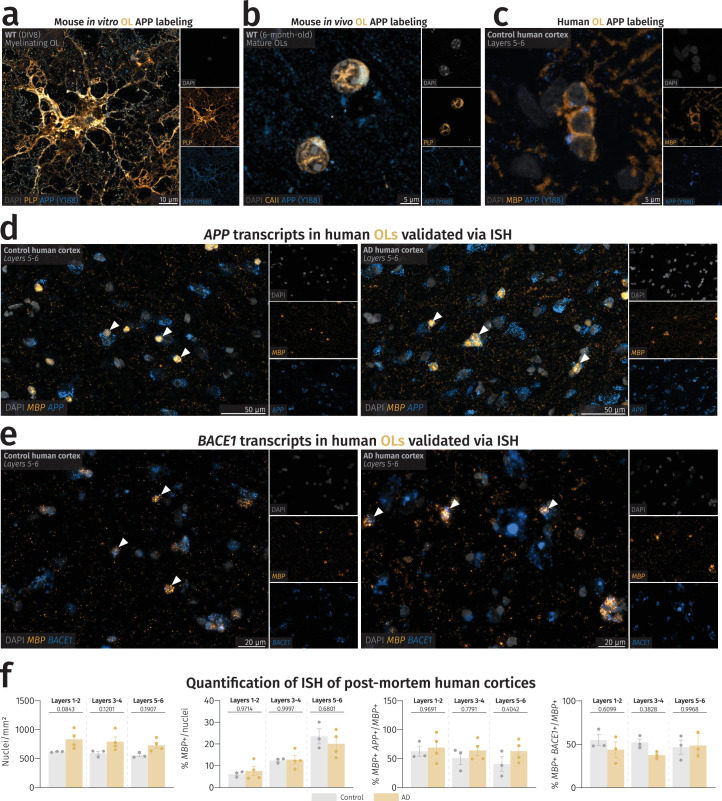
- Mouse and human oligodendrocytes express APP, BACE1, PSEN1 and PSEN2 at levels similar to neurons; in human cortical tissue, approximately 50% of gray matter oligodendrocytes expressed considerable APP and BACE1 mRNA in both AD cases and controls.
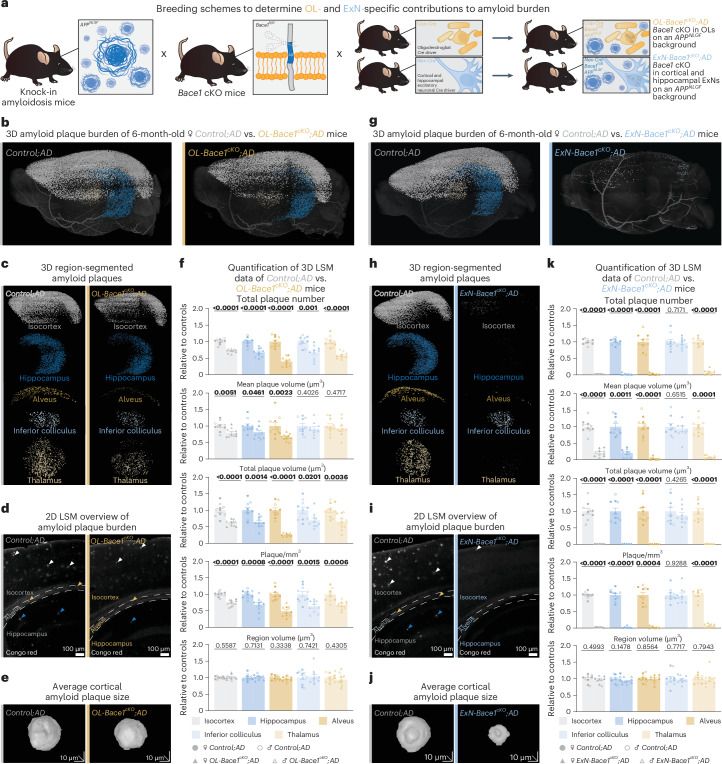
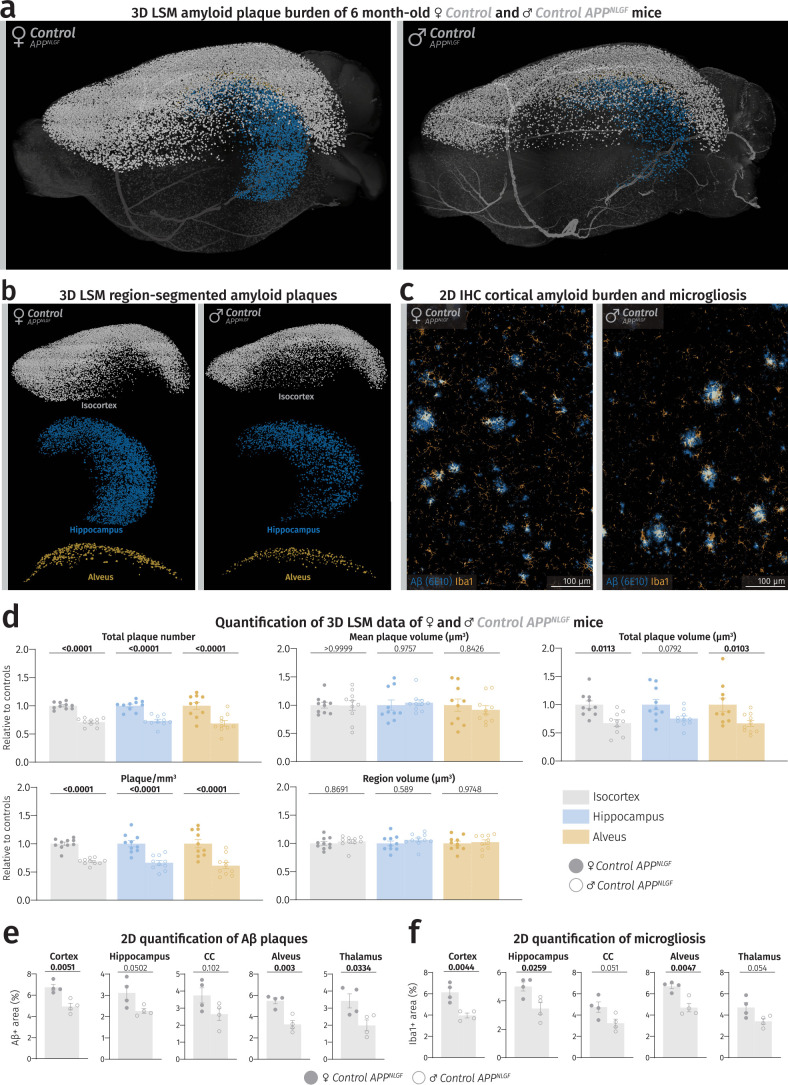
- Oligodendrocyte-specific Bace1 knockout in APPNLGF mice (OL-Bace1cKO;AD) reduced plaque burden by approximately 30% versus controls in both sexes, with the greatest decrease in plaque amount and size in the alveus.
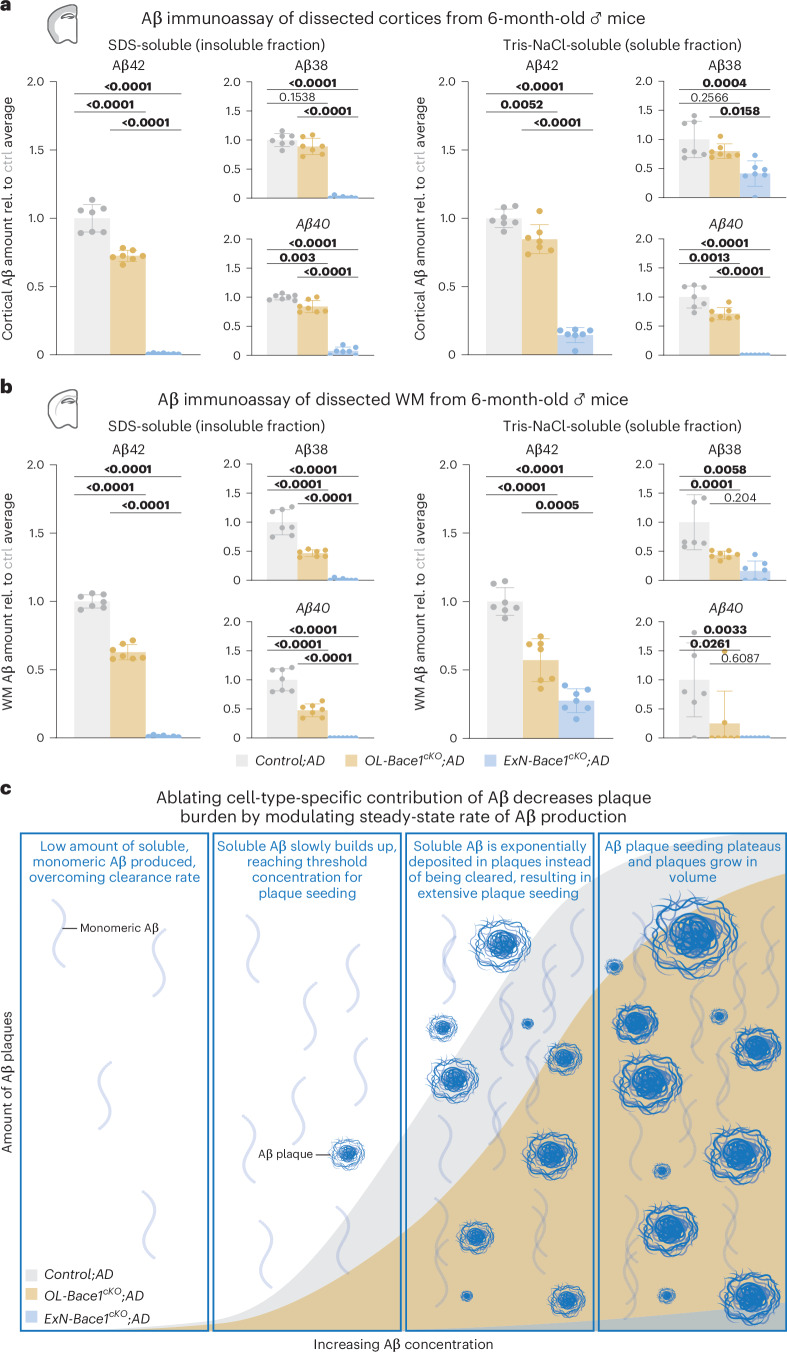
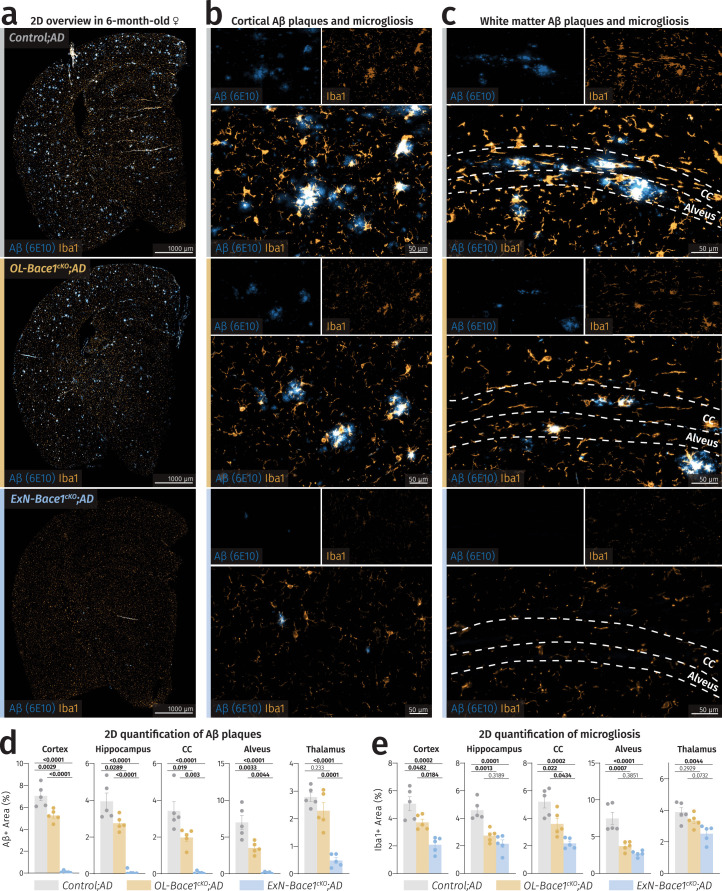
- Excitatory neuron-specific Bace1 knockout (ExN-Bace1cKO;AD) reduced plaque burden by 95–98% versus controls, but soluble Aβ42 remained at 14.925% ± 0.066% in cortex and 27.604% ± 0.072% in white matter, indicating residual non-excitatory-neuron Aβ production.
- OL-ExN-Bace1cKO;AD mice developed almost no cerebral plaques and showed almost complete loss of Aβ42 compared with ExN-Bace1cKO;AD samples; heterozygous APPNLGF mice developed less than 10% plaque burden rather than 50%, and 12-month-old ExN-Bace1cKO;AD mice showed considerable plaque deposition.
Methods
- Reanalyzed four mouse and three human single-cell/single-nucleus RNA sequencing datasets for APP, BACE1, PSEN1 and PSEN2 expression using Seurat and SCTransform; validated expression with in situ hybridization in mouse and human tissue.
- Generated conditional Bace1 knockout APPNLGF knock-in mice using Cnp-Cre for oligodendrocytes and Nex-Cre for dorsal telencephalic excitatory neurons, with littermate controls; analyzed both sexes.
- Used light sheet microscopy of Congo red-stained hemibrains at 6 months for plaque burden, electrochemiluminescence immunoassay for Aβ38/Aβ40/Aβ42, western blotting, electron microscopy, and in vitro oligodendrocyte cultures; statistics included unpaired two-tailed Student’s t-tests and one-way ANOVA with Tukey multiple comparison tests, with n = 5 per sex for LSM and n = 7 per group for immunoassay.
Limitations
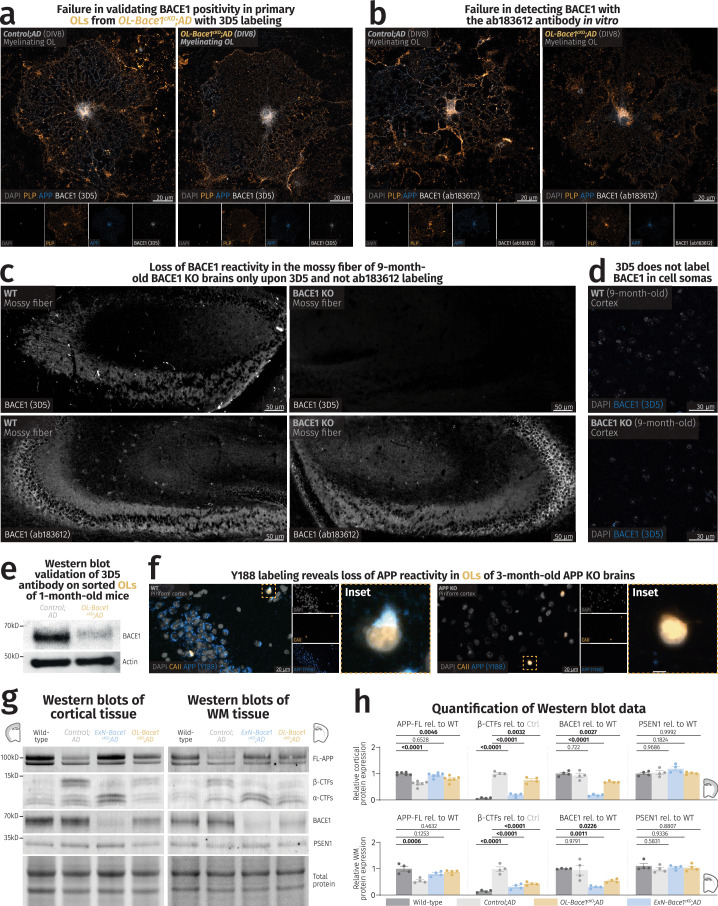
- The paper states that Bace1 conditional knockout could not be validated by immunocytochemistry using the 3D5 antibody; validation was instead performed by immunoblotting sorted oligodendrocytes.
- The paper states that blinding was not possible for various imaging analyses because Bace1 conditional knockout visibly affected plaque load, and that no statistical methods were used to pre-determine sample sizes.
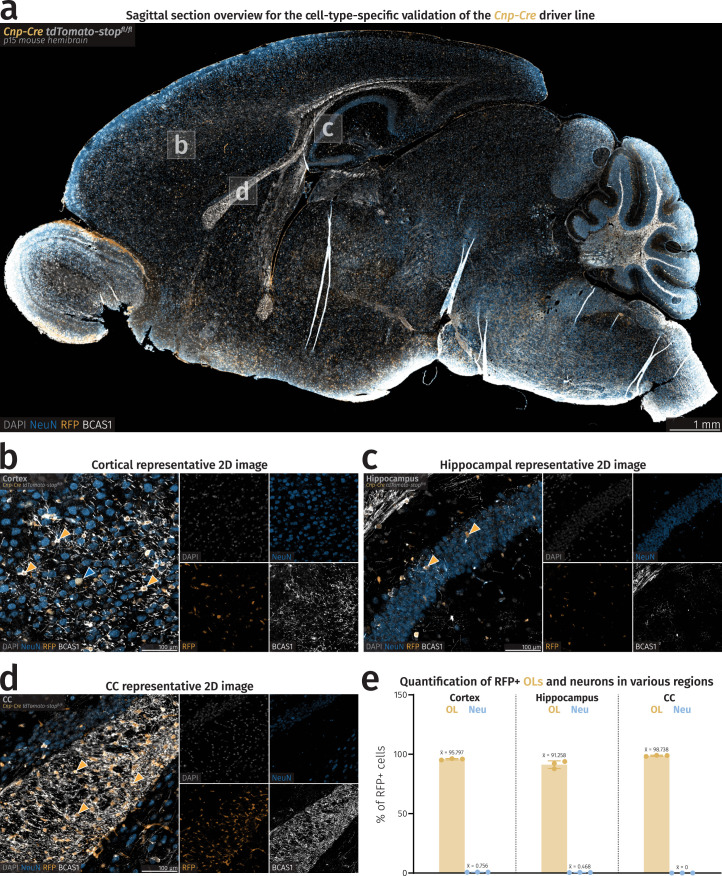
- Evident from the text: Cnp-Cre showed low but nonzero neuronal recombination (cortical 0.756% ± 0.057%; hippocampal 0.468% ± 0.111% tdTomato+ neurons), and human tissue analysis used a small sample (control: one female, two male; AD: two female, two male).
Model-written summary. Check it against the paper before relying on it.
Integrity signals
Registry
Cites
Statistics
Figures
Verification
Claims the paper makes
20 Own result · 16 Own method · 13 Own interpretation · 3 Partly supported · 3 No full text of the sources · 2 Couldn’t confirm · 1 Supported · accuracy not yet measured
The cited sources that could be checked couldn’t confirm or dispute this claim.
In the paper
“transcripts of amyloid precursor protein (APP) and amyloidogenic enzymes are equally abundant in oligodendrocytes (OLs).”
- Also stated in: § Main · plain
“expression levels were similar between neurons and OLs”
§ Oligodendrocytes produce amyloid-β and contribute to plaque formation alongside neurons in Alzheimer’s disease model mice > Abstract
What the sources say
- Could not verifycites [9] Depp, C. et al. Myelin dysfunction drives amyloid-β deposition in models of Alzheimer’s disease. Nature 618, 349–357 (2023). sourceExperimental — accuracy not yet measured
The section “Myelin dysfunction affects APP metabolism” (Fig. 3; page not provided) describes APP and processing enzymes in mouse axonal swellings, not transcript abundance in oligodendrocytes versus neurons. Searches for APP, BACE1, PSEN1 and PSEN2 expression comparisons in mouse and human tissue found no passage establishing the claimed similarity. (LLM, conf=0.76)
- Could not verifycites [10] Ximerakis, M. et al. Single-cell transcriptomic profiling of the aging mouse brain. Nat. Neurosci. 22, 1696–1708 (2019). sourceExperimental — accuracy not yet measured
The Identification of cell types section describes single-cell profiles from mouse brains, including neurons and oligodendrocytes, but does not compare expression of APP, BACE1, PSEN1 or PSEN2 between them. Searches for those genes and amyloid precursor protein found no such comparison in our copy, which is truncated; the claim about human tissue is also unaddressed. (LLM, conf=0.72)
- Could not verifycites [11] Zeisel, A. et al. Molecular architecture of the mouse nervous system. Cell 174, 999–1014 (2018). sourceExperimental — accuracy not yet measured
The Results section on the oligodendrocyte lineage describes cell types and regional expression patterns, but does not compare APP or amyloidogenic-enzyme transcript abundance between oligodendrocytes and neurons. Searches for APP, BACE1, PSEN1, PSEN2, and amyloidogenic enzymes found no passage addressing that comparison in mouse or human tissue. Page numbers were unavailable in our copy. (LLM, conf=0.76)
- Could not verifycites [12] Zhou, Y. et al. Human and mouse single-nucleus transcriptomics reveal TREM2-dependent and TREM2-independent cellular responses in Alzheimer’s disease. Nat. Med. 26, 131–142 (2020). sourceExperimental — accuracy not yet measured
The Results section on AD-reactive oligodendrocytes and the Discussion describe changes in myelination, metabolic-response, C4b and Serpina3n transcripts, but do not compare amyloidogenic-pathway transcript abundance between oligodendrocytes and neurons. Searches for APP, BACE1, PSEN1, PSEN2 and amyloidogenic enzymes found no passage establishing the claimed similarity in mouse or human tissue. No page numbers were available in our copy. (LLM, conf=0.75)
- Could not verifycites [13] Jäkel, S. et al. Altered human oligodendrocyte heterogeneity in multiple sclerosis. Nature 566, 543–547 (2019). sourceExperimental — accuracy not yet measured
The paper’s Abstract (page not provided) describes oligodendrocyte subclusters and their similarities across human and mouse tissue, but does not compare amyloidogenic-gene expression in oligodendrocytes and neurons. Searches for APP, BACE1, PSEN1, PSEN2, and amyloid precursor protein found no passage addressing the claimed equal abundance. (LLM, conf=0.72)
- Could not verifycites [14] Lake, B. B. et al. Integrative single-cell analysis of transcriptional and epigenetic states in the human adult brain. Nat. Biotechnol. 36, 70–80 (2018). sourceExperimental — accuracy not yet measured
The Results section on oligodendrocyte maturation reports myelin and glutamate-receptor gene expression, not a neuron–oligodendrocyte comparison of amyloidogenic genes (page unavailable). Searches for APP, BACE1, PSEN1, PSEN2, and amyloidogenic enzymes found no passage in our copy establishing that their transcript levels are similar in mouse or human nervous tissue. (LLM, conf=0.74)
plain- Asserted: passes — The authors put it forward as true.
- Checkable: passes — It can be checked against evidence.
- Load-bearing: passes — The paper’s conclusions depend on it.
- Based: passes — The paper gives a reason why it holds.
- Also stated in: § Main · plain
The cited sources support only part of this claim — read each source’s verdict below.
In the paper
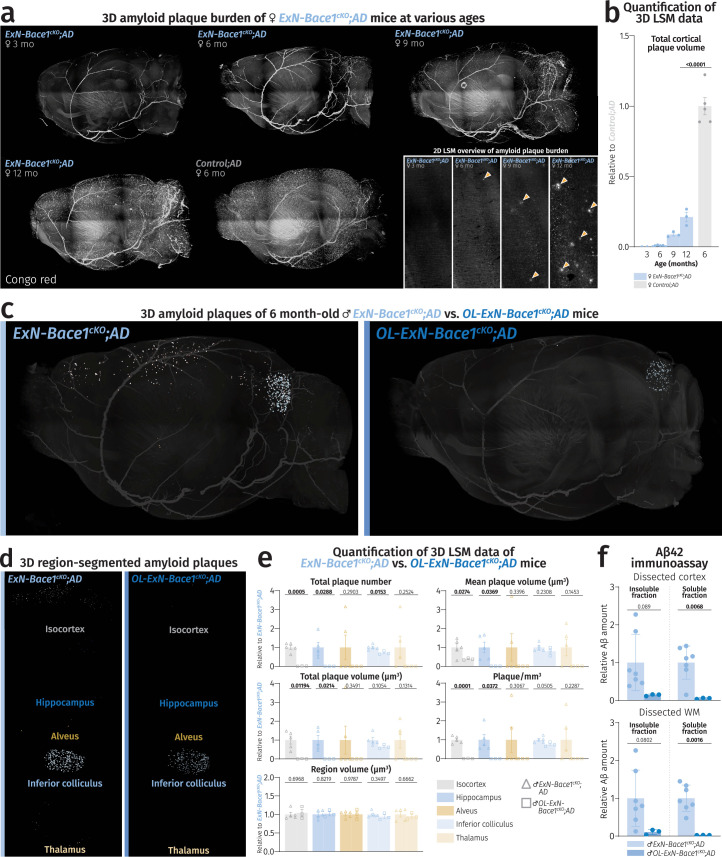
“the inferior colliculus, receiving limited cortical input (Extended Data Fig. 8c) primarily from the auditory cortex19, was spared from plaque attenuation in ExN-Bace1cKO;AD mice.”
§ Oligodendrocytes produce amyloid-β and contribute to plaque formation alongside neurons in Alzheimer’s disease model mice > Main
What the sources say
- Partly supportedcites [19] Blackwell, J. M., Lesicko, A. M., Rao, W., De Biasi, M. & Geffen, M. N. Auditory cortex shapes sound responses in the inferior colliculus. eLife 9, e51890 (2020). sourceExperimental — accuracy not yet measured
The Introduction (page unavailable) states that the auditory cortex sends feedback to the inferior colliculus and that the colliculus receives inputs from auditory-cortex neurons. It does not establish that auditory cortex is the primary source of the colliculus’s cortical input. Citation 19 is attached to that anatomical clause, not to the separate plaque-attenuation finding. (LLM, conf=0.78)
plain- Asserted: passes — The authors put it forward as true.
- Checkable: passes — It can be checked against evidence.
- Load-bearing: passes — The paper’s conclusions depend on it.
- Based: passes — The paper gives a reason why it holds.
- Partly supported
The cited sources support only part of this claim — read each source’s verdict below.
In the paper
“Aβ fibrillation and plaque formation follow sigmoidal growth kinetics20,21”
§ Oligodendrocytes produce amyloid-β and contribute to plaque formation alongside neurons in Alzheimer’s disease model mice > Main
What the sources say
- Partly supportedcites [20] Lee, C. C., Nayak, A., Sethuraman, A., Belfort, G. & McRae, G. J. A three-stage kinetic model of amyloid fibrillation. Biophys. J. 92, 3448–3458 (2007). sourceExperimental — accuracy not yet measured
The In vitro fibrillation kinetics section describes sigmoidal behavior in amyloid fibrillation and reports that the model fits Aβ-40 fibrillation data. It identifies Aβ-40 as a protein fragment that aggregates into plaques, but does not show that plaque formation itself follows sigmoidal kinetics; the Conclusions likewise concern fibril formation, not plaque growth. Page numbers were not available in our copy. (LLM, conf=0.86)
- Supportedcites [21] Burgold, S., Filser, S., Dorostkar, M. M., Schmidt, B. & Herms, J. In vivo imaging reveals sigmoidal growth kinetic of β-amyloid plaques. Acta Neuropathol. Commun. 2, 30 (2014). source
The Introduction says that in vitro Aβ aggregation follows a sigmoidal curve. The Results section reports that growth of individual plaques in vivo could be fitted to a sigmoid function. Together, these support the claim about Aβ fibrillation and plaque growth. (LLM, conf=0.92)
plaincorrelational- Asserted: passes — The authors put it forward as true.
- Checkable: passes — It can be checked against evidence.
- Load-bearing: passes — The paper’s conclusions depend on it.
- Based: passes — The paper gives a reason why it holds.
- Partly supported
The cited sources support only part of this claim — read each source’s verdict below.
In the paper
“a threshold level of Aβ accumulation is essential for plaque seeding to occur.”
§ Oligodendrocytes produce amyloid-β and contribute to plaque formation alongside neurons in Alzheimer’s disease model mice > Main
What the sources say
- Partly supportedcites [20] Lee, C. C., Nayak, A., Sethuraman, A., Belfort, G. & McRae, G. J. A three-stage kinetic model of amyloid fibrillation. Biophys. J. 92, 3448–3458 (2007). sourceExperimental — accuracy not yet measured
The 'Effects of seeding' section says fibril growth requires sufficient nuclei, and 'In vitro fibrillation kinetics' applies the model to Aβ-40. Neither section establishes that Aβ must accumulate to a threshold before plaque seeding can occur; the seeding example concerns insulin fibrils. Page numbers are unavailable in our copy. (LLM, conf=0.82)
- Supportedcites [21] Burgold, S., Filser, S., Dorostkar, M. M., Schmidt, B. & Herms, J. In vivo imaging reveals sigmoidal growth kinetic of β-amyloid plaques. Acta Neuropathol. Commun. 2, 30 (2014). source
The Discussion’s Figure 7 caption identifies a minimum critical concentration of Aβ necessary to form plaque seeds. The Discussion also models new plaque formation when Aβ concentration is above that threshold. Page numbers were not supplied in our copy. (LLM, conf=0.94)
plaindirect- Asserted: passes — The authors put it forward as true.
- Checkable: passes — It can be checked against evidence.
- Load-bearing: passes — The paper’s conclusions depend on it.
- Based: passes — The paper gives a reason why it holds.
- Partly supported
A result the paper reports from its own data — it cites no other source for it, so there is none to check. The quote shows it is in the paper.
In the paper
“the residual amount of WM Aβ42 was higher in ExN-Bace1cKO;AD brains (27.604% ± 0.072%).”
§ Oligodendrocytes produce amyloid-β and contribute to plaque formation alongside neurons in Alzheimer’s disease model mice > Main
plain- Asserted: passes — The authors put it forward as true.
- Checkable: passes — It can be checked against evidence.
- Load-bearing: passes — The paper’s conclusions depend on it.
- Based: passes — The paper gives a reason why it holds.
A result the paper reports from its own data — it cites no other source for it, so there is none to check. The quote shows it is in the paper.
In the paper
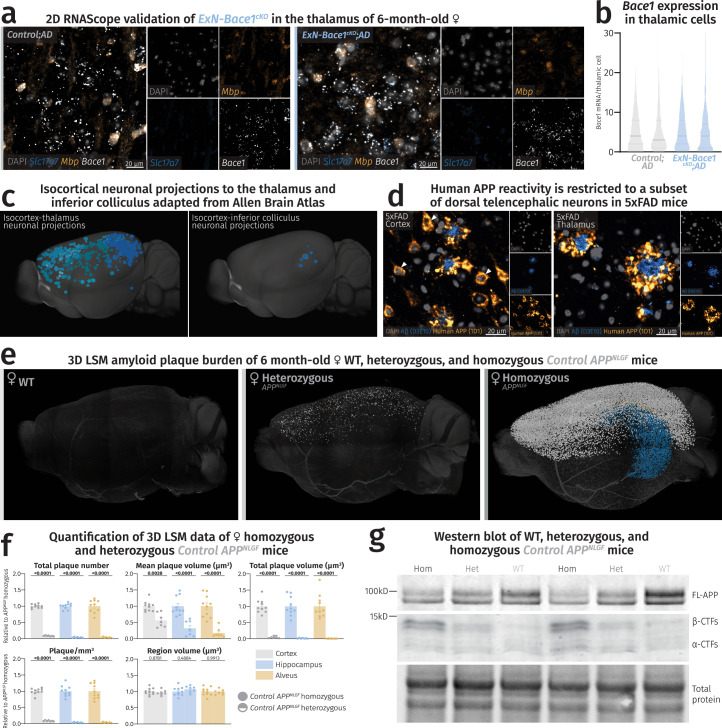
“immunolabeling of 5×FAD brain slices with the human APP-specific antibody, 1D1, revealed that human APP reactivity in neuronal soma is almost restricted to the cortex (Extended Data Fig. 8d) and hippocampus, confirming the Thy1.2 promoter domain.”
§ Oligodendrocytes produce amyloid-β and contribute to plaque formation alongside neurons in Alzheimer’s disease model mice > Main
plaincorrelational- Asserted: passes — The authors put it forward as true.
- Checkable: passes — It can be checked against evidence.
- Load-bearing: passes — The paper’s conclusions depend on it.
- Based: passes — The paper gives a reason why it holds.
A result the paper reports from its own data — it cites no other source for it, so there is none to check. The quote shows it is in the paper.
In the paper
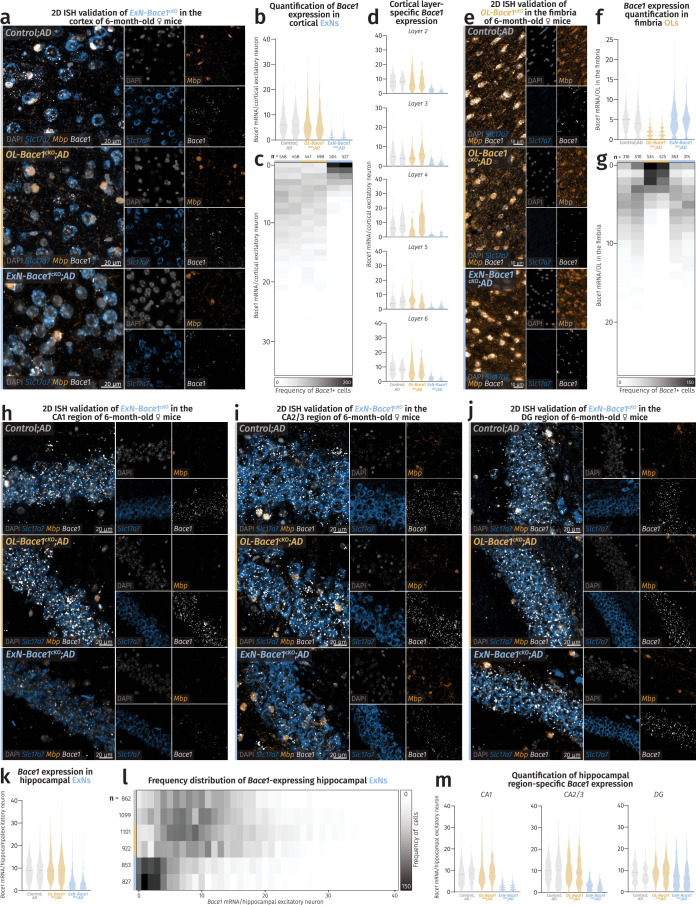
“The unchanged levels of Bace1 transcript in the thalamus of ExN-Bace1cKO;AD mice”
§ Oligodendrocytes produce amyloid-β and contribute to plaque formation alongside neurons in Alzheimer’s disease model mice > Main
plain- Asserted: passes — The authors put it forward as true.
- Checkable: passes — It can be checked against evidence.
- Load-bearing: passes — The paper’s conclusions depend on it.
- Based: passes — The paper gives a reason why it holds.
A result the paper reports from its own data — it cites no other source for it, so there is none to check. The quote shows it is in the paper.
In the paper
“OL-ExN-Bace1cKO;AD lysates showed an almost complete loss of Aβ42 when compared to ExN-Bace1cKO;AD samples”
§ Oligodendrocytes produce amyloid-β and contribute to plaque formation alongside neurons in Alzheimer’s disease model mice > Main
plain- Asserted: passes — The authors put it forward as true.
- Checkable: passes — It can be checked against evidence.
- Load-bearing: passes — The paper’s conclusions depend on it.
- Based: passes — The paper gives a reason why it holds.
A result the paper reports from its own data — it cites no other source for it, so there is none to check. The quote shows it is in the paper.
In the paper
“OL-Bace1cKO;AD brains contained less insoluble and soluble Aβ42 compared to controls, especially in the WM.”
§ Oligodendrocytes produce amyloid-β and contribute to plaque formation alongside neurons in Alzheimer’s disease model mice > Main
plain- Asserted: passes — The authors put it forward as true.
- Checkable: passes — It can be checked against evidence.
- Load-bearing: passes — The paper’s conclusions depend on it.
- Based: passes — The paper gives a reason why it holds.
A result the paper reports from its own data — it cites no other source for it, so there is none to check. The quote shows it is in the paper.
In the paper
“analysis of 12-month-old ExN-Bace1cKO;AD mice revealed considerable plaque deposition”
§ Oligodendrocytes produce amyloid-β and contribute to plaque formation alongside neurons in Alzheimer’s disease model mice > Main
plain- Asserted: passes — The authors put it forward as true.
- Checkable: passes — It can be checked against evidence.
- Load-bearing: passes — The paper’s conclusions depend on it.
- Based: passes — The paper gives a reason why it holds.
- Probably not a substantial claim. 13
- It may state two separate claims as one. 10
The cited sources that could be checked couldn’t confirm or dispute this claim.
In the paper
“No statistical methods were used to pre-determine sample sizes, but sample sizes for primary experiments (that is, quantitative LSM of cKOs and immunoassay) are similar to those shown in our previous publication9.”
§ Oligodendrocytes produce amyloid-β and contribute to plaque formation alongside neurons in Alzheimer’s disease model mice > Methods > Data analysis, statistics and figure preparation
What the sources say
- Could not verifycites [9] Depp, C. et al. Myelin dysfunction drives amyloid-β deposition in models of Alzheimer’s disease. Nature 618, 349–357 (2023). sourceExperimental — accuracy not yet measured
The cited paper’s Methods describe LSM procedures, and its results give sample sizes for some experiments, but the retrieved passages do not say whether statistical methods were used to predetermine sample sizes. Nor do they establish that the citing paper’s quantitative LSM and immunoassay sample sizes are similar to those in this paper. Searches for the sample-size statement, cKOs, LSM and immunoassay did not resolve the comparison. (LLM, conf=0.75)
plain- Asserted: passes — The authors put it forward as true.
- Checkable: passes — It can be checked against evidence.
- Load-bearing: fails — The paper’s conclusions may not depend on it.
- Based: passes — The paper gives a reason why it holds.
Probably not a substantial claim. The paper’s conclusions may not depend on it. It may state two separate claims as one.
- Could not verify
Every source the paper cites for this claim was checked and supports it.
In the paper
“myelin alterations have been implicated in AD7–9”
§ Oligodendrocytes produce amyloid-β and contribute to plaque formation alongside neurons in Alzheimer’s disease model mice > Main
What the sources say
- Supportedcites [7] Chen, J. F. et al. Enhancing myelin renewal reverses cognitive dysfunction in a murine model of Alzheimer’s disease. Neuron 109, 2292–2307 (2021). source
The Introduction states that multiple lines of evidence show significant alterations in myelin and oligodendroglia in AD-related pathology. It also describes myelin abnormalities in AD models and white-matter alterations in patients with AD. The claim does not assert that myelin alterations cause AD, which the Introduction says remains unclear. (LLM, conf=0.94)
- Supportedcites [8] Mathys, H. et al. Single-cell transcriptomic analysis of Alzheimer’s disease. Nature 570, 332–337 (2019). source
The Abstract reports that myelination-related processes were recurrently perturbed in multiple cell types and suggests a role in AD pathophysiology. The Discussion likewise says the data highlight myelination-related processes in AD pathogenesis. These passages support the broad claim that myelin alterations have been implicated in AD. (LLM, conf=0.94)
- Supportedcites [9] Depp, C. et al. Myelin dysfunction drives amyloid-β deposition in models of Alzheimer’s disease. Nature 618, 349–357 (2023). source
The 'Myelin decline in patients with AD' section reports reduced intracortical myelin density in autopsy samples from patients with AD. The 'Ageing myelin as a risk factor for AD' section also discusses myelin alterations in AD models and identifies myelin-related transcripts altered in patients. These passages support the broad statement that myelin alterations have been implicated in AD. (LLM, conf=0.94)
hedgedcorrelational- Asserted: passes — The authors put it forward as true.
- Checkable: passes — It can be checked against evidence.
- Load-bearing: passes — The paper’s conclusions depend on it.
- Based: passes — The paper gives a reason why it holds.
Probably not a substantial claim.
- Supported
A result the paper reports from its own data — it cites no other source for it, so there is none to check. The quote shows it is in the paper.
In the paper
“ExN-Bace1cKO;AD brains were almost devoid of insoluble Aβ, but a moderate amount (14.925% ± 0.066%) of soluble Aβ42 was detected in ExN-Bace1cKO;AD cortical tissue.”
§ Oligodendrocytes produce amyloid-β and contribute to plaque formation alongside neurons in Alzheimer’s disease model mice > Main
plain- Asserted: passes — The authors put it forward as true.
- Checkable: passes — It can be checked against evidence.
- Load-bearing: passes — The paper’s conclusions depend on it.
- Based: passes — The paper gives a reason why it holds.
It may state two separate claims as one.
A result the paper reports from its own data — it cites no other source for it, so there is none to check. The quote shows it is in the paper.
In the paper
“Cell-type-specific losses of BACE1 diminished β C-terminal fragments (β-CTFs) in the cKOs and restored FL-APP to nearly baseline WT amounts.”
§ Oligodendrocytes produce amyloid-β and contribute to plaque formation alongside neurons in Alzheimer’s disease model mice > Main
plaindirect- Asserted: passes — The authors put it forward as true.
- Checkable: passes — It can be checked against evidence.
- Load-bearing: passes — The paper’s conclusions depend on it.
- Based: passes — The paper gives a reason why it holds.
It may state two separate claims as one.
A result the paper reports from its own data — it cites no other source for it, so there is none to check. The quote shows it is in the paper.
In the paper
“Levels of presenilin-1 (PSEN1) remained unchanged.”
§ Oligodendrocytes produce amyloid-β and contribute to plaque formation alongside neurons in Alzheimer’s disease model mice > Main
plain- Asserted: passes — The authors put it forward as true.
- Checkable: passes — It can be checked against evidence.
- Load-bearing: fails — The paper’s conclusions may not depend on it.
- Based: passes — The paper gives a reason why it holds.
Probably not a substantial claim. The paper’s conclusions may not depend on it.
A result the paper reports from its own data — it cites no other source for it, so there is none to check. The quote shows it is in the paper.
In the paper
“Accordingly, plaque sizes were smaller, and microgliosis was markedly reduced”
§ Oligodendrocytes produce amyloid-β and contribute to plaque formation alongside neurons in Alzheimer’s disease model mice > Main
plain- Asserted: passes — The authors put it forward as true.
- Checkable: passes — It can be checked against evidence.
- Load-bearing: passes — The paper’s conclusions depend on it.
- Based: passes — The paper gives a reason why it holds.
It may state two separate claims as one.
What the paper did — it cites no source for this, so there is none to check. The quote shows it is in the paper.
In the paper
“No animals or data points were excluded from this study.”
§ Oligodendrocytes produce amyloid-β and contribute to plaque formation alongside neurons in Alzheimer’s disease model mice > Methods > Data analysis, statistics and figure preparation
plain- Asserted: passes — The authors put it forward as true.
- Checkable: passes — It can be checked against evidence.
- Load-bearing: fails — The paper’s conclusions may not depend on it.
- Based: passes — The paper gives a reason why it holds.
Probably not a substantial claim. The paper’s conclusions may not depend on it. It may state two separate claims as one.
What the paper did — it cites no source for this, so there is none to check. The quote shows it is in the paper.
In the paper
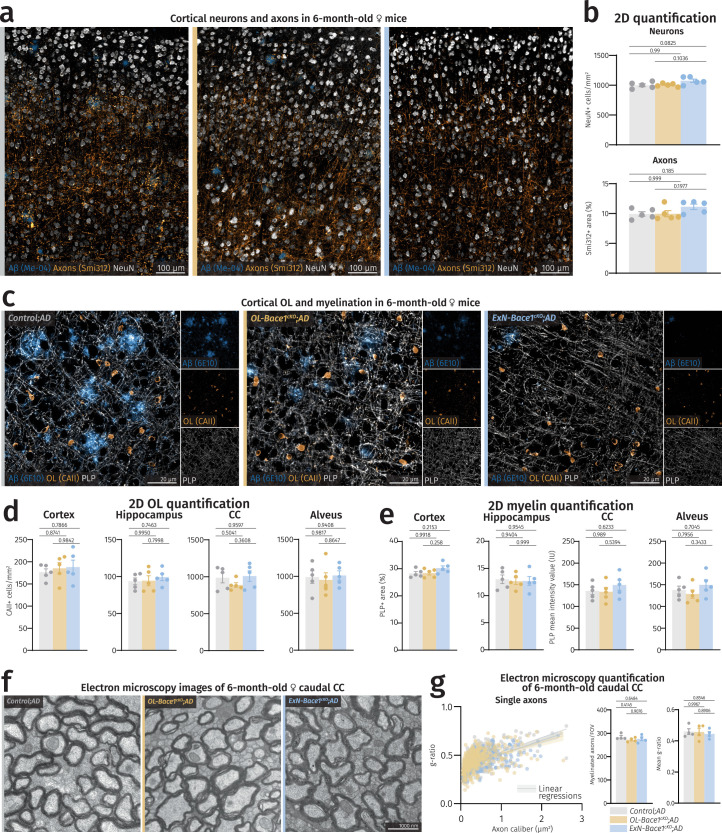
“cKO of Bace1 did not result in any changes to neuronal nor axonal abundance”
§ Oligodendrocytes produce amyloid-β and contribute to plaque formation alongside neurons in Alzheimer’s disease model mice > Main
plain- Asserted: passes — The authors put it forward as true.
- Checkable: passes — It can be checked against evidence.
- Load-bearing: passes — The paper’s conclusions depend on it.
- Based: passes — The paper gives a reason why it holds.
It may state two separate claims as one.
What the paper did — it cites no source for this, so there is none to check. The quote shows it is in the paper.
In the paper
“Selected images were randomized using a Fiji filename-randomizer plugin, and counting was done using the Fiji CellCounter plugin.”
§ Oligodendrocytes produce amyloid-β and contribute to plaque formation alongside neurons in Alzheimer’s disease model mice > Methods > ISH
plain- Asserted: passes — The authors put it forward as true.
- Checkable: passes — It can be checked against evidence.
- Load-bearing: fails — The paper’s conclusions may not depend on it.
- Based: passes — The paper gives a reason why it holds.
Probably not a substantial claim. The paper’s conclusions may not depend on it. It may state two separate claims as one.
What the paper did — it cites no source for this, so there is none to check. The quote shows it is in the paper.
In the paper
“Due to the visible effects that Bace1 cKO has on the plaque load, blinding was not possible for various imaging analyses.”
§ Oligodendrocytes produce amyloid-β and contribute to plaque formation alongside neurons in Alzheimer’s disease model mice > Methods > Data analysis, statistics and figure preparation
plaindirect- Asserted: passes — The authors put it forward as true.
- Checkable: passes — It can be checked against evidence.
- Load-bearing: fails — The paper’s conclusions may not depend on it.
- Based: passes — The paper gives a reason why it holds.
Probably not a substantial claim. The paper’s conclusions may not depend on it.
What the paper did — it cites no source for this, so there is none to check. The quote shows it is in the paper.
In the paper
“In all assays performed, two technical replicates of samples and calibrators were included.”
§ Oligodendrocytes produce amyloid-β and contribute to plaque formation alongside neurons in Alzheimer’s disease model mice > Methods > Electrochemiluminescence Aβ immunoassay
plainn = 2- Asserted: passes — The authors put it forward as true.
- Checkable: passes — It can be checked against evidence.
- Load-bearing: fails — The paper’s conclusions may not depend on it.
- Based: passes — The paper gives a reason why it holds.
Probably not a substantial claim. The paper’s conclusions may not depend on it.
What the paper did — it cites no source for this, so there is none to check. The quote shows it is in the paper.
In the paper
“Experimenters were blinded in the analysis of electron microscopy data.”
§ Oligodendrocytes produce amyloid-β and contribute to plaque formation alongside neurons in Alzheimer’s disease model mice > Methods > Data analysis, statistics and figure preparation
plain- Asserted: passes — The authors put it forward as true.
- Checkable: passes — It can be checked against evidence.
- Load-bearing: fails — The paper’s conclusions may not depend on it.
- Based: passes — The paper gives a reason why it holds.
Probably not a substantial claim. The paper’s conclusions may not depend on it.
What the paper did — it cites no source for this, so there is none to check. The quote shows it is in the paper.
In the paper
“Most experimental cohorts were defined by genotype, and littermate controls were analyzed.”
§ Oligodendrocytes produce amyloid-β and contribute to plaque formation alongside neurons in Alzheimer’s disease model mice > Methods > Mouse models, husbandry and genotyping
plain- Asserted: passes — The authors put it forward as true.
- Checkable: passes — It can be checked against evidence.
- Load-bearing: fails — The paper’s conclusions may not depend on it.
- Based: passes — The paper gives a reason why it holds.
Probably not a substantial claim. The paper’s conclusions may not depend on it. It may state two separate claims as one.
What the paper did — it cites no source for this, so there is none to check. The quote shows it is in the paper.
In the paper
“we failed to validate Bace1 cKO via immunocytochemistry using the 3D5 antibody”
§ Oligodendrocytes produce amyloid-β and contribute to plaque formation alongside neurons in Alzheimer’s disease model mice > Main
plain- Asserted: passes — The authors put it forward as true.
- Checkable: passes — It can be checked against evidence.
- Load-bearing: fails — The paper’s conclusions may not depend on it.
- Based: passes — The paper gives a reason why it holds.
Probably not a substantial claim. The paper’s conclusions may not depend on it.
What the paper did — it cites no source for this, so there is none to check. The quote shows it is in the paper.
In the paper
“Both sexes were used and indicated in the respective figures.”
§ Oligodendrocytes produce amyloid-β and contribute to plaque formation alongside neurons in Alzheimer’s disease model mice > Methods > Mouse models, husbandry and genotyping
plain- Asserted: passes — The authors put it forward as true.
- Checkable: passes — It can be checked against evidence.
- Load-bearing: fails — The paper’s conclusions may not depend on it.
- Based: passes — The paper gives a reason why it holds.
Probably not a substantial claim. The paper’s conclusions may not depend on it. It may state two separate claims as one.
What the paper did — it cites no source for this, so there is none to check. The quote shows it is in the paper.
In the paper
“We only observed a loss of 3D5 labeling in the mossy fibers in Bace1 KO (Extended Data Fig. 5c), yet no somatic BACE1 was observed”
§ Oligodendrocytes produce amyloid-β and contribute to plaque formation alongside neurons in Alzheimer’s disease model mice > Main
plain- Asserted: passes — The authors put it forward as true.
- Checkable: passes — It can be checked against evidence.
- Load-bearing: fails — The paper’s conclusions may not depend on it.
- Based: passes — The paper gives a reason why it holds.
Probably not a substantial claim. The paper’s conclusions may not depend on it. It may state two separate claims as one.
What the paper did — it cites no source for this, so there is none to check. The quote shows it is in the paper.
In the paper
“Statistical tests were chosen based on tests for normality.”
§ Oligodendrocytes produce amyloid-β and contribute to plaque formation alongside neurons in Alzheimer’s disease model mice > Methods > Data analysis, statistics and figure preparation
plaindirect- Asserted: passes — The authors put it forward as true.
- Checkable: passes — It can be checked against evidence.
- Load-bearing: fails — The paper’s conclusions may not depend on it.
- Based: passes — The paper gives a reason why it holds.
Probably not a substantial claim. The paper’s conclusions may not depend on it.
The paper relies on this without support.
Bace1 is the rate-limiting enzyme in Aβ generation.
“conditionally knock out Bace1 (Bace1 cKO), the rate-limiting enzyme in Aβ generation”
The paper relies on this without support.
Oligodendrocyte lineage cells are abundantly present in both gray matter and white matter.
“Because OL lineage cells are abundantly present in both gray matter and white matter (WM)”
Citations
Cites
Fiji: an open-source platform for biological-image analysis
Schindelin, J., Arganda-Carreras, I., Frise, E., Kaynig, V., Longair, M., Pietzsch, T., Preibisch, S., Rueden, C., Saalfeld, S., Schmid, B., et al. (2012) · Nature Methods · doi:10.1038/nmeth.2019 · Cited by 66,890 · cited 1×
“All 2D image analysis was performed on Fiji (version 1.53c) 41 .”
Integrated analysis of multimodal single-cell data
Hao, Y., Hao, S., Andersen-Nissen, E., Mauck, W. M., Zheng, S., Butler, A., Lee, M. J., Wilk, A. J., Darby, C., Zagar, M., et al. (2020) · doi:10.1101/2020.10.12.335331 · Cited by 15,508 · cited 1×
“All data were processed with the R package Seurat (version 4.3.0) 31 based on original study protocols.”
Influentialggplot2: Elegant Graphics for Data Analysis
Wickham, H. (2009) · doi:10.1007/978-0-387-98141-3 · Cited by 14,447
A robust and high-throughput Cre reporting and characterization system for the whole mouse brain
Madisen, L., Zwingman, T. A., Sunkin, S. M., Oh, S. W., Zariwala, H. A., Gu, H., Ng, L. L., Palmiter, R. D., Hawrylycz, M. J., Jones, A. R., et al. (2010) · Nature Neuroscience · doi:10.1038/nn.2467 · Cited by 6,907
Oakley, H., Cole, S. L., Logan, S., Maus, E., Shao, P., Craft, J., Guillozet-Bongaarts, A., Ohno, M., Disterhoft, J., Van Eldik, L., et al. (2006) · The Journal of Neuroscience · doi:10.1523/jneurosci.1202-06.2006 · Cited by 3,530
Self-citationThe antibody aducanumab reduces Aβ plaques in Alzheimer’s disease
Sevigny, J., Chiao, P., Bussière, T., Weinreb, P. H., Williams, L., Maier, M., Dunstan, R., Salloway, S., Chen, T., Ling, Y., et al. (2016) · Nature · doi:10.1038/nature19323 · Cited by 3,059 · cited 1×
“Notably, the 30% plaque reduction in OL-Bace1 cKO ;AD mice falls in the range of effect sizes achieved by aducanumab 24 and the FDA-approved lecanemab 25 antibody therapies.”
Cellular Scaling Rules for the Brains of Marsupials: Not as “Primitive” as Expected
Santos, S. E. D., Porfírio, J., Cunha, F., Manger, P. R., Tavares, W. C., Pessôa, L. M., Raghanti, M. A., Sherwood, C. C., & Herculano‐Houzel, S. (2017) · Brain Behavior and Evolution · doi:10.1159/000452856 · Cited by 2,652
A mesoscale connectome of the mouse brain
Oh, S. W., Harris, J. A., Ng, L., Winslow, B., Cain, N., Mihalas, S., Wang, Q., Lau, C., Kuan, L., Henry, A. M., et al. (2014) · Nature · doi:10.1038/nature13186 · Cited by 2,612
Single-cell transcriptomic analysis of Alzheimer’s disease
Mathys, H., Davila-Velderrain, J., Peng, Z., Gao, F., Mohammadi, S., Young, J. Z., Menon, M., He, L., Abdurrob, F., Jiang, X., et al. (2019) · Nature · doi:10.1038/s41586-019-1195-2 · Cited by 2,568 · cited 3×
“Details of antibodies used for western blotting are listed in Supplementary Tables 7 and 8.”
Molecular Architecture of the Mouse Nervous System
Zeisel, A., Hochgerner, H., Lönnerberg, P., Johnsson, A., Memic, F., van der Zwan, J., Häring, M., Braun, E., Borm, L. E., La Manno, G., et al. (2018) · Cell · doi:10.1016/j.cell.2018.06.021 · Cited by 2,552
Cited by
Sorted by citations
Inflammatory aspects of Alzheimer’s disease
Lucena, P. B., & Heneka, M. T. (2024) · Acta Neuropathologica · doi:10.1007/s00401-024-02790-2 · Cited by 152
White matter aging and its impact on brain function
Groh, J., & Simons, M. (2025) · Neuron · doi:10.1016/j.neuron.2024.10.019 · Cited by 124
Oligodendrocytes in Alzheimer’s disease pathophysiology
Kedia, S., & Simons, M. (2025) · Nature Neuroscience · doi:10.1038/s41593-025-01873-x · Cited by 86
“Indeed, using an AD mouse model expressing a humanized and mutated APP gene under its own regulatory elements, oligodendrocytes were identified as contributors to Aβ load 66,67 .”
Fanlo-Ucar, H., Picón-Pagès, P., Herrera-Fernández, V., ILL‐Raga, G., & Muñoz, F. J. (2024) · Antioxidants · doi:10.3390/antiox13101208 · Cited by 94
Shokr, M. M. (2025) · Metabolic Brain Disease · doi:10.1007/s11011-025-01739-y · Cited by 64
Unlocking Alzheimer’s Disease: The Role of BDNF Signaling in Neuropathology and Treatment
Alqahtani, S. M., Al-Kuraishy, H. M., Al-Gareeb, A. I., Albuhadily, A. K., Alexiou, A. T., Papadakis, M., Hemeda, L. R., Faheem, S. A., & Batiha, G. E. (2025) · NeuroMolecular Medicine · doi:10.1007/s12017-025-08857-x · Cited by 57
“Interestingly, Aβ can be produced by oligodendrocytes, the myelinating glia of the CNS that may affect the expression of neuronal BDNF (Sasmita et al., 2024), signifying the neuroprotective effects of oligodendrocytes against the development and progression of AD.”
Astrocyte and oligodendrocyte pathology in Alzheimer's disease
Ziar, R., Tesar, P. J., & Clayton, B. L. L. (2025) · Neurotherapeutics · doi:10.1016/j.neurot.2025.e00540 · Cited by 47
“Indeed, oligodendrocyte-speci fi c deletion of Bace1 reduces A β burden by 30 % in APP NLGF knock-in mice that express humanized A β carrying three AD-linked mutations from the endogenous mouse APP locus [80,81].”
Contribution of amyloid deposition from oligodendrocytes in a mouse model of Alzheimer’s disease
Ishii, A., Pathoulas, J., Omar, O. M., Ge, Y., Yao, A. Y., Pantalena, T., Singh, N., Zhou, J., He, W., Murphy, P. A., et al. (2024) · Molecular Neurodegeneration · doi:10.1186/s13024-024-00759-z · Cited by 31
“In summary, our results, along with two recent publications [42, 48], provide direct evidence that Aβ generation is not limited to neuronal sources, but that oligodendrocytes are also important contributors to Aβ pathology within the AD brain.”
InfluentialSelf-citationThe vascular contribution to cognitive decline in ageing and dementia
Anderle, S., Dixon, M., Quintela‐López, T., Sideris-Lampretsas, G., & Attwell, D. (2025) · Nature reviews. Neuroscience · doi:10.1038/s41583-025-00950-1 · Cited by 40
“…this topic, it has recently been discovered that oligodendrocytes themselves generate a functionally important fraction of the Aβ produced in AD 213,214 , raising the question of whether this Aβ induces capillary constriction specifically in the white matter or has deleterious effects on the…”
Cai, Y., Pinheiro‐de‐Sousa, I., Slobodyanyuk, M., Chen, F., Huynh, T., Kanyo, J. E., Tang, P., Fuentes, L. A., Braker, A., Welch, R., et al. (2025) · Nature Neuroscience · doi:10.1038/s41593-025-01973-8 · Cited by 34
“Given that neurons are the predominant source of amyloid-β 92,93 , our ligand–receptor interaction analysis supports upregulated responses to amyloid-β in neurons rather than in oligodendrocytes (Fig.”
Experimental modeling of Alzheimer's disease: Translational lessons from cross‐taxon analyses
Yenkoyan, K. B., Kotova, M. M., Apukhtin, K. V., Galstyan, D. S., Amstislavskaya, T. G., Strekalova, T. V., de Abreu, M. S., Chavushyan, V. A., Lim, L. W., Yang, L., et al. (2025) · Alzheimer s & Dementia · doi:10.1002/alz.70273 · Cited by 30
“101,102 Thus, moving beyond a neuron-centric perspective and considering the broader cellular landscape of AD pathogenesis are needed for future model development to ensure that experimental paradigms more accurately reflect the diverse contributions of different brain cell types to AD pathology.”
Stimulating myelin restoration with BDNF: a promising therapeutic approach for Alzheimer's disease
Zota, I., Chanoumidou, K., Gravanis, A., & Charalampopoulos, I. (2024) · Frontiers in Cellular Neuroscience · doi:10.3389/fncel.2024.1422130 · Cited by 25
Tangavelou, K., & Bhaskar, K. (2024) · International Journal of Molecular Sciences · doi:10.3390/ijms252212335 · Cited by 25
The Potential Regulators of Amyloidogenic Pathway of APP Processing in Alzheimer’s Disease
Krawczuk, D., Kulczyńska‐Przybik, A., & Mroczko, B. (2025) · Biomedicines · doi:10.3390/biomedicines13071513 · Cited by 28
From Neuron‐Centric to Glia‐Centric: How Aging Glial Networks Drive Neurodegenerative Disease
Hayashide, L. D. S., Pessoa, B., Dias, G. R., Pontes, B., Pinto, R. S., & Diniz, L. P. (2026) · Journal of Neurochemistry · doi:10.1111/jnc.70361 · Cited by 19
“Moreover, oligodendrocytes also contribute directly to amyloid plaque formation, further emphasizing the involvement of multiple glial cell types in the pathological landscape of neurodegenerative diseases (Sasmita et al. 2024).”
Cuypers, M., Jaspers, T., Clerckx, J., Leekens, S., Cawthorne, C., Bormans, G. M., Cleeren, F., Geukens, N., Strooper, B. D., & Dewilde, M. (2025) · Fluids and Barriers of the CNS · doi:10.1186/s12987-025-00624-1 · Cited by 15
Emerging Role of Oligodendrocytes Malfunction in the Progression of Alzheimer's Disease
Tylek, K., & Basta‐Kaim, A. (2025) · Journal of Neuroimmune Pharmacology · doi:10.1007/s11481-025-10236-z · Cited by 19
“Thus, oligodendrocytes have the capacity to generate sufficient Aβ to contribute to plaque accumulation (Sasmita et al. 2023, 2024).”
Li, Y., Zhou, G., Peng, J., Liu, L., Zhang, F., Iturria‐Medina, Y., Yao, D., Biswal, B. B., & Wang, P. (2025) · Communications Biology · doi:10.1038/s42003-025-08177-7 · Cited by 18
“Research involving the AD mouse model suggested that a signi fi cant proportion of subcortical amyloid-β was derived from cortico-thalamic axonal projections 71 .”
Hida, M., Yasuda, K., Toyokawa, M., Asada‐Utsugi, M., Toda, S., Yanagida, N., Takahashi, R., Kinoshita, A., & Maki, T. (2025) · Brain Research · doi:10.1016/j.brainres.2025.149601 · Cited by 12
Sanni, A., Bennett, A. I., Adeniyi, M., & Mechref, Y. S. (2025) · ACS Chemical Neuroscience · doi:10.1021/acschemneuro.5c00230 · Cited by 11
Are oligodendrocytes the missing link in Alzheimer’s disease and related dementia research?
Rossi, S. L., & Bovenkamp, D. E. (2024) · Molecular Neurodegeneration · doi:10.1186/s13024-024-00760-6 · Cited by 10
Li, F., Wu, L., Feng, X., Li, Y., & Fan, H. (2026) · Pharmaceutics · doi:10.3390/pharmaceutics18010070 · Cited by 10
Remember oligodendrocytes: Uncovering their overlooked role in Alzheimer’s disease
Spieth, L., & Simons, M. (2024) · PLoS Biology · doi:10.1371/journal.pbio.3002798 · Cited by 8
Self-citationEmerging connections between myelin and Alzheimer’s disease
Bright, A., Akay, L. A., Blanchard, J., & Tsai, L. (2025) · Nature Cell Biology · doi:10.1038/s41556-025-01701-1 · Cited by 10
Balantzategi, U., Gaminde‐Blasco, A., Kearns, C. A., Bayón‐Cordero, L., Sánchez‐Gómez, M. V., Zugaza, J. L., Appel, B., & Alberdi, E. M. (2025) · Glia · doi:10.1002/glia.70015 · Cited by 9
“…cells and myelination, and considering recent research showing that OLs produce Aβ along-side neurons in AD mouse models (Rajani et al. 2024; Sasmita et al. 2024) and human brains (Gazestani et al. 2023), it is plausible to hypothesize that OL-derived Aβ may play a physiological role in…”
Yang, Y., Lorincz‐Comi, N. J., Li, M., & Zhu, X. (2025) · Briefings in Bioinformatics · doi:10.1093/bib/bbaf250 · Cited by 9
Using in vivo intact structure for system-wide quantitative analysis of changes in proteins
Son, A., Kim, H., Diedrich, J. K., Bamberger, C., McClatchy, D. B., Lipton, S. A., & Yates, J. R. (2024) · Nature Communications · doi:10.1038/s41467-024-53582-x · Cited by 9
“…1), Mag (myelin-associated glycoprotein), and Plp1 (proteolipid protein 1) are particularlyintriguingbecausetheyareassociatedwitholigodendrocytes in the brain, which have recently been found to produce amyloid-β in addition to neurons and thus contribute to amyloid-β plaque burden 57 .”
Is age-related myelinodegenerative change an initial risk factor of neurodegenerative diseases?
Wu, S., & Chen, J. (2025) · Neural Regeneration Research · doi:10.4103/nrr.nrr-d-24-00848 · Cited by 9
Glial Cells in Alzheimer’s Disease: Pathogenic Mechanisms and Therapeutic Frontiers
Sil, M., Mukherjee, N., Chatterjee, I., Ghosh, A., & Goswami, A. (2025) · Journal of Molecular Neuroscience · doi:10.1007/s12031-025-02379-8 · Cited by 9
Haessler, A., Gier, S., Jung, N., & Windbergs, M. (2024) · Frontiers in Cellular Neuroscience · doi:10.3389/fncel.2024.1516093 · Cited by 8
Olson, M. N., Dawes, P., Murray, L. F., Barton, N., Sundstrom, J., Orszulak, A. R., Chigas, S. M., Tran, K., Aylward, A. J., Caliandro, M. F., et al. (2026) · npj Dementia · doi:10.1038/s44400-026-00066-y · Cited by 7
More than microglia: myeloid cells and biomarkers in neurodegeneration
Kodosaki, E., Bell, R., Sogorb‐Esteve, A., Wiltshire, K., Zetterberg, H., & Heslegrave, A. (2024) · Frontiers in Neuroscience · doi:10.3389/fnins.2024.1499458 · Cited by 6
Neuroadaptation in neurodegenerative diseases: compensatory mechanisms and therapeutic approaches
Kopalli, S. R., Behl, T., Baldaniya, L. H., Ballal, S., Joshi, K. K., Arya, R., Chaturvedi, B., Chauhan, A. S., Verma, R. K., Patel, M., et al. (2025) · Progress in Neuro-Psychopharmacology and Biological Psychiatry · doi:10.1016/j.pnpbp.2025.111375 · Cited by 8
Xie, G., Jiang, G., Huang, L., Sun, S., Wan, Y., Li, F., Wu, B., Zhang, Y., Li, X., Xiong, B., et al. (2025) · Pharmaceuticals · doi:10.3390/ph18060790 · Cited by 10
Thorwald, M. A., Godoy-Lugo, J. A., Kerstiens, E., Garcia, G., Kim, M., Shemtov, S. J., Silva, J. A., Durra, S., O’Day, P. A., Mack, W. J., et al. (2025) · Alzheimer s & Dementia · doi:10.1002/alz.70322 · Cited by 6
Weiner, S., Sauer, M., Montoliu‐Gaya, L., Benedet, A. L., Ashton, N. J., González‐Ortiz, F., Simrén, J., Rahmouni, N., Tissot, C., Therriault, J., et al. (2025) · Molecular Neurodegeneration · doi:10.1186/s13024-025-00841-0 · Cited by 8
Disruption of hnRNP A2-mediated RNA dynamics by amyloid-β drives MBP increase in Alzheimer’s disease
Gaminde‐Blasco, A., Senovilla-Ganzo, R., Balantzategi, U., Martinez-Preciado, M., Capetillo‐Zarate, E., García‐Moreno, F., Matute, C., Baleriola, J., & Alberdi, E. M. (2025) · Cellular and Molecular Life Sciences · doi:10.1007/s00018-025-05823-5 · Cited by 7
Zhu, Q., Song, Y., Qian, Y., Zhang, R., Xue, J., & Hou, Y. (2025) · Ageing and Neurodegenerative Diseases · doi:10.20517/and.2025.25 · Cited by 6
Butt, A. M., Niu, J., Yi, C., & Verkhratsky, A. (2026) · Physiological Reviews · doi:10.1152/physrev.00023.2025 · Cited by 7
Gu, S., & Ran, C. (2025) · iRadiology · doi:10.1002/ird3.70002 · Cited by 5
Mitchener, V. F. T., Thackray, M. J., & Arancibia‐Cárcamo, I. L. (2025) · The Journal of Physiology · doi:10.1113/jp287015 · Cited by 8
“It has been demonstrated not only that oligodendrocytes have the capacity to produce A β but also that they act as major contributors to A β plaque burden (Sasmita et al., 2024).”
An Overview of Oligodendrocyte Metabolism
Han, Q., & Cheng, J. (2025) · Advances in neurobiology · doi:10.1007/978-3-031-87919-7_7 · Cited by 5
DAMPs cross-talk interpretation of MDD mechanisms
Peng, Y., Chen, Z., Xu, Y., & Ren, B. (2025) · Science Advances · doi:10.1126/sciadv.adx3698 · Cited by 5
“…myelin structures, assist in the efficient transmission of bioelectrical signals by jumping, and maintain and protect the normal function of neurons ( 15 ), and abnormalities in oligodendrocytes can lead to CNS demyelinating lesions, neuronal damage, psychiatric disorders, and even brain tumors.”
Noble, N., Gold, A., & Zhu, J. (2025) · Nutritional Neuroscience · doi:10.1080/1028415x.2025.2565706 · Cited by 6
“Additionally, it should be noted that oligodendrocytes themselves produce Aβ and can contribute to plaque formation [12], and thus sustaining both oligodendrocyte and myelin health through lifestyle interventions is a potentially valid target in targeting upstream drivers of the AD beyond neurons.”
Li, W., Han, Y., Wang, P., & Qiao, S. (2025) · Alzheimer s & Dementia · doi:10.1002/alz.70803 · Cited by 6
“116,119 Myelin damage–associated axonal swellings and axonal transport stalling increase BACE1 and APPinteractionstoenhanceA β production.”
The Role of Oligodendrocytes in Alzheimer’s Disease Pathogenesis and Therapy
Guo, S., Yu, X., & Zhang, H. (2025) · Neuroglia · doi:10.3390/neuroglia6040046 · Cited by 5
Self-citationSingh, A. S., Naqvi, A. R., & Chanu, M. T. (2026) · Journal of Psychiatric Research · doi:10.1016/j.jpsychires.2026.01.050 · Cited by 7
A synapse perspective on the function of the amyloid precursor protein
Kruse, P., Eichler, A., Klukas, L., & Lenz, M. (2025) · Science Progress · doi:10.1177/00368504251360728 · Cited by 5
The Interaction between Oligodendrocytes and Aβ in Alzheimer's Disease
Wang, W., Huang, X., Xu, Z., & Yu, C. (2025) · Current Alzheimer Research · doi:10.2174/0115672050401966250625171338 · Cited by 3
“In addition, it was further demonstrated that even without Aβ produced by other cells, OL-derived Aβ itself was sufficient to trigger neuronal hyperactivity, further validating the close association between OL-derived Aβ and abnormal neuronal firing [85].”
Mosele, J. I., Manzano, J. I., Sampayo-Rodríguez, S. P., Íñiguez, M., Recio‐Fernández, E., Yuste, S., Matute, P. P., & Motilva, M. (2025) · Food Research International · doi:10.1016/j.foodres.2025.117484 · Cited by 3
Gurikar, S., Ahmed, S. S., & Raghunatahanaidu, B. D. (2025) · Journal of Molecular Neuroscience · doi:10.1007/s12031-025-02433-5 · Cited by 3
“In contrast, experimental reduction of OL-released Aβ has been demonstrated to restore neuronal performance in mouse models (Sasmita et al. 2024).”
A Question of Origins: Non-neuronal Sources of Amyloid-β
Sasmita, A. O., & Depp, C. (2026) · Neuroscience Bulletin · doi:10.1007/s12264-025-01572-4 · Cited by 4
“3 [82].”
InfluentialSelf-citationBrain-wide mapping of oligodendrocyte organization, oligodendrogenesis, and myelin injury
Xu, Y. K. T., Bush, A., Musheyev, E., Umans, J., Zhang, L., Kim, A. A., Zhang, S., von Bernhardi, J. E., Yan, Y., Sulam, J., et al. (2026) · Cell · doi:10.1016/j.cell.2026.01.025 · Cited by 5
Halting the Progression of Alzheimer’s Disease: Is the Goal in Sight?
Jia, Y., Wang, X.-Y., Liu, J., Wang, Y., Masters, C. L., & Guo, J. (2024) · Neuroscience Bulletin · doi:10.1007/s12264-024-01339-3 · Cited by 3
“Although APP was initially thought to be predominantly expressed in neurons, recent studies have shown that other cell types, especially oligo-dendrocytes, also express it and produce Aβ [2].”
Oligodendrocytes, the Forgotten Target of Gene Therapy
Ozgür-Gunes, Y., Stunff, C. L., & Bougneres, P. F. (2024) · Cells · doi:10.3390/cells13231973 · Cited by 4
“Since OLs contribute to A β plaque formation in AD through highly expressed amyloidogenic genes, identifying the mechanisms that slow down A β generation in OLs would pave the way for novel gene therapies [386].”
White matters arising: Rethinking Alzheimer’s disease through the lens of myelin
Depp, C. (2025) · Science · doi:10.1126/science.aeb5153 · Cited by 3
Self-citationTherapeutic Potentials of the Seaweed-Derived Compounds for Alzheimer’s Disease
Ward, K., Cole, M. H., Griffiths, L. R., Sutherland, H. G. E., Winberg, P. C., Meyer, B. J., & Fernandez, F. (2025) · Molecules · doi:10.3390/molecules30224456 · Cited by 4
Sardari, M., Sahafi, O. H., & Rezayof, A. (2025) · Brain Research · doi:10.1016/j.brainres.2025.150040 · Cited by 3
Silva-Martínez, G. A., Cervantes‐Montelongo, J. A., Tristán-Flores, F. E., & de la Rocha, C. (2026) · Frontiers in Nutrition · doi:10.3389/fnut.2025.1716675 · Cited by 2
Aβ antibodies target not only amyloid plaques but also distinct brain cells and vessels
Wen, G., Lindblom, N., Zhan, X., Garcia, M. G., Deierborg, T., Kobro‐Flatmoen, A., & Gouras, G. K. (2026) · Alzheimer s & Dementia · doi:10.1002/alz.71121 · Cited by 2
Licatini, L. M., Licatini, L. M., Haddadin, F. A., Conklin, G. C., Badhwar, A., Sarsoza, F. M., Sukreet, S., & Winston, C. N. (2026) · Frontiers in Neuroscience · doi:10.3389/fnins.2026.1765229 · Cited by 2
Liu, Z., Liu, J. J., 梁浚婧, Meng, C., Wang, Q., Luo, Y., & Zhang, H. (2026) · Frontiers in Aging Neuroscience · doi:10.3389/fnagi.2026.1843643 · Cited by 2
“In APP NL-GF knock-in mice, specific knockout of BACE1 in OLs reduces the number of A β plaques in the brain by 25% and significantly decreases plaque area in vulnerable regions such as the hippocampal CA1 region and the corpus callosum (Sasmita et al., 2024).”
InfluentialLi, C., Zhang, S., Xu, J., Yang, Y., Zeng, Z.-X., & Ma, D. (2025) · World Journal of Psychiatry · doi:10.5498/wjp.v15.i3.101178 · Cited by 2
Role of oligodendroglial ADAM10 in oligodendrocyte maturation, myelination and myelin maintenancePreprint
Lavaud, M., Padilla-Ferrer, A., Simon, A., Acebo, P., Dargenet-Becker, C., Gorgievski, V., Tzavara, E. T., Massaad, C., Jafarian-Tehrani, M., & Meffre, D. (2025) · bioRxiv (Cold Spring Harbor Laboratory) · doi:10.1101/2025.07.25.666787 · Cited by 2
Syringaldehyde Ameliorates Cognitive Dysfunction in APP/PS1 Mice by Stabilizing the NLRP3 Pathway
Chen, R., Gao, H., Zhu, T., Zheng, N., Jin, Y., Li, M., & Lu, Z. (2025) · Molecular Neurobiology · doi:10.1007/s12035-025-05227-3 · Cited by 1
Amyloid‐β Seeds in Alzheimer's Disease: Research Challenges and Implications
Beschörner, N., Xu, Y., Jucker, M., & Ruiz‐Riquelme, A. (2025) · Journal of Neurochemistry · doi:10.1111/jnc.70267 · Cited by 2
Neues zur Blutbiomarker gestützten Frühdiagnostik der Vorstufen einer Alzheimer-Demenz
Hansen, N., & Wiltfang, J. (2025) · Fortschritte der Neurologie · Psychiatrie · doi:10.1055/a-2698-5992 · Cited by 1
“Es gibt zunehmend Hinweise in Studien [20, 21], dass die Oligodendroglia eine molekular-pathophysiologisch relevante Rolle bei der AD spie-len.”
Self-citationTranfa, M., Pieperhoff, L., Pontillo, G., Luckett, E. S., Collij, L. E., Oliveira, T. G., Tesi, N., Vilor‐Tejedor, N., Altmann, A., Roccatagliata, L., et al. (2025) · Alzheimer s Research & Therapy · doi:10.1186/s13195-025-01888-3 · Cited by 2
Neuronal stress promotes Cre recombinase transfer from oligodendroglia to neurons
Xu, T., Yang, K., Feng, Y., Wu, Y., Zhang, L., Yang, Z., Yuan, F., & Lyu, H. (2025) · Acta Histochemica · doi:10.1016/j.acthis.2025.152300 · Cited by 1
The 2024 yearbook of Neurorestoratology
Huang, H., Sanberg, P. R., Sharma, H. S., Bach, J. R., Saberi, H., Shetty, A. K., Otom, A. H., Ramón‐Cueto, A., Kuffler, D., Guo, X., et al. (2025) · Journal of Neurorestoratology · doi:10.1016/j.jnrt.2025.100250 · Cited by 4
Garrahy, J. P. (2025) · Journal of Alzheimer s Disease · doi:10.1177/13872877251404970 · Cited by 1
“245,246 A β is generated through the sequential cleavage of amyloid-β protein precursor (A β PP) by β -secretase (BACE1) and γ -secretase.”
Oligodendroglial Mutant Huntingtin Contributes to Neuroinflammation in Huntington’s Disease Mice
Li, X. J., Zhou, G., Xu, S., Yang, T., Yin, S., Yang, S., Wu, Y., Zhou, X., Yang, S., Tong, H., et al. (2026) · Neuroscience Bulletin · doi:10.1007/s12264-025-01565-3 · Cited by 1
Shahnaee, A., Liu, C. S., Ngo, T., Palmer, C. R., Ziomek, D., Park, C. S., Tan, V. P., Jimenez, N. A., & Chun, J. J. M. (2026) · Communications Biology · doi:10.1038/s42003-026-09759-9 · Cited by 1
“1g), including alterations in PSEN1 , providing evidence that oligodendrocytes contribute to amyloid-beta production 48,49 .”
Jian, L., Liu, Y., & Peng, W. (2026) · Ageing Research Reviews · doi:10.1016/j.arr.2026.103099 · Cited by 1
APP as an innate injury-response molecule
Olmsted, Z. T., & Sofroniew, M. V. (2026) · Neurobiology of Disease · doi:10.1016/j.nbd.2026.107361 · Cited by 3
Advances in the Use of Traditional Chinese Medicine Prescriptions for Alzheimer's Disease
Zhao, J., Huang, R., Bu, N., Wang, H., Zhang, S., Pan, Y., Su, Y., Wei, Z., Chen, Y., Li, Y., et al. (2026) · Psychogeriatrics · doi:10.1111/psyg.70157 · Cited by 2
“It can be concluded that Guiding Phlegm XXD can inhibit the apoptosis of AD oligodendrocytes by activating the AMPK/SIRT1 signalling pathway and enhancing the ATP levels in the cells, thereby playing a role in the treatment of AD [56, 57].”
Baek, S., Jang, J., Yeo, S., Jung, H. J., & Choe, Y. (2026) · Signal Transduction and Targeted Therapy · doi:10.1038/s41392-026-02620-9 · Cited by 1
Neuroprotective effects of ursodeoxycholic acid in Parkinson's disease and Alzheimer's disease
Chong, A. E. Y., Sasmita, A. O., Koh, R. Y., & Ling, A. P. K. (2026) · Neuroprotection/Neuroprotection (Chichester, England. Print) · doi:10.1002/nep3.70039 · Cited by 1
Self-citationPersonalized single-cell transcriptomics reveals molecular diversity in Alzheimer’s disease
Chandrashekar, P. B., Alatkar, S. A., Kalafut, N. C., Jin, T., Gupta, C., Burczak, R. C., Xiang, H., Liu, S., Li, A. Z., Hong, A., et al. (2026) · Nature Communications · doi:10.1038/s41467-026-72310-1 · Cited by 2
“Oligodendrocytes are responsible for myelination, protecting neurons from damage, and dysfunction in oligodendrocytes leads to demyelination, a major factor in AD progression 58,59 .”
Self-citationRepeated sevoflurane exposure causes hypomyelination in the prefrontal cortex of adult male mice
Zhang, L., Ke, Z., Zhang, N., Wang, D., & Zhou, L. (2025) · Scientific Reports · doi:10.1038/s41598-025-85834-1 · Cited by 1
The Rise of Pluripotent Stem Cell-Derived Glia Models of Neuroinflammation
Kala, S., Strutz, A. G., & Katt, M. E. (2025) · Neurology International · doi:10.3390/neurolint17010006 · Cited by 2
ggrain – a R package for raincloud plotsPreprint
Judd, N., van Langen, J., Poggiali, D., et al. (2024) · bioRxiv (Cold Spring Harbor Laboratory) · doi:10.1101/2024.12.13.628294 · Cited by 1
Powerful and accurate case-control analysis of spatial molecular dataPreprint
Reshef, Y., Sood, L., Curtis, M. L., Rumker, L., Stein, D. J., Palshikar, M. G., Nayar, S., Filer, A. D., Jonsson, A. H., Korsunsky, I., et al. (2025) · bioRxiv (Cold Spring Harbor Laboratory) · doi:10.1101/2025.02.07.637149 · Cited by 1
Tung, T.-H., Babu, S., Tang, X., Sciutto, A., Romer, M. A., Racha, P., Fiesler, V. M., Saha, A., Saito, T., Saido, T. C., et al. (2025) · bioRxiv (Cold Spring Harbor Laboratory) · doi:10.1101/2025.11.24.689041 · Cited by 1
Self-citationGargareta, V., Mougios, N., Hahn, E. T., Siems, S. B., Crisp, S. J., Varga, B. V., Káradóttir, R. T., Buescher, J. M., Jung, R. B., Ramesh, V., et al. (2026) · bioRxiv (Cold Spring Harbor Laboratory) · doi:10.64898/2026.06.09.730898 · Cited by 1
Self-citationBudamagunta, M. S., Mori, H., Silk, J., Slez, R. R., Bognár, B., Mendiola, U. R., Kálai, T., Maezawa, I., & Voss, J. C. (2024) · Antioxidants · doi:10.3390/antiox13111411
Case Report of a 47-Year-Old Long COVID Patient Diagnosed With Alzheimer's DiseasePreprint
Yao, Y., Liu, S., Zhang, Y., Liu, C., Shi, J., Chen, B., Yang, Z. R., Zhang, T., Li, Z., & Gao, S. (2024) · Research Square · doi:10.21203/rs.3.rs-5549836/v1
Catto, F., Dadgar‐Kiani, E., Kirschenbaum, D., Economides, A. E., Reuss, A. M., Trevisan, C., Caredio, D., Delic, M., Frick, L. D., Weber‐Stadlbauer, U., et al. (2025) · PLoS ONE · doi:10.1371/journal.pone.0309489
Lysosomal stress induces amyloid-β aggregate release and reactive transformation in human astrocytesPreprint
Goldsworthy, S., Fertan, E., Dyal, P. L., Domoney, S., Livesey, F. J., Klenerman, D., Patani, R., & Hung, C. (2025) · bioRxiv (Cold Spring Harbor Laboratory) · doi:10.1101/2025.05.27.656416
Case study of a 47-year-old long COVID patient diagnosed with Alzheimer’s disease
Yao, Y., Liu, S., Zhang, Y., Liu, C., Shi, J., Chen, B.-B., Yang, Z. R., Zhang, T., Li, Z., & Gao, S. (2025) · Quantitative Imaging in Medicine and Surgery · doi:10.21037/qims-2025-125
“The mechanisms underlying this pathway can also explain a previous finding that oligodendrocytes produce amyloid proteins and contribute to plaque formation (12).”
Siems, S. B., Jung, R. B., Jahn, O., Meschkat, M., Michanski, S., Łukasik, N., Hümmert, S., Sasmita, A. O., Möbius, W., Benseler, F., et al. (2025) · bioRxiv (Cold Spring Harbor Laboratory) · doi:10.1101/2025.09.02.673641
Self-citationLabarchède, M., Petrel, M., & Battefeld, A. (2025) · bioRxiv (Cold Spring Harbor Laboratory) · doi:10.64898/2025.12.16.694668 · Cited by 2
Madduri, A. V., Ellis, R. J., Lakhani, C. M., Bennett, D. A., & Patel, C. J. (2026) · medRxiv · doi:10.64898/2026.01.31.26345282
Beyond the Wiring: White Matter as a Dynamic Regulator of Brain Function and Disease
He, C., Wu, D., Du, A., & Zhang, L. (2026) · Neuroscience Bulletin · doi:10.1007/s12264-026-01605-6
“Recent studies further indicate that oligodendrocytes and myelin are not merely passive targets of pathology but can actively contribute to AD progression, including through dysregulated myelin homeostasis and aberrant amyloid-β production [174, 175].”
Life Cycle and Circadian Rhythms in Central Resident Immunity and Neuropsychiatric Pathology
Lim, Z., Nguyen, H. L., Zeng, Y., Qu, Q., Le, Y., Sun, M., Wang, X., Zhu, H., Qian, Y., Saeed, S., et al. (2026) · Neuroscience Bulletin · doi:10.1007/s12264-026-01612-7
“Similarly, oligodendrocyte-produced Aβ further fuels the neurodegenerative cascade [108].”
Zhang, Z., Chowdhury, N., Dong, J., Wu, L., & Cheng, C. (2026) · Journal of Alzheimer s Disease · doi:10.1177/13872877261441603
Gao, Q., Sun, J., Hei, B., Zhou, J., Wang, B., Wang, D., Hu, S., Liu, J., Wang, D., & Fan, J. (2026) · Experimental Neurology · doi:10.1016/j.expneurol.2026.115781 · Cited by 1
Adebiyi, O. E., Unaran, E., Machado, M. M. F., Saksida, L. M., Menon, R., Káradóttir, R. T., & Bussey, T. J. (2026) · Neuroscience & Biobehavioral Reviews · doi:10.1016/j.neubiorev.2026.106779 · Cited by 1
Yang, X., Gao, Y., Zhang, M., Pan, J., Liu, H., & Fan, H. (2026) · Journal of Alzheimer s Disease · doi:10.1177/13872877261450636
Doddi, A., Dawes, P., Chan, Y., & Lim, E. T. (2026) · bioRxiv (Cold Spring Harbor Laboratory) · doi:10.64898/2026.06.08.727881
Metadata
- Authors
- Sasmita, A. O., Depp, C., Nazarenko, T., Sun, T., Siems, S. B., Ong, E. C., Nkeh, Y. B., Böhler, C., Yu, X., Bues, B., Evangelista, L., Mao, S., Morgado, B., Wu, Z., Ruhwedel, T., Subramanian, S., Börensen, F., Overhoff, K., Spieth, L., Berghoff, S. A., Sadleir, K. R., Vassar, R., Eggert, S., Goebbels, S., Saito, T., Saido, T., Saher, G., Möbius, W., Castelo-Branco, G., Klafki, H.-W., Wirths, O., Wiltfang, J., Jäkel, S., Yan, R., & Nave, K.-A.
- Affiliations
- Max Planck Institute for Multidisciplinary Sciences (DE)
- Karolinska Institutet (SE)
- University College Cork (IE)
- LMU Klinikum (DE)
- Northwestern University (US)
- RIKEN Center for Brain Science (JP)
- Universitätsmedizin Göttingen (DE)
- German Center for Neurodegenerative Diseases (DE)
- UConn Health (US)
- Corresponding author
- Sasmita, Andrew Octavian
- Depp, Constanze
- Nave, Klaus-Armin
- ORCID
- Sasmita, Andrew Octavian
- Depp, Constanze
- Sun, Ting
- Siems, Sophie B.
- Ong, Erinne Cherisse
- Nkeh, Yakum B.
- Bues, Bastian
- Evangelista, Lisa
- Morgado, Barbara
- Ruhwedel, Torben
- Subramanian, Swati
- Spieth, Lena
- Berghoff, Stefan A.
- Sadleir, Katherine Rose
- Vassar, Robert
- Eggert, Simone
- Goebbels, Sandra
- Saito, Takashi
- Saido, Takaomi
- Saher, Gesine
- Möbius, Wiebke
- Castelo-Branco, Gonçalo
- Klafki, Hans-Wolfgang
- Wirths, Oliver
- Wiltfang, Jens
- Jäkel, Sarah
- Yan, Riqiang
- Nave, Klaus-Armin
- Venue
- Nature Neuroscience
- Published
- 2024-08-05
- Volume
- 27
- Issue
- 9
- Pages
- 1668-1674
- ISSN
- 1097-6256 (ISSN-L)
- 1546-1726
- PMC
- PMC11374705
- OpenAlex
- W4401339790
- Cited by
- 125
- References
- 58
- Citations by year
- 2026: 51 · 2025: 57 · 2024: 17
- FWCI
- 17.85
- Type
- journal article
- Language
- en
- Open access
- hybrid
- doi.org
- Locations
- Nature Neuroscience (publishedVersion, cc-by)
- bioRxiv (Cold Spring Harbor Laboratory) (submittedVersion)
- PubMed Central (publishedVersion, cc-by)
- PubMed (publishedVersion)
- Open access LMU (Ludwid Maxmilian's Universitat Munchen) (submittedVersion, cc-by)
- DZNE Pub (submittedVersion, cc-by)
- GoeScholar The Publication Server of the Georg-August-Universität Göttingen (Georg-August-Universität Göttingen) (submittedVersion, cc-by)
- Funders
- Deutsche Forschungsgemeinschaft (TRR-274)
- Max-Planck-Gesellschaft
- Topics
- Life Sciences › Neuroscience › Cellular and Molecular Neuroscience › Alzheimer's disease research and treatments
- Life Sciences › Neuroscience › Neurology › Neuroinflammation and Neurodegeneration Mechanisms
- Health Sciences › Medicine › Psychiatry and Mental health › Dementia and Cognitive Impairment Research
- Keywords
- oligodendrocytes, amyloid-beta, Alzheimer's disease, amyloid plaques, amyloid precursor protein, BACE1, humanized mice
- MeSH terms
- Alzheimer Disease, Animals, Disease Models, Animal, Humans, Mice, Transgenic, Neurons, Oligodendroglia, Amyloid beta-Peptides, Aspartic Acid Endopeptidases, Amyloid beta-Protein Precursor, Mice, Amyloid Precursor Protein Secretases, Plaque, Amyloid
About these checks
Registry, retraction, Cites and statistics results are computed, not judged, with one exception: a printed reference that no index lists is read once by a model before it counts as a citation error. Claims are extracted by a model and kept only when their quote appears verbatim in the text; each cited source is then checked, with a model’s help, for whether it says what the claim relies on. Those verdicts can be wrong — read the claim’s quote and the cited source before relying on one.
A language model drew the claims from the paper on 2026-10-11, under version 3 of the claim definition (model deepseek-v4.1-flash, prompt extract-v3).
A second model labelled each claim on 2026-10-11 (model jev-1.13-20260917, definition revision gold-guideline-v0.2).
Cited sources are checked with a language model’s help (gpt-6-sol).
Statistics and arithmetic are recomputed, not judged.
Confidence bands are shown only for fields calibrated on our annotated test set. None is calibrated yet, so no band is shown.
What counts as a claim ›How we measure confidence ›How we check this ›
Are you an author, or do you see a problem with this page? Request a review
