

The DOI matches its Crossref record; 8 of the 8 references it cites were found in a registry or an index.
R1441C and G2019S LRRK2 knockin mice have distinct striatal molecular, physiological, and behavioral alterations
Published version of a preprint
Abstract
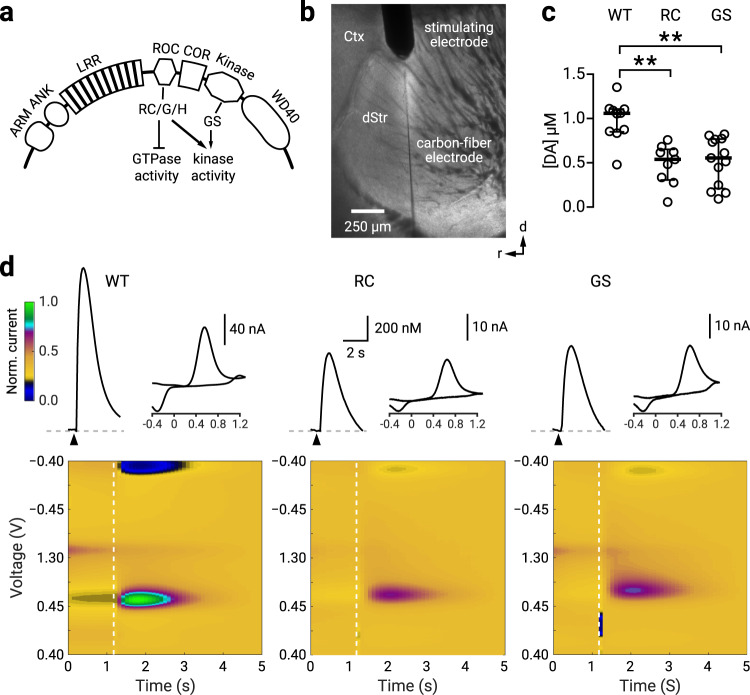
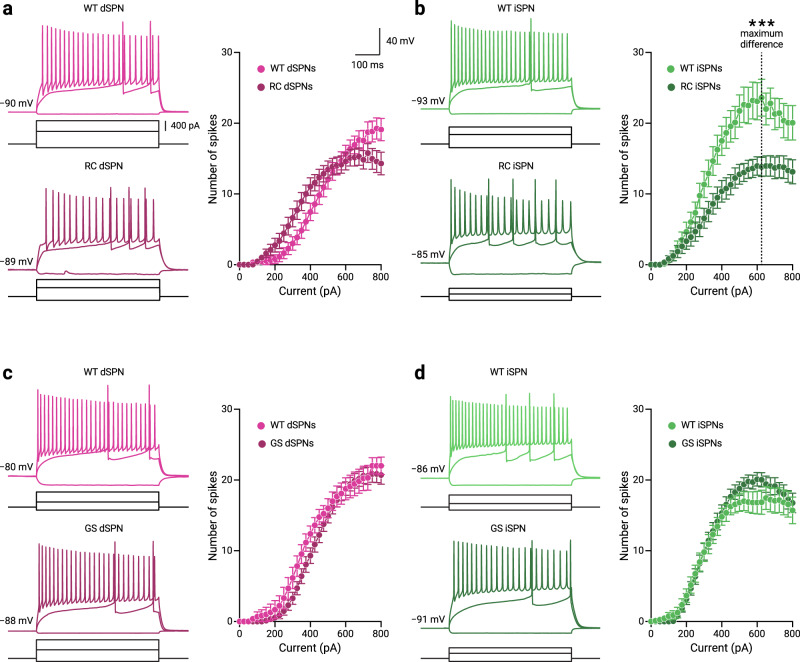
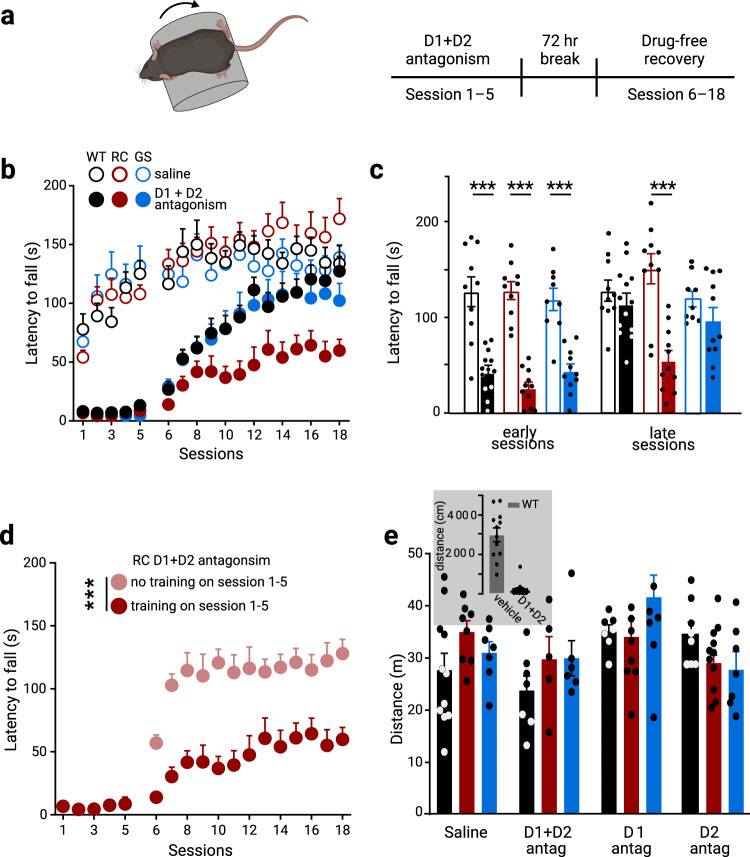
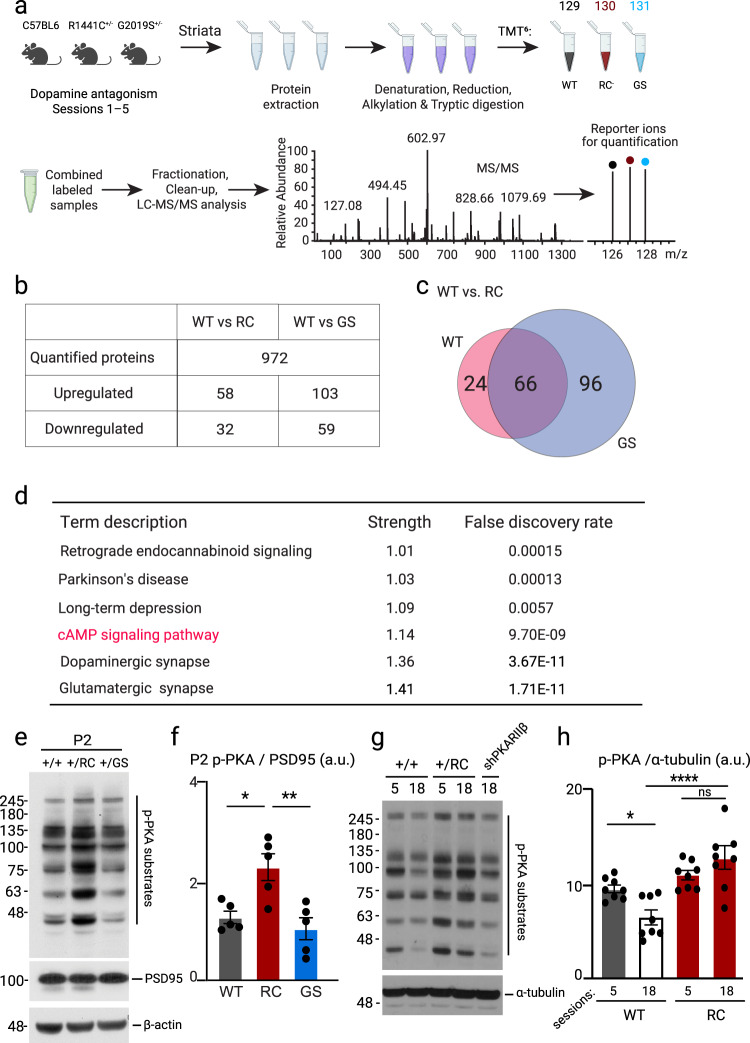
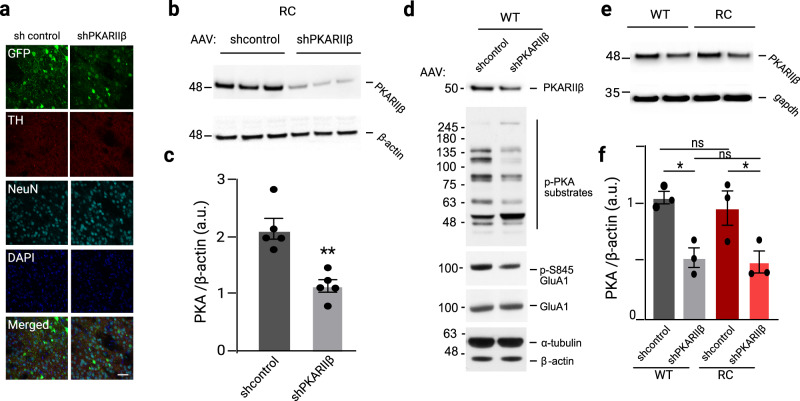
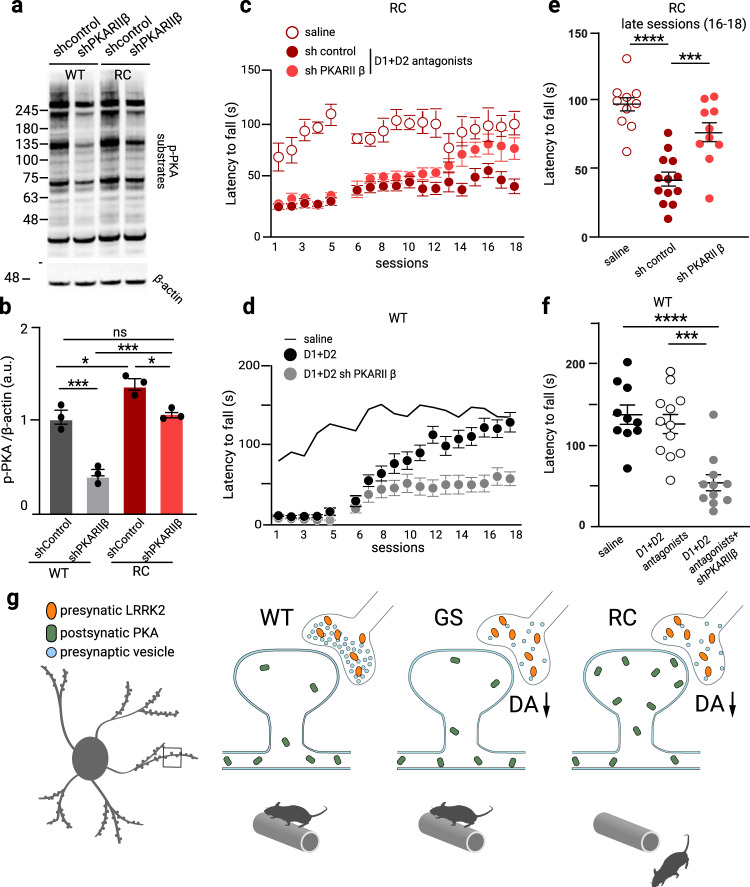
LRRK2 mutations are closely associated with Parkinson’s disease (PD). Convergent evidence suggests that LRRK2 regulates striatal function. Here, by using knock-in mouse lines expressing the two most common LRRK2 pathogenic mutations—G2019S and R1441C—we investigated how LRRK2 mutations altered striatal physiology. While we found that both R1441C and G2019S mice displayed reduced nigrostriatal dopamine release, hypoexcitability in indirect-pathway striatal projection neurons, and alterations associated with an impaired striatal-dependent motor learning were observed only in the R1441C mice. We also showed that increased synaptic PKA activities in the R1441C and not G2019S mice underlie the specific alterations in motor learning deficits in the R1441C mice. In summary, our data argue that LRRK2 mutations’ impact on the striatum cannot be simply generalized. Instead, alterations in electrochemical, electrophysiological, molecular, and behavioral levels were distinct between LRRK2 mutations. Our findings offer mechanistic insights for devising and optimizing treatment strategies for PD patients.
Overview
The claims and statistics of this paper haven’t been checked yet.
Run the check — free, no account needed. It reads the open-access text and checks the sources it cites.
Integrity signals
Registry
Cites
Statistics
Figures
Verification
Claims the paper makes
The claims and statistics of this paper haven’t been checked yet.
Run the check — free, no account needed. It reads the open-access text and checks the sources it cites.
Claims other papers make about this one
Each is checked against this paper’s own text: does it say what the citing paper says it does?
The source backs part of the claim, not all of it — or backs it for a different population, condition or comparison.
In the citing paper
“Multiple studies point to a role for LRRK2 at the presynaptic terminal where it plays a role in release of dopamine from striato-nigral neurons, and glutamate from corticostriatal neurons [5, 6, 11, 50, 86, 92, 95].”
From Cellular and subcellular localization of Rab10 and phospho-T73 Rab10 in the mouse and human brain (2023) · cites this paper as [92]
Experimental — accuracy not yet measured
Self-check
Percentages, sums and reported differences re-computed from the paper’s own numbers.
The self-check needs the paper’s full text.
Citations
Cites
International Parkinson's Disease Genomics Consortium (IPDGC), Nalls, M. A., Parkinson's Study Group (PSG) Parkinson's Research: The Organized GENetics Initiative (PROGENI), 23andMe, GenePD, NeuroGenetics Research Consortium (NGRC), Hussman Institute of Human Genomics (HIHG), Investigator, T. A. J. D., (CHARGE), C. F. H. A. A. R. I. G. E., North American Brain Expression Consortium (NABEC), et al. (2014) · Nature Genetics · doi:10.1038/ng.3043 · Cited by 1,895
A rotarod test for evaluation of motor skill learning
Shiotsuki, H., Yoshimi, K., Shimo, Y., Funayama, M., Takamatsu, Y., Ikeda, K., Takahashi, R., Kitazawa, S., & Hattori, N. (2010) · Journal of Neuroscience Methods · doi:10.1016/j.jneumeth.2010.03.026 · Cited by 627
Visualizing samples with box plots
Krzywinski, M., & Altman, N. (2014) · Nature Methods · doi:10.1038/nmeth.2813 · Cited by 576
Ramonet, D., Daher, J. P. L., Lin, B. M., Stafa, K., Kim, J., Banerjee, R., Westerlund, M., Pletnikova, O., Glauser, L., Yang, L., et al. (2011) · PLoS ONE · doi:10.1371/journal.pone.0018568 · Cited by 405
Neural mechanisms of reward-related motor learning
Wickens, J. R., Reynolds, J. N., & Hyland, B. I. (2003) · Current Opinion in Neurobiology · doi:10.1016/j.conb.2003.10.013 · Cited by 284
Dopamine D2 receptors regulate the anatomical and functional balance of basal ganglia circuitry
Cazorla, M., de Carvalho, F. D., Chohan, M. O., Shegda, M., Chuhma, N., Rayport, S., Ahmari, S. E., Moore, H., & Kellendonk, C. (2014) · Neuron · doi:10.1016/j.neuron.2013.10.041 · Cited by 226
Cell-type-specific asynchronous modulation of PKA by dopamine in learning
Lee, S. J., Lodder, B., Chen, Y., Patriarchi, T., Tian, L., & Sabatini, B. L. (2021) · Nature · doi:10.1038/s41586-020-03050-5 · Cited by 160
Adenylyl Cyclase Type 5 Contributes to Corticostriatal Plasticity and Striatum-Dependent Learning
Kheirbek, M. A., Britt, J. P., Beeler, J. A., Ishikawa, Y., McGehee, D. S., & Zhuang, X. (2009) · The Journal of Neuroscience · doi:10.1523/jneurosci.3343-09.2009 · Cited by 93
Research works printed but not linked: 90
- Alessi, D. R. & Sammler, E. LRRK2 kinase in Parkinson’s disease. Science 360, 36–37 (2018). · DOI · Paper page
- Cookson, M. R. The role of leucine-rich repeat kinase 2 (LRRK2) in Parkinson’s disease. Nat. Rev. Neurosci. 11, 791–797 (2010). · DOI
- Satake, W. et al. Genome-wide association study identifies common variants at four loci as genetic risk factors for Parkinson’s disease. Nat. Genet. 41, 1303–1307 (2009). · DOI
- Simon-Sanchez, J. et al. Genome-wide association study reveals genetic risk underlying Parkinson’s disease. Nat. Genet. 41, 1308–1312 (2009). · DOI · Paper page
- Di Fonzo, A. et al. Comprehensive analysis of the LRRK2 gene in sixty families with Parkinson’s disease. Eur. J. Hum. Genet. 14, 322–331 (2006). · DOI
- Haugarvoll, K. et al. Lrrk2 R1441C parkinsonism is clinically similar to sporadic Parkinson disease. Neurology 70, 1456–1460 (2008). · DOI
- Kluss, J. H., Mamais, A. & Cookson, M. R. LRRK2 links genetic and sporadic Parkinson’s disease. Biochem. Soc. Trans. 47, 651–661 (2019). · DOI · Paper page
- Paisan-Ruiz, C., Lewis, P. A. & Singleton, A. B. LRRK2: cause, risk, and mechanism. J. Parkinsons Dis. 3, 85–103 (2013). · DOI
- Dauer, W. & Ho, C. C. The biology and pathology of the familial Parkinson’s disease protein LRRK2. Mov. Disord. 25, S40–S43 (2010). · DOI
- Esteves, A. R., Swerdlow, R. H. & Cardoso, S. M. LRRK2, a puzzling protein: insights into Parkinson’s disease pathogenesis. Exp. Neurol. 261, 206–216 (2014). · DOI
- Tokars, V., Chen, C. & Parisiadou, L. Closing the structure-to-function gap for LRRK2. Trends Biochem Sci https://doi.org/10.1016/j.tibs.2021.10.003 (2021). · DOI
- Steger, M. et al. Phosphoproteomics reveals that Parkinson’s disease kinase LRRK2 regulates a subset of Rab GTPases. Elife 5 https://doi.org/10.7554/eLife.12813 (2016). · DOI · Paper page
- Liu, Z. et al. LRRK2 phosphorylates membrane-bound Rabs and is activated by GTP-bound Rab7L1 to promote recruitment to the trans-Golgi network. Hum. Mol. Genet. 27, 385–395 (2018). · DOI · Paper page
- Shu, L. et al. Clinical heterogeneity among LRRK2 variants in Parkinson’s disease: a meta-analysis. Front Aging Neurosci. 10, 283 (2018). · DOI
- Dubbioso, R. et al. Does motor cortex plasticity depend on the type of mutation in the leucine-rich repeat kinase 2 gene? Mov. Disord. 32, 947–948 (2017). · DOI
- Volta, M. & Melrose, H. LRRK2 mouse models: dissecting the behavior, striatal neurochemistry and neurophysiology of PD pathogenesis. Biochem Soc. Trans. 45, 113–122 (2017). · DOI
- Xiong, Y., Dawson, T. M. & Dawson, V. L. Models of LRRK2-associated Parkinson’s disease. Adv. Neurobiol. 14, 163–191 (2017). · DOI
- Tong, Y. et al. R1441C mutation in LRRK2 impairs dopaminergic neurotransmission in mice. Proc. Natl Acad. Sci. USA 106, 14622–14627 (2009). · DOI
- Yue, M. et al. Progressive dopaminergic alterations and mitochondrial abnormalities in LRRK2 G2019S knock-in mice. Neurobiol. Dis. 78, 172–195 (2015). · DOI · Paper page
- West, A. B. et al. Differential LRRK2 expression in the cortex, striatum, and substantia nigra in transgenic and nontransgenic rodents. J. Comp. Neurol. 522, 2465–2480 (2014). · DOI · Paper page
- Cho, H. J. et al. MicroRNA-205 regulates the expression of Parkinson’s disease-related leucine-rich repeat kinase 2 protein. Hum. Mol. Genet 22, 608–620 (2013). · DOI
- Parisiadou, L. et al. LRRK2 regulates synaptogenesis and dopamine receptor activation through modulation of PKA activity. Nat. Neurosci. 17, 367–376 (2014). · DOI
- Matikainen-Ankney, B. A. et al. Altered development of synapse structure and function in striatum caused by Parkinson’s disease-linked LRRK2-G2019S mutation. J. Neurosci. 36, 7128–7141 (2016). · DOI · Paper page
- Volta, M. et al. Initial elevations in glutamate and dopamine neurotransmission decline with age, as does exploratory behavior, in LRRK2 G2019S knock-in mice. Elife 6 https://doi.org/10.7554/eLife.28377 (2017). · DOI · Paper page
- Chen, C. et al. Pathway-specific dysregulation of striatal excitatory synapses by LRRK2 mutations. Elife 9 https://doi.org/10.7554/eLife.58997 (2020). · DOI · Paper page
- Iannotta, L. et al. Divergent effects of G2019S and R1441C LRRK2 mutations on LRRK2 and Rab10 phosphorylations in mouse tissues. Cells 9 https://doi.org/10.3390/cells9112344 (2020). · DOI
- Li, X. et al. Enhanced striatal dopamine transmission and motor performance with LRRK2 overexpression in mice is eliminated by familial Parkinson’s disease mutation G2019S. J. Neurosci. 30, 1788–1797 (2010). · DOI
- Li, Y. et al. Mutant LRRK2(R1441G) BAC transgenic mice recapitulate cardinal features of Parkinson’s disease. Nat. Neurosci. 12, 826–828 (2009). · DOI
- Melrose, H. L. et al. Impaired dopaminergic neurotransmission and microtubule-associated protein tau alterations in human LRRK2 transgenic mice. Neurobiol. Dis. 40, 503–517 (2010). · DOI
- Beil, J., Fairbairn, L., Pelczar, P. & Buch, T. Is BAC transgenesis obsolete? State of the art in the era of designer nucleases. J. Biomed. Biotechnol. 2012, 308414 (2012). · DOI
- Chaturvedi, P., Zhao, B., Zimmerman, D. L. & Belmont, A. S. Stable and reproducible transgene expression independent of proliferative or differentiated state using BAC TG-EMBED. Gene Ther. 25, 376–391 (2018). · DOI
- Lahiri, A. K. & Bevan, M. D. Dopaminergic transmission rapidly and persistently enhances excitability of D1 receptor-expressing striatal projection neurons. Neuron 106, 277–290.e6 (2020). · DOI · Paper page
- Gerfen, C. R. & Surmeier, D. J. Modulation of striatal projection systems by dopamine. Annu Rev. Neurosci. 34, 441–466 (2011). · DOI
- Bernard, V., Normand, E. & Bloch, B. Phenotypical characterization of the rat striatal neurons expressing muscarinic receptor genes. J. Neurosci. 12, 3591–3600 (1992). · DOI
- Ericsson, J. et al. Dopamine differentially modulates the excitability of striatal neurons of the direct and indirect pathways in lamprey. J. Neurosci. 33, 8045–8054 (2013). · DOI
- Ding, L. & Perkel, D. J. Dopamine modulates excitability of spiny neurons in the avian basal ganglia. J. Neurosci. 22, 5210–5218 (2002). · DOI
- Chan, C. S. et al. Strain-specific regulation of striatal phenotype in Drd2-eGFP BAC transgenic mice. J. Neurosci. 32, 9124–9132 (2012). · DOI
- Fieblinger, T. et al. Cell type-specific plasticity of striatal projection neurons in parkinsonism and L-DOPA-induced dyskinesia. Nat. Commun. 5, 5316 (2014). · DOI
- Gertler, T. S., Chan, C. S. & Surmeier, D. J. Dichotomous anatomical properties of adult striatal medium spiny neurons. J. Neurosci. 28, 10814–10824 (2008). · DOI
- Tozzi, A. et al. Dopamine D2 receptor-mediated neuroprotection in a G2019S Lrrk2 genetic model of Parkinson’s disease. Cell Death Dis. 9, 204 (2018). · DOI
- Beccano-Kelly, D. A. et al. Synaptic function is modulated by LRRK2 and glutamate release is increased in cortical neurons of G2019S LRRK2 knock-in mice. Front Cell Neurosci. 8, 301 (2014). · DOI · Paper page
- Kupferschmidt, D. A., Juczewski, K., Cui, G., Johnson, K. A. & Lovinger, D. M. Parallel, but dissociable, processing in discrete corticostriatal inputs encodes skill learning. Neuron 96, 476–489 e475 (2017). · DOI
- Monville, C., Torres, E. M. & Dunnett, S. B. Comparison of incremental and accelerating protocols of the rotarod test for the assessment of motor deficits in the 6-OHDA model. J. Neurosci. Methods 158, 219–223 (2006). · DOI
- Rozas, G., Lopez-Martin, E., Guerra, M. J. & Labandeira-Garcia, J. L. The overall rod performance test in the MPTP-treated-mouse model of Parkinsonism. J. Neurosci. Methods 83, 165–175 (1998). · DOI
- Beeler, J. A. et al. A role for dopamine-mediated learning in the pathophysiology and treatment of Parkinson’s disease. Cell Rep. 2, 1747–1761 (2012). · DOI
- Zhuang, X., Mazzoni, P. & Kang, U. J. The role of neuroplasticity in dopaminergic therapy for Parkinson disease. Nat. Rev. Neurol. 9, 248–256 (2013). · DOI
- Kawashima, S., Ueki, Y., Kato, T., Ito, K. & Matsukawa, N. Reduced striatal dopamine release during motor skill acquisition in Parkinson’s disease. PLoS ONE 13, e0196661 (2018). · DOI
- Beeler, J. A. et al. Dopamine-dependent motor learning: insight into levodopa’s long-duration response. Ann. Neurol. 67, 639–647 (2010). · DOI · Paper page
- Yin, H. H. et al. Dynamic reorganization of striatal circuits during the acquisition and consolidation of a skill. Nat. Neurosci. 12, 333–341 (2009). · DOI · Paper page
- Costa, R. M., Cohen, D. & Nicolelis, M. A. Differential corticostriatal plasticity during fast and slow motor skill learning in mice. Curr. Biol. 14, 1124–1134 (2004). · DOI · Paper page
- Giesert, F. et al. The pathogenic LRRK2 R1441C mutation induces specific deficits modeling the prodromal phase of Parkinson’s disease in the mouse. Neurobiol. Dis. 105, 179–193 (2017). · DOI
- Fell, M. J. et al. MLi-2, a potent, selective, and centrally active compound for exploring the therapeutic potential and safety of LRRK2 kinase inhibition. J. Pharm. Exp. Ther. 355, 397–409 (2015). · DOI
- Dzamko, N. et al. Inhibition of LRRK2 kinase activity leads to dephosphorylation of Ser(910)/Ser(935), disruption of 14-3-3 binding and altered cytoplasmic localization. Biochem. J. 430, 405–413 (2010). · DOI
- Lis, P. et al. Development of phospho-specific Rab protein antibodies to monitor in vivo activity of the LRRK2 Parkinson’s disease kinase. Biochem J. 475, 1–22 (2018). · DOI · Paper page
- Surmeier, D. J., Carrillo-Reid, L. & Bargas, J. Dopaminergic modulation of striatal neurons, circuits, and assemblies. Neuroscience 198, 3–18 (2011). · DOI
- Smith, F. D. et al. Local protein kinase A action proceeds through intact holoenzymes. Science 356, 1288–1293 (2017). · DOI
- Brandon, E. P. et al. Defective motor behavior and neural gene expression in RIIbeta-protein kinase A mutant mice. J. Neurosci. 18, 3639–3649 (1998). · DOI
- Zimprich, A. et al. The PARK8 locus in autosomal dominant parkinsonism: confirmation of linkage and further delineation of the disease-containing interval. Am. J. Hum. Genet. 74, 11–19 (2004). · DOI
- Paisan-Ruiz, C. et al. Cloning of the gene containing mutations that cause PARK8-linked Parkinson’s disease. Neuron 44, 595–600 (2004). · DOI
- Piccoli, G. et al. LRRK2 controls synaptic vesicle storage and mobilization within the recycling pool. J. Neurosci. 31, 2225–2237 (2011). · DOI
- Shin, N. et al. LRRK2 regulates synaptic vesicle endocytosis. Exp. Cell Res. 314, 2055–2065 (2008). · DOI
- Matta, S. et al. LRRK2 controls an EndoA phosphorylation cycle in synaptic endocytosis. Neuron 75, 1008–1021 (2012). · DOI · Paper page
- Nguyen, M. & Krainc, D. LRRK2 phosphorylation of auxilin mediates synaptic defects in dopaminergic neurons from patients with Parkinson’s disease. Proc. Natl Acad. Sci. USA 115, 5576–5581 (2018). · DOI
- Islam, M. S. et al. Human R1441C LRRK2 regulates the synaptic vesicle proteome and phosphoproteome in a Drosophila model of Parkinson’s disease. Hum. Mol. Genet 25, 5365–5382 (2016).
- Pan, P. Y. et al. Parkinson’s disease-associated LRRK2 hyperactive kinase mutant disrupts synaptic vesicle trafficking in ventral midbrain neurons. J. Neurosci. 37, 11366–11376 (2017). · DOI · Paper page
- Kang, U. J. & Auinger, P., Parkinson Study Group, E. I. Activity enhances dopaminergic long-duration response in Parkinson disease. Neurology 78, 1146–1149 (2012). · DOI
- Koranda, J. L. et al. Chronic nicotine mitigates aberrant inhibitory motor learning induced by motor experience under dopamine deficiency. J. Neurosci. 36, 5228–5240 (2016). · DOI
- Surmeier, D. J., Ding, J., Day, M., Wang, Z. & Shen, W. D1 and D2 dopamine-receptor modulation of striatal glutamatergic signaling in striatal medium spiny neurons. Trends Neurosci. 30, 228–235 (2007). · DOI · Paper page
- Thach, W. T. What is the role of the cerebellum in motor learning and cognition? Trends Cogn. Sci. 2, 331–337 (1998). · DOI
- Orban, P. et al. The multifaceted nature of the relationship between performance and brain activity in motor sequence learning. Neuroimage 49, 694–702 (2010). · DOI
- Massengill, C. I. et al. Highly sensitive genetically-encoded sensors for population and subcellular imaging of cAMP in vivo. https://doi.org/10.1101/2021.08.27.457999 (2021). · DOI
- Muda, K. et al. Parkinson-related LRRK2 mutation R1441C/G/H impairs PKA phosphorylation of LRRK2 and disrupts its interaction with 14-3-3. Proc. Natl Acad. Sci. USA 111, E34–E43 (2014). · DOI
- Greggio, E., Bubacco, L. & Russo, I. Cross-talk between LRRK2 and PKA: implication for Parkinson’s disease? Biochem Soc. Trans. 45, 261–267 (2017). · DOI
- Cui, G. et al. Concurrent activation of striatal direct and indirect pathways during action initiation. Nature 494, 238–242 (2013). · DOI
- Nandhagopal, R. et al. Progression of dopaminergic dysfunction in a LRRK2 kindred: a multitracer PET study. Neurology 71, 1790–1795 (2008). · DOI
- Helmich, R. C. et al. Reorganization of corticostriatal circuits in healthy G2019S LRRK2 carriers. Neurology 84, 399–406 (2015). · DOI
- Vilas, D. et al. Clinical and imaging markers in premotor LRRK2 G2019S mutation carriers. Parkinsonism Relat. Disord. 21, 1170–1176 (2015). · DOI
- Gonzalez-Rodriguez, P. et al. Disruption of mitochondrial complex I induces progressive parkinsonism. Nature 599, 650–656 (2021). · DOI
- Hernandez, V. M. et al. Parvalbumin+ neurons and Npas1+ neurons are distinct neuron classes in the mouse external globus pallidus. J. Neurosci. 35, 11830–11847 (2015). · DOI
- Haber, S. N., Kim, K. S., Mailly, P. & Calzavara, R. Reward-related cortical inputs define a large striatal region in primates that interface with associative cortical connections, providing a substrate for incentive-based learning. J. Neurosci. 26, 8368–8376 (2006). · DOI · Paper page
- Elliott, R., Newman, J. L., Longe, O. A. & Deakin, J. F. Differential response patterns in the striatum and orbitofrontal cortex to financial reward in humans: a parametric functional magnetic resonance imaging study. J. Neurosci. 23, 303–307 (2003). · DOI
- Schultz, W., Tremblay, L. & Hollerman, J. R. Reward processing in primate orbitofrontal cortex and basal ganglia. Cereb. Cortex 10, 272–284 (2000). · DOI · Paper page
- Corlett, P. R. et al. Prediction error during retrospective revaluation of causal associations in humans: fMRI evidence in favor of an associative model of learning. Neuron 44, 877–888 (2004).
- McFarland, N. R. & Haber, S. N. Convergent inputs from thalamic motor nuclei and frontal cortical areas to the dorsal striatum in the primate. J. Neurosci. 20, 3798–3813 (2000). · DOI
- Lemos, J. C. et al. Enhanced GABA transmission drives bradykinesia following loss of dopamine D2 receptor signaling. Neuron 90, 824–838 (2016). · DOI
- Adrover, M. F., Shin, J. H. & Alvarez, V. A. Glutamate and dopamine transmission from midbrain dopamine neurons share similar release properties but are differentially affected by cocaine. J. Neurosci. 34, 3183–3192 (2014). · DOI
- Brundage, J. N. et al. Regional and sex differences in spontaneous striatal dopamine transmission. J. Neurochem. https://doi.org/10.1111/jnc.15473 (2021). · DOI
- Scott, J. D. et al. Discovery of a 3-(4-Pyrimidinyl) Indazole (MLi-2), an orally available and selective leucine-rich repeat kinase 2 (LRRK2) inhibitor that reduces brain kinase activity. J. Med Chem. 60, 2983–2992 (2017). · DOI
- He, Q. et al. Critical period inhibition of NKCC1 rectifies synapse plasticity in the somatosensory cortex and restores adult tactile response maps in fragile X mice. Mol. Psychiatry 24, 1732–1747 (2019). · DOI
- Streit, M. & Gehlenborg, N. Bar charts and box plots. Nat. Methods 11, 117 (2014). · DOI
Cited by
Sorted by citations
Cellular and subcellular localization of Rab10 and phospho-T73 Rab10 in the mouse and human brain
Singh, V., Menard, M. A., Serrano, G. E., Beach, T. G., Zhao, H. T., Riley-DiPaolo, A., Subrahmanian, N., LaVoie, M. J., & Volpicelli-Daley, L. A. (2023) · Acta Neuropathologica Communications · doi:10.1186/s40478-023-01704-9 · Cited by 9
Metadata
- Authors
- Xenias, H. S., Chen, C., Kang, S., Cherian, S., Situ, X., Shanmugasundaram, B., Liu, G., Scesa, G., Chan, C. S., & Parisiadou, L.
- Venue
- Communications Biology
- Published
- 2022-11-10
- Volume
- 5
- Issue
- 1
- ISSN
- 2399-3642
- PMC
- PMC9649688
- Cited by
- 32
- References
- 8
- Language
- en
- Funders
- U.S. Department of Health & Human Services | National Institutes of Health (R01 NS097901)
- Michael J. Fox Foundation for Parkinson’s Research (020600)
About these checks
Registry, retraction, Cites and statistics results are computed, not judged, with one exception: a printed reference that no index lists is read once by a model before it counts as a citation error. Claims are extracted by a model and kept only when their quote appears verbatim in the text; each cited source is then checked, with a model’s help, for whether it says what the claim relies on. Those verdicts can be wrong — read the claim’s quote and the cited source before relying on one.
Statistics and arithmetic are recomputed, not judged.
Confidence bands are shown only for fields calibrated on our annotated test set. None is calibrated yet, so no band is shown.
What counts as a claim ›How we measure confidence ›How we check this ›
Are you an author, or do you see a problem with this page? Request a review
