

The DOI matches its Crossref record; 66 of the 67 references it cites were found in a registry or an index.
Individual and additive effects of vitamin D, omega-3 and exercise on DNA methylation clocks of biological aging in older adults from the DO-HEALTH trial
Open accessAbstract
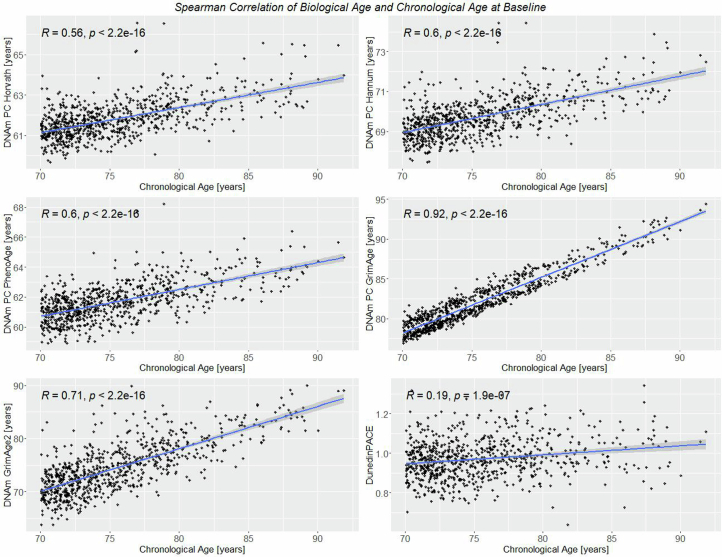
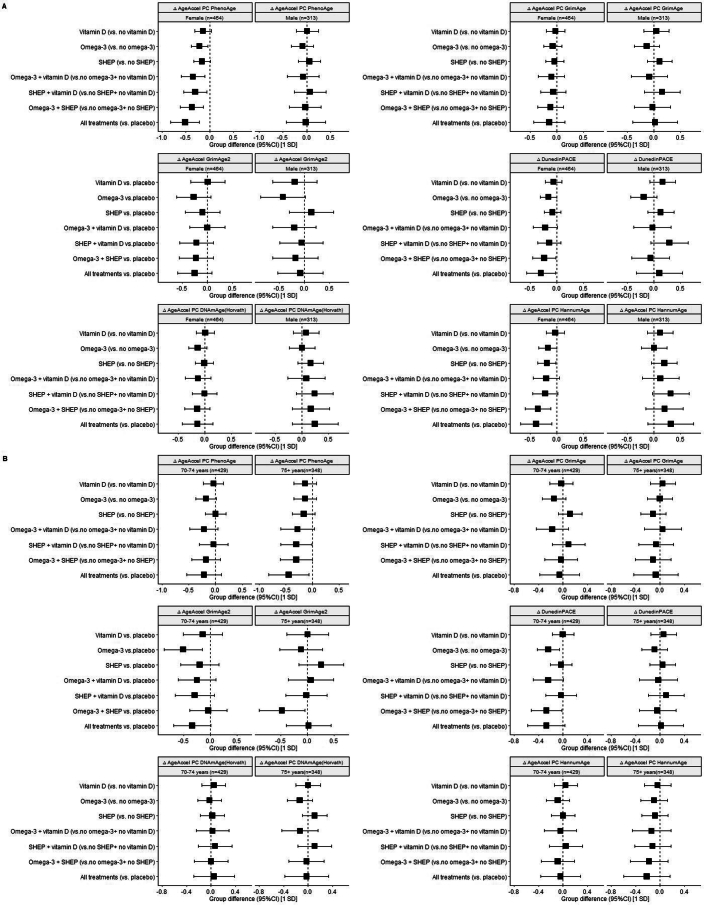
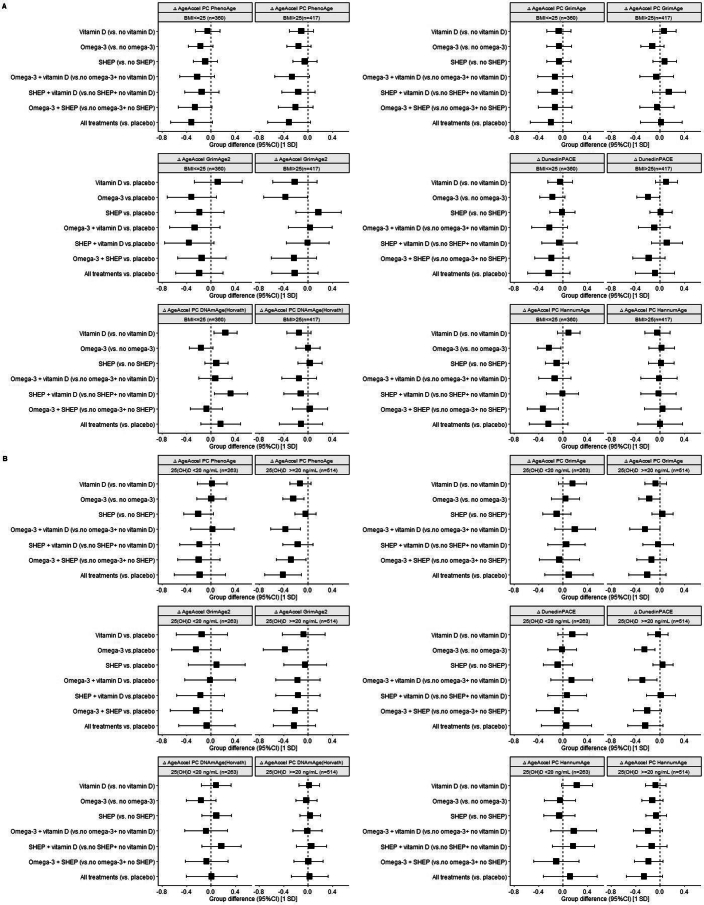
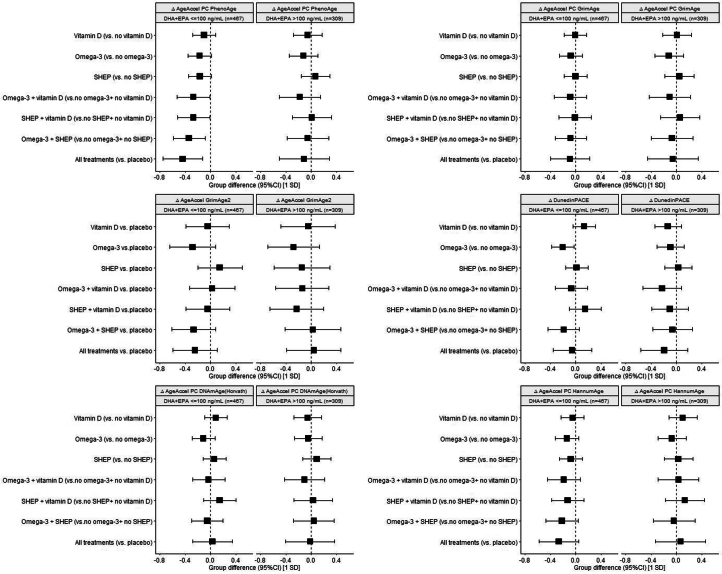
While observational studies and small pilot trials suggest that vitamin D, omega-3 and exercise may slow biological aging, larger clinical trials testing these treatments individually or in combination are lacking. Here, we report the results of a post hoc analysis among 777 participants of the DO-HEALTH trial on the effect of vitamin D (2,000 IU per day) and/or omega-3 (1 g per day) and/or a home exercise program on four next-generation DNA methylation (DNAm) measures of biological aging (PhenoAge, GrimAge, GrimAge2 and DunedinPACE) over 3 years. Omega-3 alone slowed the DNAm clocks PhenoAge, GrimAge2 and DunedinPACE, and all three treatments had additive benefits on PhenoAge. Overall, from baseline to year 3, standardized effects ranged from 0.16 to 0.32 units (2.9–3.8 months). In summary, our trial indicates a small protective effect of omega-3 treatment on slowing biological aging over 3 years across several clocks, with an additive protective effect of omega-3, vitamin D and exercise based on PhenoAge.
Overview
The claims and statistics of this paper haven’t been checked yet.
Run the check — free, no account needed. It reads the open-access text and checks the sources it cites.
Integrity signals
Registry
Cites
Statistics
Figures
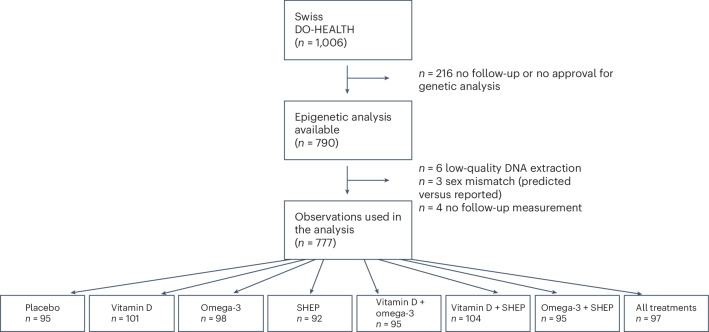
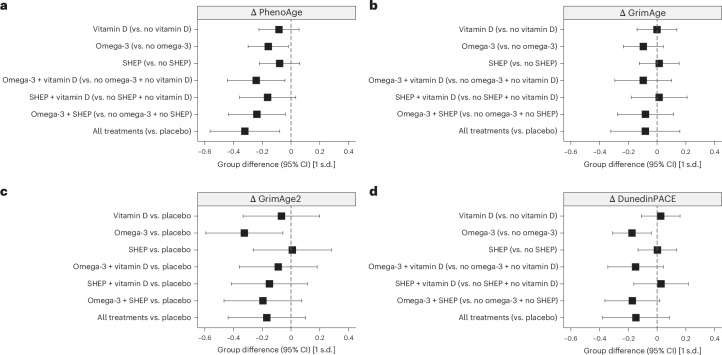
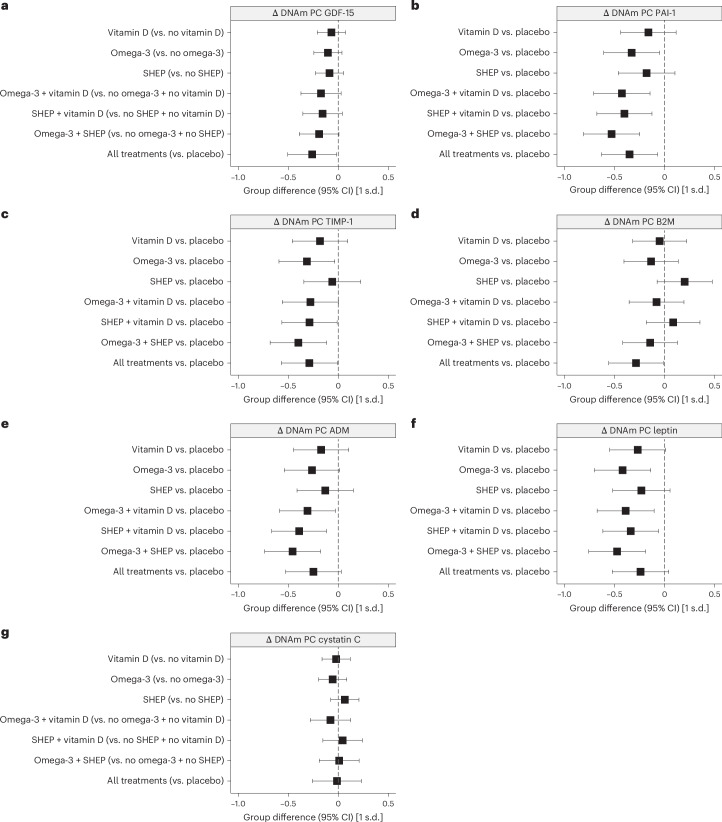
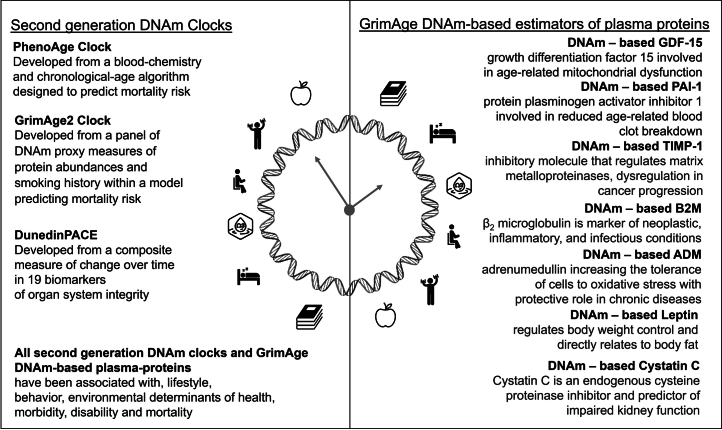
Verification
Claims the paper makes
The claims and statistics of this paper haven’t been checked yet.
Run the check — free, no account needed. It reads the open-access text and checks the sources it cites.
Claims other papers make about this one
Each is checked against this paper’s own text: does it say what the citing paper says it does?
The check wasn’t confident either way, so it gives no verdict — never disputed.
In the citing paper
“Adjunctive anti-inflammatory agents such as omega-3 fatty acids or low-dose acetylsalicylic acid (AAS) can also help to mitigate the chronic low-grade inflammation commonly associated with aging and metabolic dysfunction, but evidence is still very limited”
From Exercise-Induced Muscle–Fat Crosstalk: Molecular Mediators and Their Pharmacological Modulation for the Maintenance of Metabolic Flexibility in Aging (2025) · cites this paper as [124]
Experimental — accuracy not yet measured
Self-check
Percentages, sums and reported differences re-computed from the paper’s own numbers.
The self-check needs the paper’s full text.
Citations
Cites
DNA methylation age of human tissues and cell types
Horvath, S. (2013) · Genome Biology · doi:10.1186/gb-2013-14-10-r115 · Cited by 7,075
Self-citationGenome-wide methylation profiles reveal quantitative views of human aging rates
Hannum, G., Guinney, J., Zhao, L., Zhang, L., Hughes, G., Sadda, S., Klotzle, B., Bibikova, M., Fan, J.-B., Gao, Y., et al. (2013) · Molecular Cell · doi:10.1016/j.molcel.2012.10.016 · Cited by 4,270
An epigenetic biomarker of aging for lifespan and healthspan
Levine, M. E., Lu, A. T., Quach, A., Chen, B. H., Assimes, T. L., Bandinelli, S., Hou, L., Baccarelli, A. A., Stewart, J. D., Li, Y., et al. (2018) · Aging · doi:10.18632/aging.101414 · Cited by 3,675
Self-citationOrchestrating high-throughput genomic analysis with Bioconductor
Huber, W. K., Carey, V. J., Gentleman, R. C., Anders, S., Carlson, M. R. J., Carvalho, B. S., Bravo, H. C., Davis, S. R., Gatto, L., Girke, T., et al. (2015) · Nature Methods · doi:10.1038/nmeth.3252 · Cited by 3,614
DNA methylation-based biomarkers and the epigenetic clock theory of ageing
Horvath, S., & Raj, K. (2018) · Nature Reviews Genetics · doi:10.1038/s41576-018-0004-3 · Cited by 3,095
Self-citationDNA methylation GrimAge strongly predicts lifespan and healthspan
Lu, A. T., Quach, A., Wilson, J. G., Reiner, A. P., Aviv, A., Raj, K., Hou, L., Baccarelli, A. A., Li, Y., Stewart, J. D., et al. (2019) · Aging · doi:10.18632/aging.101684 · Cited by 2,540
Self-citationSangha, O., Stucki, G., Liang, M. H., Fossel, A. H., & Katz, J. N. (2003) · Arthritis Care & Research · doi:10.1002/art.10993 · Cited by 1,841
DNA methylation-based measures of biological age: meta-analysis predicting time to death
Chen, B. H., Marioni, R. E., Colicino, E., Peters, M. J., Ward-Caviness, C. K., Tsai, P.-C., Roetker, N. S., Just, A. C., Demerath, E. W., Guan, W., et al. (2016) · Aging · doi:10.18632/aging.101020 · Cited by 1,126
Self-citationDunedinPACE, a DNA methylation biomarker of the pace of aging
Belsky, D. W., Caspi, A., Corcoran, D. L., Sugden, K., Poulton, R., Arseneault, L., Baccarelli, A., Chamarti, K., Gao, X., Hannon, E., et al. (2022) · eLife · doi:10.7554/elife.73420 · Cited by 1,083
Self-citationReproducibility and validity of a self-administered physical activity questionnaire
WOLF, A. M., HUNTER, D. J., COLDITZ, G. A., MANSON, J. E., STAMPFER, M. J., CORSANO, K. A., ROSNER, B., KRISKA, A., & WILLETT, W. C. (1994) · International Journal of Epidemiology · doi:10.1093/ije/23.5.991 · Cited by 1,038
Self-citationDNA methylation aging clocks: challenges and recommendations
Bell, C. G., Lowe, R., Adams, P. D., Baccarelli, A. A., Beck, S., Bell, J. T., Christensen, B. C., Gladyshev, V. N., Heijmans, B. T., Horvath, S., et al. (2019) · Genome Biology · doi:10.1186/s13059-019-1824-y · Cited by 1,025
Self-citationEpigenetic clock analysis of diet, exercise, education, and lifestyle factors
Quach, A., Levine, M. E., Tanaka, T., Lu, A. T., Chen, B. H., Ferrucci, L., Ritz, B., Bandinelli, S., Neuhouser, M. L., Beasley, J. M., et al. (2017) · Aging · doi:10.18632/aging.101168 · Cited by 801
Self-citationMeasuring biological aging in humans: a quest
Ferrucci, L., Gonzalez‐Freire, M., Fabbri, E., Simonsick, E., Tanaka, T., Moore, Z., Salimi, S., Sierra, F., & de Cabo, R. (2020) · Aging Cell · doi:10.1111/acel.13080 · Cited by 781
Biomarkers of aging for the identification and evaluation of longevity interventions
Moqri, M., Herzog, C., Poganik, J. R., Justice, J., Belsky, D. W., Higgins-Chen, A., Moskalev, A., Fuellen, G., Cohen, A. A., Bautmans, I., et al. (2023) · Cell · doi:10.1016/j.cell.2023.08.003 · Cited by 736
Self-citationVitamin D supplementation for prevention of mortality in adults
Bjelakovic, G., Gluud, L. L., Nikolova, D., Whitfield, K., Wetterslev, J., Simonetti, R. G., Bjelakovic, M., & Gluud, C. (2014) · Cochrane Database of Systematic Reviews · doi:10.1002/14651858.cd007470.pub3 · Cited by 695
Higgins-Chen, A. T., Thrush, K. L., Wang, Y., Minteer, C. J., Kuo, P.-L., Wang, M., Niimi, P., Sturm, G., Lin, J., Moore, A. Z., et al. (2022) · Nature Aging · doi:10.1038/s43587-022-00248-2 · Cited by 502
DNA methylation-based estimator of telomere length
Lu, A. T., Seeboth, A., Tsai, P.-C., Sun, D., Quach, A., Reiner, A. P., Kooperberg, C., Ferrucci, L., Hou, L., Baccarelli, A. A., et al. (2019) · Aging · doi:10.18632/aging.102173 · Cited by 440
Self-citationBelsky, D. W., Moffitt, T. E., Cohen, A. A., Corcoran, D. L., Levine, M. E., Prinz, J. A., Schaefer, J. D., Sugden, K., Williams, B. S., Poulton, R., et al. (2017) · American Journal of Epidemiology · doi:10.1093/aje/kwx346 · Cited by 436
Self-citationBolland, M. J., Grey, A. B., Gamble, G. D., & Reid, I. R. (2014) · The Lancet Diabetes & Endocrinology · doi:10.1016/s2213-8587(13)70212-2 · Cited by 426
Effect of omega-3 fatty acids on cardiovascular outcomes: A systematic review and meta-analysis
Khan, S. U., Lone, A. N., Khan, M. S., Virani, S. S., Blumenthal, R. S., Nasir, K., Miller, M., Michos, E. D., Ballantyne, C. M., Boden, W. E., et al. (2021) · eClinicalMedicine · doi:10.1016/j.eclinm.2021.100997 · Cited by 411 · cited 1×
“44–49).”
Personal aging markers and ageotypes revealed by deep longitudinal profiling
Ahadi, S., Zhou, W., Schüssler-Fiorenza Rose, S. M., Sailani, M. R., Contrepois, K., Avina, M., Ashland, M., Brunet, A., & Snyder, M. (2020) · Nature Medicine · doi:10.1038/s41591-019-0719-5 · Cited by 408
Barbarawi, M., Kheiri, B., Zayed, Y., Barbarawi, O., Dhillon, H., Swaid, B., Yelangi, A., Sundus, S., Bachuwa, G. I., Alkotob, M. L., et al. (2019) · JAMA Cardiology · doi:10.1001/jamacardio.2019.1870 · Cited by 377
Validation of biomarkers of aging
Moqri, M., Herzog, C., Poganik, J. R., Ying, K., Justice, J. N., Belsky, D. W., Higgins-Chen, A. T., Chen, B. H., Cohen, A. A., Fuellen, G., et al. (2024) · Nature Medicine · doi:10.1038/s41591-023-02784-9 · Cited by 361
Self-citationBischoff-Ferrari, H. A., Vellas, B., Rizzoli, R., Kressig, R. W., da Silva, J. A. P., Blauth, M., Felson, D. T., McCloskey, E. V., Watzl, B., Hofbauer, L. C., et al. (2020) · JAMA · doi:10.1001/jama.2020.16909 · Cited by 353
Self-citationGoldman, D. P., Cutler, D., Rowe, J. W., Michaud, P.-C., Sullivan, J., Peneva, D., & Olshansky, S. J. (2013) · Health Affairs · doi:10.1377/hlthaff.2013.0052 · Cited by 274
The economic value of targeting aging
Scott, A. J., Ellison, M., & Sinclair, D. A. (2021) · Nature Aging · doi:10.1038/s43587-021-00080-0 · Cited by 267
Sierra, F. (2016) · Cold Spring Harbor Perspectives in Medicine · doi:10.1101/cshperspect.a025163 · Cited by 226
Socioeconomic position, lifestyle habits and biomarkers of epigenetic aging: a multi-cohort analysis
Fiorito, G., the BIOS Consortium, the Lifepath consortium, McCrory, C., Robinson, O., Carmeli, C., Rosales, C. O., Zhang, Y., Colicino, E., Dugué, P.-A., et al. (2019) · Aging · doi:10.18632/aging.101900 · Cited by 219
Waziry, R., Ryan, C. P., Corcoran, D. L., Huffman, K. M., Kobor, M. S., Kothari, M., Graf, G. H., Kraus, V. B., Kraus, W. E., Lin, D. T. S., et al. (2023) · Nature Aging · doi:10.1038/s43587-022-00357-y · Cited by 217
Self-citationDNA methylation GrimAge version 2
Lu, A. T., Binder, A. M., Zhang, J., Yan, Q., Reiner, A. P., Cox, S. R., Corley, J., Harris, S. E., Kuo, P.-L., Moore, A. Z., et al. (2022) · Aging · doi:10.18632/aging.204434 · Cited by 216
Self-citationPatterns of Reliability: Assessing the Reproducibility and Integrity of DNA Methylation Measurement
Sugden, K., Hannon, E. J., Arseneault, L., Belsky, D. W., Corcoran, D. L., Fisher, H. L., Houts, R. M., Kandaswamy, R., Moffitt, T. E., Poulton, R., et al. (2020) · Patterns · doi:10.1016/j.patter.2020.100014 · Cited by 151
Self-citationLee, H., Barraza‐Villarreal, A., Hernández‐Vargas, H., Sly, P. D., Biessy, C., Ramakrishnan, U., Romieu, I., & Herceg, Z. (2013) · American Journal of Clinical Nutrition · doi:10.3945/ajcn.112.052241 · Cited by 149
Sun, Q., Townsend, M. K., Okereke, O. I., Franco, O. H., Hu, F. B., & Grodstein, F. (2009) · BMJ · doi:10.1136/bmj.b3796 · Cited by 115
Chen, L., Dong, Y., Bhagatwala, J., Raed, A., Huang, Y., & Zhu, H. (2019) · The Journals of Gerontology: Series A · doi:10.1093/gerona/gly223 · Cited by 106
DNAmFitAge: biological age indicator incorporating physical fitness
McGreevy, K. M., Radak, Z. O., Torma, F., Jókai, M., Lu, A. T.-H., Belsky, D. W., Binder, A. M., Marioni, R. E., Ferrucci, L., Pośpiech, E., et al. (2023) · Aging · doi:10.18632/aging.204538 · Cited by 105
Self-citationBelsky, D. W. (2018) · American Journal of Epidemiology · doi:10.1093/aje/kwy060 · Cited by 104
Self-citationKresovich, J. K., Garval, E. L., Lopez, A. M. M., Xu, Z., Niehoff, N. M., White, A. J., Sandler, D. P., & Taylor, J. A. (2020) · American Journal of Epidemiology · doi:10.1093/aje/kwaa251 · Cited by 103
Epigenetic changes in blood leukocytes following an omega-3 fatty acid supplementation
Tremblay, B. L., Guénard, F., Rudkowska, I., Lemieux, S., Couture, P., & Vohl, M. (2017) · Clinical Epigenetics · doi:10.1186/s13148-017-0345-3 · Cited by 99
Assessment of Epigenetic Clocks as Biomarkers of Aging in Basic and Population Research
Levine, M. E. (2020) · The Journals of Gerontology: Series A · doi:10.1093/gerona/glaa021 · Cited by 99
Waziry, R., Ryan, C. P., Corcoran, D. L., Huffman, K. M., Kobor, M. S., Kothari, M., Graf, G. H., Kraus, V. B., Kraus, W. E., Lin, D. T. S., et al. (2023) · Nature Aging · doi:10.1038/s43587-023-00432-y · Cited by 95
Self-citationAnalysis of Epigenetic Age Acceleration and Healthy Longevity Among Older US Women
Jain, P., Binder, A. M., Chen, B. H., Parada, H., Gallo, L. C., Alcaraz, J. E., Horvath, S., Bhatti, P., Whitsel, E. A., Jordahl, K. M., et al. (2022) · JAMA Network Open · doi:10.1001/jamanetworkopen.2022.23285 · Cited by 78
Self-citationLeisure-time physical activity and DNA methylation age—a twin study
Sillanpää, E., Ollikainen, M., Kaprio, J. A., Wang, X., Leskinen, T., Kujala, U. M., & Törmäkangas, T. (2019) · Clinical Epigenetics · doi:10.1186/s13148-019-0613-5 · Cited by 70
Karimi, M., Vedin, I., Freund‐Levi, Y., Basun, H., Irving, G. F., Eriksdotter, M., Wahlund, L., Schultzberg, M., Hjorth, E., Cederholm, T., et al. (2017) · American Journal of Clinical Nutrition · doi:10.3945/ajcn.117.155648 · Cited by 68
Leisure-Time and Occupational Physical Activity Associates Differently with Epigenetic Aging
Kankaanpää, A., Tolvanen, A. J., Bollepalli, S., Leskinen, T., Kujala, U. M., Kaprio, J. A., Ollikainen, M., & Sillanpää, E. (2020) · Medicine & Science in Sports & Exercise · doi:10.1249/mss.0000000000002498 · Cited by 68
Bischoff-Ferrari, H. A., Molino, C. D. G. R. C., Rival, S., Vellas, B. J., Rizzoli, R., Kressig, R. W., Kanis, J. А., Manson, J. E., Dawson-Hughes, B. F., Orav, E. J., et al. (2020) · Contemporary Clinical Trials · doi:10.1016/j.cct.2020.106124 · Cited by 59
Self-citationon behalf of the Seniors USP Team, Galé, C. R., Marioni, R. E., Čukić, I., CHASTIN, S. F. M., Dall, P., Dontje, M. L., Skelton, D. A., & Deary, I. J. (2018) · Clinical Epigenetics · doi:10.1186/s13148-017-0438-z · Cited by 58
Vitamin D supplementation is associated with slower epigenetic aging
Vetter, V. M., Sommerer, Y., Kalies, C. H., Spira, D., Bertram, L., & Demuth, I. (2022) · GeroScience · doi:10.1007/s11357-022-00581-9 · Cited by 55
Ruiz‐García, A., Pallarés‐Carratalá, V., Turégano-Yedro, M., Torres, F., Sapena, V., Martín-Gorgojo, A., & Martin-Moreno, J. M. (2023) · Nutrients · doi:10.3390/nu15081810 · Cited by 53
Parsons, S. D., & McCormick, E. M. (2024) · Developmental Cognitive Neuroscience · doi:10.1016/j.dcn.2024.101353 · Cited by 51
Gagesch, M., Wieczorek, M., Vellas, B. J., Kressig, R. W., Rizzoli, R., Kanis, J., Willett, W. C., Egli, A., Lang, W., Orav, E. J., et al. (2022) · The Journal of Frailty & Aging · doi:10.14283/jfa.2022.48 · Cited by 46
Self-citationSpartano, N. L., Wang, R., Yang, Q., Chernofsky, A., Murabito, J. M., Vasan, R. S., Levy, D. A., Beiser, A., & Seshadri, S. S. (2022) · Medicine & Science in Sports & Exercise · doi:10.1249/mss.0000000000003041 · Cited by 44
Bischoff-Ferrari, H. A., Freystaetter, G., Vellas, B. J., Dawson‐Hughes, B., Kressig, R. W., Kanis, J. А., Willett, W. C., Manson, J. E., Rizzoli, R., Theiler, R., et al. (2022) · American Journal of Clinical Nutrition · doi:10.1093/ajcn/nqac022 · Cited by 40
Self-citationBischoff-Ferrari, H. A., Willett, W. C., Manson, J. E., Dawson-Hughes, B. F., Manz, M. G., Theiler, R., Braendle, K., Vellas, B. J., Rizzoli, R., Kressig, R. W., et al. (2022) · Frontiers in Aging · doi:10.3389/fragi.2022.852643 · Cited by 37
Self-citationTesting the Geroscience Hypothesis: Early Days
Kritchevsky, S. B., & Justice, J. N. (2020) · The Journals of Gerontology: Series A · doi:10.1093/gerona/glz267 · Cited by 33
Epigenetic age oscillates during the day
Koncevičius, K., Nair, A., Šveikauskaitė, A., Šeštokaitė, A., Kazlauskaitė, A., Dulskas, A., & Petronis, A. (2024) · Aging Cell · doi:10.1111/acel.14170 · Cited by 33
Schietzel, S., Chocano-Bedoya, P. O., Sadlon, A., Gagesch, M., Willett, W. C., Orav, E. J., Kressig, R. W., Vellas, B. J., Rizzoli, R., da Silva, J. A. P., et al. (2022) · BMC Geriatrics · doi:10.1186/s12877-022-02755-8 · Cited by 26
Self-citationFrankhouser, D. E., Steck, S., Sovic, M. G., Belury, M. A., Wang, Q., Clinton, S. K., Bundschuh, R. A., Yan, P. S., & Yee, L. D. (2021) · The Journal of Nutritional Biochemistry · doi:10.1016/j.jnutbio.2021.108839 · Cited by 25
Yu, F., Qi, S., Ji, Y., Wang, X., Fang, S., & Cao, R. (2022) · Medicine · doi:10.1097/md.0000000000029556 · Cited by 23
Luo, S., Hou, H., Wang, Y., Li, Y., Zhang, L., Zhang, H., Jin, Q., Wu, G., & Wang, X. (2023) · Food & Function · doi:10.1039/d3fo02522e · Cited by 22
Markozannes, G., Ntzani, E. E., Tsapas, A., Mantzoros, C. S., Tsiara, S., Xanthos, T., Karpettas, N., Patrikios, I., & Rizos, E. C. (2022) · Clinical Nutrition · doi:10.1016/j.clnu.2022.02.022 · Cited by 16
Bischoff-Ferrari, H. A., Vellas, B. J., Rizzoli, R., Kressig, R. W., da Silva, J. A. P., Blauth, M., Felson, D. T., McCloskey, E. V., Watzl, B., Hofbauer, L. C., et al. (2020) · Archive ouverte UNIGE (University of Geneva) · Cited by 14
Self-citationXue, Q., Zhu, H., Ya, R., & Huang, H. (2023) · Reviews in Cardiovascular Medicine · doi:10.31083/j.rcm2401024 · Cited by 13
It is Time to Embrace 21st-Century Medicine
Kaeberlein, M. (2019) · Public Policy & Aging Report · doi:10.1093/ppar/prz022 · Cited by 8
Xie, L., Zhen, P., Wei, Q., Yu, F., Song, S., & Tong, J. (2021) · Europe PMC (PubMed Central) · Cited by 7
Schietzel, S., Chocano-Bedoya, P. O., Sadlon, A., Gagesch, M., Willett, W. C., Orav, E. J., Kressig, R. W., Vellas, B. J., Rizzoli, R., da Silva, J. A. P., et al. (2021) · Research Square · doi:10.21203/rs.3.rs-923536/v1 · Cited by 3
Self-citationSchmidt-Erfurth, U. M., & Kohnen, T. (2018) · Springer eBooks · doi:10.1007/978-3-540-69000-9_101287 · Cited by 1
Cited by
Sorted by citations
Immunosenescence and inflammaging: Mechanisms and modulation through diet and lifestyle
Müller, L., & Benedetto, S. D. (2025) · Frontiers in Immunology · doi:10.3389/fimmu.2025.1708280 · Cited by 51
Tero-Vescan, A., Degens, H., Matsakas, A., Ștefănescu, R., Ősz, B. E., & Slevin, M. (2025) · Pharmaceuticals · doi:10.3390/ph18081222 · Cited by 44
Epigenetic Regulation of Aging and its Rejuvenation
An, Y., Wang, Q., Gao, K., Zhang, C., Ouyang, Y., Li, R., Zhou, M., Wu, T., Zhou, L., Xie, Z., et al. (2025) · MedComm · doi:10.1002/mco2.70369 · Cited by 47
Cardiovascular Aging and Exercise: Implications for Heart Failure Prevention and Management
Subramanian, V., Tucker, W. J., Peters, A. E., Upadhya, B., Kitzman, D. W., & Pandey, A. (2025) · Circulation Research · doi:10.1161/circresaha.125.325531 · Cited by 34
Johnson, A. A., & Shokhirev, M. N. (2025) · Biogerontology · doi:10.1007/s10522-025-10265-4 · Cited by 30
Metadata
- Authors
- Bischoff-Ferrari, H. A., Gängler, S., Wieczorek, M., Belsky, D. W., Ryan, J., Kressig, R. W., Stähelin, H. B., Theiler, R., Dawson-Hughes, B., Rizzoli, R., Vellas, B., Rouch, L., Guyonnet, S., Egli, A., Orav, E. J., Willett, W., & Horvath, S.
- Affiliations
- University of Basel (CH)
- Columbia University (US)
- Monash University (AU)
- University of Zurich (CH)
- University of Geneva (CH)
- Université Toulouse III - Paul Sabatier (FR)
- Brigham and Women's Hospital (US)
- Harvard University (US)
- Altos Labs (US)
- Corresponding author
- Bischoff-Ferrari, Heike A.
- ORCID
- Venue
- Nature Aging
- Published
- 2025-02-03
- Volume
- 5
- Issue
- 3
- Pages
- 376-385
- ISSN
- 2662-8465 (ISSN-L)
- PMC
- PMC11922767
- OpenAlex
- W4407088006
- Cited by
- 140
- References
- 67
- Citations by year
- 2026: 90 · 2025: 50
- FWCI
- 42.09
- Type
- journal article
- Language
- en
- Open access
- hybrid
- doi.org
- Locations
- Nature Aging (publishedVersion, cc-by)
- PubMed Central (publishedVersion, cc-by)
- PubMed (publishedVersion)
- HAL (submittedVersion, cc-by)
- Zurich Open Repository and Archive (University of Zurich) (submittedVersion, cc-by)
- Zurich Open Repository and Archive (University of Zurich)
- Funders
- National Science Foundation
- Pfizer
- European Commission (278588)
- Agence Nationale de la Recherche (ANR-23-IAHU-0011)
- Schweizerischer Nationalfonds zur Förderung der Wissenschaftlichen Forschung (204452)
- Universität Zürich
- Nestec
- Topics
- Life Sciences › Biochemistry, Genetics and Molecular Biology › Molecular Biology › Epigenetics and DNA Methylation
- Life Sciences › Biochemistry, Genetics and Molecular Biology › Aging › Genetics, Aging, and Longevity in Model Organisms
- Life Sciences › Biochemistry, Genetics and Molecular Biology › Cell Biology › Telomeres, Telomerase, and Senescence
- Keywords
- biological aging, DNA methylation clocks, vitamin D supplementation, omega-3 fatty acids, home-based exercise, PhenoAge, GrimAge, DunedinPACE, additive effects, older adults, epigenetic aging
- MeSH terms
- Aged, Aged, 80 and over, Aging, Female, Humans, Male, Middle Aged, Vitamin D, Exercise, Fatty Acids, Omega-3, DNA Methylation, Dietary Supplements
About these checks
Registry, retraction, Cites and statistics results are computed, not judged, with one exception: a printed reference that no index lists is read once by a model before it counts as a citation error. Claims are extracted by a model and kept only when their quote appears verbatim in the text; each cited source is then checked, with a model’s help, for whether it says what the claim relies on. Those verdicts can be wrong — read the claim’s quote and the cited source before relying on one.
Statistics and arithmetic are recomputed, not judged.
Confidence bands are shown only for fields calibrated on our annotated test set. None is calibrated yet, so no band is shown.
What counts as a claim ›How we measure confidence ›How we check this ›
Are you an author, or do you see a problem with this page? Request a review
