

The DOI matches its Crossref record; 44 of the 44 references it cites were found in a registry or an index.
Bifidobacteria exhibit social behavior through carbohydrate resource sharing in the gut
Open accessAbstract
Bifidobacteria are common and frequently dominant members of the gut microbiota of many animals, including mammals and insects. Carbohydrates are considered key carbon sources for the gut microbiota, imposing strong selective pressure on the complex microbial consortium of the gut. Despite its importance, the genetic traits that facilitate carbohydrate utilization by gut microbiota members are still poorly characterized. Here, genome analyses of 47 representative Bifidobacterium (sub)species revealed the genes predicted to be required for the degradation and internalization of a wide range of carbohydrates, outnumbering those found in many other gut microbiota members. The glycan-degrading abilities of bifidobacteria are believed to reflect available carbon sources in the mammalian gut. Furthermore, transcriptome profiling of bifidobacterial genomes supported the involvement of various chromosomal loci in glycan metabolism. The widespread occurrence of bifidobacterial saccharolytic features is in line with metagenomic and metatranscriptomic datasets obtained from human adult/infant faecal samples, thereby supporting the notion that bifidobacteria expand the human glycobiome. This study also underscores the hypothesis of saccharidic resource sharing among bifidobacteria through species-specific metabolic specialization and cross feeding, thereby forging trophic relationships between members of the gut microbiota.
Overview
The claims and statistics of this paper haven’t been checked yet.
Run the check — free, no account needed. It reads the open-access text and checks the sources it cites.
Integrity signals
Registry
Cites
Statistics
Figures
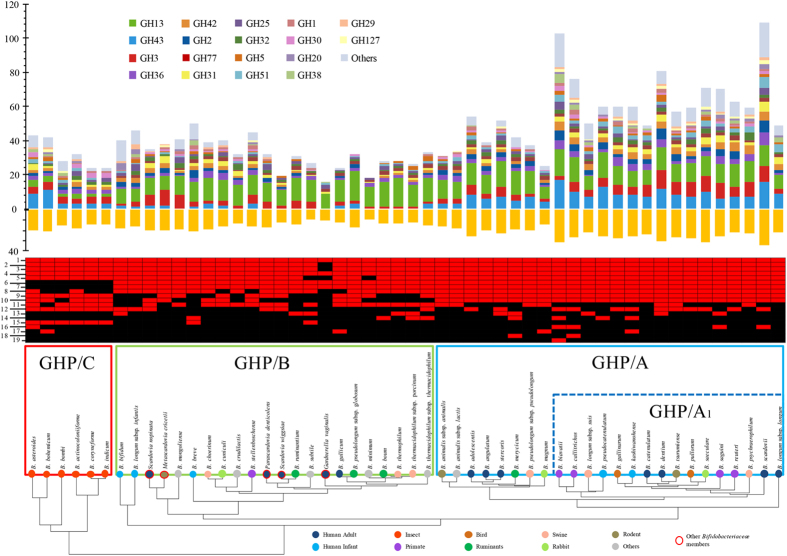
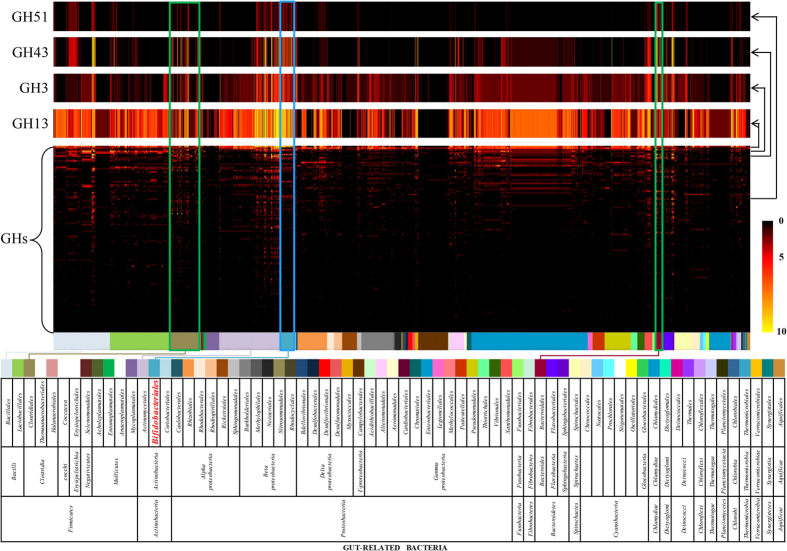
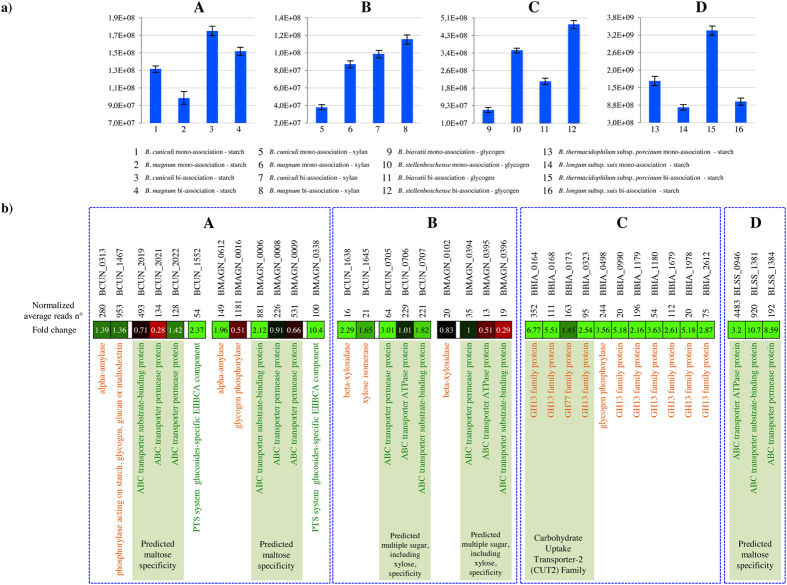
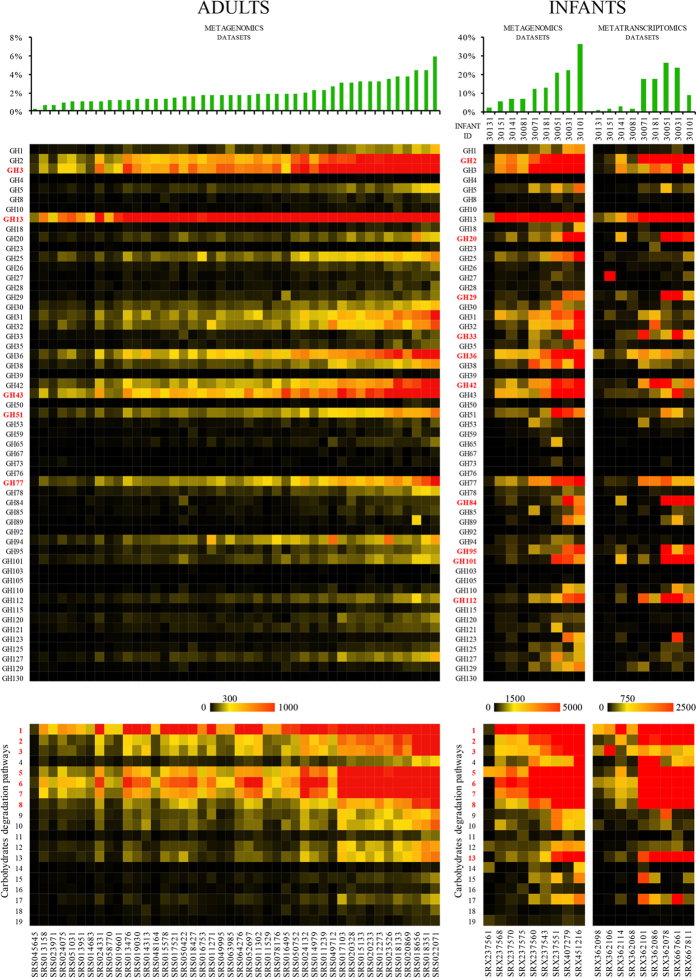
Verification
Claims the paper makes
The claims and statistics of this paper haven’t been checked yet.
Run the check — free, no account needed. It reads the open-access text and checks the sources it cites.
Claims other papers make about this one
Each is checked against this paper’s own text: does it say what the citing paper says it does?
In the citing paper
“as gut commensals work together to fully degrade food within the intestine [125, 126].”
From Role of the gut microbiota in nutrient competition and protection against intestinal pathogen colonization (2023) · cites this paper as [126]
Self-check
Percentages, sums and reported differences re-computed from the paper’s own numbers.
The self-check needs the paper’s full text.
Citations
Cites
Bradford, M. M. (1976) · Analytical Biochemistry · doi:10.1016/0003-2697(76)90527-3 · Cited by 255,302
Molecular Cloning: A Laboratory Manual
Sambrook, J., Fritsch, E., & Maniatis, T. (1989) · UCLA - Biblioteca de Ciencias de la Salud · Cited by 133,589
Moderated estimation of fold change and dispersion for RNA-seq data with DESeq2
Love, M. I., Huber, W., & Anders, S. (2014) · Genome Biology · doi:10.1186/s13059-014-0550-8 · Cited by 95,106
The Sequence Alignment/Map format and SAMtools
Li, H., Handsaker, B., Wysoker, A., Fennell, T., Ruan, J., Homer, N., Marth, G., Abecasis, G., Durbin, R., & 1000 Genome Project Data Processing Subgroup (2009) · Bioinformatics · doi:10.1093/bioinformatics/btp352 · Cited by 62,041
Fast and accurate short read alignment with Burrows-Wheeler transform
Li, H., & Durbin, R. (2009) · Bioinformatics · doi:10.1093/bioinformatics/btp324 · Cited by 58,607
Fast gapped-read alignment with Bowtie 2
Langmead, B., & Salzberg, S. L. (2012) · Nature Methods · doi:10.1038/nmeth.1923 · Cited by 56,400
BEDTools: a flexible suite of utilities for comparing genomic features
Quinlan, A. R., & Hall, I. M. (2010) · Bioinformatics · doi:10.1093/bioinformatics/btq033 · Cited by 27,437
Structure, function and diversity of the healthy human microbiome
The Human Microbiome Project Consortium (2012) · Nature · doi:10.1038/nature11234 · Cited by 11,726
Ashburner, M. (1989) · Cold Spring Harbor Laboratory eBooks · Cited by 6,756
The carbohydrate-active enzymes database (CAZy) in 2013
Lombard, V., Ramulu, H. G., Drula, É., Coutinho, P. M., & Henrissat, B. (2013) · Nucleic Acids Research · doi:10.1093/nar/gkt1178 · Cited by 6,452
Metagenomic Analysis of the Human Distal Gut Microbiome
Gill, S. R., Pop, M., DeBoy, R. T., Eckburg, P. B., Turnbaugh, P. J., Samuel, B. S., Gordon, J. I., Relman, D. A., Fraser-Liggett, C. M., & Nelson, K. E. (2006) · Science · doi:10.1126/science.1124234 · Cited by 4,699
Phylogenomics resolves the timing and pattern of insect evolution
Misof, B., Liu, S., Meusemann, K., Peters, R. S., Donath, A., Mayer, C., Frandsen, P. B., Ware, J., Flouri, T., Beutel, R. G., et al. (2014) · Science · doi:10.1126/science.1257570 · Cited by 2,694
Metagenomic microbial community profiling using unique clade-specific marker genes
Segata, N., Waldron, L., Ballarini, A., Narasimhan, V., Jousson, O., & Huttenhower, C. (2012) · Nature Methods · doi:10.1038/nmeth.2066 · Cited by 1,776
Self-citationThe abundance and variety of carbohydrate-active enzymes in the human gut microbiota
Kaoutari, A. E., Armougom, F., Gordon, J. I., Raoult, D., & Henrissat, B. (2013) · Nature Reviews Microbiology · doi:10.1038/nrmicro3050 · Cited by 1,683
How glycan metabolism shapes the human gut microbiota
Koropatkin, N. M., Cameron, E. A., & Martens, E. C. (2012) · Nature Reviews Microbiology · doi:10.1038/nrmicro2746 · Cited by 1,419
Sela, D. A., Chapman, J., Adeuya, A., Kim, J., Chen, F., Whitehead, T. R., Lapidus, A. L., Rokhsar, D. S., Lebrilla, C. B., German, J. B., et al. (2008) · Proceedings of the National Academy of Sciences · doi:10.1073/pnas.0809584105 · Cited by 895
Carbohydrate metabolism in Bifidobacteria
Pokusaeva, K., Fitzgerald, G. F., & van Sinderen, D. (2011) · Genes & Nutrition · doi:10.1007/s12263-010-0206-6 · Cited by 890
Pathway Tools version 13.0: integrated software for pathway/genome informatics and systems biology
Karp, P. D., Paley, S. M., Krummenacker, M., Latendresse, M., Dale, J. M., Lee, T. J., Kaipa, P., Gilham, F., Spaulding, A., Popescu, L., et al. (2010) · Briefings in Bioinformatics · doi:10.1093/bib/bbp043 · Cited by 694
eggNOG v4.0: nested orthology inference across 3686 organisms
Powell, S., Forslund, K., Szklarczyk, D., Trachana, K., Roth, A., Huerta-Cepas, J., Gabaldón, T., Rattei, T., Creevey, C., Kuhn, M., et al. (2014) · Nucleic Acids Research · doi:10.1093/nar/gkt1253 · Cited by 652
Diversity of Bifidobacteria within the Infant Gut Microbiota
Turroni, F., Peano, C., Pass, D. A., Foroni, E., Severgnini, M., Claesson, M. J., Kerr, C., Hourihane, J., Murray, D., Fuligni, F., et al. (2012) · PLoS ONE · doi:10.1371/journal.pone.0036957 · Cited by 647
Self-citationSUPERFAMILY—sophisticated comparative genomics, data mining, visualization and phylogeny
Wilson, D. A., Pethica, R., Zhou, Y., Talbot, C. C., Vogel, C., Madera, M., Chothia, C., & Gough, J. (2008) · Nucleic Acids Research · doi:10.1093/nar/gkn762 · Cited by 493
The Biochemistry of Sugars and Polysaccharides in Insects
Wyatt, G. R. (1967) · Advances in insect physiology · doi:10.1016/s0065-2806(08)60210-6 · Cited by 482
Genome-scale analyses of health-promoting bacteria: probiogenomics
Ventura, M., O'Flaherty, S., Claesson, M. J., Turroni, F., Klaenhammer, T. R., van Sinderen, D., & O'Toole, P. W. (2009) · Nature Reviews Microbiology · doi:10.1038/nrmicro2047 · Cited by 471
Self-citationGenomic and Metabolic Studies of the Impact of Probiotics on a Model Gut Symbiont and Host
Sonnenburg, J. L., Chen, C. T. L., & Gordon, J. I. (2006) · PLoS Biology · doi:10.1371/journal.pbio.0040413 · Cited by 423
Turroni, F., Bottacini, F., Foroni, E., Mulder, I., Kim, J.-H., Zomer, A., Sánchez, B., Bidossi, A., Ferrarini, A., Giubellini, V., et al. (2010) · Proceedings of the National Academy of Sciences · doi:10.1073/pnas.1011100107 · Cited by 364
Self-citationRennie, E. A., & Scheller, H. V. (2013) · Current Opinion in Biotechnology · doi:10.1016/j.copbio.2013.11.013 · Cited by 321
Assessing the Fecal Microbiota: An Optimized Ion Torrent 16S rRNA Gene-Based Analysis Protocol
Milani, C., Hevia, A., Foroni, E., Duranti, S., Turroni, F., Lugli, G. A., Sánchez, B., Martín, R., Gueimonde, M., van Sinderen, D., et al. (2013) · PLoS ONE · doi:10.1371/journal.pone.0068739 · Cited by 314
Self-citationExploring the Diversity of the Bifidobacterial Population in the Human Intestinal Tract
Turroni, F., Foroni, E., Pizzetti, P., Giubellini, V., Ribbera, A., Merusi, P., Cagnasso, P., Bizzarri, B., de'Angelis, G. L., Shanahan, F., et al. (2009) · Applied and Environmental Microbiology · doi:10.1128/aem.02216-08 · Cited by 311
Self-citationSaccharide breakdown and fermentation by the honey bee gut microbiome
Lee, F. J., Rusch, D. B., Stewart, F. J., Mattila, H. R., & Newton, I. L. G. (2014) · Environmental Microbiology · doi:10.1111/1462-2920.12526 · Cited by 290
The effects of dietary fibre addition on the quality of common cereal products
Foschia, M., Peressini, D., Sensidoni, A., & Brennan, C. S. (2013) · Journal of Cereal Science · doi:10.1016/j.jcs.2013.05.010 · Cited by 276
Genomic Encyclopedia of Type Strains of the Genus Bifidobacterium
Milani, C., Lugli, G. A., Duranti, S., Turroni, F., Bottacini, F., Mangifesta, M., Sánchez, B., Viappiani, A., Mancabelli, L., Taminiau, B., et al. (2014) · Applied and Environmental Microbiology · doi:10.1128/aem.02308-14 · Cited by 251
Self-citationHost–microbe interactions that facilitate gut colonization by commensal bifidobacteria
Ventura, M., Turroni, F., Motherway, M. O., MacSharry, J. A., & van Sinderen, D. (2012) · Trends in Microbiology · doi:10.1016/j.tim.2012.07.002 · Cited by 197
Self-citationEgan, M., Motherway, M. O., Kilcoyne, M., Kane, M., Joshi, L., Ventura, M., & van Sinderen, D. (2014) · BMC Microbiology · doi:10.1186/s12866-014-0282-7 · Cited by 193
Self-citationHuman milk and related oligosaccharides as prebiotics
Barile, D., & Rastall, R. A. (2013) · Current Opinion in Biotechnology · doi:10.1016/j.copbio.2013.01.008 · Cited by 193
Kiyohara, M., Tanigawa, K., Chaiwangsri, T., Katayama, T., Ashida, H., & Yamamoto, K. (2010) · Glycobiology · doi:10.1093/glycob/cwq175 · Cited by 146
Mariño, K. V., Lane, J. A., Abrahams, J. L., Struwe, W. B., Harvey, D. J., Marotta, M., Hickey, R. M., & Rudd, P. M. (2011) · Glycobiology · doi:10.1093/glycob/cwr067 · Cited by 143
Self-citationInvestigation of the Evolutionary Development of the Genus Bifidobacterium by Comparative Genomics
Lugli, G. A., Milani, C., Turroni, F., Duranti, S., Ferrario, C., Viappiani, A., Mancabelli, L., Mangifesta, M., Taminiau, B., Delcenserie, V., et al. (2014) · Applied and Environmental Microbiology · doi:10.1128/aem.02004-14 · Cited by 131
Self-citationGlycogen and Maltose Utilization by Escherichia coli O157:H7 in the Mouse Intestine
Jones, S. A., Jørgensen, M. J., Chowdhury, F. Z., Rodgers, R., Hartline, J., Leatham, M. P., Struve, C., Krogfelt, K. A., Cohen, P. S., & Conway, T. (2008) · Infection and Immunity · doi:10.1128/iai.00096-08 · Cited by 131
Bifidobacterial Enzymes Involved in the Metabolism of Human Milk Oligosaccharides
Kitaoka, M. (2012) · Advances in Nutrition · doi:10.3945/an.111.001420 · Cited by 120
Ventura, M., Canchaya, C. A., Fitzgerald, G. F., Gupta, R. S., & van Sinderen, D. (2006) · Antonie van Leeuwenhoek · doi:10.1007/s10482-006-9122-6 · Cited by 112
Self-citationGlycogen with short average chain length enhances bacterial durability
Wang, L., & Wise, M. J. (2011) · Die Naturwissenschaften · doi:10.1007/s00114-011-0832-x · Cited by 104
Goh, Y. J., & Klaenhammer, T. R. (2014) · Microbial Cell Factories · doi:10.1186/s12934-014-0094-3 · Cited by 104
Glycogen metabolism loss: a common marker of parasitic behaviour in bacteria?
Henrissat, B., Deleury, E., & Coutinho, P. M. (2002) · Trends in Genetics · doi:10.1016/s0168-9525(02)02734-8 · Cited by 101
Gross, A., Guy, O., Posmanik, R., Fine, P., & Nejidat, A. (2012) · Cited by 14
Cited by
Sorted by citations
Milani, C., Duranti, S., Bottacini, F., Casey, E., Turroni, F., Mahony, J., Belzer, C., Delgado Palacio, S., Arboleya Montes, S., Mancabelli, L., et al. (2017) · Microbiology and Molecular Biology Reviews · doi:10.1128/mmbr.00036-17 · Cited by 1,950
Self-citationBifidobacteria and Their Role as Members of the Human Gut Microbiota
O’Callaghan, A. A., & van Sinderen, D. (2016) · Frontiers in Microbiology · doi:10.3389/fmicb.2016.00925 · Cited by 1,160
Actinobacteria: A relevant minority for the maintenance of gut homeostasis
Binda, C., Lopetuso, L. R., Rizzatti, G., Gibiino, G., Cennamo, V., & Gasbarrini, A. (2018) · Digestive and Liver Disease · doi:10.1016/j.dld.2018.02.012 · Cited by 828
Fassarella, M., Blaak, E. E., Penders, J., Nauta, A., Smidt, H., & Zoetendal, E. G. (2020) · Gut · doi:10.1136/gutjnl-2020-321747 · Cited by 818
Ormerod, K. L., Wood, D., Lachner, N., Gellatly, S. L., Daly, J. N., Parsons, J. D., Dal’Molin, C. G. D. O., Palfreyman, R. W., Nielsen, L. K., Cooper, M. A., et al. (2016) · Microbiome · doi:10.1186/s40168-016-0181-2 · Cited by 691
Metadata
- Authors
- Milani, C., Lugli, G. A., Duranti, S., Turroni, F., Mancabelli, L., Ferrario, C., Mangifesta, M., Hevia, A., Viappiani, A., Scholz, M., Arioli, S., Sanchez, B., Lane, J., Ward, D. V., Hickey, R., Mora, D., Segata, N., Margolles, A., van Sinderen, D., & Ventura, M.
- Affiliations
- University of Parma (IT)
- National University of Ireland (IE)
- Consejo Superior de Investigaciones Científicas (ES)
- University of Trento (IT)
- Teagasc - The Irish Agriculture and Food Development Authority (IE)
- Broad Institute (US)
- University of Milan (IT)
- Corresponding author
- Ventura, Marco
- ORCID
- Venue
- Scientific Reports
- Published
- 2015-10-28
- Volume
- 5
- Issue
- 1
- Pages
- 15782-15782
- ISSN
- 2045-2322 (ISSN-L)
- PMC
- PMC4623478
- OpenAlex
- W2302783498
- Cited by
- 284
- References
- 44
- Citations by year
- 2026: 8 · 2025: 19 · 2024: 20 · 2023: 25 · 2022: 33 · 2021: 25 · 2020: 49 · 2019: 39 · 2018: 22 · 2017: 27 · 2016: 15 · 2015: 1
- FWCI
- 9.40
- Type
- journal article
- Language
- en
- Open access
- gold
- doi.org
- Locations
- Scientific Reports (publishedVersion, cc-by)
- Europe PMC (PubMed Central) (publishedVersion, cc-by)
- PubMed Central (publishedVersion, cc-by)
- PubMed (publishedVersion)
- Archivio Istituzionale della Ricerca (Universita Degli Studi Di Milano) (submittedVersion, other-oa)
- DIGITAL.CSIC (Spanish National Research Council (CSIC)) (submittedVersion, cc-by)
- Institutional Research Information System (Università degli Studi di Trento) (submittedVersion)
- Funders
- U.S. Department of Health and Human Services (HHSN272200900018C)
- European Commission (618833)
- Science Foundation Ireland (SFI/12/RC/, 12/RC/2273, 12/RC/, SFI/12/RC/2273., 08/SRC/B1393)
- Ministero dell’Istruzione, dell’Università e della Ricerca
- Fondazione Cassa Di Risparmio Di Trento E Rovereto
- Alimentary Glycoscience Research Cluster (08/SRC/B1393)
- National Institutes of Health (HHSN272200900018C)
- APC Microbiome Institute (SFI/12/RC/2273)
- National Institute of Allergy and Infectious Diseases (HHSN272200900018C)
- Topics
- Life Sciences › Biochemistry, Genetics and Molecular Biology › Molecular Biology › Gut microbiota and health
- Health Sciences › Nursing › Nutrition and Dietetics › Infant Nutrition and Health
- Life Sciences › Agricultural and Biological Sciences › Food Science › Probiotics and Fermented Foods
- Keywords
- Bifidobacterium, gut microbiota, carbohydrate utilization, glycan degradation, cross-feeding, resource sharing, gene expression profiling, human faecal microbiota, insect gut microbiota, metabolic specialization
- MeSH terms
- Adult, Bifidobacterium, Carbohydrates, Feces, Humans, Infant, Gastrointestinal Tract, Carbohydrate Metabolism
About these checks
Registry, retraction, Cites and statistics results are computed, not judged, with one exception: a printed reference that no index lists is read once by a model before it counts as a citation error. Claims are extracted by a model and kept only when their quote appears verbatim in the text; each cited source is then checked, with a model’s help, for whether it says what the claim relies on. Those verdicts can be wrong — read the claim’s quote and the cited source before relying on one.
Statistics and arithmetic are recomputed, not judged.
Confidence bands are shown only for fields calibrated on our annotated test set. None is calibrated yet, so no band is shown.
What counts as a claim ›How we measure confidence ›How we check this ›
Are you an author, or do you see a problem with this page? Request a review
