

The DOI matches its Crossref record; 41 of the 41 references it cites were found in a registry or an index.
Skin-resident memory CD4+ T cells enhance protection against Leishmania major infection
Open accessAbstract
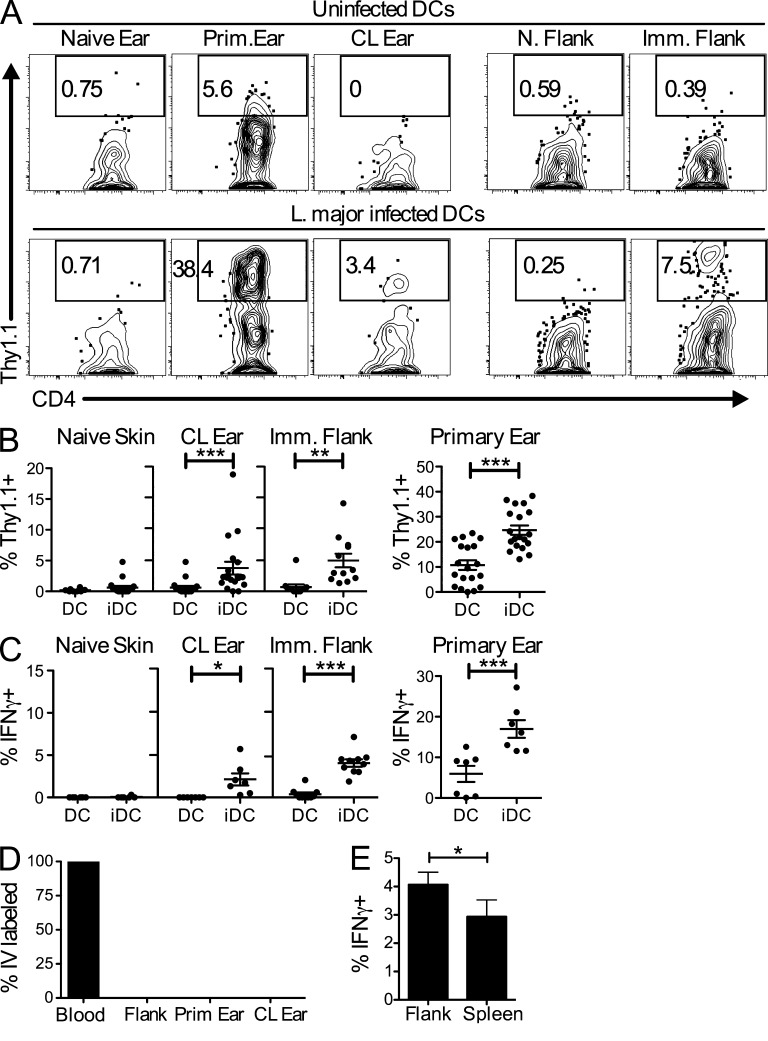
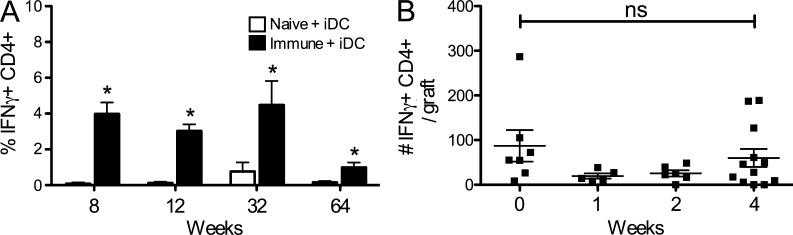
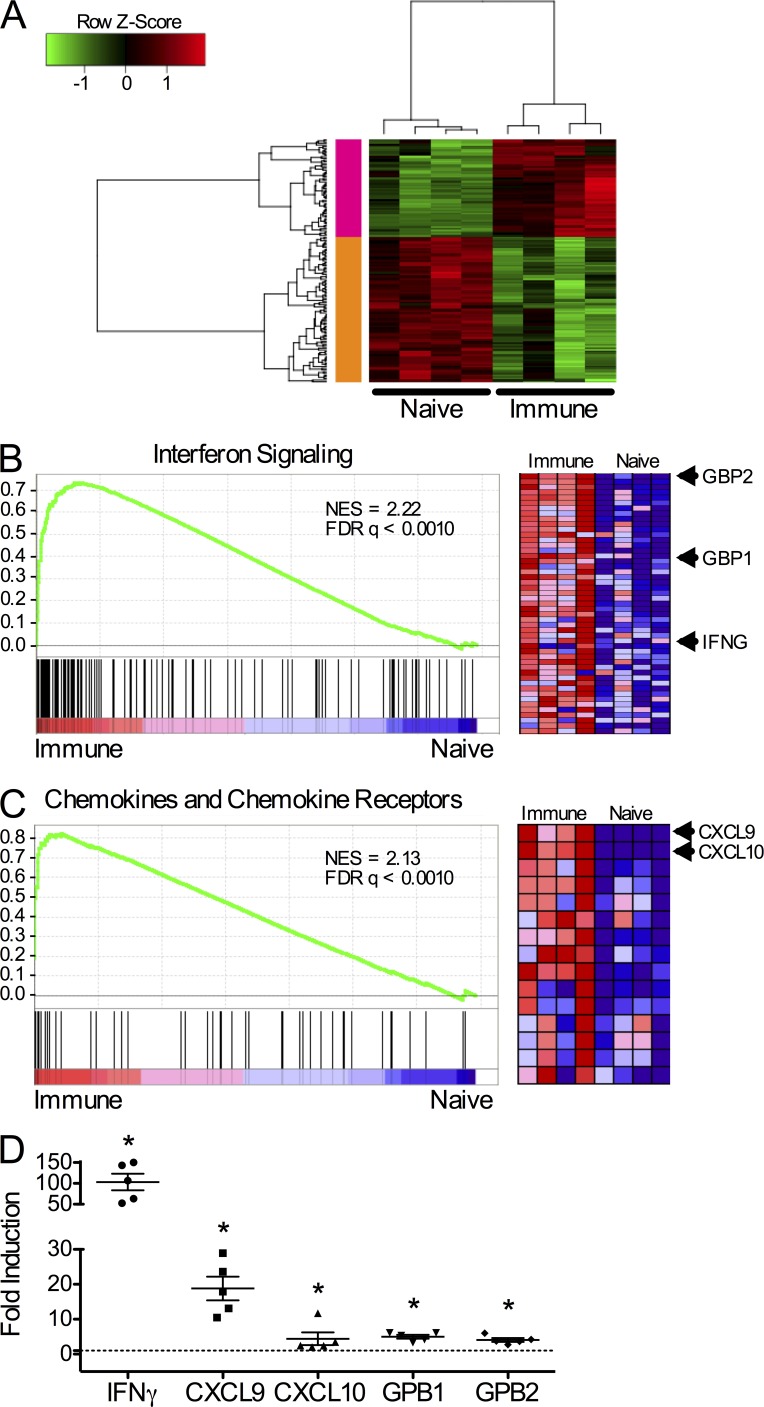
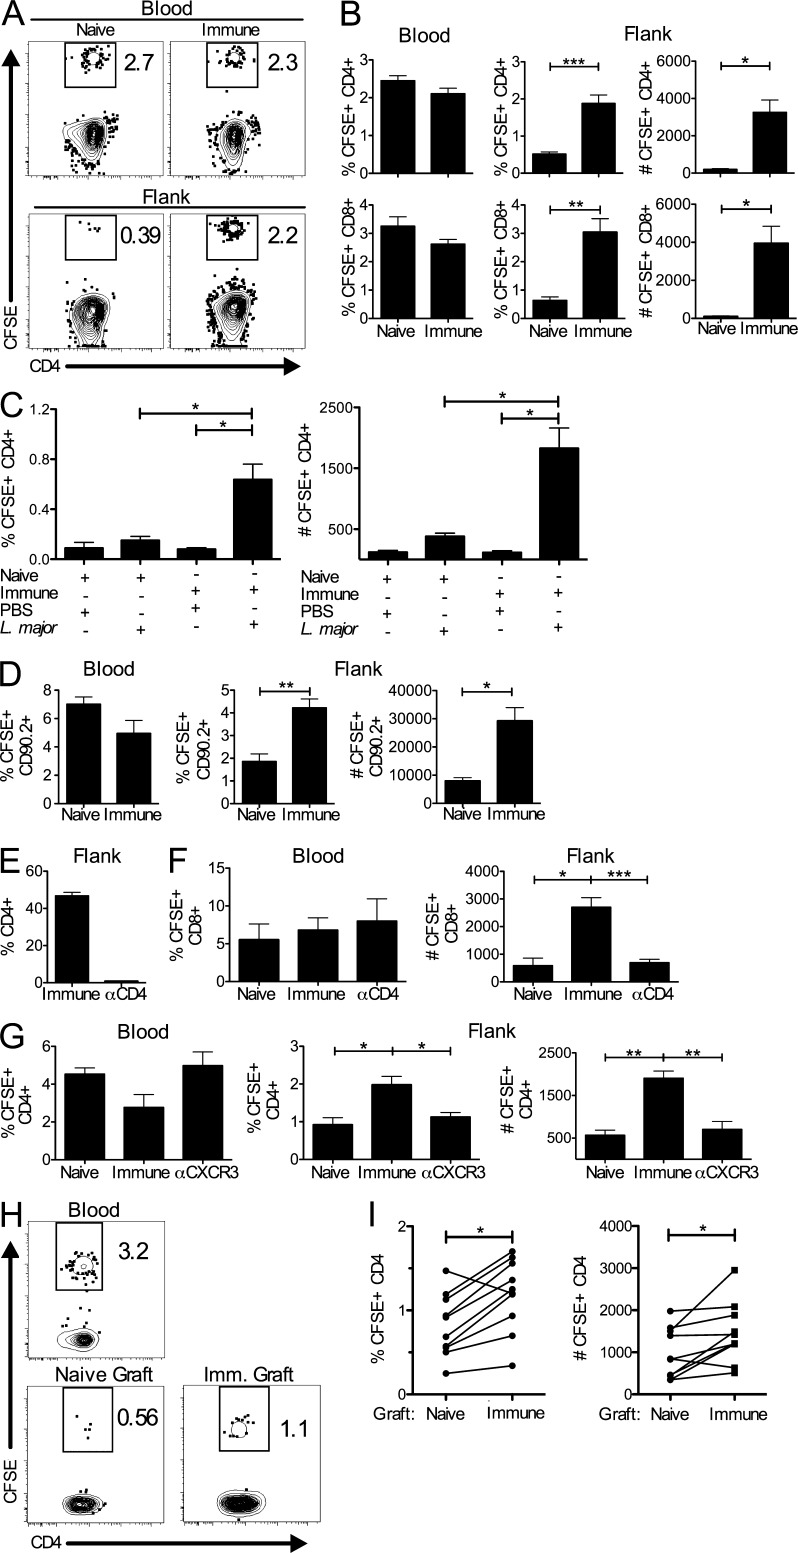
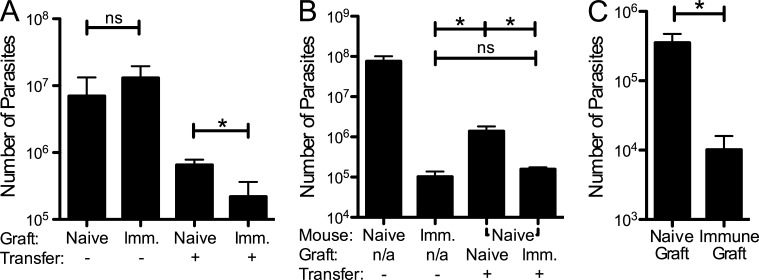
Leishmaniasis causes a significant disease burden worldwide. Although Leishmania-infected patients become refractory to reinfection after disease resolution, effective immune protection has not yet been achieved by human vaccines. Although circulating Leishmania-specific T cells are known to play a critical role in immunity, the role of memory T cells present in peripheral tissues has not been explored. Here, we identify a population of skin-resident Leishmania-specific memory CD4+ T cells. These cells produce IFN-γ and remain resident in the skin when transplanted by skin graft onto naive mice. They function to recruit circulating T cells to the skin in a CXCR3-dependent manner, resulting in better control of the parasites. Our findings are the first to demonstrate that CD4+ TRM cells form in response to a parasitic infection, and indicate that optimal protective immunity to Leishmania, and thus the success of a vaccine, may depend on generating both circulating and skin-resident memory T cells.
Overview
The claims and statistics of this paper haven’t been checked yet.
Run the check — free, no account needed. It reads the open-access text and checks the sources it cites.
Integrity signals
Registry
Cites
Statistics
Figures
Verification
Claims the paper makes
The claims and statistics of this paper haven’t been checked yet.
Run the check — free, no account needed. It reads the open-access text and checks the sources it cites.
Claims other papers make about this one
Each is checked against this paper’s own text: does it say what the citing paper says it does?
The cited source says what the claim attributes to it.
In the citing paper
“Th17 cells play a critical role in host defense against C. albicans [30–33,36], whereas Th1 cells protect the host against reinfection from HSV and L. major [34,35].”
From The Emerging Fungal Pathogen Candida auris Induces IFNγ to Colonize the Skin (2025) · cites this paper as [35]
The cited source says what the claim attributes to it.
In the citing paper
“Effector T cells play a critical role in the host’s defense during reinfection with C. albicans, Staphylococcus aureus, Leishmania major, and HSV [28,30–35].”
From The Emerging Fungal Pathogen Candida auris Induces IFNγ to Colonize the Skin (2025) · cites this paper as [35]
The check wasn’t confident either way, so it gives no verdict — never disputed.
In the citing paper
“Furthermore, previous findings from our laboratory [16] and others [35] suggest that other cell types, such as keratinocytes and NK cells, also express IL-17A and IFNγ, respectively.”
From The Emerging Fungal Pathogen Candida auris Induces IFNγ to Colonize the Skin (2025) · cites this paper as [35]
Experimental — accuracy not yet measured
Self-check
Percentages, sums and reported differences re-computed from the paper’s own numbers.
The self-check needs the paper’s full text.
Citations
Cites
Subramanian, A., Tamayo, P., Mootha, V. K., Mukherjee, S., Ebert, B. L., Gillette, M. A., Paulovich, A., Pomeroy, S. L., Golub, T. R., Lander, E. S., et al. (2005) · Proceedings of the National Academy of Sciences · doi:10.1073/pnas.0506580102 · Cited by 53,625
Preferential Localization of Effector Memory Cells in Nonlymphoid Tissue
Masopust, D., Vezys, V., Marzo, A. L., & Lefrançois, L. (2001) · Science · doi:10.1126/science.1058867 · Cited by 1,952 · cited 2×
“In addition to circulating memory T cells, an additional memory T cell subset resides in the tissues as resident memory T cells (TRM; Kim et al., 1999; Hogan et al., 2001a; Masopust et al., 2001; Clark et al., 2006; Gebhardt et al., 2009; Wakim et al., 2010; Hofmann and Pircher, 2011; Jiang et al., 2012; Mackay et al.…”
BackgroundCD4+CD25+ regulatory T cells control Leishmania major persistence and immunity
Belkaid, Y., Piccirillo, C. A., Méndez, S., Shevach, E. M., & Sacks, D. L. (2002) · Nature · doi:10.1038/nature01152 · Cited by 1,726
Gebhardt, T., Wakim, L. M., Eidsmo, L., Reading, P. C., Heath, W. R., & Carbone, F. R. (2009) · Nature Immunology · doi:10.1038/ni.1718 · Cited by 1,157
Skin infection generates non-migratory memory CD8+ TRM cells providing global skin immunity
Jiang, X., Clark, R. A., Liu, L., Wagers, A. J., Fuhlbrigge, R. C., & Kupper, T. S. (2012) · Nature · doi:10.1038/nature10851 · Cited by 883
Dutton, R. W., Bradley, L. M., & Swain, S. L. (1998) · Annual Review of Immunology · doi:10.1146/annurev.immunol.16.1.201 · Cited by 832
The Vast Majority of CLA+ T Cells Are Resident in Normal Skin
Clark, R. A., Chong, B., Mirchandani, N., Brinster, N. K., Yamanaka, K.-I., Dowgiert, R. K., & Kupper, T. S. (2006) · The Journal of Immunology · doi:10.4049/jimmunol.176.7.4431 · Cited by 796
Resident memory CD8 T cells trigger protective innate and adaptive immune responses
Schenkel, J. M., Fraser, K. A., Beura, L. K., Pauken, K. E., Vezys, V., & Masopust, D. (2014) · Science · doi:10.1126/science.1254536 · Cited by 731
Sensing and alarm function of resident memory CD8+ T cells
Schenkel, J., Fraser, K. A., Vezys, V., & Masopust, D. (2013) · Nature Immunology · doi:10.1038/ni.2568 · Cited by 648
Teijaro, J. R., Turner, D., Pham, Q., Wherry, E. J., Lefrançois, L., & Farber, D. L. (2011) · The Journal of Immunology · doi:10.4049/jimmunol.1102243 · Cited by 641
Cited by
Sorted by citations
Human T cell development, localization, and function throughout life
Kumar, B. V., Connors, T. J., & Farber, D. L. (2018) · Immunity · doi:10.1016/j.immuni.2018.01.007 · Cited by 1,257
Tissue-resident memory T cells: local specialists in immune defence
Mueller, S. N., & Mackay, L. K. (2016) · Nature Reviews Immunology · doi:10.1038/nri.2015.3 · Cited by 1,006
CD49a Expression Defines Tissue-Resident CD8 + T Cells Poised for Cytotoxic Function in Human Skin
Cheuk, S., Schlums, H., Gallais Sérézal, I., Martini, E., Chiang, S. C., Marquardt, N., Gibbs, A., Detlofsson, E., Introini, A., Forkel, M., et al. (2017) · Immunity · doi:10.1016/j.immuni.2017.01.009 · Cited by 678
The multifaceted role of CD4+ T cells in CD8+ T cell memory
Laidlaw, B. J., Craft, J. E., & Kaech, S. M. (2016) · Nature Reviews Immunology · doi:10.1038/nri.2015.10 · Cited by 657
Tissue-Resident T Cells and Other Resident Leukocytes
Masopust, D., & Soerens, A. G. (2019) · Annual Review of Immunology · doi:10.1146/annurev-immunol-042617-053214 · Cited by 608
Cutaneous leishmaniasis: Immune responses in protection and pathogenesis
Scott, P., & Novais, F. O. (2016) · Nature Reviews Immunology · doi:10.1038/nri.2016.72 · Cited by 591
Self-citationIn Vivo CD4 + T Cell Differentiation and Function: Revisiting the Th1/Th2 Paradigm
Ruterbusch, M., Pruner, K. B., Shehata, L., & Pepper, M. (2020) · Annual Review of Immunology · doi:10.1146/annurev-immunol-103019-085803 · Cited by 550
Understanding subset diversity in T cell memory
Jameson, S. C., & Masopust, D. (2018) · Immunity · doi:10.1016/j.immuni.2018.02.010 · Cited by 523
Skin barrier immunity and ageing
Chambers, E. S., & Vukmanovic‐Stejic, M. (2019) · Immunology · doi:10.1111/imm.13152 · Cited by 534
Zens, K. D., Chen, J. K., & Färber, D. L. (2016) · JCI Insight · doi:10.1172/jci.insight.85832 · Cited by 427
Principles and therapeutic applications of adaptive immunity
Chi, H., Pepper, M., & Thomas, P. G. (2024) · Cell · doi:10.1016/j.cell.2024.03.037 · Cited by 394
Künzli, M., & Masopust, D. (2023) · Nature Immunology · doi:10.1038/s41590-023-01510-4 · Cited by 338
Tumor-specific cytolytic CD4 T cells mediate immunity against human cancer
Cachot, A., Bilous, M., Liu, Y., Li, X., Saillard, M., Cenerenti, M., Rockinger, G. A., Wyss, T., Guillaume, P., Schmidt, J., et al. (2021) · Science Advances · doi:10.1126/sciadv.abe3348 · Cited by 340
Induction of resident memory T cells enhances the efficacy of cancer vaccine
Nizard, M., Roussel, H., Diniz, M. O., Karaki, S., Tran, T., Voron, T., Dransart, E., Sandoval, F., Riquet, M., Rance, B., et al. (2017) · Nature Communications · doi:10.1038/ncomms15221 · Cited by 321
Interleukin-2-Dependent Allergen-Specific Tissue-Resident Memory Cells Drive Asthma
Hondowicz, B. D., An, D., Schenkel, J. M., Kim, K. S., Steach, H. R., Krishnamurty, A. T., Keitany, G. J., Garza, E. N., Fraser, K. A., Moon, J. J., et al. (2015) · Immunity · doi:10.1016/j.immuni.2015.11.004 · Cited by 303
Developmental plasticity allows outside-in immune responses by resident memory T cells
Fonseca, R., Beura, L. K., Quarnstrom, C. F., Ghoneim, H. E., Fan, Y., Zebley, C. C., Scott, M. C., Fares-Frederickson, N. J., Wijeyesinghe, S., Thompson, E. A., et al. (2020) · Nature Immunology · doi:10.1038/s41590-020-0607-7 · Cited by 286
Klicznik, M. M., Morawski, P. A., Höllbacher, B., Varkhande, S. R., Motley, S., Kuri-Cervantes, L., Goodwin, E. C., Rosenblum, M. D., Long, S. A., Brachtl, G., et al. (2019) · Science Immunology · doi:10.1126/sciimmunol.aav8995 · Cited by 258
Beura, L. K., Mitchell, J. S., Thompson, E. A., Schenkel, J. M., Mohammed, J., Wijeyesinghe, S., Fonseca, R., Burbach, B. J., Hickman, H. D., Vezys, V., et al. (2018) · Nature Immunology · doi:10.1038/s41590-017-0029-3 · Cited by 258
Regulation of immunity during visceral Leishmania infection
Rodrigues, V., Cordeiro‐da‐Silva, A., Laforge, M., Silvestre, R., & Estaquier, J. (2016) · Parasites & Vectors · doi:10.1186/s13071-016-1412-x · Cited by 253
T cells and the skin: from protective immunity to inflammatory skin disorders
Ho, A. W., & Kupper, T. S. (2019) · Nature Reviews Immunology · doi:10.1038/s41577-019-0162-3 · Cited by 241
Memory CD4+ T Cells in Immunity and Autoimmune Diseases
Raphael, I., Robinson, R. R., & Forsthuber, T. G. (2020) · Cells · doi:10.3390/cells9030531 · Cited by 241
CD4+ resident memory T cells dominate immunosurveillance and orchestrate local recall responses
Beura, L. K., Fares-Frederickson, N. J., Steinert, E. M., Scott, M. C., Thompson, E. A., Fraser, K. A., Schenkel, J. M., Vezys, V., & Masopust, D. (2019) · Journal of Experimental Medicine · doi:10.1084/jem.20181365 · Cited by 190
Tissue‐resident memory T cells in tissue homeostasis, persistent infection, and cancer surveillance
Gebhardt, T., Palendira, U., Tscharke, D. C., & Bedoui, S. (2018) · Immunological Reviews · doi:10.1111/imr.12650 · Cited by 208
Transcriptional Regulation of Tissue-Resident Lymphocytes
Mackay, L. K., & Kallies, A. (2016) · Trends in Immunology · doi:10.1016/j.it.2016.11.004 · Cited by 202
Tissue resident memory T cells in the respiratory tract
Zheng, M. Z. M., & Wakim, L. M. (2021) · Mucosal Immunology · doi:10.1038/s41385-021-00461-z · Cited by 192
The Role of CXCR3 and Its Chemokine Ligands in Skin Disease and Cancer
Kuo, P., Zeng, Z., Salim, N., Mattarollo, S. R., Wells, J. W., & Leggatt, G. R. (2018) · Frontiers in Medicine · doi:10.3389/fmed.2018.00271 · Cited by 165
Trigger-happy resident memory CD4+ T cells inhabit the human lungs
Oja, A. E., Piet, B., Helbig, C., Stark, R., van der Zwan, D., Blaauwgeers, H., Remmerswaal, E. B. M., Amsen, D., Jonkers, R. E., Moerland, P. D., et al. (2018) · Mucosal Immunology · doi:10.1038/mi.2017.94 · Cited by 160
Origins of CD 4+ circulating and tissue‐resident memory T‐cells
Nguyen, Q., Deng, T. Z., Witherden, D. A., & Goldrath, A. W. (2019) · Immunology · doi:10.1111/imm.13059 · Cited by 145
Pathophysiology of Skin Resident Memory T Cells
TOKURA, Y., Phadungsaksawasdi, P., Kurihara, K., Fujiyama, T., & Honda, T. (2021) · Frontiers in Immunology · doi:10.3389/fimmu.2020.618897 · Cited by 148
Niches for the Long-Term Maintenance of Tissue-Resident Memory T Cells
Takamura, S. (2018) · Frontiers in Immunology · doi:10.3389/fimmu.2018.01214 · Cited by 138
Retrograde migration supplies resident memory T cells to lung-draining LN after influenza infection
Stolley, J. M., Johnston, T. S., Soerens, A. G., Beura, L. K., Rosato, P. C., Joag, V., Wijeyesinghe, S., Langlois, R. A., Osum, K. C., Mitchell, J. S., et al. (2020) · The Journal of Experimental Medicine · doi:10.1084/jem.20192197 · Cited by 126
Park, C. O., Fu, X., Jiang, X., Pan, Y., Teague, J. E., Collins, N., Tian, T., O'Malley, J. T., Emerson, R. O., Kim, J. H., et al. (2018) · Journal of Allergy and Clinical Immunology · doi:10.1016/j.jaci.2017.09.042 · Cited by 125
Distinct functions of tissue-resident and circulating memory Th2 cells in allergic airway disease
Rahimi, R. A., Nepal, K., Çetinbaş, M., Sadreyev, R. I., & Luster, A. D. (2020) · The Journal of Experimental Medicine · doi:10.1084/jem.20190865 · Cited by 127
Local IL-23 is required for proliferation and retention of skin-resident memory T H 17 cells
Whitley, S. K., Li, M., Kashem, S. W., Hirai, T., Igyártó, B. Z., Knizner, K., Ho, J., Ferris, L. K., Weaver, C. T., Cua, D. J., et al. (2022) · Science Immunology · doi:10.1126/sciimmunol.abq3254 · Cited by 124
Self-citationRatajczak, W., Niedźwiedzka‐Rystwej, P., Tokarz–Deptuła, B., & Deptuła, W. (2018) · Central European Journal of Immunology · doi:10.5114/ceji.2018.77390 · Cited by 121
Zhang, W., Karmakar, S., Gannavaram, S., Dey, R., Lypaczewski, P., Ismail, N., Siddiqui, A., Simonyan, V. V., Oliveira, F., Coutinho-Abreu, I. V., et al. (2020) · Nature Communications · doi:10.1038/s41467-020-17154-z · Cited by 118
Strobl, J., Pandey, R. V., Krausgruber, T., Bayer, N., Kleißl, L., Reininger, B., Vieyra-Garcia, P. A., Wolf, P., Jentus, M. M., Mitterbauer, M., et al. (2020) · Science Translational Medicine · doi:10.1126/scitranslmed.abb7028 · Cited by 117
Glennie, N. D., Volk, S. W., & Scott, P. (2017) · PLoS Pathogens · doi:10.1371/journal.ppat.1006349 · Cited by 117
Self-citationTissue-specific immunity for a changing world
Weisberg, S. P., Ural, B. B., & Färber, D. L. (2021) · Cell · doi:10.1016/j.cell.2021.01.042 · Cited by 104
Inflammatory adaptation in barrier tissues
Niec, R. E., Rudensky, A. Y., & Fuchs, E. V. (2021) · Cell · doi:10.1016/j.cell.2021.05.036 · Cited by 100
Pathogenic role of tissue-resident memory T cells in autoimmune diseases
Wu, H., Liao, W., Li, Q., Long, H., Yin, H., Zhao, M., Chan, V. S. F., Lau, C.-S., & Lu, Q. (2018) · Autoimmunity Reviews · doi:10.1016/j.autrev.2018.03.014 · Cited by 93
Leishmania Hijacks Myeloid Cells for Immune Escape
Martínez‐López, M., Soto, M., Iborra, S., & Sancho, D. (2018) · Frontiers in Microbiology · doi:10.3389/fmicb.2018.00883 · Cited by 90
Schmidt, J. D., Ahlström, M. G., Johansen, J. D., Dyring‐Andersen, B., Agerbeck, C., Nielsen, M. M., Poulsen, S. S., Woetmann, A., Ødum, N., Thomsen, A. R., et al. (2016) · Contact Dermatitis · doi:10.1111/cod.12715 · Cited by 86
Vaccine candidates against leishmania under current research
Iborra, S., Solana, J. C., Requena, J. M., & Soto, M. (2018) · Expert Review of Vaccines · doi:10.1080/14760584.2018.1459191 · Cited by 85
Jiang, X.-L., Wang, G.-L., Zhao, X.-N., Yan, F.-H., Lin, Y., Kou, Z.-Q., Ji, S.-X., Zhang, X.-L., Li, C.-B., Duan, L., et al. (2021) · Nature Communications · doi:10.1038/s41467-021-21155-x · Cited by 77
CD4+ Memory T Cells at Home in the Tissue: Mechanisms for Health and Disease
Schreiner, D., & King, C. G. (2018) · Frontiers in Immunology · doi:10.3389/fimmu.2018.02394 · Cited by 84
CD4 TRM Cells Following Infection and Immunization: Implications for More Effective Vaccine Design
Wilk, M. M., & Mills, K. H. G. (2018) · Frontiers in Immunology · doi:10.3389/fimmu.2018.01860 · Cited by 79
Tissue-resident immune cells: from defining characteristics to roles in diseases
Li, J., Chu, X., Li, C., & He, J. (2025) · Signal Transduction and Targeted Therapy · doi:10.1038/s41392-024-02050-5 · Cited by 87
Mechanisms of T cell organotropism
Fu, H., Ward, E. J., & Marelli‐Berg, F. M. (2016) · Cellular and Molecular Life Sciences · doi:10.1007/s00018-016-2211-4 · Cited by 76
Bishu, S., Zaatari, M. E., Hayashi, A., Hou, G., Bowers, N., Kinnucan, J. A. R., Manoogian, B., Muza–Moons, M. M., Zhang, M., Grasberger, H., et al. (2019) · Journal of Crohn s and Colitis · doi:10.1093/ecco-jcc/jjz010 · Cited by 76
Carbone, F. R. (2022) · Nature reviews. Immunology · doi:10.1038/s41577-022-00815-z · Cited by 74
Muruganandah, V., Sathkumara, H. D., Navarro, S., & Kupz, A. (2018) · Frontiers in Immunology · doi:10.3389/fimmu.2018.01574 · Cited by 76
Sarna, V. K., Skodje, G. I., Reims, H. M., Risnes, L. F., Dahal‐Koirala, S., Sollid, L. M., & Lundin, K. E. A. (2017) · Gut · doi:10.1136/gutjnl-2017-314461 · Cited by 69
Infection-adapted emergency hematopoiesis promotes visceral leishmaniasis
Abidin, B. M., Hammami, A., Stäger, S., & Heinonen, K. M. (2017) · PLoS Pathogens · doi:10.1371/journal.ppat.1006422 · Cited by 67
CD4+ T cells persist for years in the human small intestine and display a TH1 cytokine profile
Bartolomé-Casado, R., Landsverk, O. J. B., Chauhan, S. K., Sætre, F., Hagen, K. T., Yaqub, S., Øyen, O. M., Horneland, R., Aandahl, E. M., Aabakken, L., et al. (2020) · Mucosal Immunology · doi:10.1038/s41385-020-0315-5 · Cited by 67
Meta-transcriptome Profiling of the Human-Leishmania braziliensis Cutaneous Lesion
Christensen, S. M., Dillon, L. A. L., Carvalho, L. P., Passos, S., Novais, F. O., Hughitt, V. K., Beiting, D. P., Carvalho, E. M., Scott, P., El-Sayed, N. M., et al. (2016) · PLoS neglected tropical diseases · doi:10.1371/journal.pntd.0004992 · Cited by 62
Self-citationLandrith, T. A., Sureshchandra, S., Rivera, A., Jang, J. C., Rais, M., Nair, M. G., Messaoudi, I., & Wilson, E. H. (2017) · Frontiers in Immunology · doi:10.3389/fimmu.2017.00335 · Cited by 64
Host-Directed Therapies for Cutaneous Leishmaniasis
Novais, F. O., Amorim, C. F., & Scott, P. (2021) · Frontiers in Immunology · doi:10.3389/fimmu.2021.660183 · Cited by 57
Self-citationHohman, L. S., & Peters, N. C. (2019) · Trends in Parasitology · doi:10.1016/j.pt.2019.04.002 · Cited by 57
Th2-TRMs Maintain Life-Long Allergic Memory in Experimental Asthma in Mice
Bošnjak, B., Kazemi, S., Altenburger, L. M., Mokrović, G., & Epstein, M. M. (2019) · Frontiers in Immunology · doi:10.3389/fimmu.2019.00840 · Cited by 54
Gannavaram, S., Bhattacharya, P., Ismail, N., Kaul, A., Singh, R. K., & Nakhasi, H. L. (2016) · Frontiers in Immunology · doi:10.3389/fimmu.2016.00187 · Cited by 55
Intestinal helminth infection induces highly functional resident memory CD4+ T cells in mice
Steinfelder, S., Rausch, S., Michael, D., Kühl, A. A., & Hartmann, S. (2016) · European Journal of Immunology · doi:10.1002/eji.201646575 · Cited by 56
Iversen, L., Eidsmo, L., Austad, J., de Rie, M. A., Osmančević, A., Skov, L., Talme, T., Bachmann, I., van de Kerkhof, P., Ståhle, M., et al. (2018) · Journal of the European Academy of Dermatology and Venereology · doi:10.1111/jdv.14979 · Cited by 54
Chemokines: Critical Regulators of Memory T Cell Development, Maintenance, and Function
Rahimi, R. A., & Luster, A. D. (2018) · Advances in immunology · doi:10.1016/bs.ai.2018.02.002 · Cited by 55
Memory T cells in cutaneous leishmaniasis
Glennie, N. D., & Scott, P. (2016) · Cellular Immunology · doi:10.1016/j.cellimm.2016.07.010 · Cited by 51
Self-citationRevival of Leishmanization and Leishmanin
Pacheco‐Fernández, T., Volpedo, G., Gannavaram, S., Bhattacharya, P., Dey, R., Satoskar, A. R., Matlashewski, G., & Nakhasi, H. L. (2021) · Frontiers in Cellular and Infection Microbiology · doi:10.3389/fcimb.2021.639801 · Cited by 49
Mendonça, S. C. F. (2016) · Parasites & Vectors · doi:10.1186/s13071-016-1777-x · Cited by 48
Hirahara, K., Kokubo, K., Aoki, A., Kiuchi, M., & Nakayama, T. (2021) · Frontiers in Immunology · doi:10.3389/fimmu.2021.616309 · Cited by 49
Post-Genomics and Vaccine Improvement for Leishmania
Seyed, N., Taheri, T., & Rafati, S. (2016) · Frontiers in Microbiology · doi:10.3389/fmicb.2016.00467 · Cited by 47
Hondowicz, B. D., Kim, K. S., Ruterbusch, M., Keitany, G. J., & Pepper, M. (2017) · European Journal of Immunology · doi:10.1002/eji.201746928 · Cited by 47
Romano, A., Doria, N. A., Mendez, J., Sacks, D. L., & Peters, N. C. (2015) · The Journal of Immunology · doi:10.4049/jimmunol.1500752 · Cited by 45
Pathogen Evasion of Chemokine Response Through Suppression of CXCL10
Antonia, A. L., Alvarez, M. I., Trahair, E. D., Gibbs, K. D., Pittman, K. J., Barnes, A. B., Smith, J. S., Rajagopal, S., Thompson, J. W., Reinhardt, R. L., et al. (2019) · Frontiers in Cellular and Infection Microbiology · doi:10.3389/fcimb.2019.00280 · Cited by 41
Funch, A. B., Mraz, V., Gadsbøll, A.-S. Ø., Jee, M. H., Weber, J. F., Ødum, N., Woetmann, A., Johansen, J. D., Geisler, C., & Bonefeld, C. M. (2021) · Allergy · doi:10.1111/all.14986 · Cited by 44
Ohta, T., Yoshikawa, S., Tabakawa, Y., Yamaji, K., Ishiwata, K., Shitara, H., Taya, C., Oh‐hora, M., Kawano, Y., Miyake, K., et al. (2017) · Frontiers in Immunology · doi:10.3389/fimmu.2017.01348 · Cited by 42
A profile of research on the parasitic trypanosomatids and the diseases they cause
Horn, D. (2022) · PLoS neglected tropical diseases · doi:10.1371/journal.pntd.0010040 · Cited by 39
van Gisbergen, K. P. J. M., Zens, K. D., & Münz, C. (2021) · European Journal of Immunology · doi:10.1002/eji.202049062 · Cited by 39
Anti-Leishmanial Vaccines: Assumptions, Approaches, and Annulments
Zutshi, S., Kumar, S., Chauhan, P. S., Bansode, Y. D., Nair, A., Roy, S., Sarkar, A., & Saha, B. (2019) · Vaccines · doi:10.3390/vaccines7040156 · Cited by 40
Hendriks, A., Mnich, M. E., Clemente, B., Cruz, A. R., Tavarini, S., Bagnoli, F., & Soldaini, E. (2021) · Frontiers in Immunology · doi:10.3389/fimmu.2021.642711 · Cited by 40
The aorta can act as a site of naïve CD4+ T-cell priming
MacRitchie, N. A., Grassia, G., Noonan, J. E., Cole, J. E., Hughes, C. E., Schroeder, J., Benson, R. A., Cochain, C., Zernecke, A., Guzik, T. J., et al. (2019) · Cardiovascular Research · doi:10.1093/cvr/cvz102 · Cited by 39
Emerging Concepts of Tissue-resident Memory T Cells in Transplantation
Fu, J., & Sykes, M. (2021) · Transplantation · doi:10.1097/tp.0000000000004000 · Cited by 39
Caldeira-Dantas, S., Furmanak, T., Smith, C. J., Quinn, M., Teos, L. Y., Ertel, A., Kurup, D., Tandon, M., Alevizos, I., & Snyder, C. M. (2017) · The Journal of Immunology · doi:10.4049/jimmunol.1701272 · Cited by 38
Zheng, C., Cao, T., Ye, C., & Zou, Y. (2023) · Clinical Immunology · doi:10.1016/j.clim.2023.109805 · Cited by 35
T Cell Immunity and the Quest for Protective Vaccines against Staphylococcus aureus Infection
Armentrout, E. I., Liu, G. E., & Martins, G. A. (2020) · Microorganisms · doi:10.3390/microorganisms8121936 · Cited by 36
Functional heterogeneity of human skin‐resident memory T cells in health and disease
Strobl, J., & Haniffa, M. A. (2023) · Immunological Reviews · doi:10.1111/imr.13213 · Cited by 34
Cutaneous Leishmaniasis Vaccination: A Matter of Quality
Luca, P. M. D., & Macedo, A. B. (2016) · Frontiers in Immunology · doi:10.3389/fimmu.2016.00151 · Cited by 33
Maintenance of pathogenic Th2 cells in allergic disorders
Shinoda, K., Hirahara, K., & Nakayama, T. (2017) · Allergology International · doi:10.1016/j.alit.2017.03.005 · Cited by 33
A sustained type I IFN-neutrophil-IL-18 axis drives pathology during mucosal viral infection
Lebratti, T. J., Lim, Y. S., Cofie, A., Andhey, P. S., Jiang, X., Scott, J. M., Fabbrizi, M. R., Ozantürk, A. N., Pham, C. T. N., Clemens, R. A., et al. (2021) · eLife · doi:10.7554/elife.65762 · Cited by 34
Ko, W.-C. C., Li, L., Young, T., McLean-Mandell, R., DENG, A. C., Vanguri, V. K., Dresser, K., & Harris, J. E. (2021) · Journal of Investigative Dermatology · doi:10.1016/j.jid.2021.04.030 · Cited by 33
Tissue-resident memory T cells trigger rapid exudation and local antibody accumulation
Rosato, P. C., Lotfi‐Emran, S., Joag, V., Wijeyesinghe, S., Quarnstrom, C. F., Degefu, H. N., Nedellec, R., Schenkel, J. M., Beura, L. K., Hangartner, L., et al. (2023) · Mucosal Immunology · doi:10.1016/j.mucimm.2022.11.004 · Cited by 33
Chemokine-Driven CD4 + T Cell Homing: New Concepts and Recent Advances
Whyte, C. E., Foeng, J., Comerford, I., & McColl, S. R. (2017) · Advances in immunology · doi:10.1016/bs.ai.2017.03.001 · Cited by 34
Memory CD 8 T cell inflation vs tissue‐resident memory T cells: Same patrollers, same controllers?
Welten, S. P. M., Sandu, I., Baumann, N. S., & Oxenius, A. (2018) · Immunological Reviews · doi:10.1111/imr.12649 · Cited by 34
Tissue-Specific Control of Tissue-Resident Memory T Cells
Liu, Y., Ma, C., & Zhang, N. (2018) · Critical Reviews in Immunology · doi:10.1615/critrevimmunol.2018025653 · Cited by 32
Seyed, N., Peters, N. C., & Rafati, S. (2018) · Frontiers in Immunology · doi:10.3389/fimmu.2018.01227 · Cited by 31
Monocyte-Derived Cells in Tissue-Resident Memory T Cell Formation
Chu, K.-L., Batista, N. V., Girard, M., & Watts, T. H. (2020) · The Journal of Immunology · doi:10.4049/jimmunol.1901046 · Cited by 33
Scott, P. (2020) · Cold Spring Harbor Perspectives in Biology · doi:10.1101/cshperspect.a038059 · Cited by 29
Self-citationMoylan, D. C., Goepfert, P., Kempf, M.-C., Saag, M. S., Richter, H. E., Mestecky, J. F., & Sabbaj, S. (2017) · Pathogens and Immunity · doi:10.20411/pai.v1i2.166 · Cited by 29
Zareie, P., Weiss, E. S., Kaplan, D. H., & Mackay, L. K. (2025) · Nature Immunology · doi:10.1038/s41590-025-02145-3 · Cited by 29
Louis, L., Clark, M. L., Wise, M. C., Glennie, N. D., Wong, A. C., Broderick, K. E., Uzonna, J. E., Weiner, D. B., & Scott, P. (2019) · Infection and Immunity · doi:10.1128/iai.00227-19 · Cited by 27
Self-citationPacheco‐Fernández, T., Volpedo, G., Verma, C., & Satoskar, A. R. (2021) · Biochemical Society Transactions · doi:10.1042/bst20200606 · Cited by 28
Pratti, J. E. S., Ramos, T. D., Pereira, J. C., da Fonseca-Martins, A. M., Oliveira-Maciel, D., Oliveira-Silva, G., de Mello, M. F., Chaves, S. P., Gomes, D. C. O., Diaz, B. L., et al. (2016) · Parasites & Vectors · doi:10.1186/s13071-016-1822-9 · Cited by 27
Metadata
- Authors
- Glennie, N. D., Yeramilli, V. A., Beiting, D. P., Volk, S. W., Weaver, C. T., & Scott, P.
- Affiliations
- University of Pennsylvania (US)
- University of Alabama at Birmingham (US)
- Corresponding author
- Scott, Phillip
- Venue
- Journal of Experimental Medicine
- Publisher
- Rockefeller University Press
- Published
- 2015-07-27
- Volume
- 212
- Issue
- 9
- Pages
- 1405-1414
- ISSN
- 0022-1007 (ISSN-L)
- 1540-9538
- PMC
- PMC4548053
- OpenAlex
- W2162538566
- Cited by
- 204
- References
- 41
- Citations by year
- 2026: 10 · 2025: 10 · 2024: 12 · 2023: 14 · 2022: 14 · 2021: 29 · 2020: 21 · 2019: 21 · 2018: 26 · 2017: 22 · 2016: 20 · 2015: 5
- FWCI
- 26.10
- Type
- journal article
- Language
- en
- Open access
- green
- www.ncbi.nlm.nih.gov
- Licence
- cc-by-nc-sa
- Locations
- The Journal of Experimental Medicine (publishedVersion)
- Europe PMC (PubMed Central) (publishedVersion, cc-by-nc-sa)
- PubMed Central (publishedVersion, cc-by-nc-sa)
- PubMed (publishedVersion)
- Funders
- National Institute of Allergy and Infectious Diseases (R21AI110869, T32AI007532)
- Topics
- Health Sciences › Medicine › Public Health, Environmental and Occupational Health › Research on Leishmaniasis Studies
- Life Sciences › Immunology and Microbiology › Immunology › T-cell and B-cell Immunology
- Life Sciences › Immunology and Microbiology › Immunology › Immune responses and vaccinations
- Keywords
- Leishmania major, cutaneous leishmaniasis, skin-resident memory T cells, CD4+ T cells, interferon-gamma, CXCR3, skin grafting, protective immunity, leishmaniasis vaccine, parasite control
- MeSH terms
- Animals, Humans, Immunologic Memory, Interferon-gamma, Mice, Transgenic, Skin, CD4-Positive T-Lymphocytes, Leishmaniasis, Cutaneous, Leishmania major, Mice, Receptors, CXCR3
About these checks
Registry, retraction, Cites and statistics results are computed, not judged, with one exception: a printed reference that no index lists is read once by a model before it counts as a citation error. Claims are extracted by a model and kept only when their quote appears verbatim in the text; each cited source is then checked, with a model’s help, for whether it says what the claim relies on. Those verdicts can be wrong — read the claim’s quote and the cited source before relying on one.
Statistics and arithmetic are recomputed, not judged.
Confidence bands are shown only for fields calibrated on our annotated test set. None is calibrated yet, so no band is shown.
What counts as a claim ›How we measure confidence ›How we check this ›
Are you an author, or do you see a problem with this page? Request a review
