

Mendelian randomization with invalid instruments: effect estimation and bias detection through Egger regression
Open accessThe DOI matches its Crossref record; 50 of the 50 references it cites were found in a registry or an index.
Abstract
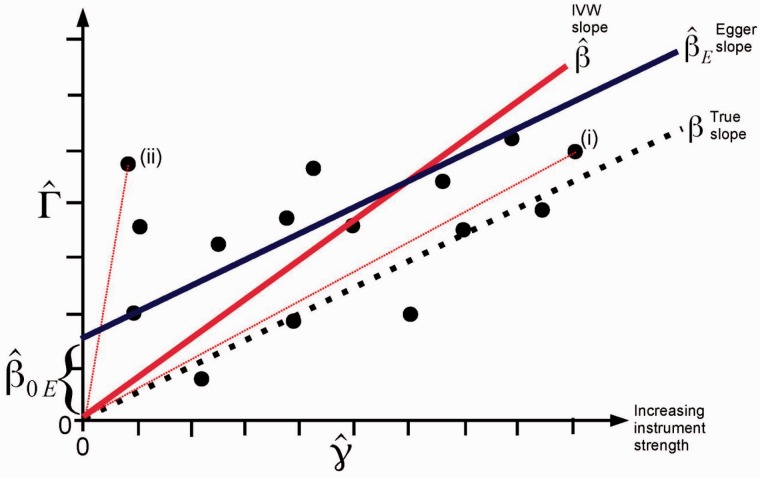
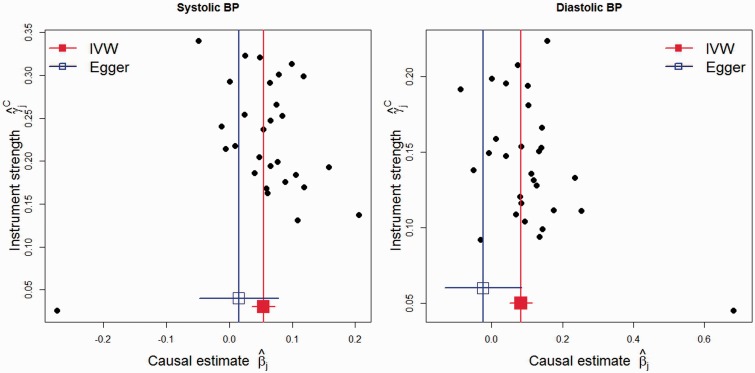
BACKGROUND: The number of Mendelian randomization analyses including large numbers of genetic variants is rapidly increasing. This is due to the proliferation of genome-wide association studies, and the desire to obtain more precise estimates of causal effects. However, some genetic variants may not be valid instrumental variables, in particular due to them having more than one proximal phenotypic correlate (pleiotropy). METHODS: We view Mendelian randomization with multiple instruments as a meta-analysis, and show that bias caused by pleiotropy can be regarded as analogous to small study bias. Causal estimates using each instrument can be displayed visually by a funnel plot to assess potential asymmetry. Egger regression, a tool to detect small study bias in meta-analysis, can be adapted to test for bias from pleiotropy, and the slope coefficient from Egger regression provides an estimate of the causal effect. Under the assumption that the association of each genetic variant with the exposure is independent of the pleiotropic effect of the variant (not via the exposure), Egger's test gives a valid test of the null causal hypothesis and a consistent causal effect estimate even when all the genetic variants are invalid instrumental variables. RESULTS: We illustrate the use of this approach by re-analysing two published Mendelian randomization studies of the causal effect of height on lung function, and the causal effect of blood pressure on coronary artery disease risk. The conservative nature of this approach is illustrated with these examples. CONCLUSIONS: An adaption of Egger regression (which we call MR-Egger) can detect some violations of the standard instrumental variable assumptions, and provide an effect estimate which is not subject to these violations. The approach provides a sensitivity analysis for the robustness of the findings from a Mendelian randomization investigation.
Overview
The claims and statistics of this paper haven’t been checked yet.
Free: it reads the open-access text and checks the first 5 claims that cite a source we can check. Create a free account to check every claim.
Integrity signals
Registry
Cites
Statistics
Figures


Verification
Claims the paper makes
The claims and statistics of this paper haven’t been checked yet.
Free: it reads the open-access text and checks the first 5 claims that cite a source we can check. Create a free account to check every claim.
Claims other papers make about this one
Each is checked against this paper’s own text: does it say what the citing paper says it does?
The cited source doesn’t support the claim as written.
In the citing paper
“These analyses showed no major deviations and did not change conclusions from the main instrumental variable findings.”
From Plasma levels of apolipoprotein E, APOE genotype, and all-cause and cause-specific mortality in 105 949 individuals from a white general population cohort (2019) · cites this paper as [67]
Checked by a reasoning model — may be wrong.
Experimental — accuracy not yet measuredThe source backs part of the claim, not all of it — or backs it for a different population, condition or comparison.
In the citing paper
“Similarly, violation of the ‘exclusion restriction criteria’33–37 could bias causal estimates in IV analyses when used to test effects of intermediates in RCTs or when used in observational data (including MR)”
From Triangulation in aetiological epidemiology (2017) · cites this paper as [36]
Experimental — accuracy not yet measuredThe source backs part of the claim, not all of it — or backs it for a different population, condition or comparison.
In the citing paper
“Furthermore the MR-Egger test, 9 which the authors used to test violation of the exclusion restriction criteria, cannot be used to differentiate effects of adult from child BMI, as Gao and colleagues acknowledge. This is because MR-Egger is only valid if the effect of the genetic instrument on the risk factor of interest is independent of its effect on any other phenotypes that might violate that”
From Commentary: Two-sample Mendelian randomization: opportunities and challenges (2016) · cites this paper as [9]
Experimental — accuracy not yet measuredThe source backs part of the claim, not all of it — or backs it for a different population, condition or comparison.
In the citing paper
“Egger MR was performed to determine the presence of unmeasured pleiotropy70.”
From Integrative genomic analyses identify candidate causal genes for calcific aortic valve stenosis involving tissue-specific regulation (2024) · cites this paper as [70]
Experimental — accuracy not yet measuredThe cited source says what the claim attributes to it.
In the citing paper
“Because MR is relatively novel there has been considerable focus on its limitations and methods for testing and dealing with these, in particular for dealing with violation of the exclusion restriction criteria due to genuine pleiotropy.36,37”
From Triangulation in aetiological epidemiology (2017) · cites this paper as [36]
8 more claims about this paper
Create a free account to see every claim other papers make about this one.
Self-check
Percentages, sums and reported differences re-computed from the paper’s own numbers.
The self-check needs the paper’s full text.
Citations
Cites
Measuring inconsistency in meta-analyses
Higgins, J. P. T., Thompson, S. G., Deeks, J. J., & Altman, D. G. (2003) · BMJ · doi:10.1136/bmj.327.7414.557 · Cited by 63,139
Bias in meta-analysis detected by a simple, graphical test
Egger, M., Smith, G. D., Schneider, M., & Minder, C. (1997) · BMJ · doi:10.1136/bmj.315.7109.629 · Cited by 56,722
Self-citationRegression shrinkage and selection via the lasso
Tibshirani, R. (1996) · Journal of the Royal Statistical Society Series B: Statistical Methodology · doi:10.1111/j.2517-6161.1996.tb02080.x · Cited by 51,482
Duval, S., & Tweedie, R. (2000) · Biometrics · doi:10.1111/j.0006-341x.2000.00455.x · Cited by 14,099
Borenstein, M., Hedges, L. V., Higgins, J. P. T., & Rothstein, H. R. (2021) · doi:10.1002/9781119558378 · Cited by 9,799
Sterne, J. A. C., Sutton, A. J., Ioannidis, J. P. A., Terrin, N., Jones, D. R., Lau, J., Carpenter, J., Rucker, G., Harbord, R. M., Schmid, C. H., et al. (2011) · BMJ · doi:10.1136/bmj.d4002 · Cited by 7,709 · cited 1×
“The general phenomenon is therefore prudently referred to under the umbrella term of ‘small study’ bias.(11,13,14) In the context of Mendelian randomization with multiple instruments, we equate the precision of a single study’s estimate with the strength of a single instrument.”
BackgroundInstrumental Variables Regression with Weak Instruments
Staiger, D., & Stock, J. H. (1997) · Econometrica · doi:10.2307/2171753 · Cited by 7,081
Mendelian Randomization Analysis With Multiple Genetic Variants Using Summarized Data
Burgess, S., Butterworth, A., & Thompson, S. G. (2013) · Genetic Epidemiology · doi:10.1002/gepi.21758 · Cited by 6,050 · cited 1×
“It has been shown that Mendelian randomization analyses based on summarized data are as efficient as those based on individual-level data.(23) Other tools from the meta-analysis literature include methods for bias adjustment, such as the trim-and-fill method,(45) and the use of pseudo-data.”
MethodSelf-citationDavey Smith, G., & Ebrahim, S. (2003) · International Journal of Epidemiology · doi:10.1093/ije/dyg070 · Cited by 5,882 · cited 2×
“We are particularly interested in the coverage properties of the estimators with a null causal effect, and the power of estimators with a positive causal effect, as salient findings from Mendelian randomization investigations are not only the magnitude of the causal effect—or indeed whether such can be estimated—but a…”
BackgroundInstrumental Variables Regression with Weak Instruments
Staiger, D., & Stock, J. (1994) · doi:10.3386/t0151 · Cited by 5,302 · cited 1×
“With many IVs in a one-sample setting (genetic variants, exposure and outcome measured in the same participants), IV estimates (particularly those from the TSLS method) are biased in the direction of the observational association between the exposure and the outcome.(49) This bias depends on the strength of the associ…”
Method
Research works printed but not linked: 12
- 2014, Human Molecular Genetics, 23, 89, 10.1093/hmg/ddu328 · DOI · Paper page
- 2010, Clinical Chemistry, 56, 723, 10.1373/clinchem.2009.141564 · DOI · Paper page
- 2015, International Journal of Epidemiology, 44, 496, 10.1093/ije/dyv071 · DOI · Paper page
- 2013, International Journal of Epidemiology, 42, 1157, 10.1093/ije/dyt110 · DOI · Paper page
- 2013, International Journal of Epidemiology, 42, 1497, 10.1093/ije/dyt179 · DOI · Paper page
- 2013, International Journal of Epidemiology, 42, 1134, 10.1093/ije/dyt093 · DOI · Paper page
- 2015, Statistics in medicine, 34, 454, 10.1002/sim.6358 · DOI · Paper page
- 2013, International Journal of Epidemiology, 42, 111, 10.1093/ije/dys064 · DOI · Paper page
- 2014, Economics and human biology, 13, 99, 10.1016/j.ehb.2013.12.002 · DOI · Paper page
- 2011, International Journal of Epidemiology, 40, 755, 10.1093/ije/dyr036 · DOI · Paper page
- 2013, American Journal of Epidemiology, 178, 1177, 10.1093/aje/kwt084 · DOI · Paper page
- Angrist J Pischke J-S Instrumental variables in action: sometimes you get whatyou need. In: Mostly Harmless Econometrics: An Empiricist’scompanion. Princeton, NJ: Princeton University Press, 2009.
Cited by
Items 901–1,000 of 1,058
Age at menarche and lung function: a Mendelian randomization study
Gill, D., Sheehan, N. A., Wielscher, M., Shrine, N. R. G., Amaral, A. F. S., Thompson, J. R., Granell, R., Leynaert, B., Real, F. G., Hall, I. P., et al. (2017) · European Journal of Epidemiology · doi:10.1007/s10654-017-0272-9 · Cited by 47
“If statistically significant heterogeneity remained after the exclusion of these SNPs, we performed two further sensitivity analyses: a meta-analysis of MR estimates using a random-effects model instead of the fixed-effect model used in the main analysis [37], and MR-Egger regression [38].”
MethodPolicicchio, S. S. S., Ahmad, A. N., Powell, J. F., & Proitsi, P. (2017) · Scientific Reports · doi:10.1038/s41598-017-13168-8 · Cited by 54
Cognitive ability and physical health: a Mendelian randomization study
Hagenaars, S. P., Gale, C. R., Deary, I. J., & Harris, S. E. (2017) · Scientific Reports · doi:10.1038/s41598-017-02837-3 · Cited by 45
Carvalho, C. M., Wendt, F. R., Maihofer, A. X., Stein, D. J., Stein, M. B., Sumner, J. A., Hemmings, S. M. J., Nievergelt, C. M., Koenen, K. C., Gelernter, J. E., et al. (2020) · Neuropsychopharmacology · doi:10.1038/s41386-020-0655-6 · Cited by 51
“, horizontal pleiotropy and heterogeneity) within the genetic instruments tested: MR-Egger regression intercept [41], MRPRESSO (Pleiotropy RESidual Sum and Outlier) global test [42], and MR heterogeneity test [43].”
MethodSmoking and Heart Failure: A Mendelian Randomization and Mediation Analysis
Lu, Y., Xu, Z., Georgakis, M. K., Wang, Z., Lin, H., & Zheng, L. (2021) · ESC Heart Failure · doi:10.1002/ehf2.13248 · Cited by 54
“05 was considered significant); however, it suffered from low statistical power.(23,24) Scatter plots of IVW MR analyses regarding the”
BackgroundVandebergh, M., Degryse, N., Dubois, B., & Goris, A. (2022) · Journal of Neurology · doi:10.1007/s00415-022-11072-4 · Cited by 54
“These sensitivity tests include the MREgger test [7, 8] and median- and mode-based methods [9, 10].”
MethodHou, L., Xu, M., Yu, Y., Sun, X., Liu, X., Liu, L., Li, Y., Yuan, T., Li, W., Li, H., et al. (2020) · Molecular Medicine · doi:10.1186/s10020-019-0133-y · Cited by 48
Walker, V. M., Zheng, J., Gaunt, T. R., & Smith, G. D. (2022) · Annual Review of Biomedical Data Science · doi:10.1146/annurev-biodatasci-122120-024910 · Cited by 58
Causal inference on neuroimaging data with Mendelian randomisation
Taschler, B., Smith, S. M., & Nichols, T. E. (2022) · NeuroImage · doi:10.1016/j.neuroimage.2022.119385 · Cited by 50
Psoriasis may increase the risk of lung cancer: a two‐sample Mendelian randomization study
Luo, Q., Chen, J., Qin, L., Luo, Y., Zhang, Y., Yang, X., & Wang, H. (2022) · Journal of the European Academy of Dermatology and Venereology · doi:10.1111/jdv.18437 · Cited by 48
Julian, T. H., Cooper‐Knock, J., MacGregor, S., Guo, H., Aslam, T. M., Sanderson, E. C. M., Black, G. C. M., & Sergouniotis, P. I. (2023) · eLife · doi:10.7554/elife.82546 · Cited by 44
Obesity and risk of gestational diabetes mellitus: A two-sample Mendelian randomization study
Song, X., Wang, C., Wang, T., Zhang, S., & Qin, J. (2023) · Diabetes Research and Clinical Practice · doi:10.1016/j.diabres.2023.110561 · Cited by 53
Zhang, J., Fang, X., Leng, R., Chen, H., Qian, T.-T., Cai, Y.-Y., Zhang, X., Wang, Y.-Y., Mu, M., Tao, X., et al. (2022) · American Journal of Clinical Nutrition · doi:10.1016/j.ajcnut.2023.04.034 · Cited by 53
Zhu, J., Zhou, D., Nie, Y., Wang, J., Yang, Y., Chen, D., Yu, M., & Li, Y. (2023) · Journal of Cachexia Sarcopenia and Muscle · doi:10.1002/jcsm.13319 · Cited by 47
Mao, R., Yu, Q., & Li, J. (2023) · Frontiers in Immunology · doi:10.3389/fimmu.2023.1231848 · Cited by 48
“Based on Cochran ’ s IVW Q test, there was no signi fi cant heterogeneity among these IVs (Table S6 in Supplementary 1).”
MethodResultInfluentialMachiela, M. J., Hofmann, J. N., Carreras‐Torres, R., Brown, K. M., Johansson, M., Wang, Z., Foll, M., Li, P., Rothman, N., Savage, S. A., et al. (2017) · European Urology · doi:10.1016/j.eururo.2017.07.015 · Cited by 49
“Meta-analyses were performed using the R package metafor and Egger regression[27] was performed using the R package”
Mendelian randomization incorporating uncertainty about pleiotropy
Thompson, J. R., Minelli, C., Bowden, J., Del Greco, F. M., Gill, D., Jones, E. M., Shapland, C. Y., & Sheehan, N. A. (2017) · Statistics in Medicine · doi:10.1002/sim.7442 · Cited by 45
“One small problem with the proposal in [15] is that they suggested fitting MR-Egger regression using weighted least squares with weights inversely proportional to V j as in equation (4).”
MethodResultInfluentialSelf-citationLi, Z., Chen, P., Chen, J., Xu, Y., Wang, Q., Li, X., Li, C., He, L., & Shi, Y. (2018) · EBioMedicine · doi:10.1016/j.ebiom.2018.07.037 · Cited by 53
“To assess for violations of the Mendelian randomization assumptions, Cochran's Q andMR-Egger tests were used to detect heterogeneity and directional pleiotropy of the genetic instruments [30, 31].”
MethodCirculating antioxidants and Alzheimer disease prevention: a Mendelian randomization study
Williams, D. M., Hägg, S., & Pedersen, N. L. (2018) · American Journal of Clinical Nutrition · doi:10.1093/ajcn/nqy225 · Cited by 53
Thompson, W. D., Tyrrell, J., Borges, M.-C., Beaumont, R. N., Knight, B. A., Wood, A. R., Ring, S. M., Hattersley, A. T., Freathy, R. M., & Lawlor, D. A. (2019) · PLOS Medicine · doi:10.1371/journal.pmed.1002828 · Cited by 45
“However, there was evidence of horizontal pleiotropy, with the MR-Egger intercept being −2 g (95% CI −4 to −0.5 g, p = 0.025) and the effect estimate suggesting a possible modest effect of 41 g (95% CI −18 to 100 g, p = 0.132) per 1 SD increase in maternal circulating calcium, compared to the weak inverse effect in th…”
MethodInfluentialRisky behaviors and Parkinson disease: A mendelian randomization study
Grover, S., Del, G. M. F., Kasten, M., Klein, C., Lill, C. M., & König, I. R. (2019) · Neurology · doi:10.1212/wnl.0000000000008245 · Cited by 49
“However, the MR-Egger method is more sensitive to unobserved associations of genetic variants with confounders of the exposure-outcome association and requires a greater sample size for the same underlying variance in exposure.(32) Both the IVW and MR-Egger methods further assume that the pleiotropic effects of geneti…”
MethodZhuang, Q., Shen, C., Chen, Y., Zhao, X., Wei, P., Sun, J., Ji, Y., Chen, X., & Yang, S. (2019) · BMC Medical Genetics · doi:10.1186/s12881-019-0910-z · Cited by 54
Multi-omics highlights ABO plasma protein as a causal risk factor for COVID-19
Cordero, A. I. H., Li, X., Milne, S. B., Yang, C. X., Bossé, Y., Joubert, P., Timens, W., van den Berge, M., Nickle, D. C., Hao, K., et al. (2021) · Human Genetics · doi:10.1007/s00439-021-02264-5 · Cited by 47
Relationship between genetically determined telomere length and glioma risk
Saunders, C. N., Kinnersley, B., Culliford, R., Cornish, A. J., Law, P., & Houlston, R. S. (2021) · Neuro-Oncology · doi:10.1093/neuonc/noab208 · Cited by 49
Mendelian Randomization: Principles and its usage in Lp(a) research
Lamina, C. (2022) · Atherosclerosis · doi:10.1016/j.atherosclerosis.2022.04.013 · Cited by 52
Impact of Serum Calcium Levels on Alzheimer’s Disease: A Mendelian Randomization Study
He, Y., Zhang, H., Wang, T., Han, Z., Ni, Q., Wang, K., Wang, L., Zhang, Y., Hu, Y., Jin, S., et al. (2020) · Journal of Alzheimer s Disease · doi:10.3233/jad-191249 · Cited by 50
Zhu, X., Li, X., Xu, R., & Wang, T. (2020) · Bioinformatics · doi:10.1093/bioinformatics/btaa985 · Cited by 44
Li, W., Zheng, Q., Xu, M., Zeng, C., & Deng, X. (2022) · Journal Of Clinical Periodontology · doi:10.1111/jcpe.13736 · Cited by 52
Zhang, Z., Li, H., Weng, H., Zhou, G., Chen, H., Yang, G., Zhang, P., Zhang, X., Ji, Y., Ying, K., et al. (2023) · BMC Medicine · doi:10.1186/s12916-023-02844-4 · Cited by 56
“MR-Egger [34] method was used to detect the directional pleiotropy according to the intercept of weighted linear regression of the SNP‐outcome coefficients on SNP‐exposure coefficients.”
MethodBenson, M. D., Eisman, A. S., Tahir, U. A., Katz, D. H., Deng, S., Ngo, D., Robbins, J., Hofmann, A., Shi, X. D., Zheng, S., et al. (2023) · Cell Metabolism · doi:10.1016/j.cmet.2023.07.012 · Cited by 47
Zhang, H., Kalla, R., Chen, J., Zhao, J., Zhou, X., Adams, A. T., Noble, A. J., Ventham, N. T., Wellens, J., Ho, G., et al. (2024) · Nature Communications · doi:10.1038/s41467-024-44841-y · Cited by 54
“The MR-Egger approach was still adopted as a sensitivity ana-lysistoassesspotentialhorizontalpleiotropy 67 .”
Taller height as a risk factor for venous thromboembolism: a Mendelian randomization meta‐analysis
Roetker, N. S., Armasu, S. M., Pankow, J. S., Lutsey, P. L., Tang, W., Rosenberg, M. A., Palmer, T., MacLehose, R. F., Heckbert, S. R., Cushman, M., et al. (2017) · Journal of Thrombosis and Haemostasis · doi:10.1111/jth.13719 · Cited by 49
Thyroid Signaling, Insulin Resistance, and 2 Diabetes Mellitus: A Mendelian Randomization Study
Bos, M. M., Smit, R. A. J., Trompet, S., van Heemst, D., & Noordam, R. (2017) · The Journal of Clinical Endocrinology & Metabolism · doi:10.1210/jc.2016-2816 · Cited by 48
“With MR-Egger analyses, we were able to formally test for the presence of directional pleiotropy (33).”
MethodReed, Z. E., Micali, N., Bulik, C. M., Smith, G. D., & Wade, K. H. (2017) · American Journal of Clinical Nutrition · doi:10.3945/ajcn.117.154104 · Cited by 48
“The slope of the MR-Egger test provides an estimate of the causal exposureoutcome association accommodating any pleiotropic effects (37).”
BackgroundRisk of neuropsychiatric adverse effects of lipid-lowering drugs: a mendelian randomization study
Alghamdi, J., Matou-Nasri, S., Alghamdi, F., Alghamdi, S., Alfadhel, M., & Padmanabhan, S. (2018) · International Journal of Neuropsychopharmacology · doi:10.1093/ijnp/pyy060 · Cited by 44
“Importantly, this method can provide unbiased estimates even if all the chosen SNPs are invalid (Bowden et al., 2015).”
MethodGill, D., Monori, G., Georgakis, M. K., Tzoulaki, I., & Laffan, M. (2018) · Arteriosclerosis Thrombosis and Vascular Biology · doi:10.1161/atvbaha.118.311804 · Cited by 50
“It assumes that any direct effects of the SNPs on the outcome (ie, pleiotropic effects) are independent of their association with platelet count (instrument strength independent of direct effect assumption).(22) MR-Egger offers a test for pleiotropy that is biasing the MR estimate and also produces MR estimates that a…”
BackgroundMethodInfluentialCausal link between lipid profile and bone mineral density: A Mendelian randomization study
Yang, X., Cui, Z., Zhang, H., Wei, X., Feng, G.-J., Liu, L., Liu, Y., Pei, Y., & Zhang, L. (2019) · Bone · doi:10.1016/j.bone.2019.05.037 · Cited by 50
Prats‐Uribe, A., Sayols-Baixeras, S., Fernández‐Sanlés, A., Subirana, I., Carreras‐Torres, R., Vilahur, G., Civeira, F., Marrugat, J., Fitó, M., Hernáez, Á., et al. (2020) · Metabolism · doi:10.1016/j.metabol.2020.154351 · Cited by 48
“Finally, we explored and confirmed the exclusion of potential pleiotropic effects using Egger regressions [20].”
MethodCausal association of adipokines with osteoarthritis: a Mendelian randomization study
Fan, J., Zhu, J., Sun, L., Li, Y., Wang, T., & Li, Y. (2020) · Rheumatology · doi:10.1093/rheumatology/keaa719 · Cited by 47
Plasma Proteomics of Renal Function: A Transethnic Meta-Analysis and Mendelian Randomization Study
Matías‐García, P. R., Wilson, R., Guo, Q., Zaghlool, S. B., Eales, J., Xu, X., Charchar, F. J., Dormer, J., Maalmi, H., Schlosser, P., et al. (2021) · Journal of the American Society of Nephrology · doi:10.1681/asn.2020071070 · Cited by 47
“MR-Egger regression was used to assess pleiotropy, because this method allows for horizontal pleiotropy and provides an estimate of the unbalanced horizontal pleiotropic effects in its intercept.(59) Weighted median(60) and weighted mode MR,(61) methods less sensitive to the presence of invalid instruments and to plei…”
A multi-ethnic epigenome-wide association study of leukocyte DNA methylation and blood lipids
Jhun, M.-A., Mendelson, M., Wilson, R., Gondalia, R., Joehanes, R., Salfati, E., Zhao, X., Braun, K. V. E., Do, A. N., Hedman, Å. K., et al. (2021) · Nature Communications · doi:10.1038/s41467-021-23899-y · Cited by 48
Causal analysis between altered levels of interleukins and obstructive sleep apnea
Yi, M., Zhao, W., Fei, Q., Tan, Y., Liu, K., Chen, Z., & Zhang, Y. (2022) · Frontiers in Immunology · doi:10.3389/fimmu.2022.888644 · Cited by 48
Coffee Consumption and Cardiovascular Diseases: A Mendelian Randomization Study
Yuan, S., Carter, P., Mason, A. M., Burgess, S., & Larsson, S. C. (2021) · Nutrients · doi:10.3390/nu13072218 · Cited by 43
“Thus, we employed the weighted median approach [26] and MR-Egger regression [27] as sensitivity analyses.”
BackgroundMethodSelf-citationPhysical Activity and Risks of Cardiovascular Diseases: A Mendelian Randomization Study
Zhuo, C., Zhao, J., Chen, M., & Lu, Y. (2021) · Frontiers in Cardiovascular Medicine · doi:10.3389/fcvm.2021.722154 · Cited by 52
“Third, the MR-Egger regression method was used to evaluate the potential presence of directional pleiotropy based on its intercept term, where deviation from zero denotes pleiotropy (36).”
MethodPolygenic contribution to the relationship of loneliness and social isolation with schizophrenia
Andreu-Bernabeu, Á., Díaz‐Caneja, C. M., Costas, J., de Hoyos, L., Stella, C., Gurriarán, X., Alloza, C., Fañanás, L., Bobes, J., González-Pinto, A. M., et al. (2022) · Nature Communications · doi:10.1038/s41467-021-27598-6 · Cited by 44
Sun, L., Ding, H., Jia, Y., Shi, M., Guo, D., Yang, P., Wang, Y., Liu, F., Zhang, Y., & Zhu, Z. (2022) · Breast Cancer Research · doi:10.1186/s13058-022-01508-0 · Cited by 43
“Third, MR analysis might be biased by potential violations of standard instrumental variable assumptions [23].”
MethodLee, C., Chen, T., Lim, A. M. W., Chang, C.-C., Sie, J. J., Chen, P., Chang, S., Wu, S.-J., Hsu, C., Hsieh, A., et al. (2022) · Communications Biology · doi:10.1038/s42003-022-04168-0 · Cited by 48
Causal Relationships Between Glycemic Traits and Myopia
Li, F., Zhu, M., Shao, Y., Lü, F., Yi, Q., & Huang, X. (2023) · Investigative Ophthalmology & Visual Science · doi:10.1167/iovs.64.3.7 · Cited by 44
“For sensitivity analysis, three additional approaches based on the TwoSampleMR R package were used, including MR-Egger regression, 24 15 weighted median method, 25 and weighted mode method, 22 which allowed for the presence of horizontal pleiotropy.”
Causal effects of COVID‐19 on cancer risk: A Mendelian randomization study
Li, J., Bai, H., Qiao, H., Du, C., Yao, P., Zhang, Y., Cai, Y., Jia, Y., Wei, X., Li, C., et al. (2023) · Journal of Medical Virology · doi:10.1002/jmv.28722 · Cited by 52
“The MR‐Egger intercept analysis evaluated the horizontal pleiotropy, which means IVs affect both exposure and outcome through a pathway not mediated by causal effect.(29) The Leave‐one‐Out analysis could evaluate whether a single SNP could drive significant results, and it was conducted by removing the SNPs one by one.”
BackgroundMethodLv, X., Hu, Z., Liang, F., Liu, S., Gong, H., Du, J., Deng, X., Qian, J., Nie, Q., & Luo, J. (2023) · Frontiers in Neurology · doi:10.3389/fneur.2023.1178051 · Cited by 49
“TheMR-Egger regression assumes that all IVs are invalid IVs, and the estimation accuracy of this method is relatively low (28, 29).”
MethodMendelian randomization supports causality between overweight status and accelerated aging
Chen, Z., Chen, Z., & Jin, X. (2023) · Aging Cell · doi:10.1111/acel.13899 · Cited by 50
“Although the IVW method showed a causal link between BFFM and FI, the MR- Egger method showed an opposite direction, suggesting that the causality was invalid (Bowden et al., 2015).”
BackgroundMethodZhao, G., Lu, Z., Sun, Y., Kang, Z., Feng, X., Liao, Y., Sun, J., Zhang, Y., Huang, Y., & Yue, W. (2023) · Translational Psychiatry · doi:10.1038/s41398-023-02492-5 · Cited by 53
Zhou, S., Wei, T., Liu, X., Liu, Y., Song, W., Que, X., Xing, Y., Wang, Z., & Tang, Y. (2023) · BMC Medicine · doi:10.1186/s12916-023-02952-1 · Cited by 45
“The weighted median approach provides consistent effect estimates when < 50% of the genetic variants are invalid [36], whereas the MR-Egger method provided estimates after correcting for pleiotropic effects, although at the cost of lower statistical power [37].”
BackgroundChen, Y., Xie, Y., Ci, H., Cheng, Z., Kuang, Y., Li, S., Wang, G., Qi, Y., Tang, J., Liu, D., et al. (2024) · BMC Medicine · doi:10.1186/s12916-024-03272-8 · Cited by 48
“…Pleiotropy RESidual Sum and Outlier (MR-PRESSO) to detect and correct for horizontal pleiotropy and outliers, conducted leave-one-out (LOO) analyses to evaluate the presences of predominant IVs, and performed reverse MR analyses to determine the possibility of reverse causation [24–26].”
MethodLi, Y., Wang, X., Zhang, Z., Shi, L., Cheng, L., & Zhang, X. (2024) · Frontiers in Immunology · doi:10.3389/fimmu.2024.1348347 · Cited by 51
“We identi fi ed 95 associations of gut microbiota to metabolites (BMI, 41; WHR, 31; WHRadjBMI, 9; Obesity class 1, 8; Obesity class 2, 5; Obesity class 3, 1), 10 associations to cells (WHR, 2; WHRadjBMI, 4; Obesity class 1, 1; Obesity class 2, 1; Obesity class 3, 2), and 2 associations to cytokines…”
BackgroundGenetic determinants of serum vitamin B12 and their relation to body mass index
Allin, K. H., Friedrich, N., Pietzner, M., Grarup, N., Thuesen, B. H., Linneberg, A. R., Pisinger, C. H., Hansen, T. F., Pedersen, O. B., & Sandholt, C. H. (2016) · European Journal of Epidemiology · doi:10.1007/s10654-016-0215-x · Cited by 48
“Pleiotropy was evaluated by the MR-Egger test which tests whether the intercept differs from zero and by visually inspecting Funnel plots for asymmetry [26].”
MethodCausal association of body mass index with hypertension using a Mendelian randomization design
Lee, M.-R., Lim, Y.-H., & Hong, Y. (2018) · Medicine · doi:10.1097/md.0000000000011252 · Cited by 46
Zwakenberg, S. R., Remmelzwaal, S., Beulens, J. W. J., Booth, S. L., Burgess, S., Dashti, H. S., Imamura, F., Feskens, E. J. M., van der Schouw, Y. T., & Sluijs, I. (2018) · Diabetes · doi:10.2337/db18-0543 · Cited by 45
Self-citationEducational attainment and drinking behaviors: Mendelian randomization study in UK Biobank
Zhou, T., Sun, D., Li, X., Ma, H., Heianza, Y., & Qi, L. (2019) · Molecular Psychiatry · doi:10.1038/s41380-019-0596-9 · Cited by 52
“MR-Egger intercept [32] and MR pleiotropy residual sum and outlier (MR-PRESSO) [33] were used to test for the”
MethodKraft, P. L., Chen, H., & Lindström, S. (2020) · Current Epidemiology Reports · doi:10.1007/s40471-020-00233-6 · Cited by 50
Garfield, V., Farmaki, A., Fatemifar, G., Eastwood, S. V., Mathur, R., Rentsch, C. T., Denaxas, S., Bhaskaran, K., Smeeth, L. L., & Chaturvedi, N. (2021) · Diabetes · doi:10.2337/db20-0895 · Cited by 47
Unhealthy Behaviours and Risk of Parkinson’s Disease: A Mendelian Randomisation Study
Heilbron, K., Jensen, M. P., Bandrés‐Ciga, S., Fontanillas, P., Blauwendraat, C., Nalls, M. A., Singleton, A., Smith, G. D., Cannon, P., & Noyce, A. J. (2021) · Journal of Parkinson s Disease · doi:10.3233/jpd-202487 · Cited by 48
Bond, T. A., Richmond, R. C., Karhunen, V., Cuéllar-Partida, G., Borges, M. C., Zuber, V., Alves, A. C., Mason, D., Yang, T., Gunter, M. J., et al. (2022) · BMC Medicine · doi:10.1186/s12916-021-02216-w · Cited by 48
“We also tested for evidence of between-SNP MR estimate heterogeneity (Cochran’s Q test) and used MR Egger regression [74] to investigate horizontal pleiotropy, for the analyses based on GWS SNPs.”
MethodThe relationships between women’s reproductive factors: a Mendelian randomisation analysis
Prince, C., Sharp, G. C., Howe, L. D., Fraser, A., & Richmond, R. C. (2022) · BMC Medicine · doi:10.1186/s12916-022-02293-5 · Cited by 50
“Nonetheless, the MR-Egger test can be underpowered, especially when few instruments are available.”
MethodInfluentialDempsey, P. C., Musicha, C., Rowlands, A. V., Davies, M. J., Khunti, K., Razieh, C., Timmins, I. R., Zaccardi, F., Codd, V., Nelson, C. P., et al. (2022) · Communications Biology · doi:10.1038/s42003-022-03323-x · Cited by 50
Kamiza, A. B., Fatumo, S., Singini, M. G., Yeh, C., & Chikowore, T. (2022) · EBioMedicine · doi:10.1016/j.ebiom.2022.104003 · Cited by 48
“Our MR analyses were performed using the inverse-variance weighted (IVW) method, which provides accurate estimates when there is no heterogeneity and directional pleiotropy between the exposure and outcome variable.20 The heterogeneity of causal association between chronic HBV infection and extrahepatic cancers were i…”
InfluentialXiao, Y., Jing, D., Tang, Z., Peng, C., Yin, M., Liu, H., Chen, X., & Shen, M. (2022) · Journal of Investigative Dermatology · doi:10.1016/j.jid.2022.06.015 · Cited by 44
Inverse Association Between Serum 25-Hydroxyvitamin D and Nonalcoholic Fatty Liver Disease
Yuan, S., & Larsson, S. C. (2022) · Clinical Gastroenterology and Hepatology · doi:10.1016/j.cgh.2022.01.021 · Cited by 46
“05 for intercept indicates pleiotropy) and generate estimates after correcting for pleiotropic effects although the method consumes statistical power.(33) The MR-PRESSO method can identify possible outliers and provide causal estimates after removal of outlying instrumental variables.”
MethodBlood Leukocyte Counts in Alzheimer Disease
Luo, J. M., Thomassen, J. Q., Nordestgaard, B. G., Tybjærg‐Hansen, A., & Frikke‐Schmidt, R. (2022) · JAMA Network Open · doi:10.1001/jamanetworkopen.2022.35648 · Cited by 47
Nethander, M., Coward, E., Reimann, E., Grahnemo, L., Gabrielsen, M. E., Wibom, C., Nelis, M., Milani, L. A., Esko, T., Metspalu, A., et al. (2022) · Cell Reports Medicine · doi:10.1016/j.xcrm.2022.100776 · Cited by 49
Obesity, Fat Distribution and Risk of Cancer in Women and Men: A Mendelian Randomisation Study
Loh, N. Y., Wang, W., Noordam, R., & Christodoulides, C. (2022) · Nutrients · doi:10.3390/nu14245259 · Cited by 52
“Since this is often not the case, we also performed sensitivity analyses which are more robust to potential pleiotropy of the genetic variants used in the analyses, including the MR-Egger regression [26], weighted-median estimator [27], and MR-PRESSO (MR Pleiotropy RESidual Sum and Outlier) [28].”
MethodGut microbiota and atopic dermatitis: a two-sample Mendelian randomization study
Xue, Y., Zhang, L., Chen, Y., Wang, H., & Xie, J. (2023) · Frontiers in Medicine · doi:10.3389/fmed.2023.1174331 · Cited by 51
Genetic insights into ossification of the posterior longitudinal ligament of the spine
Koike, Y., Takahata, M., Nakajima, M., Otomo, N., Suetsugu, H., Liu, X., Endo, T., Imagama, S., Kobayashi, K., Kaito, T., et al. (2023) · eLife · doi:10.7554/elife.86514 · Cited by 46
Li, H., & Li, C. (2023) · Frontiers in Microbiology · doi:10.3389/fmicb.2023.1184734 · Cited by 52
Sun, K., Gao, Y., Wu, H., & Huang, X. (2023) · Frontiers in Public Health · doi:10.3389/fpubh.2023.1255059 · Cited by 49
Fei, Y., Yu, H., Wu, Y., & Gong, S. (2024) · Arthritis Research & Therapy · doi:10.1186/s13075-024-03266-0 · Cited by 49
“MR-Egger is a Mendelian randomization approach that summarizes data to test the robustness of outcomes [37].”
MethodChen, J., Yu, X., Wu, X., Chai, K., & Wang, S. (2024) · Journal of Cancer · doi:10.7150/jca.92699 · Cited by 48
“Among five methods ("MR Egger" [22], "Weighted median" [23] "Inverse variance weighted (IVW)" [24], "Simple mode" [25] and "Weighted mode" [23]) in MR analysis, IVW was the primary method for causal estimation due to it was the most precise and robust way.”
MethodThe genetic landscape of substance use disorders
Gerring, Z. F., Thorp, J. G., Treur, J. L., Verweij, K. J. H., & Derks, E. M. (2024) · Molecular Psychiatry · doi:10.1038/s41380-024-02547-z · Cited by 62
Obesity and Bone Health Revisited: A Mendelian Randomization Study for Koreans
Lee, S. J., Lee, J., & Sung, J. (2019) · Journal of Bone and Mineral Research · doi:10.1002/jbmr.3678 · Cited by 55
Zekavat, S. M., Aragam, K., Emdin, C., Khera, A. V., Klarin, D., Zhao, H., & Natarajan, P. (2019) · Arteriosclerosis, Thrombosis, and Vascular Biology · doi:10.1161/atvbaha.119.312626 · Cited by 42
Harris, H. R., Cushing-Haugen, K. L., Webb, P. M., Nagle, C. M., Jordan, S. J., Australian Ovarian Cancer Study Group, Risch, H. A., Rossing, M. A., Doherty, J. A., Goodman, M. T., et al. (2019) · International Journal of Epidemiology · doi:10.1093/ije/dyz113 · Cited by 42
Wang, Q., Wang, Y., Lehto, K., Pedersen, N. L., Williams, D. M., & Hägg, S. (2019) · EBioMedicine · doi:10.1016/j.ebiom.2019.07.007 · Cited by 44
“The inverse-variance weighted (IVW), MR-Egger regression, weightedmedian andweightedmode estimators weremainly reported in the MR analyses [19,21].”
MethodCerani, A., Zhou, S., Forgetta, V., Morris, J. A., Trajanoska, K., Rivadeneira, F., Larsson, S. C., Michaëlsson, K., & Richards, J. B. (2019) · BMJ · doi:10.1136/bmj.l4410 · Cited by 49
Major depression and small vessel stroke: a Mendelian randomization analysis
Cai, H., Cai, B., Zhang, H., Sun, W., Wang, Y., Zhou, S., Ye, Z., Zhang, Z., & Liang, J. (2019) · Journal of Neurology · doi:10.1007/s00415-019-09511-w · Cited by 43
Wainberg, M., Mahajan, A., Kundaje, A., McCarthy, M. I., Ingelsson, E., Sinnott-Armstrong, N., & Rivas, M. A. (2019) · PLOS Medicine · doi:10.1371/journal.pmed.1002982 · Cited by 41
“Within each subset of individuals, as well as in the full cohort, we performed inverse-variance-weighted Mendelian randomization (MR) and MR–Egger regression [22] and used the MR–Egger intercept test to assess the impact of horizontal pleiotropy.”
MethodFani, L., Georgakis, M. K., Ikram, M. A., Ikram, M. K., Malik, R., & Dichgans, M. (2021) · Translational Psychiatry · doi:10.1038/s41398-021-01400-z · Cited by 47
Review of Mendelian Randomization Studies on Ovarian Cancer
Guo, J.-Z., Xiao, Q., Gao, S., Li, X., Wu, Q., & Gong, T. (2021) · Frontiers in Oncology · doi:10.3389/fonc.2021.681396 · Cited by 59
“It can be used to detect bias that results from horizontal pleiotropy based on the assumption that any pleiotropic effects from IVs on the outcome are independent of the exposure (113).”
BackgroundAdiposity and cancer: a Mendelian randomization analysis in the UK biobank
Ahmed, M. B., Mulugeta, A., Lee, S., Mäkinen, V., Boyle, T., & Hyppönen, E. (2021) · International Journal of Obesity · doi:10.1038/s41366-021-00942-y · Cited by 49
“To test for violations in the third assumption, we performed MR-Egger pleiotropy [56] and MRPRESSO outlier tests [31].”
MethodGuida, F., Tan, V. Y., Corbin, L. J., Smith-Byrne, K., Alcala, K., Langenberg, C., Stewart, I. D., Butterworth, A. S., Surendran, P., Achaintre, D., et al. (2021) · PLoS Medicine · doi:10.1371/journal.pmed.1003786 · Cited by 41
Multiple Sclerosis and the Risk of Cardiovascular Diseases: A Mendelian Randomization Study
Yang, F., Hu, T., He, K., Ying, J., & Cui, H. (2022) · Frontiers in Immunology · doi:10.3389/fimmu.2022.861885 · Cited by 54
A proteogenomic signature of age-related macular degeneration in blood
Emilsson, V., Gudmundsson, E. F., Jónmundsson, Þ., Jonsson, B. G., Twarog, M., Guðmundsdóttir, V., Li, Z., Finkel, N., Poor, S. H., Liu, X., et al. (2022) · Nature Communications · doi:10.1038/s41467-022-31085-x · Cited by 44
Benn, M., Emanuelsson, F., Tybjærg-Hansen, A., & Nordestgaard, B. G. (2021) · Diabetologia · doi:10.1007/s00125-021-05436-0 · Cited by 41
Life Course Adiposity and Amyotrophic Lateral Sclerosis: A Mendelian Randomization Study
Zhang, L., Tang, L., Huang, T., & Fan, D. (2020) · Annals of Neurology · doi:10.1002/ana.25671 · Cited by 40
“003) between BF% and ALS, which was mainly due to the genetic variants significantly associated with BF% (6 of 11 SNPs: rs1558902, rs4788099, rs543874, rs6567160, rs6738627, rs6755502) having similar associations with BMI but no association with ALS (see Supplementary Table 5).(22) Therefore, the 6 SNPs are valid inst…”
BackgroundTan, J., Ren, J., Fan, L., Wei, Y., Hu, S., Zhu, S., Yang, Y., & Cai, J. (2022) · Frontiers in Cellular and Infection Microbiology · doi:10.3389/fcimb.2022.884298 · Cited by 49
“, 2017) and MR-Egger method (Bowden et al., 2015) were used for further sensitivity analysis to reduce the bias due to horizontal pleiotropy.”
MethodHirtz, R., Hars, C., Naaresh, R., Laabs, B., Antel, J., Grasemann, C., Hinney, A., Hebebrand, J., & Peters, T. (2022) · Frontiers in Genetics · doi:10.3389/fgene.2022.918584 · Cited by 47
From classical mendelian randomization to causal networks for systematic integration of multi-omics
Yazdani, A., Yazdani, A., Méndez-Giráldez, R., Samiei, A., Kosorok, M. R., & Schaid, D. J. (2022) · Frontiers in Genetics · doi:10.3389/fgene.2022.990486 · Cited by 42
“An IV is valid under the following assumptions (Bowden et al., 2015): 1.”
BackgroundMethodSchmidt, A. F., Bourfiss, M., Alasiri, A., Anton, E. P., Chopade, S., van Vugt, M., van der Laan, S. W., Groß, C., Clarkson, C., Henry, A., et al. (2023) · Science Advances · doi:10.1126/sciadv.add4984 · Cited by 47
“MR analyses were conducted using the GLS implementation of the inverse-variance weighted (IVW) estimator, as well as with an Egger correction protecting against horizontal pleiotropy ( 48 ).”
Ren, F., Jin, Q., Liu, T., Ren, X., & Zhan, Y. (2023) · Frontiers in Cellular and Infection Microbiology · doi:10.3389/fcimb.2023.1171517 · Cited by 51
“, 2017); if the number of SNPs with pleiotropy exceeds 50%, the results of MR-Egger inference are still robust (Bowden et al., 2015).”
BackgroundYeung, C. H. C., Yeung, S. L. A., Kwok, M. K., Zhao, J. V., & Schooling, C. M. (2023) · European Journal of Epidemiology · doi:10.1007/s10654-023-01015-2 · Cited by 48
Genetic underpinning of the comorbidity between type 2 diabetes and osteoarthritis
Arruda, A. L., Hartley, A. E., Katsoula, G., Smith, G. D., Morris, A. P., & Zeggini, E. (2023) · The American Journal of Human Genetics · doi:10.1016/j.ajhg.2023.06.010 · Cited by 52
“Horizontal pleiotropy was assessed through the intercept of the MR-Egger regression.(37) To account for multiple testing, p values were adjusted via the FDR approach.”
Method
Metadata
- Authors
- Bowden, J., Davey Smith, G., & Burgess, S.
- Affiliations
- University of Cambridge (GB)
- Corresponding author
- Bowden, J.
- Venue
- International Journal of Epidemiology
- Publisher
- Oxford University Press (OUP)
- Published
- 2015-04-01
- Volume
- 44
- Issue
- 2
- Pages
- 512-525
- ISSN
- 0300-5771 (ISSN-L)
- 1464-3685
- PMC
- PMC4469799
- OpenAlex
- W2113699335
- Cited by
- 9,816
- References
- 50
- Citations by year
- 2026: 937 · 2025: 1929 · 2024: 2977 · 2023: 1482 · 2022: 797 · 2021: 590 · 2020: 379 · 2019: 283 · 2018: 205 · 2017: 123 · 2016: 88 · 2015: 21
- FWCI
- 100.13
- Type
- journal article
- Language
- en
- Open access
- hybrid
- doi.org
- Licence
- cc-by
- Locations
- International Journal of Epidemiology (publishedVersion, cc-by)
- PubMed Central (publishedVersion, cc-by)
- PubMed (publishedVersion)
- Bristol Research (University of Bristol) (submittedVersion, cc-by)
- Apollo (University of Cambridge) (submittedVersion, cc-by)
- Explore Bristol Research (submittedVersion, cc-by)
- Funders
- Wellcome Trust (MC_UU_12013_8, 100114)
- National Institute for Health and Care Research (NF-SI-0512-10165)
- British Heart Foundation (SP/08/007/23628, RG/08/014/24067)
- University of Bristol (MC_UU_12013/2)
- Medical Research Council (MC_UU_12013_2, MC_UU_12013_5, MR/N501906/1, MC UU 12013/8, MR/L012286/1, MR/L003120/1)
- Topics
- Life Sciences › Biochemistry, Genetics and Molecular Biology › Genetics › Genetic Associations and Epidemiology
- Physical Sciences › Mathematics › Statistics and Probability › Advanced Causal Inference Techniques
- Social Sciences › Decision Sciences › Statistics, Probability and Uncertainty › Meta-analysis and systematic reviews
- Keywords
- Mendelian randomization, invalid instruments, pleiotropy, MR-Egger, small-study bias, multiple instruments, causal effect estimation, bias detection, sensitivity analysis
- MeSH terms
- Blood Pressure, Body Height, Coronary Artery Disease, Humans, Models, Biological, Regression Analysis, Respiration, Statistics as Topic, Genetic Variation, Meta-Analysis as Topic, Bias, Causality, Risk Assessment, Mendelian Randomization Analysis, Genetic Pleiotropy
About these checks
Registry, retraction, Cites and statistics results are computed, not judged, with one exception: a printed reference that no index lists is read once by a model before it counts as a citation error. Claims are extracted by a model and kept only when their quote appears verbatim in the text; each cited source is then checked, with a model’s help, for whether it says what the claim relies on. Those verdicts can be wrong — read the claim’s quote and the cited source before relying on one.
Statistics and arithmetic are recomputed, not judged.
Confidence bands are shown only for fields calibrated on our annotated test set. None is calibrated yet, so no band is shown.
What counts as a claim ›How we measure confidence ›How we check this ›
Are you an author, or do you see a problem with this page? Request a review
Data sources
Bibliographic data: Semantic Scholar, OpenAlex, Crossref.
Contains information from the Semantic Scholar Academic Graph Datasets, made available under the ODC Attribution License (ODC-BY 1.0).
Semantic Scholar’s data is described in: Kinney, R., et al. (2023). The Semantic Scholar Open Data Platform. arXiv:2301.10140.
