

Mendelian randomization with invalid instruments: effect estimation and bias detection through Egger regression
Open accessThe DOI matches its Crossref record; 50 of the 50 references it cites were found in a registry or an index.
Abstract
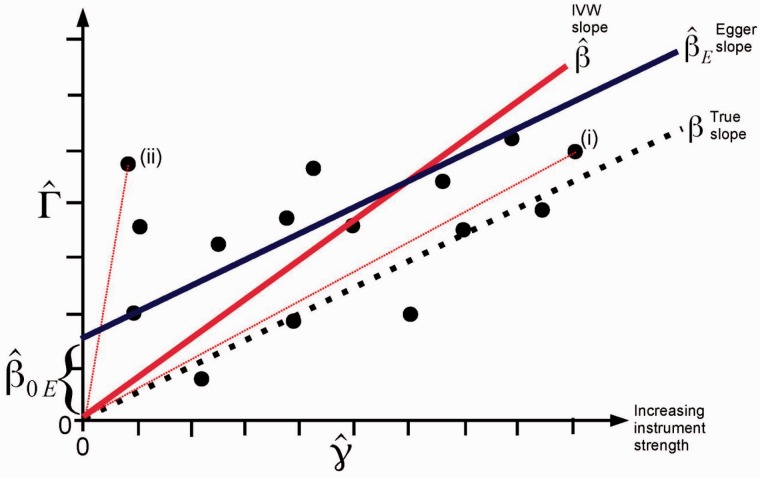
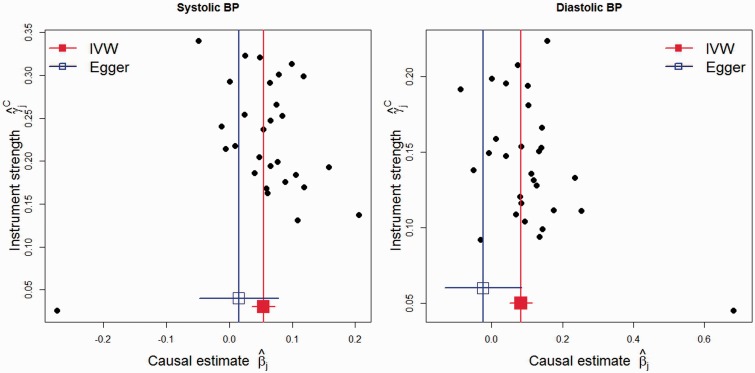
BACKGROUND: The number of Mendelian randomization analyses including large numbers of genetic variants is rapidly increasing. This is due to the proliferation of genome-wide association studies, and the desire to obtain more precise estimates of causal effects. However, some genetic variants may not be valid instrumental variables, in particular due to them having more than one proximal phenotypic correlate (pleiotropy). METHODS: We view Mendelian randomization with multiple instruments as a meta-analysis, and show that bias caused by pleiotropy can be regarded as analogous to small study bias. Causal estimates using each instrument can be displayed visually by a funnel plot to assess potential asymmetry. Egger regression, a tool to detect small study bias in meta-analysis, can be adapted to test for bias from pleiotropy, and the slope coefficient from Egger regression provides an estimate of the causal effect. Under the assumption that the association of each genetic variant with the exposure is independent of the pleiotropic effect of the variant (not via the exposure), Egger's test gives a valid test of the null causal hypothesis and a consistent causal effect estimate even when all the genetic variants are invalid instrumental variables. RESULTS: We illustrate the use of this approach by re-analysing two published Mendelian randomization studies of the causal effect of height on lung function, and the causal effect of blood pressure on coronary artery disease risk. The conservative nature of this approach is illustrated with these examples. CONCLUSIONS: An adaption of Egger regression (which we call MR-Egger) can detect some violations of the standard instrumental variable assumptions, and provide an effect estimate which is not subject to these violations. The approach provides a sensitivity analysis for the robustness of the findings from a Mendelian randomization investigation.
Overview
The claims and statistics of this paper haven’t been checked yet.
Free: it reads the open-access text and checks the first 5 claims that cite a source we can check. Create a free account to check every claim.
Integrity signals
Registry
Cites
Statistics
Figures


Verification
Claims the paper makes
The claims and statistics of this paper haven’t been checked yet.
Free: it reads the open-access text and checks the first 5 claims that cite a source we can check. Create a free account to check every claim.
Claims other papers make about this one
Each is checked against this paper’s own text: does it say what the citing paper says it does?
The cited source doesn’t support the claim as written.
In the citing paper
“These analyses showed no major deviations and did not change conclusions from the main instrumental variable findings.”
From Plasma levels of apolipoprotein E, APOE genotype, and all-cause and cause-specific mortality in 105 949 individuals from a white general population cohort (2019) · cites this paper as [67]
Checked by a reasoning model — may be wrong.
Experimental — accuracy not yet measuredThe source backs part of the claim, not all of it — or backs it for a different population, condition or comparison.
In the citing paper
“Similarly, violation of the ‘exclusion restriction criteria’33–37 could bias causal estimates in IV analyses when used to test effects of intermediates in RCTs or when used in observational data (including MR)”
From Triangulation in aetiological epidemiology (2017) · cites this paper as [36]
Experimental — accuracy not yet measuredThe source backs part of the claim, not all of it — or backs it for a different population, condition or comparison.
In the citing paper
“Furthermore the MR-Egger test, 9 which the authors used to test violation of the exclusion restriction criteria, cannot be used to differentiate effects of adult from child BMI, as Gao and colleagues acknowledge. This is because MR-Egger is only valid if the effect of the genetic instrument on the risk factor of interest is independent of its effect on any other phenotypes that might violate that”
From Commentary: Two-sample Mendelian randomization: opportunities and challenges (2016) · cites this paper as [9]
Experimental — accuracy not yet measuredThe source backs part of the claim, not all of it — or backs it for a different population, condition or comparison.
In the citing paper
“Egger MR was performed to determine the presence of unmeasured pleiotropy70.”
From Integrative genomic analyses identify candidate causal genes for calcific aortic valve stenosis involving tissue-specific regulation (2024) · cites this paper as [70]
Experimental — accuracy not yet measuredThe cited source says what the claim attributes to it.
In the citing paper
“Because MR is relatively novel there has been considerable focus on its limitations and methods for testing and dealing with these, in particular for dealing with violation of the exclusion restriction criteria due to genuine pleiotropy.36,37”
From Triangulation in aetiological epidemiology (2017) · cites this paper as [36]
8 more claims about this paper
Create a free account to see every claim other papers make about this one.
Self-check
Percentages, sums and reported differences re-computed from the paper’s own numbers.
The self-check needs the paper’s full text.
Citations
Cites
Measuring inconsistency in meta-analyses
Higgins, J. P. T., Thompson, S. G., Deeks, J. J., & Altman, D. G. (2003) · BMJ · doi:10.1136/bmj.327.7414.557 · Cited by 63,139
Bias in meta-analysis detected by a simple, graphical test
Egger, M., Smith, G. D., Schneider, M., & Minder, C. (1997) · BMJ · doi:10.1136/bmj.315.7109.629 · Cited by 56,722
Self-citationRegression shrinkage and selection via the lasso
Tibshirani, R. (1996) · Journal of the Royal Statistical Society Series B: Statistical Methodology · doi:10.1111/j.2517-6161.1996.tb02080.x · Cited by 51,482
Duval, S., & Tweedie, R. (2000) · Biometrics · doi:10.1111/j.0006-341x.2000.00455.x · Cited by 14,099
Borenstein, M., Hedges, L. V., Higgins, J. P. T., & Rothstein, H. R. (2021) · doi:10.1002/9781119558378 · Cited by 9,799
Sterne, J. A. C., Sutton, A. J., Ioannidis, J. P. A., Terrin, N., Jones, D. R., Lau, J., Carpenter, J., Rucker, G., Harbord, R. M., Schmid, C. H., et al. (2011) · BMJ · doi:10.1136/bmj.d4002 · Cited by 7,709 · cited 1×
“The general phenomenon is therefore prudently referred to under the umbrella term of ‘small study’ bias.(11,13,14) In the context of Mendelian randomization with multiple instruments, we equate the precision of a single study’s estimate with the strength of a single instrument.”
BackgroundInstrumental Variables Regression with Weak Instruments
Staiger, D., & Stock, J. H. (1997) · Econometrica · doi:10.2307/2171753 · Cited by 7,081
Mendelian Randomization Analysis With Multiple Genetic Variants Using Summarized Data
Burgess, S., Butterworth, A., & Thompson, S. G. (2013) · Genetic Epidemiology · doi:10.1002/gepi.21758 · Cited by 6,050 · cited 1×
“It has been shown that Mendelian randomization analyses based on summarized data are as efficient as those based on individual-level data.(23) Other tools from the meta-analysis literature include methods for bias adjustment, such as the trim-and-fill method,(45) and the use of pseudo-data.”
MethodSelf-citationDavey Smith, G., & Ebrahim, S. (2003) · International Journal of Epidemiology · doi:10.1093/ije/dyg070 · Cited by 5,882 · cited 2×
“We are particularly interested in the coverage properties of the estimators with a null causal effect, and the power of estimators with a positive causal effect, as salient findings from Mendelian randomization investigations are not only the magnitude of the causal effect—or indeed whether such can be estimated—but a…”
BackgroundInstrumental Variables Regression with Weak Instruments
Staiger, D., & Stock, J. (1994) · doi:10.3386/t0151 · Cited by 5,302 · cited 1×
“With many IVs in a one-sample setting (genetic variants, exposure and outcome measured in the same participants), IV estimates (particularly those from the TSLS method) are biased in the direction of the observational association between the exposure and the outcome.(49) This bias depends on the strength of the associ…”
Method
Research works printed but not linked: 12
- 2014, Human Molecular Genetics, 23, 89, 10.1093/hmg/ddu328 · DOI · Paper page
- 2010, Clinical Chemistry, 56, 723, 10.1373/clinchem.2009.141564 · DOI · Paper page
- 2015, International Journal of Epidemiology, 44, 496, 10.1093/ije/dyv071 · DOI · Paper page
- 2013, International Journal of Epidemiology, 42, 1157, 10.1093/ije/dyt110 · DOI · Paper page
- 2013, International Journal of Epidemiology, 42, 1497, 10.1093/ije/dyt179 · DOI · Paper page
- 2013, International Journal of Epidemiology, 42, 1134, 10.1093/ije/dyt093 · DOI · Paper page
- 2015, Statistics in medicine, 34, 454, 10.1002/sim.6358 · DOI · Paper page
- 2013, International Journal of Epidemiology, 42, 111, 10.1093/ije/dys064 · DOI · Paper page
- 2014, Economics and human biology, 13, 99, 10.1016/j.ehb.2013.12.002 · DOI · Paper page
- 2011, International Journal of Epidemiology, 40, 755, 10.1093/ije/dyr036 · DOI · Paper page
- 2013, American Journal of Epidemiology, 178, 1177, 10.1093/aje/kwt084 · DOI · Paper page
- Angrist J Pischke J-S Instrumental variables in action: sometimes you get whatyou need. In: Mostly Harmless Econometrics: An Empiricist’scompanion. Princeton, NJ: Princeton University Press, 2009.
Cited by
Items 601–700 of 1,058
Richardson, T. G., Crouch, D. J. M., Power, G. M., Morales-Berstein, F., Hazelwood, E., Fang, S., Cho, Y., Inshaw, J. R. J., Robertson, C. C., Sidore, C., et al. (2022) · Nature Communications · doi:10.1038/s41467-022-29932-y · Cited by 65
Exploring the Effectiveness and Moderators of Augmented Reality on Science Learning: a Meta-analysis
Xu, W., Su, C., Hu, Y., & Chen, C.-H. (2022) · Journal of Science Education and Technology · doi:10.1007/s10956-022-09982-z · Cited by 110
“…2000) was used to evaluate publication bias by measuring the number of missed studies, producing a modified mean effect size by adding the missing studies on the skewed side; moreover, the Egger’s regression (Bowden et al., 2015) intercept was used to detect small study bias in this meta-analysis.”
MethodFrancis, C., Futschik, M. E., Huang, J. V., Bai, W., Sargurupremraj, M., Teumer, A., Breteler, M. M. B., Petretto, E. G., Ho, A. S. R., Amouyel, P., et al. (2022) · Nature Communications · doi:10.1038/s41467-022-32219-x · Cited by 74
Osteoporosis and sarcopenia-related traits: A bi-directional Mendelian randomization study
Liu, C., Liu, N., Xia, Y., Zhao, Z., Xiao, T., & Li, H. (2022) · Frontiers in Endocrinology · doi:10.3389/fendo.2022.975647 · Cited by 73
“Valid MR analysis is based on three assumptions: (1) the used genetic IVs are robustly associated with exposure; (2) the selected IVs are not associated with potential confounders; and (3) the IVs can only affect the risk of outcome dependently through exposure (10).”
MethodMendelian randomization as a tool to inform drug development using human genetics
Daghlas, I., & Gill, D. (2023) · Cambridge Prisms Precision Medicine · doi:10.1017/pcm.2023.5 · Cited by 72
“For example, numerous sensitivity analyses have been developed that provide results that are robust to inclusion of variants that affect the outcome through pathways unrelated to the exposure (Bowden et al., 2015, 2016).”
BackgroundAlzheimer Disease and Epilepsy: A Mendelian Randomization Study
Fang, Y., Si, X., Wang, J., Wang, Z., Chen, Y., Liu, Y., Yan, Y., Tian, J., Zhang, B., & Pu, J. (2023) · Neurology · doi:10.1212/wnl.0000000000207423 · Cited by 79
Mingdong, W., Gao, X., Yongjun, Q., Mingshuai, W., & Hao, P. (2023) · BMC Cancer · doi:10.1186/s12885-023-11383-3 · Cited by 72
“The p -value of MR-Egger intercept test functioned as an indicator of the horizontal pleiotropy (statistically significant if p 0.05) [28].”
BackgroundInfluentialMendelian Randomization: Applications and Limitations in Epigenetic Studies
Relton, C. L., & Smith, G. D. (2015) · Epigenomics · doi:10.2217/epi.15.88 · Cited by 72
Causal associations between body mass index and mental health: a Mendelian randomisation study
van den Broek, N., Treur, J. L., Larsen, J. K., Verhagen, M., Verweij, K. J. H., & Vink, J. M. (2018) · Journal of Epidemiology and Community Health · doi:10.1136/jech-2017-210000 · Cited by 66
Belbasis, L., Bellou, V., Εvangelou, Ε., & Tzoulaki, I. (2019) · Multiple Sclerosis Journal · doi:10.1177/1352458519872664 · Cited by 79
Jiang, F.-H., Liu, X.-M., Yu, H.-R., Qian, Y., & Chen, H.-L. (2022) · The International Journal of Lower Extremity Wounds · doi:10.1177/1534734620929892 · Cited by 65
Gill, D., Karhunen, V., Malik, R., Dichgans, M., & Sofat, N. (2021) · Osteoarthritis and Cartilage · doi:10.1016/j.joca.2020.12.015 · Cited by 79
“5 median MR as sensitivity analyses (21-23).”
BackgroundMethodXue, A., Jiang, L., Zhu, Z., Wray, N. R., Visscher, P. M., Zeng, J., & Yang, J. (2021) · Nature Communications · doi:10.1038/s41467-020-20237-6 · Cited by 65
Childhood Obesity and Risk of Stroke: A Mendelian Randomisation Analysis
Zou, X., Wang, S., Wang, L., Xiao, L., Yao, T., Zeng, Y., & Zhang, L. (2021) · Frontiers in Genetics · doi:10.3389/fgene.2021.727475 · Cited by 80
“, 2016), MR-Egger regression method (Bowden et al., 2015), MR Pleiotropy RESidual Sum and Outlier (MR-PRESSO) (Verbanck et al.”
BackgroundMethodSystemic Lupus Erythematosus and Cardiovascular Disease: A Mendelian Randomization Study
Gao, N., Kong, M., Li, X., Wei, D., Zhu, X., Hong, Z., Ni, M., Wang, Y., & Dong, A. (2022) · Frontiers in Immunology · doi:10.3389/fimmu.2022.908831 · Cited by 75
“At the same time, median weighting (27), MR-Egger (28), Maximumlikelihood (29), MR-robust adjusted profile score (MR-RAPS) (30), and MR-pleiotropy residual sum and outlier (MR-PRESSO) (31) were used to infer the causal relationship.”
MethodLuo, J. M., le Cessie, S., Blauw, G. J., Franceschi, C., Noordam, R., & van Heemst, D. (2022) · GeroScience · doi:10.1007/s11357-022-00602-7 · Cited by 75
Luo, M., Cai, J., Luo, S., Hong, X., Xu, L., Lin, H., Chen, X., & Fu, W. (2023) · Frontiers in Cellular and Infection Microbiology · doi:10.3389/fcimb.2023.1142140 · Cited by 71
Gibson, M., Munafo, M. R., Taylor, A. E., & Treur, J. L. (2018) · Nicotine & Tobacco Research · doi:10.1093/ntr/nty230 · Cited by 66
A genetic perspective on the relationship between eudaimonic –and hedonic well-being
Baselmans, B. M. L., & Bartels, M. (2018) · Scientific Reports · doi:10.1038/s41598-018-32638-1 · Cited by 91
Body mass index and breast cancer survival: a Mendelian randomization analysis
Guo, Q., Burgess, S., Turman, C., Bolla, M. K., Wang, Q., Lush, M., Abraham, J., Aittomäki, K., Andrulis, I. L., Apicella, C., et al. (2017) · International Journal of Epidemiology · doi:10.1093/ije/dyx131 · Cited by 64
“The role of directional pleiotropy was assessed using Egger regression on the summary statistics of association for each BMI-associated SNP with survival.(22) Egger regression is a modified form of standard inversevariance weighted meta-analysis.”
MethodSelf-citationImpact of atopy on risk of glioma: a Mendelian randomisation study
Disney-Hogg, L., Cornish, A. J., Sud, A., Law, P. J., Kinnersley, B., Jacobs, D. I., Ostrom, Q. T., Labreche, K., Eckel-Passow, J. E., Armstrong, G. N., et al. (2018) · BMC Medicine · doi:10.1186/s12916-018-1027-5 · Cited by 64
“Through simulation scenarios, the IVW, MLE, WME, MBE and MR-Egger methods have been demonstrated to accurately estimate causal effects using summary-level data [28, 30, 31, 45].”
MethodJiang, X., Dimou, N. L., Al-Dabhani, K. M., Lewis, S. J., Martin, R. M., Haycock, P., Gunter, M. J., Key, T. J., Eeles, R. A., Muir, K. R., et al. (2018) · International Journal of Epidemiology · doi:10.1093/ije/dyy284 · Cited by 72
Timmins, I. R., Zaccardi, F., Nelson, C. P., Franks, P. W., Yates, T. E., & Dudbridge, F. (2020) · Communications Biology · doi:10.1038/s42003-020-01357-7 · Cited by 69
Kalaoja, M., Corbin, L. J., Tan, V. Y., Ahola‐Olli, A., Havulinna, A. S., Santalahti, K., Pitkänen, N., Lehtimäki, T. J., Lyytikäinen, L., Raitoharju, E., et al. (2021) · Obesity · doi:10.1002/oby.23060 · Cited by 70
“Methods typically used to test for pleiotropy, such as MR-Egger (31), were not conducted as these lack power with small numbers of SNPs.”
MethodSi, S., Li, J., Tewara, M. A., & Xue, F. (2021) · Frontiers in Immunology · doi:10.3389/fimmu.2021.720876 · Cited by 74
“The MR-Egger method detects and corrects for bias due to directional pleiotropy, while the existence of horizontal pleiotropic is detected by testing whether the intercept term equals to zero (25).”
MethodKjeldsen, E. W., Thomassen, J. Q., & Frikke‐Schmidt, R. (2021) · Biochimica et Biophysica Acta (BBA) - Molecular and Cell Biology of Lipids · doi:10.1016/j.bbalip.2021.159063 · Cited by 77
Chen, D., Zhang, Y., Yidilisi, A., Xu, Y., Dong, Q., & Jiang, J. (2022) · The Journal of Clinical Endocrinology & Metabolism · doi:10.1210/clinem/dgac048 · Cited by 72
“Horizontal pleiotropy was evaluated by estimating the deviation of the MR-Egger intercept, with the difference from zero indicating potential bias in the MR estimates(36).”
MethodHigh Blood Pressure and Intraocular Pressure: A Mendelian Randomization Study
Plotnikov, D., Huang, Y., Khawaja, A. P., Foster, P. J., Zhu, Z., Guggenheim, J. A., & He, M. (2022) · Investigative Ophthalmology & Visual Science · doi:10.1167/iovs.63.6.29 · Cited by 74
“27 Next, the effects of the selected SNPs were combined using the MR-Egger, 28 weighted median, 29 or mode-based 30 meta-analysis methods as sensitivity analyses for the assumption of no unbalanced or horizontal pleiotropy in the IVW MR analysis.”
MethodThe role of obesity, type 2 diabetes, and metabolic factors in gout: A Mendelian randomization study
Yang, Y., Xian, W., Wu, D., Huo, Z., Hong, S., Li, Y., & Xiao, H. (2022) · Frontiers in Endocrinology · doi:10.3389/fendo.2022.917056 · Cited by 76
“The MR-Egger method provided an estimate of horizontal pleiotropy from the intercept of a linear regression of SNP–outcome and SNP–exposure association estimate (26).”
MethodYin, X., Bose, D., Kwon, A., Hanks, S. C., Jackson, A., Stringham, H. M., Welch, R., Oravilahti, A., Silva, L. F., Locke, A. E., et al. (2022) · The American Journal of Human Genetics · doi:10.1016/j.ajhg.2022.08.007 · Cited by 70
Park, S., Kim, S. G., Lee, S., Kim, Y., Cho, S., Kim, K., Kim, Y. C., Han, S. S., Lee, H., Lee, J. P., et al. (2023) · Journal of Cachexia Sarcopenia and Muscle · doi:10.1002/jcsm.13174 · Cited by 70
“MR-Egger regression with bootstrapped standard error was performed.(17) MR-Egger regression is a method that provides pleiotropy-robust causal estimates under the attainment of the InSIDE assumption.”
MethodWen, J., Zhang, J., Zhang, H., Zhang, N., Lei, R., Deng, Y., Cheng, Q., Li, H., & Luo, P. (2024) · Journal of Translational Medicine · doi:10.1186/s12967-024-04928-y · Cited by 68
“To examine horizontal pleiotropy, we performed MR egger intercept analysis and leave-one-out analysis [41].”
MethodMu, C., Dang, X., & Luo, X. (2024) · Nature Human Behaviour · doi:10.1038/s41562-024-01879-8 · Cited by 79
“The intercept of the MR-Egger regression represents the mean pleiotropic effect of all instruments, with a value that differs from zero; P < 0.05 indicates the presence of directional pleiotropy 9,113 .”
InfluentialHu, X., Cai, M., Xiao, J., Wan, X., Wang, Z., Zhao, H., & Yang, C. (2024) · The American Journal of Human Genetics · doi:10.1016/j.ajhg.2024.06.016 · Cited by 86
Ooi, B. N. S., Loh, H. W., Ho, P. J., Milne, R. L., Giles, G. G., Gao, C., Kraft, P. L., John, E. M., Swerdlow, A. J., Brenner, H., et al. (2019) · International Journal of Epidemiology · doi:10.1093/ije/dyz124 · Cited by 69
“the associations with other traits that may affect the outcome via pathways independent of the exposure).(28) For the datasets used in this study, only for the case of BMI (exposure) versus breast cancer risk (outcome) was the P-value for the MR-Egger intercept significantly different from zero.”
MethodGan, W., Bragg, F., Walters, R. G., Millwood, I. Y., Lin, K., Chen, Y., Guo, Y., Vaucher, J., Bian, Z., Bennett, D., et al. (2019) · Diabetes · doi:10.2337/db19-0224 · Cited by 64
“Sensitivity analyses using weighted median, weighted mode, and MR-Egger approaches showed similar findings, as did analyses based on GRS-T2D86, and there was no evidence of unbalanced pleiotropy (P for pleiotropy from MR-Egger$0.31) (Supplementary Fig.”
MethodInfluentialClifton, E. A. D., Perry, J. R. B., Imamura, F., Lotta, L. A., Brage, S., Forouhi, N. G., Griffin, S. J., Wareham, N. J., Ong, K. K., & Day, F. R. (2018) · Communications Biology · doi:10.1038/s42003-018-0042-6 · Cited by 70
Mendelian randomization: the challenge of unobserved environmental confounds
Koellinger, P. D., & de Vlaming, R. (2019) · International Journal of Epidemiology · doi:10.1093/ije/dyz138 · Cited by 63
“Figure 1 illustrates the basic setup of an MR study.(8,17) X is the exposure of interest (e.”
BackgroundCheng, Q., Yang, Y., Shi, X., Yeung, K.-F., Yang, C., Peng, H., & Liu, J. (2020) · NAR Genomics and Bioinformatics · doi:10.1093/nargab/lqaa028 · Cited by 62
“3.1 Simulations Methods for comparison We compared the performance of five methods in the main text: (1) our MR-LD and MR-LDP implemented in the R package MR.LDP; (2) GSMR implemented in the R package gsmr; (3) RAPS implemented in the R package mr.raps; (4) IVW implemented in the R package MendelianRandomization; (5)…”
InfluentialCarreras‐Torres, R., Ibáñez‐Sanz, G., Obón‐Santacana, M., Duell, E. J., & Moreno, V. R. (2020) · Scientific Reports · doi:10.1038/s41598-020-76361-2 · Cited by 78
Han, X., Ong, J., Hewitt, A. W., Gharahkhani, P., & MacGregor, S. (2020) · International Journal of Epidemiology · doi:10.1093/ije/dyaa178 · Cited by 78
“33,34 All general analyses were performed with R (version 3.4.1).”
BackgroundMethodInfluentialInsulin-like Growth Factor-1, Bone Mineral Density, and Fracture: A Mendelian Randomization Study
Yuan, S., Wan, Z., Cheng, S., Michaëlsson, K., & Larsson, S. C. (2021) · The Journal of Clinical Endocrinology & Metabolism · doi:10.1210/clinem/dgaa963 · Cited by 70
“Possible pleiotropic effect was estimated by the intercept in MR-Egger regression model ( P for intercept .05) (23).”
MethodChildhood obesity and multiple sclerosis: A Mendelian randomization study
Harroud, A., Mitchell, R. E., Richardson, T. G., Morris, J. A., Forgetta, V., Smith, G. D., Baranzini, S. E., & Richards, J. B. (2021) · Multiple Sclerosis Journal · doi:10.1177/13524585211001781 · Cited by 77
“In addition, we inspected funnel plots of the individual MR estimates against their precision, with asymmetry indicative of directional horizontal pleiotropy.(31) Consistent results across these analyses reduce the likelihood of bias.”
MethodLord, J., Jermy, B., Green, R., Wong, A., Xu, J., Legido-Quigley, C., Dobson, R., Richards, M., & Proitsi, P. (2021) · Proceedings of the National Academy of Sciences · doi:10.1073/pnas.2009808118 · Cited by 63
“Large deviations from zero are taken as evidence of violation to MR’s exclusion restriction and exchangeability assumptions (45), and large discrepancies between Egger and IVW estimates are”
Yuan, S., Daghlas, I., & Larsson, S. C. (2021) · Pain · doi:10.1097/j.pain.0000000000002360 · Cited by 69
Insomnia, sleep duration, and risk of anxiety: A two-sample Mendelian randomization study
Zhou, F., Li, S., & Xu, H. (2022) · Journal of Psychiatric Research · doi:10.1016/j.jpsychires.2022.08.012 · Cited by 66
Sex steroid hormones and risk of breast cancer: a two-sample Mendelian randomization study
Nounu, A., Kar, S., Relton, C. L., & Richmond, R. C. (2022) · Breast Cancer Research · doi:10.1186/s13058-022-01553-9 · Cited by 72
“This method is not constrained to pass through an effect size of 0; therefore, the y-intercept gives an indication of the presence of directional pleiotropy [51, 54].”
MethodAustin-Zimmerman, I., Levey, D. F., Giannakopoulou, O., Deak, J. D., Galimberti, M., Adhikari, K., Zhou, H., Denaxas, S., Irizar, H., Kuchenbaecker, K. B., et al. (2023) · Nature Communications · doi:10.1038/s41467-023-41249-y · Cited by 75
“We also conducted MR-Egger, weighted median, and weighted mode analyses to test for horizontal pleiotropy and potentially invalid genetic instruments 86,87 .”
Katikireddi, S. V., Green, M. J., Taylor, A. E., Davey Smith, G., & Munafò, M. R. (2018) · Addiction · doi:10.1111/add.14038 · Cited by 63
“strengths of association with the behaviour of interest [64].”
BackgroundGenetic evidence for assortative mating on alcohol consumption in the UK Biobank
Howe, L. J., Lawson, D. J., Davies, N. M., St. Pourcain, B., Lewis, S. J., Davey Smith, G., & Hemani, G. (2019) · Nature Communications · doi:10.1038/s41467-019-12424-x · Cited by 63
Zhang, Y., Quick, C., Yu, K., Barbeira, A., Luca, F., Piqué-Regi, R., Im, H. K., & Wen, X. (2020) · Genome biology · doi:10.1186/s13059-020-02026-y · Cited by 80
Efstathiadou, A., Gill, D., McGrane, F., Quinn, T. J., & Dawson, J. (2019) · Journal of the American Heart Association · doi:10.1161/jaha.119.012738 · Cited by 65
“We estimated the intercept and slope of MR-Egger regression, which represent the average horizontal pleiotropy and a pleiotropy-adjusted MR estimate, respectively.(31) An intercept value for this regression that does not include the null (P<0.”
BackgroundMethodInfluentialCausal relationships between substance use and insomnia
Pasman, J. A., Smit, D. J. A., Kingma, L., Vink, J. M., Treur, J. L., & Verweij, K. J. H. (2020) · Drug and Alcohol Dependence · doi:10.1016/j.drugalcdep.2020.108151 · Cited by 64
Taylor‐Bateman, V., Gill, D., Georgakis, M. K., Malik, R., Munroe, P. B., Traylor, M., Εvangelou, Ε., Warren, H. R., Gao, H., Ntritsos, G., et al. (2021) · Neurology · doi:10.1212/wnl.0000000000013120 · Cited by 61
Ni, J., Zhou, W., Cen, H., Chen, G., Huang, J., Yin, K.-J., & Sui, C. (2021) · Osteoarthritis and Cartilage · doi:10.1016/j.joca.2021.11.021 · Cited by 72
Assessing the Causal Role of Sleep Traits on Glycated Hemoglobin: A Mendelian Randomization Study
Liu, J., Richmond, R. C., Bowden, J., Barry, C.-J. S., Dashti, H. S., Daghlas, I., Lane, J. M., Jones, S. E., Wood, A. R., Frayling, T. M., et al. (2022) · Diabetes Care · doi:10.2337/dc21-0089 · Cited by 70
Self-citationGao, N., Kong, M., Li, X., Zhu, X., Wei, D., Ni, M., Wang, Y., Hong, Z., & Dong, A. (2022) · Frontiers in Immunology · doi:10.3389/fimmu.2022.918224 · Cited by 73
He, R., Zheng, R., Zheng, J., Li, M., Wang, T., Zhao, Z., Wang, S., Lin, H., Lu, J., Chen, Y., et al. (2022) · The Journal of Clinical Endocrinology & Metabolism · doi:10.1210/clinem/dgac707 · Cited by 64
Yang, S., Guo, J., Kong, Z., Deng, M., Da, J., Lin, X., Peng, S., Fu, J., Luo, T., Ma, J., et al. (2024) · Journal of Translational Medicine · doi:10.1186/s12967-023-04835-8 · Cited by 78
“The MR method relies on three assumptions [27]: (1) The genetic variants serving as instrumental variables are associated with specific gut microbiota taxa, including 211 taxa, 131 genera, 35 families, 20 orders, 16 classes, and 9 phyla; (2) The genetic variants are unrelated to any unmeasured…”
MethodBody mass index and colorectal cancer risk: A Mendelian randomization study
Suzuki, S., Goto, A., Nakatochi, M., Narita, A., Yamaji, T., Sawada, N., Katagiri, R., Iwagami, M., Hanyuda, A., Hachiya, T., et al. (2021) · Cancer Science · doi:10.1111/cas.14824 · Cited by 66
Richardson, T. G., Wang, Q., Sanderson, E., Mahajan, A., McCarthy, M. I., Frayling, T. M., Ala-Korpela, M., Sniderman, A., Davey Smith, G., & Holmes, M. V. (2021) · The Lancet Healthy Longevity · doi:10.1016/s2666-7568(21)00086-6 · Cited by 61
Green, H., Jones, A. G., Evans, J. P., Wood, A. R., Beaumont, R. N., Tyrrell, J., Frayling, T. M., Smith, C., & Weedon, M. N. (2021) · PLoS Genetics · doi:10.1371/journal.pgen.1009577 · Cited by 74
Genetic evidence suggests posttraumatic stress disorder as a subtype of major depressive disorder
Zhang, F., Rao, S., Cao, H., Zhang, X., Wang, Q., Xu, Y. J., Sun, J., Wang, C., Chen, J., Xu, X., et al. (2022) · DOAJ (DOAJ: Directory of Open Access Journals) · Cited by 61
Pagoni, P., Korologou‐Linden, R., Howe, L. D., Smith, G. D., Ben‐Shlomo, Y., Stergiakouli, E., & Anderson, E. L. (2022) · Brain Behavior and Immunity · doi:10.1016/j.bbi.2022.05.006 · Cited by 65
“Substantial heterogeneity is an indication that instruments may not be valid (Bowden et al., 2015).”
BackgroundAhn, K., Penn, R. B., Rattan, S. C., Panettieri, R. A., Voight, B. F., & An, S. S. (2022) · American Journal of Respiratory and Critical Care Medicine · doi:10.1164/rccm.202205-0951oc · Cited by 73
Liang, Y. Y., Chen, J., Peng, M., Zhou, J., Chen, X., Tan, X. W., Wang, N., Ma, H., Guo, L.-Y., Zhang, J., et al. (2023) · Journal of Translational Medicine · doi:10.1186/s12967-023-03920-2 · Cited by 76
“The MR-Egger analyses showed absence of any pleiotropy (Additional file 1: Tables S11 and S12).”
MethodInfluentialCao, J., Wang, N., Luo, Y. K., Ma, C., Chen, Z.-K., Chenzhao, C., Zhang, F., Qi, X., & Xiong, W. (2023) · Frontiers in Immunology · doi:10.3389/fimmu.2023.977587 · Cited by 79
“Fron (4) MR-Egger: the MR-Egger is a tool that provides a causal effect through the slope coefficient from Egger regression and also detects small study bias (26).”
BackgroundWinsvold, B. S., Harder, A. V. E., Ran, C., Chalmer, M. A., Dalmasso, M. C., Ferkingstad, E., Tripathi, K. P., Bacchelli, E., Børte, S., Fourier, C., et al. (2023) · Annals of Neurology · doi:10.1002/ana.26743 · Cited by 66
“35,36 Both models were fi t using robust regression and assuming a t -distribution of the fi tted parameters.”
MethodArdissino, M., Morley, A., Slob, E. A. W., Schuermans, A., Rayes, B., Raisi‐Estabragh, Z., de Marvao, A., Burgess, S., Rogne, T., Honigberg, M. C., et al. (2023) · European Heart Journal · doi:10.1093/eurheartj/ehad631 · Cited by 70
“56 We explored the first of these assumptions through checking instrument strength using F -statistics, 34 and the third of these through the use of multiple sensitivity analyses more robust to plei-otropy.”
Self-citationSGLT2 inhibition, circulating metabolites, and atrial fibrillation: a Mendelian randomization study
Li, J., Yu, Y., Sun, Y., Yu, B., Tan, X. W., Wang, B., Lu, Y., & Wang, N. (2023) · Cardiovascular Diabetology · doi:10.1186/s12933-023-02019-8 · Cited by 74
“[39] In addition, the MR-PRESSO method can also determine the presence of directional pleiotropy by detecting possible outliers and recalculating estimates after removing out-liers.”
MethodMoayyeri, A., Cheung, C., Tan, K. C. B., Morris, J. A., Cerani, A., Mohney, R. P., Richards, J. B., Hammond, C. J., Spector, T. D., & Menni, C. (2017) · Journal of Bone and Mineral Research · doi:10.1002/jbmr.3358 · Cited by 69
“We could not employ new extensions of the MR method (namely multivariable MR((27)) and MR Egger regression)((28)) because of power limitations.”
MethodBae, S., & Lee, Y. H. (2019) · European Journal of Clinical Investigation · doi:10.1111/eci.13076 · Cited by 71
“MR‐Egger regression analysis, which is robust to invalid instruments, tests and accounts for the presence of unbalanced pleiotropy by introducing a parameter for this bias by incorporating summary data estimates of causal effects from multiple individual variants.(18) MR‐Egger applies a weighted linear regression of t…”
MethodInfluentialGenome-wide association study of breakfast skipping links clock regulation with food timing
Dashti, H. S., Merino, J., Lane, J. M., Song, Y., Smith, C. E., Tanaka, T., McKeown, N. M., Tucker, C., Sun, D., Bartz, T. M., et al. (2019) · American Journal of Clinical Nutrition · doi:10.1093/ajcn/nqz076 · Cited by 71
“Estimation of the pleiotropy parameter means that the MR-Egger estimate is generally far less precise than the IVW estimate.”
The role of the retinoids in schizophrenia: genomic and clinical perspectives
Reay, W. R., & Cairns, M. J. (2019) · Molecular Psychiatry · doi:10.1038/s41380-019-0566-2 · Cited by 66
Physical activity and COVID-19: an observational and Mendelian randomisation study
Zhang, X., Li, X., Sun, Z., He, Y., Xu, W., Campbell, H., Dunlop, M. G., Timofeeva, M., & Theodoratou, E. (2020) · Journal of Global Health · doi:10.7189/jogh.10.020514 · Cited by 60
Pistis, G., Milaneschi, Y., Vandeleur, C. L., Lasserre, A. M., Penninx, B. W. J. H., Lamers, F., Boomsma, D. I., Hottenga, J., Marques-Vidal, P. M., Vollenweider, P., et al. (2021) · Translational Psychiatry · doi:10.1038/s41398-021-01236-7 · Cited by 61
Benn, M., Marott, S. C. W., Tybjærg‐Hansen, A., & Nordestgaard, B. G. (2021) · Cardiovascular Research · doi:10.1093/cvr/cvab368 · Cited by 70
Chen, F., Wen, W., Long, J., Shu, X., Yang, Y., Shu, X., & Zheng, W. (2022) · International Journal of Cancer · doi:10.1002/ijc.34026 · Cited by 67
“We used the MR-Egger regression method to assess possible horizontal pleiotropic effects, which was implicated when the intercept value differed from zero.(38) The MR pleiotropy residual sum and outlier test (MR-PRESSO) was applied to detect outlying SNPs with evidence of horizontal pleiotropy; the effect estimates we…”
MethodSerum 25-Hydroxyvitamin D and Cancer Risk: A Systematic Review of Mendelian Randomization Studies
Lawler, T., & Andersen, S. W. (2023) · Nutrients · doi:10.3390/nu15020422 · Cited by 64
“A majority of man‐ uscripts included a primary MR estimate calculated via inverse‐variance weighting (IVW) of Wald ratios (obtained for each genetic IV), as well as multiple sensitivity analyses to account for potential pleiotropy, including MR–Egger [44], weighted‐median MR [45], and/or MR‐PRESSO [49].”
BackgroundMethodInfluentialMulti-omic underpinnings of epigenetic aging and human longevity
Mavromatis, L. A., Rosoff, D. B., Bell, A. S., Jung, J., Wagner, J., & Lohoff, F. W. (2023) · Nature Communications · doi:10.1038/s41467-023-37729-w · Cited by 67
“Additionally, for each exposure-outcome pair, we performed the Egger intercept test to detect directional pleiotropic effects of each genetic instrument 88 .”
Prapiadou, S., Živković, L., Thorand, B., George, M. J., van der Laan, S. W., Malik, R., Herder, C., Köenig, W., Ueland, T., Kleveland, O., et al. (2023) · Circulation · doi:10.1161/circulationaha.123.064974 · Cited by 66
“To validate our results against bias arising from horizontal pleiotropy, for significant proteins, we also applied the weighted median approach 23 and MR-Egger regression, 24 which are more robust against the use of pleiotropic instruments.”
MethodLiang, Y. Y., Zhou, M., He, Y., Zhang, W., Wu, Q., Luo, T., Zhang, J., Jia, F., Qi, L., Ai, S., et al. (2024) · Nature Human Behaviour · doi:10.1038/s41562-024-01970-0 · Cited by 66
Ahmad, O. S., Leong, A., Miller, J. A., Morris, J. A., Forgetta, V., Mujammami, M. H., & Richards, J. B. (2016) · Journal of Bone and Mineral Research · doi:10.1002/jbmr.3063 · Cited by 64
“The method quantifies the effect of directional pleiotropy through a parameter l, which is the constant term in a linear regression model that generalizes the standard MR analysis.((28)) A value for l significantly different from zero indicates that the genetic variants used as instruments have an effect on the outcom…”
MethodResultInfluentialon behalf of the China Kadoorie Biobank Collaborative Group, Huang, T., Afzal, S., Yu, C., Guo, Y., Bian, Z., Yang, L., Millwood, I. Y., Walters, R. G., Chen, Y., et al. (2019) · BMC Medicine · doi:10.1186/s12916-019-1401-y · Cited by 60
“In the present MR analysis, we considered three assumptions to ensure the validity of our analyses [17, 18, 27].”
MethodJiang, X., Ge, T., & Chen, C. (2021) · Scientific Reports · doi:10.1038/s41598-020-80655-w · Cited by 62
Burgess, S., Bowden, J., Dudbridge, F., & Thompson, S. G. (2016) · arXiv (Cornell University) · doi:10.48550/arxiv.1606.03729 · Cited by 58
“If the intercept θ0E in the regression model (5) is estimated, then the slope estimate θ̂1E is the MR-Egger estimate of the causal effect θ [19].”
BackgroundMethodInfluentialSelf-citationEmanuelsson, F., Marott, S., Tybjærg-Hansen, A., Nordestgaard, B. G., & Benn, M. (2020) · Diabetes Care · doi:10.2337/dc19-1850 · Cited by 59
“Risk estimates from these three two-sample MR analyses were largely in the same direction and showed no indication of pleiotropy, confirming the validity of the instrument (38,39).”
ResultOng, J., An, J., Law, M. H., Whiteman, D. C., Neale, R. Ε., Gharahkhani, P., & MacGregor, S. (2018) · British Journal of Cancer · doi:10.1038/s41416-018-0063-4 · Cited by 60
Vitamin D and risk of pregnancy related hypertensive disorders: mendelian randomisation study
Magnus, M. C., Miliku, K., Bauer, A. E., Engel, S. M., Felix, J. F., Jaddoe, V. W. V., Lawlor, D. A., London, S. J., Magnus, P. M., McGinnis, R. E., et al. (2018) · BMJ · doi:10.1136/bmj.k2167 · Cited by 75
Strengthening Causal Inference for Complex Disease Using Molecular Quantitative Trait Loci
Neumeyer, S., Hemani, G., & Zeggini, E. (2019) · Trends in Molecular Medicine · doi:10.1016/j.molmed.2019.10.004 · Cited by 60
“A suite of sensitivity analyses [37–41] are now routinely implemented in MR studies that use multiple independent instruments to model pleiotropy [42].”
Dong, S., Zhang, K., Guo, Y., Ding, J., Feng, J.-C., Yao, S., Yao, S., Rong, Y., Jiang, F., Chen, J., et al. (2021) · Genome Medicine · doi:10.1186/s13073-021-00865-3 · Cited by 72
AUVINEN, J. P., Tapio, J., Karhunen, V., Kettunen, J., Serpi, R., Dimova, E. Y., Gill, D., Soininen, P., Tammelin, T., Mykkänen, J., et al. (2021) · Science Advances · doi:10.1126/sciadv.abi4822 · Cited by 68
Lu, Y., Tang, H., Huang, P., Wang, J., Deng, P., Li, Y., Zheng, J., & Weng, L. (2022) · International Journal of Epidemiology · doi:10.1093/ije/dyac025 · Cited by 63
Genetic and environmental determinants of diastolic heart function
Thanaj, M., Mielke, J., McGurk, K. A., Bai, W., Savioli, N., de Marvao, A., Meyer, H. V., Zeng, L., Sohler, F., Lumbers, R. T., et al. (2022) · Nature Cardiovascular Research · doi:10.1038/s44161-022-00048-2 · Cited by 59
Genetic liability to obesity and peptic ulcer disease: a Mendelian randomization study
Li, Z., Chen, H., & Chen, T. (2022) · BMC Medical Genomics · doi:10.1186/s12920-022-01366-x · Cited by 62
“Horizontal pleiotropy was assessed using the MR-Egger regression intercept [22].”
MethodZhang, L., Zi, L., Kuang, T., Wang, K., Qiu, Z., Wu, Z., Liu, L., Liu, R., Wang, P., & Wang, W. (2023) · Frontiers in Endocrinology · doi:10.3389/fendo.2023.1159148 · Cited by 72
“This method was supplemented with weighted median analysis (29), MR-Egger regression (30), and MR-PRESSO methods (31).”
MethodHenry, A., Mo, X., Finan, C., Chaffin, M. D., Speed, D., Issa, H. G., Denaxas, S., Ware, J. S., Zheng, S. L., Mälarstig, A., et al. (2025) · Nature Genetics · doi:10.1038/s41588-024-02064-3 · Cited by 94
“For each exposure trait, we estimated the causal association with each HF phenotype using the IVW MR estimator and performed sensitivity analyses with MR–Egger and WME 98,99 .”
InfluentialBurgess, S., & Harshfield, E. (2016) · Current Opinion in Endocrinology, Diabetes & Obesity · doi:10.1097/med.0000000000000230 · Cited by 59
Self-citationRichardson, T. G., Haycock, P., Zheng, J., Timpson, N. J., Gaunt, T. R., Smith, G. D., Relton, C. L., & Hemani, G. (2018) · Human Molecular Genetics · doi:10.1093/hmg/ddy210 · Cited by 64
Busch, A. S., Hollis, B., Day, F. R., Sørensen, K., Aksglæde, L., Perry, J. R. B., Ong, K. K., Juul, A., & Hagen, C. P. (2019) · Human Reproduction · doi:10.1093/humrep/dez118 · Cited by 62
“Inverse-variance weighted models were performed, with additional weighted median and MR-Egger tests (Bowden et al ., 2015) to exclude violations of the test assumptions, i.e. non-directional and directional pleiotropy.”
Metadata
- Authors
- Bowden, J., Davey Smith, G., & Burgess, S.
- Affiliations
- University of Cambridge (GB)
- Corresponding author
- Bowden, J.
- Venue
- International Journal of Epidemiology
- Publisher
- Oxford University Press (OUP)
- Published
- 2015-04-01
- Volume
- 44
- Issue
- 2
- Pages
- 512-525
- ISSN
- 0300-5771 (ISSN-L)
- 1464-3685
- PMC
- PMC4469799
- OpenAlex
- W2113699335
- Cited by
- 9,816
- References
- 50
- Citations by year
- 2026: 937 · 2025: 1929 · 2024: 2977 · 2023: 1482 · 2022: 797 · 2021: 590 · 2020: 379 · 2019: 283 · 2018: 205 · 2017: 123 · 2016: 88 · 2015: 21
- FWCI
- 100.13
- Type
- journal article
- Language
- en
- Open access
- hybrid
- doi.org
- Licence
- cc-by
- Locations
- International Journal of Epidemiology (publishedVersion, cc-by)
- PubMed Central (publishedVersion, cc-by)
- PubMed (publishedVersion)
- Bristol Research (University of Bristol) (submittedVersion, cc-by)
- Apollo (University of Cambridge) (submittedVersion, cc-by)
- Explore Bristol Research (submittedVersion, cc-by)
- Funders
- Wellcome Trust (MC_UU_12013_8, 100114)
- National Institute for Health and Care Research (NF-SI-0512-10165)
- British Heart Foundation (SP/08/007/23628, RG/08/014/24067)
- University of Bristol (MC_UU_12013/2)
- Medical Research Council (MC_UU_12013_2, MC_UU_12013_5, MR/N501906/1, MC UU 12013/8, MR/L012286/1, MR/L003120/1)
- Topics
- Life Sciences › Biochemistry, Genetics and Molecular Biology › Genetics › Genetic Associations and Epidemiology
- Physical Sciences › Mathematics › Statistics and Probability › Advanced Causal Inference Techniques
- Social Sciences › Decision Sciences › Statistics, Probability and Uncertainty › Meta-analysis and systematic reviews
- Keywords
- Mendelian randomization, invalid instruments, pleiotropy, MR-Egger, small-study bias, multiple instruments, causal effect estimation, bias detection, sensitivity analysis
- MeSH terms
- Blood Pressure, Body Height, Coronary Artery Disease, Humans, Models, Biological, Regression Analysis, Respiration, Statistics as Topic, Genetic Variation, Meta-Analysis as Topic, Bias, Causality, Risk Assessment, Mendelian Randomization Analysis, Genetic Pleiotropy
About these checks
Registry, retraction, Cites and statistics results are computed, not judged, with one exception: a printed reference that no index lists is read once by a model before it counts as a citation error. Claims are extracted by a model and kept only when their quote appears verbatim in the text; each cited source is then checked, with a model’s help, for whether it says what the claim relies on. Those verdicts can be wrong — read the claim’s quote and the cited source before relying on one.
Statistics and arithmetic are recomputed, not judged.
Confidence bands are shown only for fields calibrated on our annotated test set. None is calibrated yet, so no band is shown.
What counts as a claim ›How we measure confidence ›How we check this ›
Are you an author, or do you see a problem with this page? Request a review
Data sources
Bibliographic data: Semantic Scholar, OpenAlex, Crossref.
Contains information from the Semantic Scholar Academic Graph Datasets, made available under the ODC Attribution License (ODC-BY 1.0).
Semantic Scholar’s data is described in: Kinney, R., et al. (2023). The Semantic Scholar Open Data Platform. arXiv:2301.10140.
