

Mendelian randomization with invalid instruments: effect estimation and bias detection through Egger regression
Open accessThe DOI matches its Crossref record; 50 of the 50 references it cites were found in a registry or an index.
Abstract
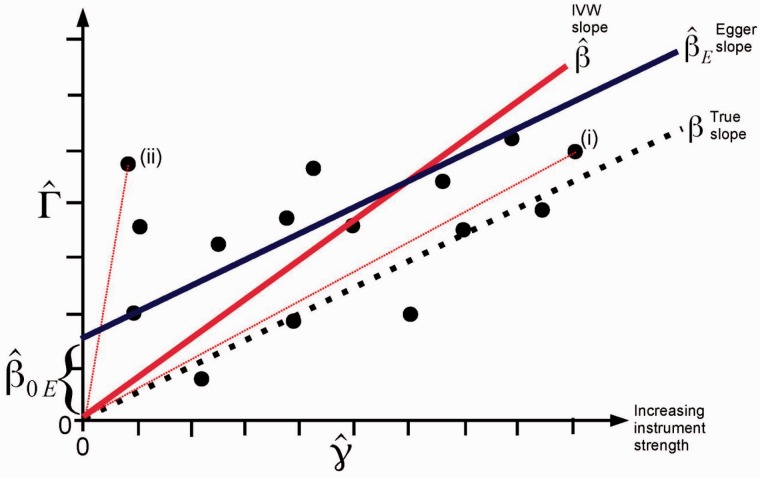
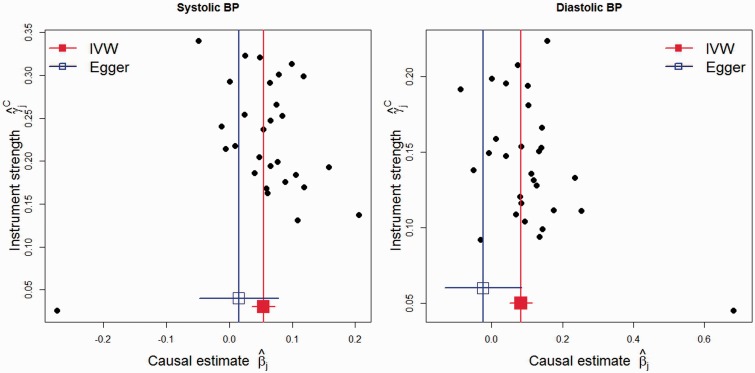
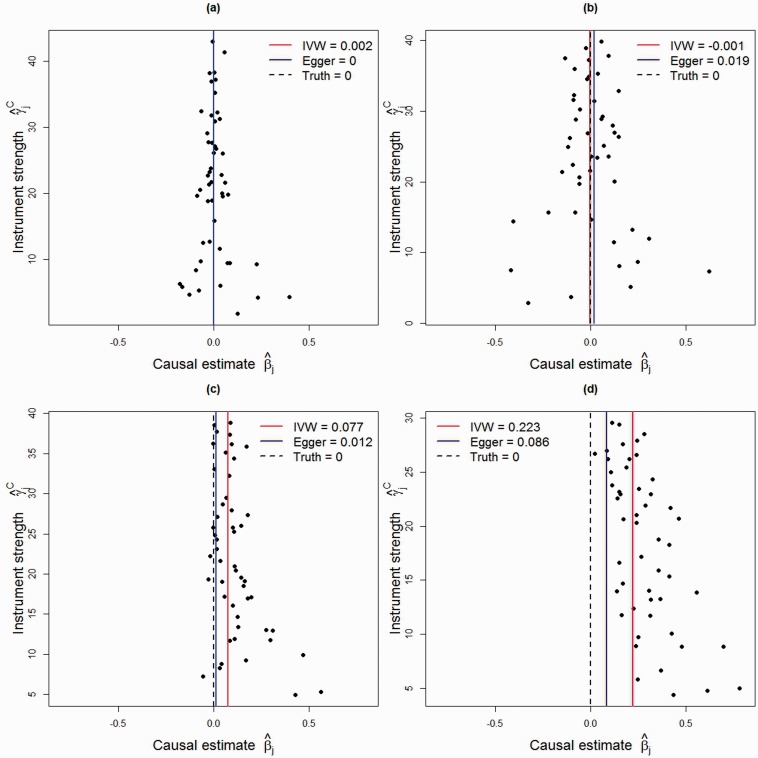
BACKGROUND: The number of Mendelian randomization analyses including large numbers of genetic variants is rapidly increasing. This is due to the proliferation of genome-wide association studies, and the desire to obtain more precise estimates of causal effects. However, some genetic variants may not be valid instrumental variables, in particular due to them having more than one proximal phenotypic correlate (pleiotropy). METHODS: We view Mendelian randomization with multiple instruments as a meta-analysis, and show that bias caused by pleiotropy can be regarded as analogous to small study bias. Causal estimates using each instrument can be displayed visually by a funnel plot to assess potential asymmetry. Egger regression, a tool to detect small study bias in meta-analysis, can be adapted to test for bias from pleiotropy, and the slope coefficient from Egger regression provides an estimate of the causal effect. Under the assumption that the association of each genetic variant with the exposure is independent of the pleiotropic effect of the variant (not via the exposure), Egger's test gives a valid test of the null causal hypothesis and a consistent causal effect estimate even when all the genetic variants are invalid instrumental variables. RESULTS: We illustrate the use of this approach by re-analysing two published Mendelian randomization studies of the causal effect of height on lung function, and the causal effect of blood pressure on coronary artery disease risk. The conservative nature of this approach is illustrated with these examples. CONCLUSIONS: An adaption of Egger regression (which we call MR-Egger) can detect some violations of the standard instrumental variable assumptions, and provide an effect estimate which is not subject to these violations. The approach provides a sensitivity analysis for the robustness of the findings from a Mendelian randomization investigation.
Overview
The claims and statistics of this paper haven’t been checked yet.
Free: it reads the open-access text and checks the first 5 claims that cite a source we can check. Create a free account to check every claim.
Integrity signals
Registry
Cites
Statistics
Figures


Verification
Claims the paper makes
The claims and statistics of this paper haven’t been checked yet.
Free: it reads the open-access text and checks the first 5 claims that cite a source we can check. Create a free account to check every claim.
Claims other papers make about this one
Each is checked against this paper’s own text: does it say what the citing paper says it does?
The cited source doesn’t support the claim as written.
In the citing paper
“These analyses showed no major deviations and did not change conclusions from the main instrumental variable findings.”
From Plasma levels of apolipoprotein E, APOE genotype, and all-cause and cause-specific mortality in 105 949 individuals from a white general population cohort (2019) · cites this paper as [67]
Checked by a reasoning model — may be wrong.
Experimental — accuracy not yet measuredThe source backs part of the claim, not all of it — or backs it for a different population, condition or comparison.
In the citing paper
“Similarly, violation of the ‘exclusion restriction criteria’33–37 could bias causal estimates in IV analyses when used to test effects of intermediates in RCTs or when used in observational data (including MR)”
From Triangulation in aetiological epidemiology (2017) · cites this paper as [36]
Experimental — accuracy not yet measuredThe source backs part of the claim, not all of it — or backs it for a different population, condition or comparison.
In the citing paper
“Furthermore the MR-Egger test, 9 which the authors used to test violation of the exclusion restriction criteria, cannot be used to differentiate effects of adult from child BMI, as Gao and colleagues acknowledge. This is because MR-Egger is only valid if the effect of the genetic instrument on the risk factor of interest is independent of its effect on any other phenotypes that might violate that”
From Commentary: Two-sample Mendelian randomization: opportunities and challenges (2016) · cites this paper as [9]
Experimental — accuracy not yet measuredThe source backs part of the claim, not all of it — or backs it for a different population, condition or comparison.
In the citing paper
“Egger MR was performed to determine the presence of unmeasured pleiotropy70.”
From Integrative genomic analyses identify candidate causal genes for calcific aortic valve stenosis involving tissue-specific regulation (2024) · cites this paper as [70]
Experimental — accuracy not yet measuredThe cited source says what the claim attributes to it.
In the citing paper
“Because MR is relatively novel there has been considerable focus on its limitations and methods for testing and dealing with these, in particular for dealing with violation of the exclusion restriction criteria due to genuine pleiotropy.36,37”
From Triangulation in aetiological epidemiology (2017) · cites this paper as [36]
8 more claims about this paper
Create a free account to see every claim other papers make about this one.
Self-check
Percentages, sums and reported differences re-computed from the paper’s own numbers.
The self-check needs the paper’s full text.
Citations
Cites
Measuring inconsistency in meta-analyses
Higgins, J. P. T., Thompson, S. G., Deeks, J. J., & Altman, D. G. (2003) · BMJ · doi:10.1136/bmj.327.7414.557 · Cited by 63,139
Bias in meta-analysis detected by a simple, graphical test
Egger, M., Smith, G. D., Schneider, M., & Minder, C. (1997) · BMJ · doi:10.1136/bmj.315.7109.629 · Cited by 56,722
Self-citationRegression shrinkage and selection via the lasso
Tibshirani, R. (1996) · Journal of the Royal Statistical Society Series B: Statistical Methodology · doi:10.1111/j.2517-6161.1996.tb02080.x · Cited by 51,482
Duval, S., & Tweedie, R. (2000) · Biometrics · doi:10.1111/j.0006-341x.2000.00455.x · Cited by 14,099
Borenstein, M., Hedges, L. V., Higgins, J. P. T., & Rothstein, H. R. (2021) · doi:10.1002/9781119558378 · Cited by 9,799
Sterne, J. A. C., Sutton, A. J., Ioannidis, J. P. A., Terrin, N., Jones, D. R., Lau, J., Carpenter, J., Rucker, G., Harbord, R. M., Schmid, C. H., et al. (2011) · BMJ · doi:10.1136/bmj.d4002 · Cited by 7,709 · cited 1×
“The general phenomenon is therefore prudently referred to under the umbrella term of ‘small study’ bias.(11,13,14) In the context of Mendelian randomization with multiple instruments, we equate the precision of a single study’s estimate with the strength of a single instrument.”
BackgroundInstrumental Variables Regression with Weak Instruments
Staiger, D., & Stock, J. H. (1997) · Econometrica · doi:10.2307/2171753 · Cited by 7,081
Mendelian Randomization Analysis With Multiple Genetic Variants Using Summarized Data
Burgess, S., Butterworth, A., & Thompson, S. G. (2013) · Genetic Epidemiology · doi:10.1002/gepi.21758 · Cited by 6,050 · cited 1×
“It has been shown that Mendelian randomization analyses based on summarized data are as efficient as those based on individual-level data.(23) Other tools from the meta-analysis literature include methods for bias adjustment, such as the trim-and-fill method,(45) and the use of pseudo-data.”
MethodSelf-citationDavey Smith, G., & Ebrahim, S. (2003) · International Journal of Epidemiology · doi:10.1093/ije/dyg070 · Cited by 5,882 · cited 2×
“We are particularly interested in the coverage properties of the estimators with a null causal effect, and the power of estimators with a positive causal effect, as salient findings from Mendelian randomization investigations are not only the magnitude of the causal effect—or indeed whether such can be estimated—but a…”
BackgroundInstrumental Variables Regression with Weak Instruments
Staiger, D., & Stock, J. (1994) · doi:10.3386/t0151 · Cited by 5,302 · cited 1×
“With many IVs in a one-sample setting (genetic variants, exposure and outcome measured in the same participants), IV estimates (particularly those from the TSLS method) are biased in the direction of the observational association between the exposure and the outcome.(49) This bias depends on the strength of the associ…”
Method
Research works printed but not linked: 12
- 2014, Human Molecular Genetics, 23, 89, 10.1093/hmg/ddu328 · DOI · Paper page
- 2010, Clinical Chemistry, 56, 723, 10.1373/clinchem.2009.141564 · DOI · Paper page
- 2015, International Journal of Epidemiology, 44, 496, 10.1093/ije/dyv071 · DOI · Paper page
- 2013, International Journal of Epidemiology, 42, 1157, 10.1093/ije/dyt110 · DOI · Paper page
- 2013, International Journal of Epidemiology, 42, 1497, 10.1093/ije/dyt179 · DOI · Paper page
- 2013, International Journal of Epidemiology, 42, 1134, 10.1093/ije/dyt093 · DOI · Paper page
- 2015, Statistics in medicine, 34, 454, 10.1002/sim.6358 · DOI · Paper page
- 2013, International Journal of Epidemiology, 42, 111, 10.1093/ije/dys064 · DOI · Paper page
- 2014, Economics and human biology, 13, 99, 10.1016/j.ehb.2013.12.002 · DOI · Paper page
- 2011, International Journal of Epidemiology, 40, 755, 10.1093/ije/dyr036 · DOI · Paper page
- 2013, American Journal of Epidemiology, 178, 1177, 10.1093/aje/kwt084 · DOI · Paper page
- Angrist J Pischke J-S Instrumental variables in action: sometimes you get whatyou need. In: Mostly Harmless Econometrics: An Empiricist’scompanion. Princeton, NJ: Princeton University Press, 2009.
Cited by
Items 701–800 of 1,058
Jamieson, E., Korologou‐Linden, R., Wootton, R. E., Guyatt, A. L., Battram, T., Burrows, K., Gaunt, T. R., Tobin, M. D., Munafo, M. R., Smith, G. D., et al. (2020) · The American Journal of Human Genetics · doi:10.1016/j.ajhg.2020.01.015 · Cited by 63
“Further to this, we assessed overall horizontal pleiotropy by (1) quantifying the heterogeneity of the genetic variants based on the Q statistic by using modified weights for the IVW approach,(39) as well as theMR-PRESSO global test,(40) and (2) testing the intercept in the MR-Egger test.(41) To account for horizontal…”
MethodLin, B. D., Alkema, A., Peters, T., Zinkstok, J., Libuda, L., Hebebrand, J., Antel, J., Hinney, A., Cahn, W., Adan, R., et al. (2019) · International Journal of Epidemiology · doi:10.1093/ije/dyz176 · Cited by 58
van der Graaf, A., Claringbould, A., Rimbert, A., BIOS Consortium, Heijmans, B. T., Hoen, P. A. C. ’., van Meurs, J. B. J., Jansen, R., Franke, L., Westra, H.-J., et al. (2020) · Nature Communications · doi:10.1038/s41467-020-18716-x · Cited by 58
Yuan, S., Giovannucci, E. L., & Larsson, S. C. (2021) · npj Genomic Medicine · doi:10.1038/s41525-021-00189-6 · Cited by 66
Thyroid Function and Mood Disorders: A Mendelian Randomization Study
Kuś, A., Kjaergaard, A. D., Marouli, E., Fabiola Del Greco, M., Sterenborg, R. B. T. M., Chaker, L., Peeters, R. P., Bednarczuk, T., Åsvold, B. O., Burgess, S., et al. (2021) · Thyroid · doi:10.1089/thy.2020.0884 · Cited by 72
“As shown in Figure 3, we observed no causal effects of genetic predisposition to MDD and BD on TSH and fT4 levels after conducting the reverse MR. Sensitivity analyses using the MR Egger and WM methods provided similar results.”
InfluentialSelf-citationBjörnsdóttir, G., Stefánsdóttir, L., Þorleifsson, G., Sulem, P., Norland, K., Ferkingstad, E., Oddsson, Á., Zink, F., Lund, S. H., Nawaz, M. S., et al. (2022) · Nature Communications · doi:10.1038/s41467-022-28167-1 · Cited by 71
Yuan, S., Wang, L., Sun, J., Yu, L., Zhou, X., Yang, J., Zhu, Y., Gill, D., Burgess, S., Denny, J. C., et al. (2022) · International Journal of Epidemiology · doi:10.1093/ije/dyac036 · Cited by 62
“In two-sample MR analysis, the inverse variance weighted method with multiplicative random effects was used as the main statistical method and supplemented with two sensitivity analyses, including the weighted median(34) and MR-Egger analyses.(35) We used multivariable MR analysis to examine the mediation effects of h…”
Self-citationChoquet, H., Khawaja, A. P., Jiang, C., Yin, J., Melles, R. B., Glymour, M. M., Hysi, P. G., & Jorgenson, E. (2022) · JAMA Ophthalmology · doi:10.1001/jamaophthalmol.2022.2762 · Cited by 63
Lu, Z., Gopalan, S., Dong, Y., Conti, D. V., Paşaniuc, B., Gusev, A., & Mancuso, N. (2022) · The American Journal of Human Genetics · doi:10.1016/j.ajhg.2022.07.002 · Cited by 64
Liu, B., Lyu, L., Zhou, W., Song, J., Ye, D., Mao, Y., Chen, G., & Sun, X. (2023) · BMC Medicine · doi:10.1186/s12916-023-02736-7 · Cited by 65
“05 were considered statistically significant [25].”
Wu, X., Zhang, W., Zhao, X., Zhang, L., Xu, M., Hao, Y., Xiao, J., Zhang, B., Li, J., Kraft, P. L., et al. (2023) · BMC Medicine · doi:10.1186/s12916-023-02876-w · Cited by 67
“To reduce biased estimate due to pleiotropic effects of genetic instruments, we adopted two complementary methods: MR-Egger regression (detects and corrects for bias due to directional pleiotropy) [30], and weighted median approach (provides a consistent causal estimation with even ≥ 50% invalid IVs) [31].”
Kang, J., Yang, L., Jia, T., Zhang, W., Wang, L., Zhao, Y., You, J., Deng, Y., Ge, Y., Liu, W., et al. (2024) · 中国科学通报:英文版 · doi:10.1016/j.scib.2024.09.041 · Cited by 73
Bae, S., & Lee, Y. H. (2018) · Clinical Rheumatology · doi:10.1007/s10067-018-4152-9 · Cited by 62
Kia, D. A., Noyce, A. J., White, J., Speed, D., Nicolas, A., collaborators, I., Burgess, S., Lawlor, D. A., Smith, G. D., Singleton, A., et al. (2018) · Annals of Neurology · doi:10.1002/ana.25294 · Cited by 62
Self-citationMartins‐Silva, T., Vaz, J. D. S., Hutz, M. H., Salatino‐Oliveira, A., Genro, J. P., Hartwig, F. P., Maia, C. R. M., Rohde, L. A., Borges, M. C., & Tovo‐Rodrigues, L. (2019) · International Journal of Obesity · doi:10.1038/s41366-019-0346-8 · Cited by 65
“outcome via horizontal pleiotropy) [36].”
Harrison, R., Munafò, M. R., Davey Smith, G., & Wootton, R. E. (2020) · The British Journal of Psychiatry · doi:10.1192/bjp.2020.68 · Cited by 57
Anderson, E. L., Richmond, R. C., Jones, S. E., Hemani, G., Wade, K. H., Dashti, H. S., Lane, J. M., Wang, H., Saxena, R., Brumpton, B., et al. (2021) · International Journal of Epidemiology · doi:10.1093/ije/dyaa183 · Cited by 58
“NOME assumption).(19) We assessed this using an adaptation of the I(2) statistic(32) (referred to as I2GX) which provides an estimate of the degree of regression dilution in the MREgger causal estimate due to uncertainty in the SNPexposure estimates.”
MethodInfluentialGage, S. H., Jones, H. J., Taylor, A. E., Burgess, S., Zammit, S., & Munafò, M. R. (2017) · Scientific Reports · doi:10.1038/srep40653 · Cited by 57
Self-citationBIRTH-GENE (BIG) Study Working Group, Huang, T., Wang, T., Zheng, Y., Ellervik, C., Li, X., Gao, M. Q., Fang, Z. A., Chai, J. F., Ahluwalia, T. S., et al. (2019) · JAMA Network Open · doi:10.1001/jamanetworkopen.2019.10915 · Cited by 70
Search for multiple myeloma risk factors using Mendelian randomization
Went, M., Cornish, A. J., Law, P., Kinnersley, B., van Duin, M., Weinhold, N., Försti, A., Hansson, M., Sonneveld, P., Goldschmidt, H., et al. (2020) · Blood Advances · doi:10.1182/bloodadvances.2020001502 · Cited by 58
“Directional pleiotropy was therefore assessed using MR-Egger regression (supplemental Table 7).(35) A consistent effect across these 4 complementary methods (IVW, MBE, WME, and MR-Egger), which make different assumptions about horizontal pleiotropy, is less likely to be a false positive.”
MethodResultYuan, S., & Larsson, S. C. (2021) · Molecular Genetics and Metabolism · doi:10.1016/j.ymgme.2021.08.010 · Cited by 64
Effect of Cheese Intake on Cardiovascular Diseases and Cardiovascular Biomarkers
Hu, M., Tan, J., Gao, X., Yang, J., & Yang, Y. (2022) · Nutrients · doi:10.3390/nu14142936 · Cited by 60
“Moreover, random segregation and the independent assortment of genetic polymorphisms at conception enables the MR analysis to minimize the effect of confounding factors by introducing genetic markers as instrumental variables (IVs) of exposures [11,12].”
MethodInfluentialZhang, Y., Zhang, X., Chen, D., Lu, J., Gong, Q., Fang, J., & Jiang, J. (2022) · Frontiers in Cardiovascular Medicine · doi:10.3389/fcvm.2022.971376 · Cited by 83
Yang, Q., Borges, M. C., Sanderson, E. C. M., Magnus, M. C., Kilpi, F., Collings, P. J., Soares, A. G., West, J., Magnus, P. M., Wright, J., et al. (2022) · PLoS Medicine · doi:10.1371/journal.pmed.1004090 · Cited by 63
“Sensitivity analyses using weighted median and MR-Egger for all outcomes were direction- ally consistent with IVW but attenuated to the null for all outcomes (except stillbirth), and MR-Egger results for GD, perinatal depression and PTB were attenuated to the null (Fig 2).”
MethodInfluentialZagkos, L., Dib, M., Pinto, R. C., Gill, D., Koskeridis, F., Drenos, F., Markozannes, G., Elliott, P., Zuber, V., Tsilidis, K. K., et al. (2022) · PLoS Medicine · doi:10.1371/journal.pmed.1004141 · Cited by 68
“In sensitivity analyses, we applied the MR-Egger method to explore the assumption of no pleiotropy in genetic instruments [28].”
MethodDoes co-localization analysis reinforce the results of Mendelian randomization?
Yin, Q., & Zhu, L. (2023) · Brain · doi:10.1093/brain/awad295 · Cited by 71
Yin, Z., Liu, B., Feng, S., He, Y., Tang, C., Chen, P., Wang, X., & Wang, K. (2023) · Nutrients · doi:10.3390/nu15184086 · Cited by 64
“In the MR–Egger regression, intercepts were used to test directional horizontal pleiotropic effects [36].”
MethodKemp, J. P., Sayers, A. E., Smith, G. D., Tobias, J. H., & Evans, D. M. (2016) · International Journal of Epidemiology · doi:10.1093/ije/dyw079 · Cited by 67
“The other strategy we employed to evaluate the robustness of our results was MR Egger regression.(9) In this procedure, we first fitted univariate regressions of BMD on each of the 32 BMI-related genetic instruments and recorded the value of the slope coefficient and standard error for each variant.”
BackgroundMethodOng, J., Hwang, L., Zhong, V. W., An, J., Gharahkhani, P., Breslin, P. A. S., Wright, M. J., Lawlor, D. A., Whitfield, J. B., MacGregor, S., et al. (2018) · Scientific Reports · doi:10.1038/s41598-018-34713-z · Cited by 68
Hindy, G., Åkesson, K., Melander, O., Aragam, K. G., Haas, M. E., Nilsson, P. M., Kadam, U. T., & Orho‐Melander, M. (2019) · Arthritis & Rheumatology · doi:10.1002/art.40812 · Cited by 63
“We used 2- sample MR- Egger analyses and estimation of the Egger intercept, which reflects total horizontal pleiotropy (34), and 2- sample weighted median MR which can provide accurate estimates given that at least 50% of the variants are valid instruments (35).”
BackgroundMethodInfluentialLim, K. X., Rijsdijk, F. V., Hagenaars, S. P., Socrates, A., Choi, S. W., Coleman, J. R. I., Glanville, K. P., Lewis, C. M., & Pingault, J. (2020) · PLoS Medicine · doi:10.1371/journal.pmed.1003137 · Cited by 63
“We conducted univariable MR using (i) inverse variance weighting (IVW)—the most powerful method (but cannot account for directional pleiotropy) [62]; (ii) robust adjusted profile score (RAPS)—to account for the selection of weak instruments [63]; (iii) weighted median—more robust to directional pleiotropy than IVW, an…”
MethodFang, S., Yarmolinsky, J., Gill, D., Bull, C. J., Perks, C. M., the PRACTICAL Consortium, Davey Smith, G., Gaunt, T. R., & Richardson, T. G. (2023) · PLOS Medicine · doi:10.1371/journal.pmed.1003988 · Cited by 55
“When analysing the effects of LDL-c levels, the weighted median model (which allows up to half of the included SNPs to be pleiotropic and is less influenced by outliers) [41], the weighted mode model (which assumes that the most common effect is consistent with the true causal effect) [42], and the MR-Egger model (whi…”
MethodSurfactant protein D is a causal risk factor for COPD: results of Mendelian randomisation
Obeidat, M., Li, X., Burgess, S., Zhou, G., Fishbane, N., Hansel, N. N., Bossé, Y., Joubert, P., Hao, K., Nickle, D. C., et al. (2017) · European Respiratory Journal · doi:10.1183/13993003.00657-2017 · Cited by 59
Self-citationQian, F., Wang, S., Mitchell, J. S., McGuffog, L., Barrowdale, D., Leslie, G., Oosterwijk, J. C., Chung, W. K., Evans, D. G., Engel, C., et al. (2018) · JNCI Journal of the National Cancer Institute · doi:10.1093/jnci/djy132 · Cited by 64
“We also used the Egger test to assess for possible pleiotropic effects of the variants (ie, the effects are not mediated via the exposure), one of the assumptions for MR (28).”
MethodWigmore, E. M., Clarke, T.-K., Howard, D. M., Adams, M. J., Hall, L. S., Zeng, Y., Gibson, J., Davies, G., Fernandez-Pujals, A. M., Thomson, P. A., et al. (2017) · Translational Psychiatry · doi:10.1038/tp.2017.148 · Cited by 56
Sun, Y., Richmond, R. C., Chen, Y., & Mai, X. (2020) · PLoS ONE · doi:10.1371/journal.pone.0228206 · Cited by 64
“To test for horizontal pleiotropy, we calculated the intercept and 95% confidence interval (CI) of the MR-Egger regression line [17].”
MethodInfluentialCausal effects of inflammatory protein biomarkers on inflammatory diseases
Ek, W. E., Karlsson, T., Höglund, J., Rask‐Andersen, M., & Johansson, Å. (2021) · Science Advances · doi:10.1126/sciadv.abl4359 · Cited by 59
“These included the inverse-variance weighted ( 52 ), weighted median ( 53 ), and the MR-Egger ( 54 ) methods, of which the last two are developed to be robust against certain types of horizontal pleiotropy.”
MethodLi, Y., Guo, J., Cao, Z., & Wu, J. (2022) · Frontiers in Immunology · doi:10.3389/fimmu.2022.916645 · Cited by 62
“The MR-Egger regression model provided a relatively robust estimate independent of IV validity and an adjusted result by existing horizontal pleiotropy via the regression slope and intercept (31, 32).”
MethodMendelian randomization as a tool to gain insights into the mosaic causes of autoimmune diseases
Chen, C., Wang, P., Zhang, R.-D., Yang, F., Jiang, L.-Q., Fang, X., Zhao, Y., Wang, D., Ni, J., & Pan, H. (2022) · Autoimmunity Reviews · doi:10.1016/j.autrev.2022.103210 · Cited by 59
Causal associations between cardiorespiratory fitness and type 2 diabetes
Cai, L., Gonzales, T. I., Wheeler, E., Kerrison, N. D., Day, F. R., Langenberg, C., Perry, J. R. B., Brage, S., & Wareham, N. J. (2023) · Nature Communications · doi:10.1038/s41467-023-38234-w · Cited by 61
Ma, J., Li, Y., Li, P., Yang, X., Zhu, S., 马科, Gao, F., Gao, H., Zhang, H., Ma, X., et al. (2024) · Nature Communications · doi:10.1038/s41467-024-46973-7 · Cited by 64
Deary, I. J., Harris, S. E., & Hill, W. D. (2019) · Current Opinion in Psychology · doi:10.1016/j.copsyc.2018.07.005 · Cited by 56
“Methods have now been developed that test and correct for biological pleiotropy [49].”
BackgroundPatrick, M. T., Stuart, P. E., Zhang, H., Zhao, Q., Yin, X., He, K., Zhou, S., Mehta, N. N., Voorhees, J. J., Boehnke, M., et al. (2020) · Journal of Investigative Dermatology · doi:10.1016/j.jid.2020.11.025 · Cited by 63
“MR-Egger (Bowden et al., 2015) differs from standard MR because the intercept is included in the model to test and control for pleiotropy because when the effect of the exposures is zero, the outcome should be zero as well.”
MethodMendelian Randomization Studies of Cancer Risk: a Literature Review
Pierce, B. L., Kraft, P. L., & Zhang, C. (2018) · Current Epidemiology Reports · doi:10.1007/s40471-018-0144-1 · Cited by 60
Mendelian Randomization Analysis of Hemoglobin A1c as a Risk Factor for Coronary Artery Disease
Leong, A., Ji, C. F., Wheeler, E., Hivert, M., Liu, C., Merino, J., Dupuis, J., Tai, E. S., Rotter, J. I., Florez, J. C., et al. (2019) · Diabetes Care · doi:10.2337/dc18-1712 · Cited by 81
“regression (19) whereby a linear regres-”
BackgroundOverview of Mendelian Randomization Analysis
Lee, Y. H. (2020) · Journal of Rheumatic Diseases · doi:10.4078/jrd.2020.27.4.241 · Cited by 64
Wang, J., Zhuang, Z., Shao, C., Yu, C., Wang, W., Zhang, K., Meng, X., Gao, J. L., Tian, J., Zheng, J., et al. (2021) · Chinese Medical Journal · doi:10.1097/cm9.0000000000001505 · Cited by 60
“MR-Egger regression analysis was performed to assess the pleiotropic effects.([12]) The effect of the IV on exposure was plotted against its effect on the outcome, and an intercept distinct from the origin was used to assess the pleiotropic effects.”
BackgroundMethodInfluentialEpigenome-wide association meta-analysis of DNA methylation with coffee and tea consumption
Karabegović, I., Portilla-Fernández, E., Li, Y., Ma, J., Maas, S. C. E., Sun, D., Hu, E. A., Kühnel, B., Zhang, Y., Ambatipudi, S., et al. (2021) · Nature Communications · doi:10.1038/s41467-021-22752-6 · Cited by 60
“Yet the results of MR excluding potential pleiotropic variants were fairly similar and MR-Egger, implemented in this study, is an useful approach to account for pleiotropy 65 .”
Smoking, alcohol and coffee consumption and pregnancy loss: a Mendelian randomization investigation
Yuan, S., Liu, J., & Larsson, S. C. (2021) · Fertility and Sterility · doi:10.1016/j.fertnstert.2021.05.103 · Cited by 70
“The MR-Egger regression offers estimates after the adjustment for pleiotropy but compromises statistical power (22).”
A robust method for collider bias correction in conditional genome-wide association studies
Mahmoud, O., Dudbridge, F., Smith, G. D., Munafo, M. R., & Tilling, K. M. (2022) · Nature Communications · doi:10.1038/s41467-022-28119-9 · Cited by 79
Chen, X., Yao, T., Cai, J., Fu, X., Li, H., & Wu, J. (2022) · Progress in Neuro-Psychopharmacology and Biological Psychiatry · doi:10.1016/j.pnpbp.2022.110534 · Cited by 61
Sex Hormones and Risk of Aneurysmal Subarachnoid Hemorrhage: A Mendelian Randomization Study
Molenberg, R., Thio, C. H. L., Aalbers, M. W., Uyttenboogaart, M., ISGC Intracranial Aneurysm Working Group*, Larsson, S. C., Bakker, M. K., Ruigrok, Y. M., Snieder, H., & van Dijk, J. M. C. (2022) · Stroke · doi:10.1161/strokeaha.121.038035 · Cited by 66
“17,18 A significant nonzero Egger intercept is suggestive of unbalanced, directional horizontal pleiotropy.”
Lv, X., Xu, B., Tang, X., Liu, S., Qian, J., Guo, J., & Luo, J. (2023) · Frontiers in Neurology · doi:10.3389/fneur.2023.1143060 · Cited by 62
“The MR-Egger regression technique implies that all IVs are invalid, and its estimation accuracy is relatively low (30, 31).”
Ye, C.-J., Kong, L.-J., Wang, Y.-Y., Dou, C., Zheng, J., Xu, M., Xu, Y., Li, M., Zhao, Z.-Y., Lu, J.-L., et al. (2023) · Nature Human Behaviour · doi:10.1038/s41562-023-01646-1 · Cited by 58
Metabolic disorders and risk of cardiovascular diseases: a two-sample mendelian randomization study
Wang, Z., Chen, J., Zhu, L., Jiao, S., Chen, Y., & Sun, Y. (2023) · BMC Cardiovascular Disorders · doi:10.1186/s12872-023-03567-3 · Cited by 72
“The MR-Egger method can be performed to evaluate the horizontal polymorphism of the selected IVs [19].”
MethodYamazaki, H., Streicher, S. A., Wu, L., Fukuhara, S., Wagner, R. J., Heni, M., Grossman, S. R., Lenz, H., Setiawan, V. W., Marchand, L. L., et al. (2024) · Cell Reports Medicine · doi:10.1016/j.xcrm.2023.101391 · Cited by 66
Genetic links between ovarian ageing, cancer risk and de novo mutation rates
Stankovic, S., Shekari, S., Huang, Q. Q., Gardner, E. J., Ivarsdottir, E. V., Owens, N. D. L., Mavaddat, N., Azad, A., Hawkes, G., Kentistou, K. A., et al. (2024) · Nature · doi:10.1038/s41586-024-07931-x · Cited by 68
“These include Mendelian randomization Egger to identify and correct for unbalanced heterogeneity (‘horizontal pleiotropy’), indicated by a significant Egger intercept ( P 0.05) 91 , and weighted median (WM) and penalized weighted median (PWM) models to correct for balanced heterogeneity 92 .”
MethodInfluentialde Vries, P. S., Sabater-Lleal, M., Huffman, J. E., Marten, J., Song, C., Pankratz, N., Bartz, T. M., de Haan, H. G., Delgado, G. E., Eicher, J. D., et al. (2019) · Blood · doi:10.1182/blood-2018-05-849240 · Cited by 55
Xu, S., Gilliland, F. D., & Conti, D. V. (2019) · International Journal of Epidemiology · doi:10.1093/ije/dyz070 · Cited by 61
Orri, M., Séguin, J. R., Ryan, N. C., Tremblay, R. E., Côté, S. M., Turecki, G., & Geoffroy, M. (2020) · Molecular Psychiatry · doi:10.1038/s41380-020-0785-6 · Cited by 57
“We evaluated this assumption by computing the regression dilution I(2)(GX) statistic [44].”
MethodHowe, L. D., Kanayalal, R., Harrison, S., Beaumont, R. N., Davies, A. R., Frayling, T. M., Davies, N. M., Hughes, A., Jones, S. E., Sassi, F., et al. (2019) · International Journal of Epidemiology · doi:10.1093/ije/dyz240 · Cited by 66
Howey, R., Shin, S.-Y., Relton, C., Davey Smith, G., & Cordell, H. J. (2020) · PLOS Genetics · doi:10.1371/journal.pgen.1008198 · Cited by 54
“We also considered a recently-developed extension to multivariable MR [19, 68] termed “multivariable MR based on Bayesian model averaging” (MR-BMA) [25].”
MethodA Mendelian randomization study of the role of lipoprotein subfractions in coronary artery disease
Zhao, Q., Wang, J., Miao, Z., Zhang, N. R., Hennessy, S., Small, D. S., & Rader, D. J. (2021) · eLife · doi:10.7554/elife.58361 · Cited by 58
“The last condition is called the Instrument Strength Independent of Direct Effect (InSIDE) assumption in the MR literature [bowden2015mendelian].”
BackgroundMethodInfluentialArdissino, M., Slob, E. A. W., Millar, O., Reddy, R. K., Lazzari, L., Patel, K. H. K., Ryan, D., Johnson, M. R., Gill, D., & Ng, F. S. (2022) · Hypertension · doi:10.1161/hypertensionaha.121.18617 · Cited by 60
Meng, H., Jiang, L., Song, Z., & Wang, F. (2022) · Nutrients · doi:10.3390/nu14071327 · Cited by 62
“For KOA, the protective effect persisted in the sensitivity analyses in the MR-Egger methods and MR-PRESSO analyses after the removal of five outliers, but not in the weighted median methods.”
MethodInfluentialGenetic Liability to Rheumatoid Arthritis in Relation to Coronary Artery Disease and Stroke Risk
Yuan, S., Carter, P. R., Mason, A. M., Yang, F., Burgess, S., & Larsson, S. C. (2022) · Arthritis & Rheumatology · doi:10.1002/art.42239 · Cited by 58
“In a comparative study, power to detect causal effect is usually greater for the inverse variance – weighted method compared to the MR-Egger method in scenarios of different status of pleiotropy and satisfaction of the Instrument Strength Independent of Direct Effect assumption (33).”
InfluentialSelf-citationZhou, W., Cai, J., Li, Z., & Lin, Y. (2023) · Frontiers in Immunology · doi:10.3389/fimmu.2023.1132719 · Cited by 63
“As genetic variants are single nucleotide polymorphisms (SNPs) independent of confounding factors or reverse causality (10).”
MethodInfluentialMcGrath, I. M., Montgomery, G. W., & Mortlock, S. (2023) · Human Reproduction Update · doi:10.1093/humupd/dmad009 · Cited by 68
Cheng, W., Parker, N., Karadag, N., Koch, E. M., Hindley, G., Icick, R., Shadrin, A. A., O’Connell, K. S., Bjella, T. D., Bahrami, S., et al. (2023) · The Lancet Psychiatry · doi:10.1016/s2215-0366(23)00143-8 · Cited by 59
Luo, H. L., Bauer, A., Nano, J., Petrera, A., Rathmann, W., Herder, C., Hauck, S. M., Sun, B. B., Hoyer, A., Peters, A., et al. (2023) · Diabetologia · doi:10.1007/s00125-023-05943-2 · Cited by 64
The metabolome-wide signature of major depressive disorder
Jansen, R., Milaneschi, Y., Schranner, D., Kastenmüller, G., Arnold, M., Han, X., Dunlop, B. W., Rush, A. J., Kaddurah‐Daouk, R., & Penninx, B. W. J. H. (2024) · Molecular Psychiatry · doi:10.1038/s41380-024-02613-6 · Cited by 62
“The three MDD status groups did not differ in the proportion of subjects using lipid-modifying drugs (Supplementary Table S2).”
Liu, Y., Xiao, X., Yang, Y., Yao, R., Yang, Q., Zhu, Y., Yang, X., Zhang, S., Shen, L. H., & Jiao, B. (2024) · Alzheimer s & Dementia · doi:10.1002/alz.14049 · Cited by 62
Mendelian randomization with Egger pleiotropy correction and weakly informative Bayesian priors
Schmidt, A. F., & Dudbridge, F. (2018) · International Journal of Epidemiology · doi:10.1093/ije/dyx254 · Cited by 53
“Recently Bowden et al.(5) proposed a novel method related to the Egger test,(6) ‘Mendelian randomization Egger’ (MR-Egger/MRE), which corrects for potential violations of assumption (iii) by quantifying the amount of directional pleiotropy.”
MethodAge at menarche and osteoporosis: A Mendelian randomization study
Zhang, Q., Greenbaum, J., Zhang, W., Sun, C., & Deng, H. (2018) · Bone · doi:10.1016/j.bone.2018.09.015 · Cited by 64
“Nonetheless, the MR-Egger approach tends to provide robust causal effect estimates even if the selected SNPs are weak instruments [25].”
BackgroundInfluentialMadrid, A. S., Rasmussen, K. L., Rode, L., Frikke‐Schmidt, R., Nordestgaard, B. G., & Bojesen, S. E. (2019) · European Journal of Epidemiology · doi:10.1007/s10654-019-00563-w · Cited by 60
Miao, L., Deng, G., Yin, R., Nie, R.-J., Yang, S., Wang, Y., & Li, H. (2019) · European Journal of Preventive Cardiology · doi:10.1177/2047487319894679 · Cited by 60
Body mass index and risk of infections: a Mendelian randomization study of 101,447 individuals
Winther‐Jensen, M., Afzal, S., Jess, T., Nordestgaard, B. G., & Allin, K. H. (2020) · European Journal of Epidemiology · doi:10.1007/s10654-020-00630-7 · Cited by 62
Yang, C., Fagan, A. M., Perrin, R. J., Rhinn, H., Harari, O., & Cruchaga, C. (2022) · Genome Medicine · doi:10.1186/s13073-022-01140-9 · Cited by 53
“We were unable to use MR-Egger [53] or MR-PRESSO [54] to correct for horizontal pleiotropy as most of the proteins were only associated with one valid instrumental variable (F ≥ 10) after clumping.”
MethodHernáez, Á., Rogne, T., Skåra, K. H., Håberg, S. E., Page, C. M., Fraser, A., Burgess, S., Lawlor, D. A., & Magnus, M. C. (2021) · Human Reproduction · doi:10.1093/humrep/deab224 · Cited by 62
“…the MR-Egger and the weighted median and mode methods (a divergence among them would also suggest horizontal pleiotropy); and generating a scatterplot as a visual check for potentially pleiotropic outliers in the variant-specific causal estimates (Bowden et al. , 2015, 2016; Hemani et al. , 2018).”
Self-citationThe causal relationships between obstructive sleep apnea and elevated CRP and TNF-α protein levels
Yi, M., Zhao, W., Tan, Y. L., Fei, Q., Liu, K., Chen, Z., & Zhang, Y. (2022) · Annals of Medicine · doi:10.1080/07853890.2022.2081873 · Cited by 59
“In sensitivity analyses, we used MR Egger [27], Weighted median [28] and MR-Robust Adjusted Profile Score (RAPS) [29] to correct for any potential violations of the assumptions.”
MethodInfluentialSang, N., Gao, R., Zhang, M.-Y., Wu, Z., Wu, Z.-G., & Wu, G. (2022) · Frontiers in Immunology · doi:10.3389/fimmu.2022.918749 · Cited by 60
“If the intercept term is not 0, then horizontal pleiotropy is demonstrated (34).”
BackgroundMavromatis, L. A., Rosoff, D. B., Cupertino, R. B., Garavan, H., Mackey, S., & Lohoff, F. W. (2022) · JAMA Psychiatry · doi:10.1001/jamapsychiatry.2022.2196 · Cited by 60
Jin, T., Huang, W., Cao, F., Yu, X., Guo, S., Ying, Z., & Xu, C. (2022) · Frontiers in Immunology · doi:10.3389/fimmu.2022.1063110 · Cited by 56
“2) The selected IVs are not allowed to affect the outcome (dementia) through other pathways, only through specified exposure (SLE) (26).”
BackgroundYarmolinsky, J. W., Robinson, J. W., Mariosa, D., Karhunen, V., Huang, J. V., Dimou, N. L., Murphy, N., Burrows, K., Bouras, E., Smith‐Byrne, K., et al. (2024) · EBioMedicine · doi:10.1016/j.ebiom.2024.104991 · Cited by 56
“81 Standard errors from IVW models were in fl ated to account for weak linkage disequilibrium between SNPs by incorporating a correlation matrix using the 1000 Ge-nomes Phase 3 CEU reference panel.”
MethodWeng, L.-C. C., Roetker, N. S., Lutsey, P. L., Alonso, Á., Guan, W., Pankow, J. S., Folsom, A. R., Steffen, L. M., Pankratz, N., & Tang, W. (2018) · PLoS ONE · doi:10.1371/journal.pone.0195719 · Cited by 55
Mendelian randomization analysis of C-reactive protein on colorectal cancer risk
Wang, X., Dai, J. Y., Albanes, D., Arndt, V., Berndt, S. I., Bezieau, S., Brenner, H., Buchanan, D. D., Butterbach, K., Caan, B. J., et al. (2018) · International Journal of Epidemiology · doi:10.1093/ije/dyy244 · Cited by 55
“We also performed sensitivity analysis using Egger regression (32) for global pleiotropic effect.”
MethodBrouwers, M. C. G. J., Simons, N., Stehouwer, C. D. A., Koek, G. H., Schaper, N. C., & Isaacs, A. J. (2019) · Hepatology Communications · doi:10.1002/hep4.1319 · Cited by 55
“Both methods require both gene- exposure and gene-outcome data.(34,35) Unfortunately, geneexposure data were not available for reasons outlined in the Materials and Methods section.”
MethodCornish, A. J., Tomlinson, I. P. M., & Houlston, R. S. (2019) · Molecular Aspects of Medicine · doi:10.1016/j.mam.2019.01.002 · Cited by 56
Chiang, K.-M., Tsay, Y., Ng, T.-C. V., Yang, H., Huang, Y., Chen, C., & Pan, W. (2019) · Journal of Clinical Medicine · doi:10.3390/jcm8081202 · Cited by 55
“Additionally, the slope of the MR-Egger regression provided pleiotropy-corrected causal estimates; however, the estimated slope was underpowered unless the SNPs were combined to explain a large proportion of the variance in the exposure [30,31].”
MethodYeung, S. L. A., & Schooling, C. M. (2019) · BMJ Open Diabetes Research & Care · doi:10.1136/bmjdrc-2019-000872 · Cited by 56
Arsenault, B. J., Pelletier, W., Kaiser, Y., Perrot, N., Couture, C., Khaw, K.-T., Wareham, N. J., Bossé, Y., Pibarot, P., Stroes, E. S. G., et al. (2020) · JAMA Network Open · doi:10.1001/jamanetworkopen.2020.0129 · Cited by 52
Rosoff, D. B., Kaminsky, Z. A., McIntosh, A. M., Smith, G. D., & Lohoff, F. W. (2020) · Translational Psychiatry · doi:10.1038/s41398-020-01047-2 · Cited by 68
The Effect of Blood Lipids on the Left Ventricle
Aung, N., Sanghvi, M. M., Piechnik, S. K., Neubauer, S., Munroe, P. B., & Petersen, S. E. (2020) · Journal of the American College of Cardiology · doi:10.1016/j.jacc.2020.09.583 · Cited by 60
“10 was considered as evidence of pleiotropic bias (20).”
BackgroundHan, X., Ong, J., An, J., Craig, J. E., Gharahkhani, P., Hewitt, A. W., & MacGregor, S. (2020) · JAMA Ophthalmology · doi:10.1001/jamaophthalmol.2020.1231 · Cited by 58
Liu, Q., Tang, B., Zhu, Z., Kraft, P., Deng, Q., Stener-Victorin, E., & Jiang, X. (2022) · Diabetologia · doi:10.1007/s00125-022-05746-x · Cited by 56
“We carried out a series of sensitivity analyses to determine the robustness of the results, including using a weighted median estimator method [21] and an MREgger regression [22], which gave consistent estimates under relaxed assumptions.”
MethodYang, M.-J., Zhong, Z., Wang, Y., Li, J.-C., Guo, Q., Chen, X., & Wang, E. (2022) · Hypertension · doi:10.1161/hypertensionaha.122.19120 · Cited by 55
Liu, B., Ye, D., Yang, H., Song, J., Sun, X., He, Z., Mao, Y., & Hao, G. (2023) · BMC Gastroenterology · doi:10.1186/s12876-023-02791-7 · Cited by 62
“05, horizontal pleiotropy of SNPs might exist [30].”
BackgroundCirculating white blood cell traits and colorectal cancer risk: A Mendelian randomisation study
Constantinescu, A., Bull, C. J., Jones, N., Mitchell, R. E., Burrows, K., Dimou, N. L., Bezieau, S., Brenner, H., Buchanan, D. D., D’Amato, M., et al. (2023) · International Journal of Cancer · doi:10.1002/ijc.34691 · Cited by 57
“…of sensitivity MR analyses were undertaken to identify horizontal pleiotropy: MR-Egger (where the regression intercept is not constrained to zero), 36 Weighted median (the median of all SNP ratio estimates, where each ratio is weighted by the inverse of the variance), 37 Weighted modes (assumes…”
BackgroundYin, K., Chen, T., Gu, X., Su, W., Jiang, Z., Lu, S., Cao, B., Chi, L., Gao, X., & Chen, Y. (2024) · Journal of Cachexia Sarcopenia and Muscle · doi:10.1002/jcsm.13479 · Cited by 59
“30 Heterogeneity was quanti fi ed by the IVW Q statistic, and pleiotropy was assessed by the MR-Egger intercept.”
MethodTwo-Sample Instrumental Variable Analyses Using Heterogeneous Samples
Zhao, Q., Wang, J., Spiller, W., Bowden, J., & Small, D. S. (2019) · Statistical Science · doi:10.1214/18-sts692 · Cited by 69
“On the methodological side, the commonly used metaanalysis estimators in this problem include Egger regression (Bowden et al., 2015) and weighted median (Bowden et al.”
BackgroundMethodInfluentialSelf-citation
Metadata
- Authors
- Bowden, J., Davey Smith, G., & Burgess, S.
- Affiliations
- University of Cambridge (GB)
- Corresponding author
- Bowden, J.
- Venue
- International Journal of Epidemiology
- Publisher
- Oxford University Press (OUP)
- Published
- 2015-04-01
- Volume
- 44
- Issue
- 2
- Pages
- 512-525
- ISSN
- 0300-5771 (ISSN-L)
- 1464-3685
- PMC
- PMC4469799
- OpenAlex
- W2113699335
- Cited by
- 9,816
- References
- 50
- Citations by year
- 2026: 937 · 2025: 1929 · 2024: 2977 · 2023: 1482 · 2022: 797 · 2021: 590 · 2020: 379 · 2019: 283 · 2018: 205 · 2017: 123 · 2016: 88 · 2015: 21
- FWCI
- 100.13
- Type
- journal article
- Language
- en
- Open access
- hybrid
- doi.org
- Licence
- cc-by
- Locations
- International Journal of Epidemiology (publishedVersion, cc-by)
- PubMed Central (publishedVersion, cc-by)
- PubMed (publishedVersion)
- Bristol Research (University of Bristol) (submittedVersion, cc-by)
- Apollo (University of Cambridge) (submittedVersion, cc-by)
- Explore Bristol Research (submittedVersion, cc-by)
- Funders
- Wellcome Trust (MC_UU_12013_8, 100114)
- National Institute for Health and Care Research (NF-SI-0512-10165)
- British Heart Foundation (SP/08/007/23628, RG/08/014/24067)
- University of Bristol (MC_UU_12013/2)
- Medical Research Council (MC_UU_12013_2, MC_UU_12013_5, MR/N501906/1, MC UU 12013/8, MR/L012286/1, MR/L003120/1)
- Topics
- Life Sciences › Biochemistry, Genetics and Molecular Biology › Genetics › Genetic Associations and Epidemiology
- Physical Sciences › Mathematics › Statistics and Probability › Advanced Causal Inference Techniques
- Social Sciences › Decision Sciences › Statistics, Probability and Uncertainty › Meta-analysis and systematic reviews
- Keywords
- Mendelian randomization, invalid instruments, pleiotropy, MR-Egger, small-study bias, multiple instruments, causal effect estimation, bias detection, sensitivity analysis
- MeSH terms
- Blood Pressure, Body Height, Coronary Artery Disease, Humans, Models, Biological, Regression Analysis, Respiration, Statistics as Topic, Genetic Variation, Meta-Analysis as Topic, Bias, Causality, Risk Assessment, Mendelian Randomization Analysis, Genetic Pleiotropy
About these checks
Registry, retraction, Cites and statistics results are computed, not judged, with one exception: a printed reference that no index lists is read once by a model before it counts as a citation error. Claims are extracted by a model and kept only when their quote appears verbatim in the text; each cited source is then checked, with a model’s help, for whether it says what the claim relies on. Those verdicts can be wrong — read the claim’s quote and the cited source before relying on one.
Statistics and arithmetic are recomputed, not judged.
Confidence bands are shown only for fields calibrated on our annotated test set. None is calibrated yet, so no band is shown.
What counts as a claim ›How we measure confidence ›How we check this ›
Are you an author, or do you see a problem with this page? Request a review
Data sources
Bibliographic data: Semantic Scholar, OpenAlex, Crossref.
Contains information from the Semantic Scholar Academic Graph Datasets, made available under the ODC Attribution License (ODC-BY 1.0).
Semantic Scholar’s data is described in: Kinney, R., et al. (2023). The Semantic Scholar Open Data Platform. arXiv:2301.10140.
