

The DOI matches its Crossref record; 53 of the 53 references it cites were found in a registry or an index.
Dynamics of Neutralizing Antibody Titers in the Months After Severe Acute Respiratory Syndrome Coronavirus 2 Infection
Open accessPublished version of a preprint
Abstract
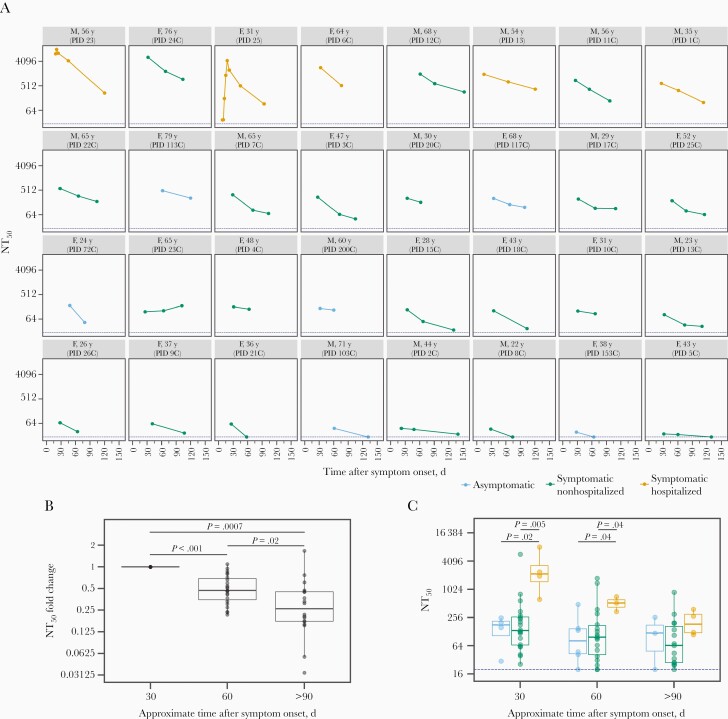
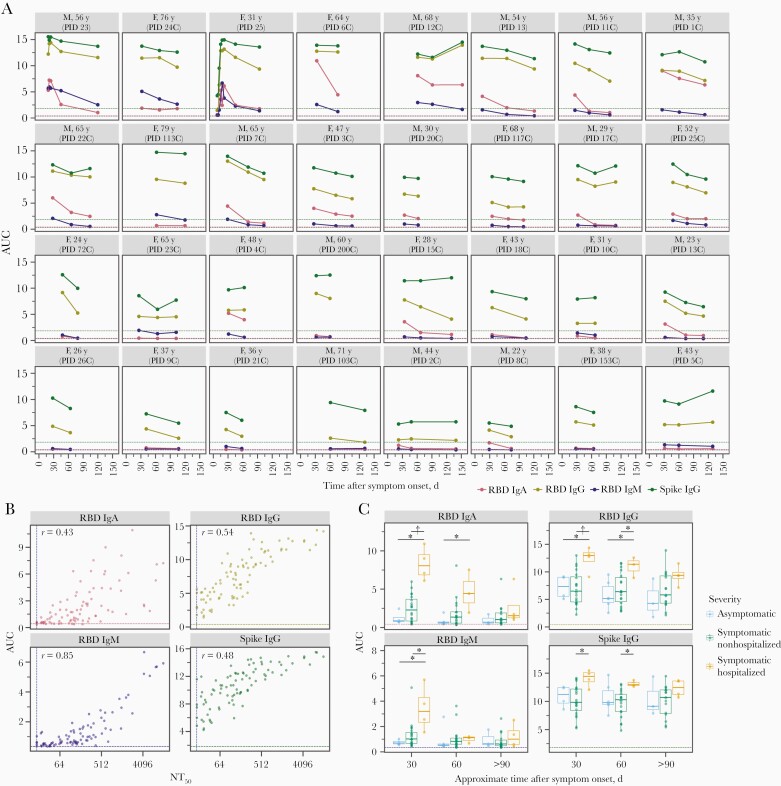
Most individuals infected with severe acute respiratory syndrome coronavirus 2 (SARS-CoV-2) develop neutralizing antibodies that target the viral spike protein. In this study, we quantified how levels of these antibodies change in the months after SARS-CoV-2 infection by examining longitudinal samples collected approximately 30–152 days after symptom onset from a prospective cohort of 32 recovered individuals with asymptomatic, mild, or moderate-severe disease. Neutralizing antibody titers declined an average of about 4-fold from 1 to 4 months after symptom onset. This decline in neutralizing antibody titers was accompanied by a decline in total antibodies capable of binding the viral spike protein or its receptor-binding domain. Importantly, our data are consistent with the expected early immune response to viral infection, where an initial peak in antibody levels is followed by a decline to a lower plateau. Additional studies of long-lived B cells and antibody titers over longer time frames are necessary to determine the durability of immunity to SARS-CoV-2.
Overview
The claims and statistics of this paper haven’t been checked yet.
Run the check — free, no account needed. It reads the open-access text and checks the sources it cites.
Integrity signals
Registry
Cites
Statistics
Figures
Verification
Claims the paper makes
The claims and statistics of this paper haven’t been checked yet.
Run the check — free, no account needed. It reads the open-access text and checks the sources it cites.
Claims other papers make about this one
Each is checked against this paper’s own text: does it say what the citing paper says it does?
In the citing paper
“However, neutralizing antibody responses decay rapidly in early convalescence9,14–17.”
From Prospects for durable immune control of SARS-CoV-2 and prevention of reinfection (2021) · cites this paper as [15]
Self-check
Percentages, sums and reported differences re-computed from the paper’s own numbers.
The self-check needs the paper’s full text.
Citations
Cites
Harris, P. A., Taylor, R., Thielke, R., Payne, J., Gonzalez, N., & Conde, J. G. (2009) · Journal of Biomedical Informatics · doi:10.1016/j.jbi.2008.08.010 · Cited by 51,384
Structure, function and antigenicity of the SARS-CoV-2 spike glycoprotein
Walls, A. C., Park, Y.-J., Tortorici, M. A., Wall, A., McGuire, A. T., & Veesler, D. (2020) · doi:10.1101/2020.02.19.956581 · Cited by 8,586
Ou, X., Liu, Y., Lei, X., Li, P., Mi, D., Ren, L., Guo, L., Guo, R., Chen, T., Hu, J., et al. (2020) · Nature Communications · doi:10.1038/s41467-020-15562-9 · Cited by 3,097
Antibody responses to SARS-CoV-2 in patients with COVID-19
Long, Q.-X., Liu, B.-Z., Deng, H.-J., Wu, G.-C., Deng, K., Chen, Y.-K., Liao, P., Qiu, J.-F., Lin, Y., Cai, X.-F., et al. (2020) · Nature Medicine · doi:10.1038/s41591-020-0897-1 · Cited by 2,876
Clinical and immunological assessment of asymptomatic SARS-CoV-2 infections
Long, Q.-X., Tang, X.-J., Shi, Q.-L., Li, Q., Deng, H.-J., Yuan, J., Hu, J.-L., Xu, W., Zhang, Y., Lv, F.-J., et al. (2020) · Nature Medicine · doi:10.1038/s41591-020-0965-6 · Cited by 2,686
Antibody Responses to SARS-CoV-2 in Patients With Novel Coronavirus Disease 2019
Zhao, J., Yuan, Q., Wang, H., Liu, W., Liao, X., Su, Y., Wang, X., Yuan, J., Li, T., Li, J., et al. (2020) · Clinical Infectious Diseases · doi:10.1093/cid/ciaa344 · Cited by 2,607
Convergent Antibody Responses to SARS-CoV-2 in Convalescent Individuals
Robbiani, D. F., Gaebler, C., Muecksch, F., Lorenzi, J. C. C., Wang, Z., Cho, A., Agudelo, M., Barnes, C. O., Gazumyan, A., Finkin, S., et al. (2020) · Nature · doi:10.1038/s41586-020-2456-9 · Cited by 1,853
A serological assay to detect SARS-CoV-2 seroconversion in humans
Amanat, F., Stadlbauer, D., Strohmeier, S., Nguyen, T. H. O., Chromikova, V., McMahon, M., Jiang, K., Arunkumar, G. A., Jurczyszak, D., Polanco, J., et al. (2020) · Nature Medicine · doi:10.1038/s41591-020-0913-5 · Cited by 1,769
Human neutralizing antibodies elicited by SARS-CoV-2 infection
Ju, B., Zhang, Q., Ge, J., Wang, R., Sun, J., Ge, X., Yu, J., Shan, S., Zhou, B., Song, S., et al. (2020) · Nature · doi:10.1038/s41586-020-2380-z · Cited by 1,667
Seow, J., Graham, C., Merrick, B., Acors, S., Pickering, S., Steel, K. J. A., Hemmings, O., O’Byrne, A., Kouphou, N., Galao, R. P., et al. (2020) · Nature Microbiology · doi:10.1038/s41564-020-00813-8 · Cited by 1,419
Research works printed but not linked: 1
- Wu, medRxiv [Preprint]
Cited by
Sorted by citations
Khoury, D. S., Cromer, D., Reynaldi, A., Schlub, T. E., Wheatley, A. K., Juno, J. A., Subbarao, K., Kent, S. J., Triccas, J. A., & Davenport, M. P. (2021) · Nature Medicine · doi:10.1038/s41591-021-01377-8 · Cited by 3,742
Evolution of antibody immunity to SARS-CoV-2
Gaebler, C., Wang, Z., Lorenzi, J. C. C., Muecksch, F., Finkin, S., Tokuyama, M., Cho, A., Jankovic, M., Schaefer-Babajew, D., Oliveira, T. Y., et al. (2021) · Nature · doi:10.1038/s41586-021-03207-w · Cited by 1,674
Seow, J., Graham, C., Merrick, B., Acors, S., Pickering, S., Steel, K. J. A., Hemmings, O., O’Byrne, A., Kouphou, N., Galao, R. P., et al. (2020) · Nature Microbiology · doi:10.1038/s41564-020-00813-8 · Cited by 1,419
Greaney, A. J., Loes, A. N., Crawford, K. H. D., Starr, T. N., Malone, K. D., Chu, H. Y., & Bloom, J. D. (2021) · Cell Host & Microbe · doi:10.1016/j.chom.2021.02.003 · Cited by 1,178
Self-citationGreaney, A. J., Starr, T. N., Gilchuk, P., Zost, S. J., Binshtein, E., Loes, A. N., Hilton, S. K., Huddleston, J., Eguia, R., Crawford, K. H. D., et al. (2021) · Cell Host & Microbe · doi:10.1016/j.chom.2020.11.007 · Cited by 1,016
Self-citationPersistence of serum and saliva antibody responses to SARS-CoV-2 spike antigens in COVID-19 patients
Isho, B., Abe, K. T., Zuo, M., Jamal, A. J., Rathod, B., Wang, J. H., Li, Z., Chao, G., Rojas, O. L., Bang, Y. M., et al. (2020) · Science Immunology · doi:10.1126/sciimmunol.abe5511 · Cited by 822
Prospective mapping of viral mutations that escape antibodies used to treat COVID-19
Starr, T. N., Greaney, A. J., Addetia, A., Hannon, W. W., Choudhary, M. C., Dingens, A. S., Li, J. Z., & Bloom, J. D. (2021) · Science · doi:10.1126/science.abf9302 · Cited by 743
Self-citationAddetia, A., Crawford, K. H. D., Dingens, A., Zhu, H., Roychoudhury, P., Huang, M.-L., Jerome, K. R., Bloom, J. D., & Greninger, A. L. (2020) · Journal of Clinical Microbiology · doi:10.1128/jcm.02107-20 · Cited by 525
Self-citationThe first 12 months of COVID-19: a timeline of immunological insights
Carvalho, T., Krammer, F., & Iwasaki, A. (2021) · Nature reviews. Immunology · doi:10.1038/s41577-021-00522-1 · Cited by 483
Evolution of immune responses to SARS-CoV-2 in mild-moderate COVID-19
Wheatley, A. K., Juno, J. A., Wang, J. J., Selva, K. J., Reynaldi, A., Tan, H.-X., Lee, W. S., Wragg, K. M., Kelly, H. G., Esterbauer, R., et al. (2021) · Nature Communications · doi:10.1038/s41467-021-21444-5 · Cited by 351
Estimated SARS-CoV-2 Seroprevalence in the US as of September 2020
Bajema, K. L., Wiegand, R. E., Cuffe, K. M., Patel, S. V., Iachan, R., Lim, T. W., Lee, A., Moyse, D., Havers, F. P., Harding, L., et al. (2020) · JAMA Internal Medicine · doi:10.1001/jamainternmed.2020.7976 · Cited by 272
Prospects for durable immune control of SARS-CoV-2 and prevention of reinfection
Cromer, D., Juno, J. A., Khoury, D., Reynaldi, A., Wheatley, A. K., Kent, S. J., & Davenport, M. P. (2021) · Nature Reviews Immunology · doi:10.1038/s41577-021-00550-x · Cited by 265
A human coronavirus evolves antigenically to escape antibody immunity
(2021) · doi:10.1371/journal.ppat.1009453 · Cited by 258
Self-citationA human coronavirus evolves antigenically to escape antibody immunity
Eguia, R., Crawford, K. H. D., Stevens-Ayers, T., Kelnhofer-Millevolte, L., Greninger, A. L., Englund, J. A., Boeckh, M. J., & Bloom, J. D. (2020) · doi:10.1101/2020.12.17.423313 · Cited by 258
Self-citationGreaney, A. J., Loes, A. N., Gentles, L. E., Crawford, K. H. D., Starr, T. N., Malone, K. D., Chu, H. Y., & Bloom, J. D. (2021) · Science Translational Medicine · doi:10.1126/scitranslmed.abi9915 · Cited by 244
Self-citationRecent advances and challenges of RT-PCR tests for the diagnosis of COVID-19
Teymouri, M., Mollazadeh, S., Mortazavi, H., Ghale-Noie, Z. N., Keyvani, V., Aghababaei, F., Hamblin, M. R., Abbaszadeh‐Goudarzi, G., Pourghadamyari, H., Hashemian, S. M. R., et al. (2021) · Pathology - Research and Practice · doi:10.1016/j.prp.2021.153443 · Cited by 228
A simple protein-based surrogate neutralization assay for SARS-CoV-2
Abe, K. T., Li, Z., Samson, R., Samavarchi‐Tehrani, P., Valcourt, E. J., Wood, H., Budylowski, P., Dupuis, A. P., Girardin, R. C., Rathod, B., et al. (2020) · JCI Insight · doi:10.1172/jci.insight.142362 · Cited by 200
Ward, H., Cooke, G., Atchison, C. J., Whitaker, M. D., Elliott, J., Moshe, M., Brown, J. C., Flower, B., Daunt, A., Ainslie, K. E. C., et al. (2021) · The Lancet Regional Health - Europe · doi:10.1016/j.lanepe.2021.100098 · Cited by 198
A pseudovirus system enables deep mutational scanning of the full SARS-CoV-2 spike
Dadonaite, B., Crawford, K. H. D., Radford, C. E., Farrell, A. G., Yu, T. C., Hannon, W. W., Zhou, P.-P., Andrabi, R., Burton, D. R., Liu, L., et al. (2023) · Cell · doi:10.1016/j.cell.2023.02.001 · Cited by 186
Self-citationProlonged evolution of the human B cell response to SARS-CoV-2 infection
Sakharkar, M., Rappazzo, C. G., Wieland-Alter, W. F., Hsieh, C.-L., Wrapp, D., Esterman, E. S., Kaku, C. I., Wec, A. Z., Geoghegan, J. C., McLellan, J. S., et al. (2021) · Science Immunology · doi:10.1126/sciimmunol.abg6916 · Cited by 174
Immunity to SARS‐CoV‐2 induced by infection or vaccination
Dopico, X. C., Ols, S., Loré, K., & Hedestam, G. B. K. (2021) · Journal of Internal Medicine · doi:10.1111/joim.13372 · Cited by 172
Mallajosyula, V. V. A., Ganjavi, C., Chakraborty, S., McSween, A. M., Pavlovitch-Bedzyk, A. J., Wilhelmy, J., Nau, A. N., Manohar, M., Nadeau, K. C., & Davis, M. M. (2021) · Science Immunology · doi:10.1126/sciimmunol.abg5669 · Cited by 168
Letizia, A. G., Ge, Y., Vangeti, S., Goforth, C. W., Weir, D. L., Kuzmina, N. A., Balinsky, C. A., Chen, H. W., Ewing, D. F., Schanoski, A. S., et al. (2021) · SSRN Electronic Journal · doi:10.1016/s2213-2600(21)00158-2 · Cited by 153
Antibody titers against SARS-CoV-2 decline, but do not disappear for several months
Yamayoshi, S., Yasuhara, A., Ito, M., Akasaka, O., Nakamura, M., Nakachi, I., Koga, M., Mitamura, K., Yagi, K., Maeda, K., et al. (2021) · EClinicalMedicine · doi:10.1016/j.eclinm.2021.100734 · Cited by 151
Graham, C., Seow, J., Huettner, I., Khan, H., Kouphou, N., Acors, S., Winstone, H., Pickering, S., Galão, R. P., Dupont, L., et al. (2021) · Immunity · doi:10.1016/j.immuni.2021.03.023 · Cited by 155
Understanding neutralising antibodies against SARS-CoV-2 and their implications in clinical practice
Pang, N. Y., Pang, A. S., Chow, V. T. K., & Wang, D. Y. (2021) · Military Medical Research · doi:10.1186/s40779-021-00342-3 · Cited by 146
Self, W. H., Tenforde, M. W., Stubblefield, W. B., Feldstein, L. R., Steingrub, J. S., Shapiro, N. I., Ginde, A. A., Prekker, M. E., Brown, S. M., Peltan, I. D., et al. (2020) · MMWR Morbidity and Mortality Weekly Report · doi:10.15585/mmwr.mm6947a2 · Cited by 135
Anti-spike antibody response to natural SARS-CoV-2 infection in the general population
Wei, J., Matthews, P. C., Stoesser, N. E., Maddox, T., Lorenzi, L., Studley, R., Bell, J. I., Newton, J. N., Farrar, J., Diamond, I. D., et al. (2021) · Nature Communications · doi:10.1038/s41467-021-26479-2 · Cited by 136
The scientific and ethical feasibility of immunity passports
Brown, R. C. H., Kelly, D. F., Wilkinson, D. J. C., & Savulescu, J. (2020) · The Lancet Infectious Diseases · doi:10.1016/s1473-3099(20)30766-0 · Cited by 136
Does infection with or vaccination against SARS-CoV-2 lead to lasting immunity?
Milne, G., Hames, T., Scotton, C. J., Gent, N., Johnsen, A., Anderson, R. M., & Ward, T. (2021) · The Lancet Respiratory Medicine · doi:10.1016/s2213-2600(21)00407-0 · Cited by 123
Antibody-dependent cellular cytotoxicity response to SARS-CoV-2 in COVID-19 patients
Yu, Y., Wang, M., Zhang, X., Li, S., Lu, Q., Zeng, H., Hou, H., Li, H., Zhang, M., Jiang, F., et al. (2021) · Signal Transduction and Targeted Therapy · doi:10.1038/s41392-021-00759-1 · Cited by 122
Antibody Response After SARS-CoV-2 Infection and Implications for Immunity
Arkhipova-Jenkins, I., Helfand, M., Armstrong, C., Gean, E. G., Anderson, J., Paynter, R. A., & Mackey, K. (2021) · Annals of Internal Medicine · doi:10.7326/m20-7547 · Cited by 116
Yang, Y., Yang, M., Peng, Y., Liang, Y., Wei, J., Xing, L., Guo, L., Li, X., Li, J., Wang, J., et al. (2022) · Nature Microbiology · doi:10.1038/s41564-021-01051-2 · Cited by 111
Dupont, L., Snell, L. B., Graham, C., Seow, J., Merrick, B., Lechmere, T., Maguire, T. J. A., Hallett, S. R., Pickering, S., Charalampous, T., et al. (2021) · Nature Microbiology · doi:10.1038/s41564-021-00974-0 · Cited by 102
den Hartog, G., Vos, E. R. A., van den Hoogen, L. L., van Boven, M., Schepp, R. M., Smits, G., van Vliet, J., Woudstra, L., Wijmenga-Monsuur, A. J., van Hagen, C. C. E., et al. (2021) · Clinical Infectious Diseases · doi:10.1093/cid/ciab172 · Cited by 92
Durability of Vaccine-Induced and Natural Immunity Against COVID-19: A Narrative Review
Pooley, N., Karim, S. S. A., Combadière, B., Ooi, E. E., Harris, R. C., Guerche‐Séblain, C. E., Kisomi, M., & Shaikh, N. (2023) · Infectious Diseases and Therapy · doi:10.1007/s40121-022-00753-2 · Cited by 95
B cell genomics behind cross-neutralization of SARS-CoV-2 variants and SARS-CoV
Scheid, J. F., Barnes, C. O., Eraslan, B., Hudak, A., Keeffe, J. R., Cosimi, L. A., Brown, E., Muecksch, F., Weisblum, Y., Zhang, S., et al. (2021) · Cell · doi:10.1016/j.cell.2021.04.032 · Cited by 90
The success of SARS-CoV-2 vaccines and challenges ahead
Subbarao, K. (2021) · Cell Host & Microbe · doi:10.1016/j.chom.2021.06.016 · Cited by 92
Neutralizing Antibodies in COVID-19 Patients and Vaccine Recipients after Two Doses of BNT162b2
Favresse, J., Gillot, C., Chiaro, L. D., Eucher, C., Elsen, M., Eeckhoudt, S. V., David, C., Morimont, L., Dogné, J., & Douxfils, J. (2021) · Viruses · doi:10.3390/v13071364 · Cited by 85
Decay of Fc-dependent antibody functions after mild to moderate COVID-19
Lee, W. S., Selva, K. J., Davis, S. K., Wines, B. D., Reynaldi, A., Esterbauer, R., Kelly, H. G., Haycroft, E. R., Tan, H., Juno, J. A., et al. (2021) · Cell Reports Medicine · doi:10.1016/j.xcrm.2021.100296 · Cited by 81
Koerber, N., Priller, A., Yazici, S., Bauer, T., Cheng, C., Mijočević, H., Wintersteller, H., Jeske, S. D., Vogel, E., Feuerherd, M., et al. (2022) · Nature Communications · doi:10.1038/s41467-021-27649-y · Cited by 75
Challenges and developments in universal vaccine design against SARS-CoV-2 variants
Zhao, F., Zai, X., Zhang, Z., Xu, J., & Chen, W. (2022) · npj Vaccines · doi:10.1038/s41541-022-00597-4 · Cited by 83
Lee, J.-S., Kim, S. Y., Kim, T. S., Hong, K. H., Ryoo, N.-H., Lee, J., Park, J. H., Cho, S. I., Kim, M. J., Kim, Y.-G., et al. (2021) · Clinical Infectious Diseases · doi:10.1093/cid/ciaa1421 · Cited by 73
Li, C., Yu, D., Wu, X. J., Hong, L., Zhou, Z., Xie, Y., Li, T., Wu, J., Lu, F., Feng, L. Z., et al. (2021) · Nature Communications · doi:10.1038/s41467-021-24230-5 · Cited by 75
Lin, Y., Wang, G., Shen, Y., Wang, Z.-Y., Zhan, B.-D., Duan, L., Lu, B., Shi, C., Gao, Y., Peng, H.-H., et al. (2021) · The Journal of Infectious Diseases · doi:10.1093/infdis/jiab255 · Cited by 69
Terpos, E., Stellas, D., Rosati, M., Sergentanis, T. Ν., Hu, X., Politou, M., Pappa, V., Ntanasis‐Stathopoulos, I., Karaliota, S., Bear, J., et al. (2021) · European Journal of Internal Medicine · doi:10.1016/j.ejim.2021.05.010 · Cited by 68
Irsara, C., Egger, A., Prokop, W., Nairz, M., Loacker, L., Sahanic, S., Pizzini, A., Sonnweber, T., Holzer, B., Mayer, W., et al. (2021) · Clinical Chemistry and Laboratory Medicine (CCLM) · doi:10.1515/cclm-2021-0214 · Cited by 65
Dynamics of antibodies to SARS‐CoV‐2 in convalescent plasma donors
Steenhuis, M., van Mierlo, G. J., Derksen, N. I. L., Heer, P. O., Kruithof, S., Loeff, F. C., Berkhout, L. C., Linty, F., Reusken, C. B. E. M., Reimerink, J. H. J., et al. (2021) · Clinical & Translational Immunology · doi:10.1002/cti2.1285 · Cited by 63
Defending against SARS-CoV-2: The T cell perspective
Almendro-Vázquez, P., Laguna‐Goya, R., & Paz‐Artal, E. (2023) · Frontiers in Immunology · doi:10.3389/fimmu.2023.1107803 · Cited by 67
A SARS-CoV-2 variant elicits an antibody response with a shifted immunodominance hierarchy
Greaney, A. J., Starr, T. N., Eguia, R. T., Loes, A. N., Khan, K., Karim, F., Cele, S., Bowen, J. E., Logue, J. K., Corti, D., et al. (2022) · PLoS Pathogens · doi:10.1371/journal.ppat.1010248 · Cited by 58
Self-citationJeffery-Smith, A., Rowland, T. A. J., Patel, M., Whitaker, H., Iyanger, N., Williams, S. V., Giddings, R., Thompson, L., Zavala, M., Aiano, F., et al. (2021) · The Lancet Healthy Longevity · doi:10.1016/s2666-7568(21)00253-1 · Cited by 60
Comorbid illnesses are associated with altered adaptive immune responses to SARS-CoV-2
Yu, K. K. Q., Fischinger, S., Smith, M. T., Atyeo, C. G., Cizmeci, D., Wolf, C. R., Layton, E. D., Logue, J. K., Aguilar, M. S., Shuey, K. D., et al. (2021) · JCI Insight · doi:10.1172/jci.insight.146242 · Cited by 56
Self-citationFocosi, D., Maggi, F., Mazzetti, P., & Pistello, M. (2020) · Reviews in Medical Virology · doi:10.1002/rmv.2170 · Cited by 59
Expression and characterization of SARS-CoV-2 spike proteins
Schaub, J. M., Chou, C., Kuo, H., Javanmardi, K., Hsieh, C., Goldsmith, J. A., DiVenere, A. M., Le, K. C., Wrapp, D., Byrne, P. O., et al. (2021) · Nature Protocols · doi:10.1038/s41596-021-00623-0 · Cited by 57
Glück, V., Grobecker, S., Tydykov, L., Salzberger, B., Glück, T., Weidlich, T., Bertok, M., Gottwald, C., Wenzel, J. J., Gessner, A., et al. (2021) · Infection · doi:10.1007/s15010-021-01598-6 · Cited by 55
Grandjean, L., Saso, A., Ortiz, A. T., Lam, T., Hatcher, J., Thistlethwayte, R., Harris, M., Best, T., Johnson, M., Wagstaffe, H. R., et al. (2021) · Clinical Infectious Diseases · doi:10.1093/cid/ciab607 · Cited by 55
Antibody Duration After Infection From SARS-CoV-2 in the Texas Coronavirus Antibody Response Survey
Swartz, M. D., DeSantis, S. M., Yaseen, A. S., Brito, F. A., Valerio-Shewmaker, M. A., Messiah, S. E., León‐Novelo, L., Kohl, H. W., Pinzon-Gomez, C. L., Hao, T., et al. (2022) · The Journal of Infectious Diseases · doi:10.1093/infdis/jiac167 · Cited by 56
Favresse, J., Eucher, C., Elsen, M., Gillot, C., Eeckhoudt, S. V., Dogné, J., & Douxfils, J. (2021) · Microorganisms · doi:10.3390/microorganisms9030556 · Cited by 54
Struck, F., Schreiner, P. A., Staschik, E., Wochinz‐Richter, K., Schulz, S., Soutschek, E., Motz, M., & Bauer, G. (2021) · Journal of Medical Virology · doi:10.1002/jmv.27270 · Cited by 52
Gerhards, C., Thiaucourt, M., Kittel, M., Becker, C., Ast, V., Hetjens, M., Neumaier, M., & Haselmann, V. (2021) · International Journal of Infectious Diseases · doi:10.1016/j.ijid.2021.04.080 · Cited by 51
Markmann, A. J., Giallourou, N., Bhowmik, D. R., Hou, Y. J., Lerner, A., Martinez, D. R., Premkumar, L., Root, H. B., van Duin, D., Napravnik, S., et al. (2021) · mSphere · doi:10.1128/msphere.00275-21 · Cited by 54
Multiple Routes of Antibody-Dependent Enhancement of SARS-CoV-2 Infection
Okuya, K., Hattori, T., Saito, T., Takadate, Y., Sasaki, M., Furuyama, W., Marzi, A., Ohiro, Y., Konno, S., Hattori, T., et al. (2022) · Microbiology Spectrum · doi:10.1128/spectrum.01553-21 · Cited by 53
Ellis, D., Brunette, N., Crawford, K. H. D., Walls, A. C., Pham, M. N., Chen, C., Herpoldt, K., Fiala, B., Murphy, M., Pettie, D., et al. (2021) · Frontiers in Immunology · doi:10.3389/fimmu.2021.710263 · Cited by 45
Self-citationMuecksch, F., Wise, H. M., Templeton, K. E., Batchelor, B., Squires, M., McCance, K., JARVIS, L. M., Malloy, K., Furrie, E., Richardson, C., et al. (2022) · The Lancet Microbe · doi:10.1016/s2666-5247(22)00090-8 · Cited by 48
COVID ‐19 and plasma cells: Is there long‐lived protection?*
Nguyen, D. C., Lamothe, P. A., Woodruff, M. C., Saini, A. S., Faliti, C. E., Sanz, I., & Lee, F. E.-H. (2022) · Immunological Reviews · doi:10.1111/imr.13115 · Cited by 48
Loes, A. N., Gentles, L. E., Greaney, A. J., Crawford, K. H. D., & Bloom, J. D. (2020) · Viruses · doi:10.3390/v12090987 · Cited by 44
Self-citationSandberg, J. T., Varnaitė, R., Christ, W., Chen, P., Muvva, J. R., Maleki, K. T., García, M., Dzidic, M., Folkesson, E., Skagerberg, M., et al. (2021) · Clinical & Translational Immunology · doi:10.1002/cti2.1306 · Cited by 45
Guenthoer, J., Lilly, M., Starr, T. N., Dadonaite, B., Lovendahl, K. N., Croft, J. T., Stoddard, C. I., Chohan, V., Ding, S., Ruiz, F., et al. (2023) · Proceedings of the National Academy of Sciences · doi:10.1073/pnas.2220948120 · Cited by 39
Self-citationCattaneo, C. M., Cancelli, V., Imberti, L., Dobbs, K., Sottini, A., Pagani, C., Belotti, A., Re, A., Anastasia, A., Quaresima, V., et al. (2021) · Blood Cancer Journal · doi:10.1038/s41408-021-00546-9 · Cited by 39
Yu, Y., Esposito, D., Kang, Z., Lü, J., Remaley, A. T., Giorgi, V. D., Chen, L. N., West, K. A., & Cao, L. (2022) · Scientific Reports · doi:10.1038/s41598-022-06629-2 · Cited by 40
Pereira, C., Harris, B. H. L., Giovannantonio, M. D., Rosadas, C., Short, C.-E. S., Quinlan, R. A., Sureda-Vives, M., Fernández, N., Day-Weber, I., Khan, M., et al. (2021) · The Journal of Infectious Diseases · doi:10.1093/infdis/jiab120 · Cited by 37
Herrington, D. M., Sanders, J. W., Wierzba, T. F., Alexander‐Miller, M. A., Espeland, M. A., Bertoni, A. G., Mathews, A., Seals, A. L., Munawar, I., Runyon, M. S., et al. (2021) · BMC Infectious Diseases · doi:10.1186/s12879-021-06517-6 · Cited by 36
Differential Antibody Response to Inactivated COVID-19 Vaccines in Healthy Subjects
Zhang, J., Xing, S., Liang, D., Hu, W. G., Ke, C., He, J., Yuan, R., Huang, Y., Li, Y., Liu, D., et al. (2021) · Frontiers in Cellular and Infection Microbiology · doi:10.3389/fcimb.2021.791660 · Cited by 34
Zaidi, S. K., Rizwan, F., Riaz, Q., Siddiqui, A., Khawaja, S., Imam, M., Naz, A., Waheed, S., & Shamsi, T. S. (2020) · Journal of Public Health · doi:10.1093/pubmed/fdaa170 · Cited by 34
Gouma, S., Weirick, M. E., Bolton, M. J., Arevalo, C. P., Goodwin, E. C., Anderson, E. M., McAllister, C. M., Christensen, S. R., Dunbar, D., Fiore, D., et al. (2021) · JCI Insight · doi:10.1172/jci.insight.150449 · Cited by 30
Fernández‐González, M., Agulló, V., Padilla, S., García, J. A., García‐Abellán, J., Botella, Á., Mascarell, P., Ruiz‐García, M., Masiá, M., & Gutiérrez, F. (2021) · Clinical Infectious Diseases · doi:10.1093/cid/ciab1021 · Cited by 34
Yan, L., Liu, P., Li, X.-G., Zhou, S.-J., Li, H., Wang, Z.-Y., Shen, F., Lu, B., Long, Y., Xiao, X., et al. (2022) · Frontiers in Microbiology · doi:10.3389/fmicb.2021.803031 · Cited by 36
Rosati, M., Terpos, E., Ntanasis‐Stathopoulos, I., Agarwal, M., Bear, J., Burns, R. T., Hu, X., Korompoki, E., Donohue, D. E., Venzon, D. J., et al. (2021) · Frontiers in Immunology · doi:10.3389/fimmu.2021.793953 · Cited by 34
Shayak, B., Sharma, M., Gaur, M., & Mishra, A. K. (2021) · International Journal of Infectious Diseases · doi:10.1016/j.ijid.2021.01.018 · Cited by 31
What do we know about the antibody responses to SARS-CoV-2?
Lagunas‐Rangel, F. A., & Chávez‐Valencia, V. (2021) · Immunobiology · doi:10.1016/j.imbio.2021.152054 · Cited by 32
McGill, A. R., Khalil, R., Dutta, R., Green, R. J., Howell, M., Mohapatra, S., & Mohapatra, S. S. (2021) · Infectious Disease Reports · doi:10.3390/idr13010013 · Cited by 30
Horton, D. B., Barrett, E. S., Roy, J., Gennaro, M. L., Andrews, T., Greenberg, P. J., Bruiners, N., Datta, P., Ukey, R., Velusamy, S. K., et al. (2021) · The Journal of Infectious Diseases · doi:10.1093/infdis/jiab411 · Cited by 28
The role and uses of antibodies in COVID-19 infections: a living review
Scourfield, D. O., Reed, S. G., Quastel, M. N., Alderson, J., Bart, V. M. T., Crespo, A. T., Jones, R. E., Pring, E., Richter, F. C., Ahern, D., et al. (2021) · Oxford Open Immunology · doi:10.1093/oxfimm/iqab003 · Cited by 30
A Review on Immunological Responses to SARS-CoV-2 and Various COVID-19 Vaccine Regimens
Upreti, S., & Samant, M. (2022) · Pharmaceutical Research · doi:10.1007/s11095-022-03323-w · Cited by 29
Graham, C., Seow, J., Huettner, I., Khan, H., Kouphou, N., Acors, S., Winstone, H., Pickering, S., Galao, R. P., Lista, M. J., et al. (2021) · doi:10.1101/2021.02.03.429355 · Cited by 27
Law, J. C., Koh, W. H., Budylowski, P., Lin, J., Yue, F., Abe, K. T., Rathod, B., Girard, M., Li, Z., Rini, J. M., et al. (2020) · The Journal of Immunology · doi:10.4049/jimmunol.2001067 · Cited by 27
Luo, Y. R., Yun, C., Chakraborty, I., Wu, A. H. B., & Lynch, K. L. (2021) · Journal of Clinical Microbiology · doi:10.1128/jcm.00193-21 · Cited by 24
Vandergaast, R., Carey, T. S., Reiter, S., Lathrum, C., Lech, P. J., Gnanadurai, C. W., Haselton, M., Buehler, J., Narjari, R., Schnebeck, L., et al. (2021) · mSphere · doi:10.1128/msphere.00170-21 · Cited by 27
Noh, J. Y., Kwak, J.-E., Yang, J., Hwang, S. Y., Yoon, J. G., Seong, H., Hyun, H., Lim, C. S., Yoon, S., Ryou, J., et al. (2021) · The Journal of Infectious Diseases · doi:10.1093/infdis/jiab124 · Cited by 24
Savage, H. R., Santos, V. S., Edwards, T., Giorgi, E., Krishna, S., Planche, T., Staines, H. M., Fitchett, J. R. A., Kirwan, D. E., Cubas-Atienzar, A. I., et al. (2021) · PLoS neglected tropical diseases · doi:10.1371/journal.pntd.0009551 · Cited by 24
What Happens to the Immune System after Vaccination or Recovery from COVID-19?
Tiyo, B. T., Schmitz, G. J. H., Ortega, M. M., da Silva, L. T., de Almeida, A., Oshiro, T. M., & Duarte, A. J. D. S. (2021) · Life · doi:10.3390/life11111152 · Cited by 28
Klaassen, F., Chitwood, M. H., Cohen, T., Pitzer, V. E., Russi, M., Swartwood, N. A., Salomon, J. A., & Menzies, N. A. (2022) · Clinical Infectious Diseases · doi:10.1093/cid/ciac438 · Cited by 25
Greaney, A. J., Eguia, R. T., Starr, T. N., Khan, K., Franko, N., Logue, J. K., Lord, S. M., Speake, C., Chu, H. Y., Sigal, A., et al. (2022) · PLoS Pathogens · doi:10.1371/journal.ppat.1010592 · Cited by 29
Self-citationPerformance Characteristics of the Vidas SARS-CoV-2 IgM and IgG Serological Assays
Renard, N., Daniel, S., Cayet, N., Pecquet, M., Raymond, F., Pons, S., Lupo, J., Tourneur, C., Pretis, C., Gerez, G., et al. (2021) · Journal of Clinical Microbiology · doi:10.1128/jcm.02292-20 · Cited by 27
The S2 subunit of spike encodes diverse targets for functional antibody responses to SARS-CoV-2
Guenthoer, J., Garrett, M. E., Lilly, M., Depierreux, D., Ruiz, F., Chi, M., Stoddard, C. I., Chohan, V., Yaffe, Z. A., Sung, K., et al. (2024) · PLoS Pathogens · doi:10.1371/journal.ppat.1012383 · Cited by 27
Self-citationEffect of ArtemiC in patients with COVID‐19: A Phase II prospective study
Hellou, E., Mohsin, J., Elemy, A., Hakim, F., Hellou, M. M., & Hamoud, S. (2022) · Journal of Cellular and Molecular Medicine · doi:10.1111/jcmm.17337 · Cited by 22
Hu, Z., van der Ploeg, K., Chakraborty, S., Arunachalam, P. S., Mori, D. A., Jacobson, K. B., Bonilla, H. F., Parsonnet, J., Andrews, J. R., Holubar, M. K., et al. (2022) · eLife · doi:10.7554/elife.77943 · Cited by 30
Palumbo, G. A., Cambria, D., Spina, E. L., Duminuco, A., Laneri, A., Longo, A., Vetro, C., Giallongo, S., Romano, A., Raimondo, F. D., et al. (2023) · Frontiers in Oncology · doi:10.3389/fonc.2023.1117815 · Cited by 21
Underwood, A. P., Sølund, C. S., Fernandez-Antunez, C., Villadsen, S. L., Mikkelsen, L. S., Fahnøe, U., Bollerup, S., Winckelmann, A. A., Schneider, U. V., Binderup, A., et al. (2023) · EBioMedicine · doi:10.1016/j.ebiom.2023.104475 · Cited by 21
Karuna, S., Li, S. S., Grant, S., Walsh, S. R., Frank, I., Casapía, M., Trahey, M., Hyrien, O., Fisher, L. H., Miner, M. D., et al. (2021) · PLoS Medicine · doi:10.1371/journal.pmed.1003868 · Cited by 21
Metadata
- Authors
- Crawford, K. H. D., Dingens, A. S., Eguia, R., Wolf, C. R., Wilcox, N., Logue, J. K., Shuey, K., Casto, A. M., Fiala, B., Wrenn, S., Pettie, D., King, N. P., Greninger, A. L., Chu, H. Y., & Bloom, J. D.
- Affiliations
- University of Washington (US)
- Fred Hutch Cancer Center (US)
- Howard Hughes Medical Institute (US)
- Corresponding author
- Chu, Helen Y
- Bloom, Jesse D
- ORCID
- Venue
- The Journal of Infectious Diseases
- Publisher
- Oxford University Press (OUP)
- Published
- 2020-09-30
- Volume
- 223
- Issue
- 2
- Pages
- 197-205
- ISSN
- 0022-1899 (ISSN-L)
- 1537-6613
- PMC
- PMC7543487
- OpenAlex
- W3091039991
- Cited by
- 265
- References
- 53
- Citations by year
- 2026: 5 · 2025: 13 · 2024: 16 · 2023: 32 · 2022: 58 · 2021: 120 · 2020: 21
- FWCI
- 7.58
- Type
- journal article
- Language
- en
- Open access
- hybrid
- doi.org
- Licence
- Locations
- The Journal of Infectious Diseases (publishedVersion, cc-by)
- medRxiv (acceptedVersion, cc-by)
- PubMed Central (publishedVersion, cc-by)
- PubMed (publishedVersion)
- Funders
- National Institute of Allergy and Infectious Diseases (R01AI141707, F30AI149928)
- National Institutes of Health
- Bill and Melinda Gates Foundation (OPP1156262)
- Burroughs Wellcome Fund
- Topics
- Health Sciences › Medicine › Infectious Diseases › SARS-CoV-2 and COVID-19 Research
- Health Sciences › Medicine › Infectious Diseases › COVID-19 Clinical Research Studies
- Health Sciences › Medicine › Infectious Diseases › SARS-CoV-2 detection and testing
- Keywords
- SARS-CoV-2, COVID-19 pandemic, neutralizing antibodies, antibody titer decline, spike protein, receptor binding domain, humoral immune response, long-term immunity, asymptomatic infection
- MeSH terms
- COVID-19, SARS-CoV-2, Adult, Aged, Antibodies, Viral, Female, Humans, Male, Middle Aged, Prospective Studies, Time Factors, Young Adult, Antibodies, Neutralizing, Spike Glycoprotein, Coronavirus
About these checks
Registry, retraction, Cites and statistics results are computed, not judged, with one exception: a printed reference that no index lists is read once by a model before it counts as a citation error. Claims are extracted by a model and kept only when their quote appears verbatim in the text; each cited source is then checked, with a model’s help, for whether it says what the claim relies on. Those verdicts can be wrong — read the claim’s quote and the cited source before relying on one.
Statistics and arithmetic are recomputed, not judged.
Confidence bands are shown only for fields calibrated on our annotated test set. None is calibrated yet, so no band is shown.
What counts as a claim ›How we measure confidence ›How we check this ›
Are you an author, or do you see a problem with this page? Request a review
