

The DOI matches its Crossref record; 7 of the 7 references it cites were found in a registry or an index.
Paradoxical effects from stimulus density manipulation provide new insight into the impact of sleep deprivation on PVT performance
Abstract
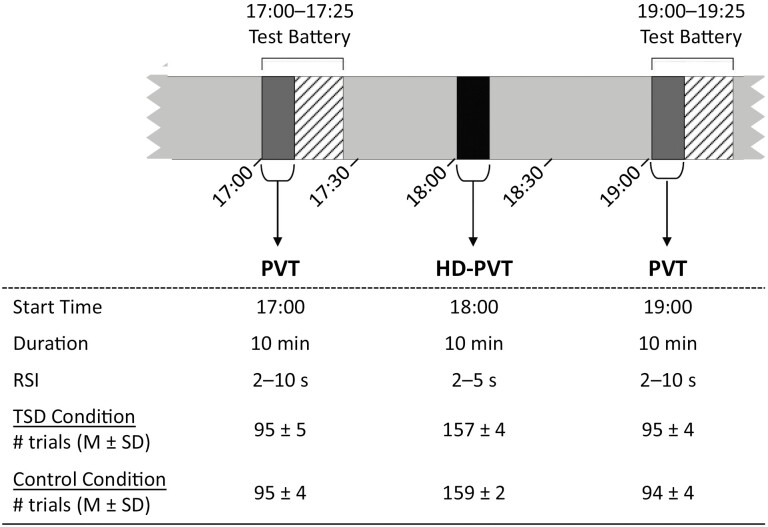
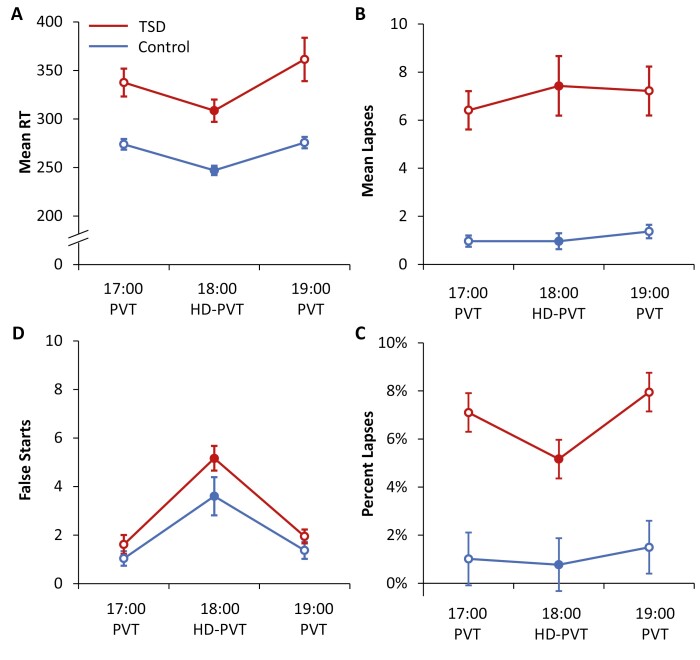
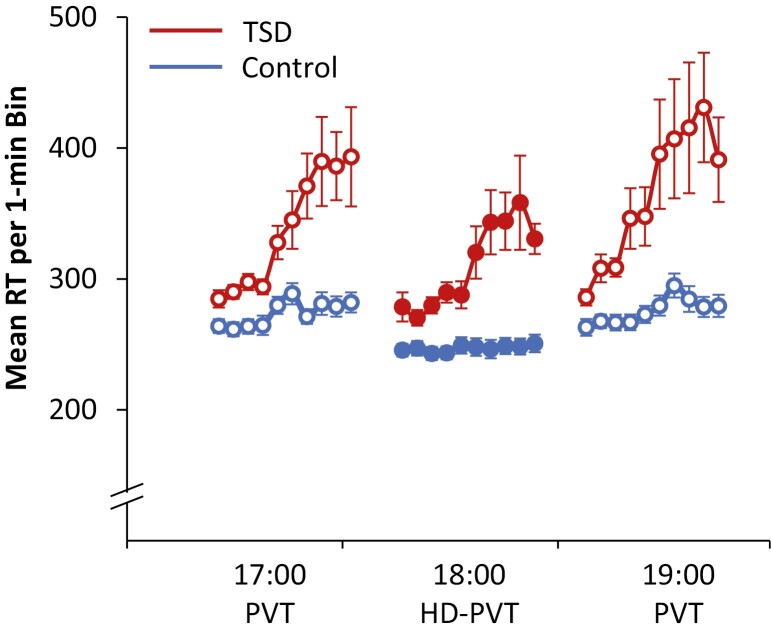
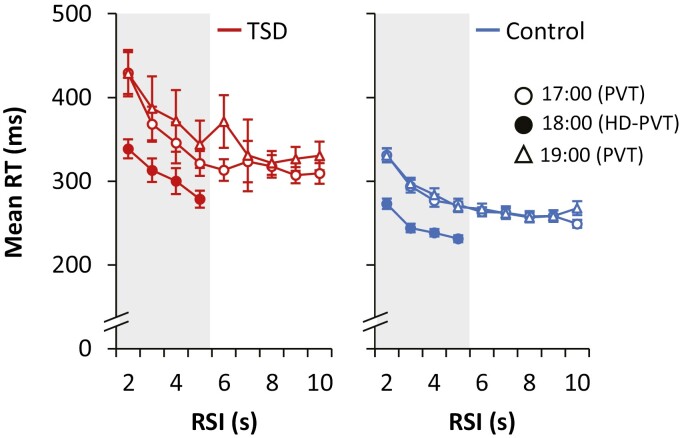
Study Objectives: The psychomotor vigilance test (PVT), a 10-min one-choice reaction time task with random response-stimulus intervals (RSIs) between 2 and 10 s, is highly sensitive to behavioral alertness deficits due to sleep loss. To investigate what drives the performance deficits, we conducted an in-laboratory total sleep deprivation (TSD) study and compared performance on the PVT to performance on a 10-min high-density PVT (HD-PVT) with increased stimulus density and truncated RSI range between 2 and 5 s. We hypothesized that the HD-PVT would show greater impairments from TSD than the standard PVT. Methods: n = 86 healthy adults were randomized (2:1 ratio) to 38 h of TSD (n = 56) or corresponding well-rested control (n = 30). The HD-PVT was administered when subjects had been awake for 34 h (TSD group) or 10 h (control group). Performance on the HD-PVT was compared to performance on the standard PVTs administered 1 h earlier and 1 h later. Results: The HD-PVT yielded approximately 60% more trials than the standard PVT. The HD-PVT had faster mean response times (RTs) and equivalent lapses (RTs > 500 ms) compared to the standard PVT, with no differences between the TSD effects on mean RT and lapses between tasks. Further, the HD-PVT had a dampened time-on-task effect in both the TSD and control conditions. Conclusions: Contrary to expectation, the HD-PVT did not show greater performance impairment during TSD, indicating that stimulus density and RSI range are not primary drivers of the PVT’s responsiveness to sleep loss.
Overview
The claims and statistics of this paper haven’t been checked yet.
Run the check — free, no account needed. It reads the open-access text and checks the sources it cites.
Integrity signals
Registry
Cites
Statistics
Figures
Verification
Claims the paper makes
The claims and statistics of this paper haven’t been checked yet.
Run the check — free, no account needed. It reads the open-access text and checks the sources it cites.
Claims other papers make about this one
Each is checked against this paper’s own text: does it say what the citing paper says it does?
In the citing paper
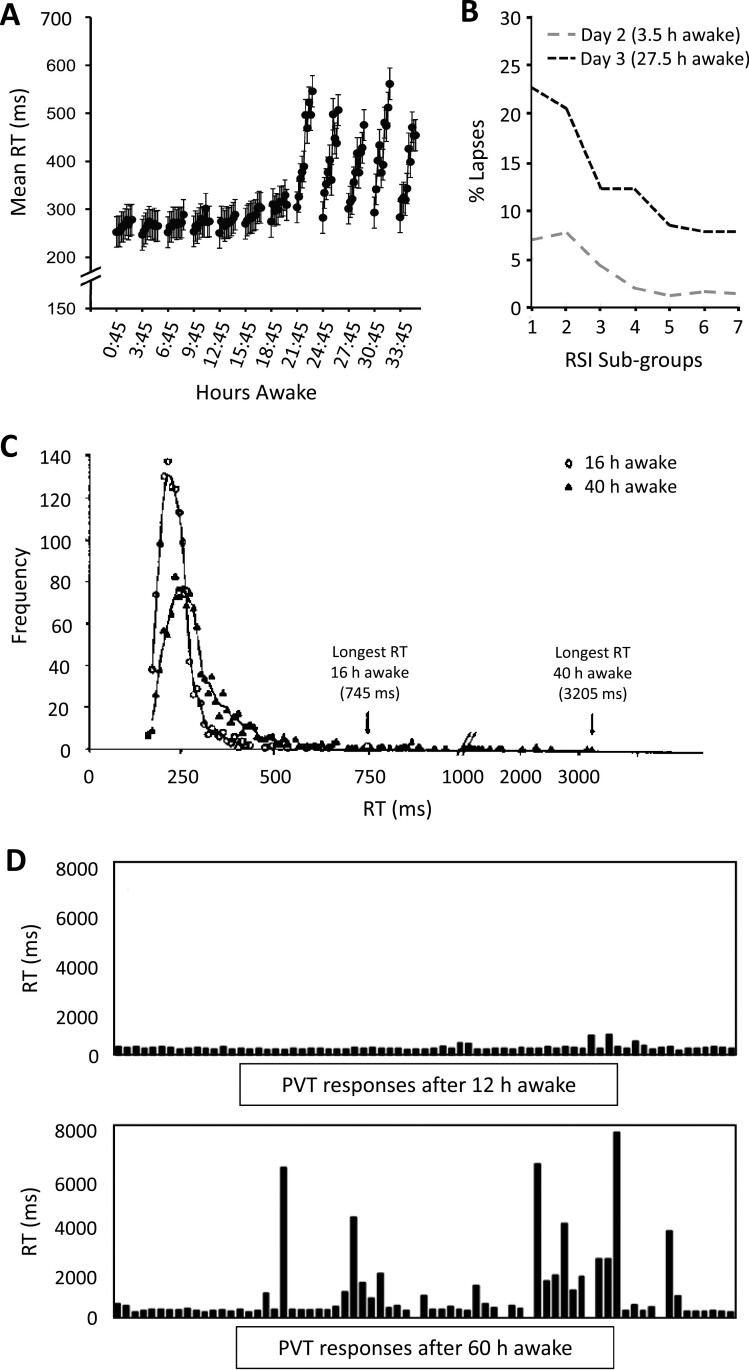
“The Psychomotor Vigilance Test (PVT) is highly sensitive to behavioral alertness deficits due to sleep loss (31) in both acute SD and partial SD (32).”
From Sleep deprivation alters utilization of negative feedback in risky decision-making (2024) · cites this paper as [31]
Self-check
Percentages, sums and reported differences re-computed from the paper’s own numbers.
The self-check needs the paper’s full text.
Citations
Cites
Diffusion decision model: Current issues and history
Ratcliff, R., Smith, P. L., Brown, S. D., & McKoon, G. (2016) · Trends in Cognitive Sciences · doi:10.1016/j.tics.2016.01.007 · Cited by 1,630 · cited 1×
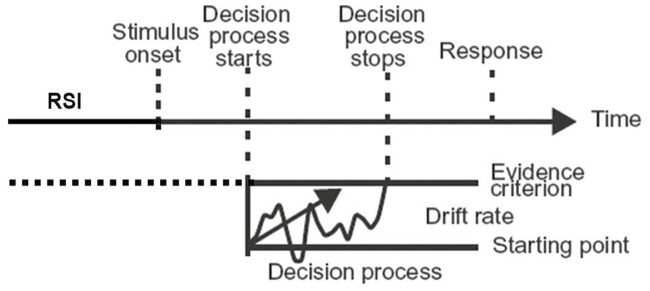
“In the diffusion decision model, this corresponds with subjects raising the evidence criterion, which is under behavioral control [80], and doing so reduces sensitivity to sleep loss [79].”
MethodA meta-analysis of the impact of short-term sleep deprivation on cognitive variables
Lim, J., & Dinges, D. F. (2010) · Psychological Bulletin · doi:10.1037/a0018883 · Cited by 1,389
Sleep Deprivation and Vigilant Attention
Lim, J., & Dinges, D. F. (2008) · Annals of the New York Academy of Sciences · doi:10.1196/annals.1417.002 · Cited by 1,213
Sleep as a fundamental property of neuronal assemblies
Krueger, J. M., Rector, D. M., Roy, S., Van Dongen, H. P. A., Belenky, G., & Panksepp, J. (2008) · Nature Reviews Neuroscience · doi:10.1038/nrn2521 · Cited by 596
Trait-like vulnerability to total and partial sleep loss
Rupp, T. L., Wesensten, N. J., & Balkin, T. J. (2012) · Sleep · doi:10.5665/sleep.2010 · Cited by 186
Jones, C. W., Basner, M., Mollicone, D. J., Mott, C. M., & Dinges, D. F. (2022) · Sleep · doi:10.1093/sleep/zsac006 · Cited by 68
Waggoner, L. B., Grant, D. A., Van Dongen, H. P. A., Belenky, G., & Vila, B. (2012) · Sleep · doi:10.5665/sleep.2214 · Cited by 52
Research works printed but not linked: 78
- Dinges, 1985, Microcomputer analyses of performance on a portable, simple visual RT task during sustained operations, Behav Res Methods Instrum Comput., 17, 652, 10.3758/BF03200977 · DOI
- Dinges, 1991, Performing while sleepy: effects of experimentally-induced sleepiness., 97
- Doran, 2001, Sustained attention performance during sleep deprivation: evidence of state instability, Arch Ital Biol., 139, 253
- Dorrian, 2005, Psychomotor vigilance performance: neurocognitive assay sensitive to sleep loss., 39
- Hudson, 2020, Sleep deprivation, vigilant attention, and brain function: a review, Neuropsychopharmacology., 45, 21, 10.1038/s41386-019-0432-6 · DOI · Paper page
- Satterfield, 2013, Occupational fatigue, underlying sleep and circadian mechanisms, and approaches to fatigue risk management, Fatigue., 1, 118
- Thorne, 2005, The Walter Reed palm-held psychomotor vigilance test, Behav Res Methods., 37, 111, 10.3758/BF03206404 · DOI · Paper page
- Lamond, 2008, The sensitivity of a palm-based psychomotor vigilance task to severe sleep loss, Behav Res Methods., 40, 347, 10.3758/BRM.40.1.347 · DOI
- Basner, 2011, Validity and sensitivity of a brief Psychomotor Vigilance Test (PVT-B) to total and partial sleep deprivation, Acta Astronaut., 69, 949, 10.1016/j.actaastro.2011.07.015 · DOI · Paper page
- Honn, 2015, Validation of a portable, touch-screen psychomotor vigilance test, Aerosp Med Hum Perform., 86, 428, 10.3357/AMHP.4165.2015 · DOI
- Grant, 2017, 3-minute smartphone-based and tablet-based psychomotor vigilance tests for the assessment of reduced alertness due to sleep deprivation, Behav Res Methods., 49, 1020, 10.3758/s13428-016-0763-8 · DOI
- Arsintescu, 2019, Validation of a touchscreen psychomotor vigilance task, Accid Anal Prev., 126, 173, 10.1016/j.aap.2017.11.041 · DOI
- Benderoth, 2021, Reliability and validity of a 3-min psychomotor vigilance task in assessing sensitivity to sleep loss and alcohol: fitness for duty in aviation and transportation, Sleep., 44, zsab151, 10.1093/sleep/zsab151 · DOI
- Thompson, 2022, Test-retest reliability of the 5-minute psychomotor vigilance task in working-aged females, J Neurosci Methods., 365, 109379, 10.1016/j.jneumeth.2021.109379 · DOI
- Jung, 2011, Comparison of sustained attention assessed by auditory and visual psychomotor vigilance tasks prior to and during sleep deprivation, J Sleep Res., 20, 348, 10.1111/j.1365-2869.2010.00877.x · DOI
- Balkin, 2004, Comparative utility of instruments for monitoring sleepiness-related performance decrements in the operational environment, J Sleep Res., 13, 219, 10.1111/j.1365-2869.2004.00407.x · DOI · Paper page
- Basner, 2011, Maximizing sensitivity of the psychomotor vigilance test (PVT) to sleep loss, Sleep., 34, 581, 10.1093/sleep/34.5.581 · DOI · Paper page
- Banks, 2007, Behavioral and physiological consequences of sleep restriction, J Clin Sleep Med., 3, 519, 10.5664/jcsm.26918 · DOI · Paper page
- Ganesan, 2019, The impact of shift work on sleep, alertness and performance in healthcare workers, Sci Rep., 9, 4635, 10.1038/s41598-019-40914-x · DOI · Paper page
- Hilditch, 2016, Sleep inertia during a simulated 6-h on/6-h off fixed split duty schedule, Chronobiol Int., 33, 685, 10.3109/07420528.2016.1167724 · DOI
- Kribbs, 1993, Effects of one night without nasal CPAP treatment on sleep and sleepiness in patients with obstructive sleep apnea, Am Rev Respir Dis., 147, 1162, 10.1164/ajrccm/147.5.1162 · DOI
- Thomann, 2014, Psychomotor vigilance task demonstrates impaired vigilance in disorders with excessive daytime sleepiness, J Clin Sleep Med., 10, 1019, 10.5664/jcsm.4042 · DOI
- Khan, 2019, Immediate-term cognitive impairment following intravenous (IV) chemotherapy: a prospective pre-post design study, BMC Cancer., 19, 150, 10.1186/s12885-019-5349-2 · DOI
- Wilson, 2019, Postpartum fatigue, daytime sleepiness, and psychomotor vigilance are modifiable through a brief residential early parenting program, Sleep Med., 59, 33, 10.1016/j.sleep.2019.01.012 · DOI
- Reiter, 2021, No effect of chronotype on sleepiness, alertness, and sustained attention during a single night shift, Clocks Sleep., 3, 377, 10.3390/clockssleep3030024 · DOI
- Van Dongen, 2003, The cumulative cost of additional wakefulness: dose-response effects on neurobehavioral functions and sleep physiology from chronic sleep restriction and total sleep deprivation, Sleep., 26, 117, 10.1093/sleep/26.2.117 · DOI · Paper page
- Basner, 2018, Repeated administration effects on psychomotor vigilance test performance, Sleep., 41, zsx187, 10.1093/sleep/zsx187 · DOI
- Belenky, 2003, Patterns of performance degradation and restoration during sleep restriction and subsequent recovery: a sleep dose-response study, J Sleep Res., 12, 1, 10.1046/j.1365-2869.2003.00337.x · DOI · Paper page
- Mollicone, 2008, Response surface mapping of neurobehavioral performance: testing the feasibility of split sleep schedules for space operations, Acta Astronaut., 63, 833, 10.1016/j.actaastro.2007.12.005 · DOI
- Signal, 2009, Scheduled napping as a countermeasure to sleepiness in air traffic controllers, J Sleep Res., 18, 11, 10.1111/j.1365-2869.2008.00702.x · DOI
- Banks, 2010, Neurobehavioral dynamics following chronic sleep restriction: dose-response effects of one night for recovery, Sleep., 33, 1013, 10.1093/sleep/33.8.1013 · DOI · Paper page
- Rupp, 2009, Banking sleep: realization of benefits during subsequent sleep restriction and recovery, Sleep., 32, 311, 10.1093/sleep/32.3.311 · DOI · Paper page
- Graw, 2004, Circadian and wake-dependent modulation of fastest and slowest reaction times during the psychomotor vigilance task, Physiol Behav., 80, 695, 10.1016/j.physbeh.2003.12.004 · DOI
- Dinges, 2003, Effects of modafinil on sustained attention performance and quality of life in OSA patients with residual sleepiness while being treated with nCPAP, Sleep Med., 4, 393, 10.1016/S1389-9457(03)00108-4 · DOI · Paper page
- Wesensten, 2004, Modafinil vs. caffeine: effects on fatigue during sleep deprivation, Aviat Space Environ Med., 75, 520
- Van Dongen, 2004, Systematic interindividual differences in neurobehavioral impairment from sleep loss: evidence of trait-like differential vulnerability, Sleep., 27, 423
- Ferguson, 2016, Fatigue in emergency service operations: assessment of the optimal objective and subjective measures using a simulated wildfire deployment, Int J Environ Res Public Health., 13, 171, 10.3390/ijerph13020171 · DOI
- Sparrow, 2016, Naturalistic field study of the restart break in US commercial motor vehicle drivers: Truck driving, sleep, and fatigue, Accid Anal Prev., 93, 55, 10.1016/j.aap.2016.04.019 · DOI
- Patterson, 2019, Impact of shift duration on alertness among air-medical emergency care clinician shift workers, Am J Ind Med., 62, 325, 10.1002/ajim.22956 · DOI
- Wilson, 2019, Performance and sleepiness in nurses working 12-h day shifts or night shifts in a community hospital, Accid Anal Prev., 126, 43, 10.1016/j.aap.2017.09.023 · DOI
- Matsangas, 2020, Sleep quality, occupational factors, and psychomotor vigilance performance in the U.S. Navy sailors, Sleep., 43, zsaa118, 10.1093/sleep/zsaa118 · DOI
- Rahman, 2021, Extended work shifts and neurobehavioral performance in resident-physicians, Pediatrics., 147, e2020009936, 10.1542/peds.2020-009936 · DOI
- Fletcher, 2022, Work schedule and seasonal influence on sleep and fatigue in helicopter and fixed-wing aircraft operations in extreme environments, Sci Rep., 12, 8263, 10.1038/s41598-022-08996-2 · DOI
- Mackworth, 1950, Researches on the measurement of human performance, 156
- Broadbent, 1953, Noise, paced performance and vigilance tasks, Br J Psychol., 44, 295
- Bills, 1937, Fatigue in mental work, Physiol Rev., 17, 436, 10.1152/physrev.1937.17.3.436 · DOI
- Van Dongen, 2011, Investigating the temporal dynamics and underlying mechanisms of cognitive fatigue., 127, 10.1037/12343-006 · DOI
- Tucker, 2009, The variable response-stimulus interval effect and sleep deprivation: an unexplored aspect of psychomotor vigilance task performance, Sleep., 32, 1393, 10.1093/sleep/32.10.1393 · DOI
- Kong, 2015, Increased automaticity and altered temporal preparation following sleep deprivation, Sleep., 38, 1219, 10.5665/sleep.4896 · DOI
- Yang, 2018, Sleep deprivation enhances inter-stimulus interval effect on vigilant attention performance, Sleep., 41, zsy189, 10.1093/sleep/zsy189 · DOI
- Luce, 1991, Response Times: Their Role in Inferring Elementary Mental organization., 10.1093/acprof:oso/9780195070019.001.0001 · DOI
- Bills, 1931, Blocking: a new principle in mental fatigue, Am J Psychol., 43, 230, 10.2307/1414771 · DOI
- Williams, 1959, Impaired performance with acute sleep loss, Psychol Monogr., 73, 1, 10.1037/h0093749 · DOI
- Deaton, 1971, The effect of sleep deprivation on signal detection parameters, Q J Exp Psychol., 23, 449, 10.1080/14640747108400257 · DOI
- Gunzelmann, 2011, Fatigue in sustained attention: Generalizing mechanisms for time awake to time on task., 83, 10.1037/12343-004 · DOI
- Basner, 2015, A new likelihood ratio metric for the psychomotor vigilance test and its sensitivity to sleep loss, J Sleep Res., 24, 702, 10.1111/jsr.12322 · DOI
- Chavali, 2017, Signal-to-noise ratio in PVT performance as a cognitive measure of the effect of sleep deprivation on the fidelity of information processing, Sleep., 40, zsx016, 10.1093/sleep/zsx016 · DOI
- Horne, 1985, High incentive effects on vigilance performance during 72 hours of total sleep deprivation, Acta Psychol (Amst)., 58, 123, 10.1016/0001-6918(85)90003-4 · DOI
- Rakitin, 2012, The effects of stimulus degradation after 48 hours of total sleep deprivation, Sleep., 35, 113, 10.5665/sleep.1598 · DOI
- Dinges, 1989, The nature of sleepiness: causes, contexts, and consequences., 147
- Van Dongen, 2011, A local, bottom-up perspective on sleep deprivation and neurobehavioral performance, Curr Top Med Chem., 11, 2414, 10.2174/156802611797470286 · DOI
- Rector, 2005, Local functional state differences between rat cortical columns, Brain Res., 1047, 45, 10.1016/j.brainres.2005.04.002 · DOI
- Nir, 2017, Selective neuronal lapses precede human cognitive lapses following sleep deprivation, Nat Med., 23, 1474, 10.1038/nm.4433 · DOI
- Åkerstedt, 2014, Subjective sleepiness is a sensitive indicator of insufficient sleep and impaired waking function, J Sleep Res., 23, 242, 10.1111/jsr.12158 · DOI
- Watson, 1988, Development and validation of brief measures of positive and negative affect: the PANAS scales, J Pers Soc Psychol., 54, 1063, 10.1037/0022-3514.54.6.1063 · DOI · Paper page
- Hudson, 2022, Effects of total sleep deprivation on performance on a continuous performance matching task, Sleep., 45, A530119, 10.1093/sleep/zsac079.117 · DOI
- Honn, 2020, New insights into the cognitive effects of sleep deprivation by decomposition of a cognitive throughput task, Sleep., 43, zsz319, 10.1093/sleep/zsz319 · DOI
- Basner, 2021, Response speed measurements on the psychomotor vigilance test: how precise is precise enough?, Sleep., 44, zsaa121, 10.1093/sleep/zsaa121 · DOI · Paper page
- Ratcliff, 2011, Diffusion model for one-choice reaction-time tasks and the cognitive effects of sleep deprivation, Proc Natl Acad Sci USA., 108, 11285, 10.1073/pnas.1100483108 · DOI
- Walsh, 2017, Computational cognitive modeling of the temporal dynamics of fatigue from sleep loss, Psychon Bull Rev., 24, 1785, 10.3758/s13423-017-1243-6 · DOI
- Honn, 2018, Total sleep deprivation does not significantly degrade semantic encoding, Chronobiol Int., 35, 746, 10.1080/07420528.2017.1411361 · DOI
- Fournier, 2020, Action plan interrupted: resolution of proactive interference while coordinating execution of multiple action plans during sleep deprivation, Psychol Res., 84, 454, 10.1007/s00426-018-1054-z · DOI
- Hudson, 2020, Speed/accuracy trade-off in the effects of acute total sleep deprivation on a sustained attention and response inhibition task, Chronobiol Int., 37, 1441, 10.1080/07420528.2020.1811718 · DOI
- Wilkinson, 1961, Interaction of lack of sleep with knowledge of results, repeated testing, and individual differences, J Exp Psychol., 62, 263, 10.1037/h0048787 · DOI
- Chee, 2013, Functional imaging of inter-individual differences in response to sleep deprivation., 154, 10.1017/CBO9781139088268.021 · DOI
- Warm, 2008, Vigilance requires hard mental work and is stressful, Hum Factors., 50, 433, 10.1518/001872008X312152 · DOI
- Van Dongen, 2000, Circadian rhythms in fatigue, alertness, and performance., 391
- Li, 2013, Age-related frontoparietal changes during the control of bottom-up and top-down attention: an ERP study, Neurobiol Aging., 34, 477, 10.1016/j.neurobiolaging.2012.02.025 · DOI
Cited by
Sorted by citations
Sleep deprivation alters utilization of negative feedback in risky decision-making
Xu, W., Wang, L., Yang, L., Zhu, Y., & Chen, P. (2024) · Frontiers in Psychiatry · doi:10.3389/fpsyt.2024.1307408 · Cited by 2
Metadata
- Authors
- Honn, K. A., & Van Dongen, H. P. A.
- Affiliations
- Sleep and Performance Research Center and Department of Translational Medicine and Physiology, Washington State University , Spokane, WA , USA
- Venue
- SLEEP Advances
- Publisher
- Oxford University Press (OUP)
- Published
- 2022-12-07
- Volume
- 4
- Issue
- 1
- ISSN
- 2632-5012
- PMC
- PMC10108643
- Cited by
- 9
- References
- 7
- Language
- en
- Funders
- Office of the Assistant Secretary of Defense for Health Affair (W81XWH-16-1-0319)
- Peer Reviewed Medical Research Program Expansion (W81XWH-20-1-0442)
- Department of Defense
About these checks
Registry, retraction, Cites and statistics results are computed, not judged, with one exception: a printed reference that no index lists is read once by a model before it counts as a citation error. Claims are extracted by a model and kept only when their quote appears verbatim in the text; each cited source is then checked, with a model’s help, for whether it says what the claim relies on. Those verdicts can be wrong — read the claim’s quote and the cited source before relying on one.
Statistics and arithmetic are recomputed, not judged.
Confidence bands are shown only for fields calibrated on our annotated test set. None is calibrated yet, so no band is shown.
What counts as a claim ›How we measure confidence ›How we check this ›
Are you an author, or do you see a problem with this page? Request a review
