PreprintCited by 4CRISPR and Genetic EngineeringBacterial Genetics and BiotechnologyRNA regulation and disease

The DOI matches its Crossref record; 1 of the 1 references it cites were found in a registry or an index.

Identification of the EH CRISPR-Cas9 system on a metagenome and its application to genome engineering

Open access
Esquerra-Ruvira, Belen, Baquedano, Ignacio, Ruiz, Raul, Fernandez, Almudena, Montoliu, Lluis, Mojica, Francisco JM·2022·Microbial Biotechnology

Preprint — published as 10.1111/1751-7915.14266 · Paper page

Abstract

Non-coding RNAs (crRNAs) produced from clustered regularly interspaced short palindromic repeats (CRISPR) loci, and CRISPR associated (Cas) proteins of the prokaryotic CRISPR-Cas systems, form complexes that interfere with the spread of transmissible genetic elements through Cas-catalysed cleavage of foreign genetic material matching the guide crRNA sequences. The easily programmable targeting of nucleic acids enabled by these ribonucleoproteins has facilitated the implementation of CRISPR-based molecular biology tools for in vivo and in vitro modification of DNA and RNA targets. Despite the diversity of DNA-targeting Cas nucleases so far identified, native and engineered derivatives of the Streptococcus pyogenes SpCas9 are the most used for genome engineering, at least in part due to its catalytic robustness and the requirement of an exceptionally short motif (5’-NGG-3’ PAM) flanking the target sequence. However, the large size of the SpCas9 variants impairs the delivery of the tool to eukaryotic cells and smaller alternatives are demanded. Here we identify in a metagenome a new CRISPR-Cas9 system associated with a smaller Cas9 protein (EHCas9) that targets DNA sequences flanked by 5’-NGG-3’ PAMs. We develop a simplified EHCas9 tool that specifically cleaves DNA targets and is functional for genome editing applications in prokaryotes and eukaryotic cells.

Overview

The claims and statistics of this paper haven’t been checked yet.

Run the check — free, no account needed. It reads the open-access text and checks the sources it cites.

A few free checks a day · papers already verified open instantly · results are public

Integrity signals

Registry

Crossref · 10.1101/2022.10.31.514646

Cites

1 of 1 references verified0 citation errors · 0 not checkable

Statistics

Figures

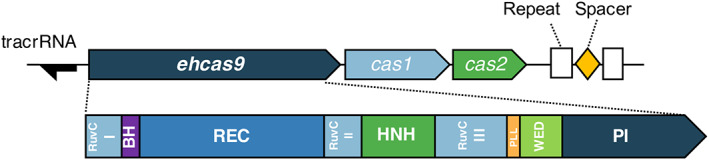
FIGURE 1 Schematic representation of the EH CRISPR‐Cas9 locus and domains of the associated Cas9 protein. The EH CRISPR‐Cas9 locus comprises three cas genes in the order of cas9 (denoted ehcas9) – cas1 – cas2 (boxes pointing toward the direction of transcription), and two 36‐bp CRISPR units (Repeat, white rectangles) separated by a 29‐bp spacer (diamond). The location of a putative tracrRNA gene is represented as a black arrow pointing toward the predicted direction of transcription. The EHCas9 protein domains (depicted below the locus representation) inferred from the alignment with orthologues (Figure S2), include the RuvC (I, II and III motifs), Bridge Helix (BH), recognition (REC), HNH, Phosphate Lock Loop (PLL), WED and PAM‐Interacting (PI) domains.
FIGURE 1 Schematic representation of the EH CRISPR‐Cas9 locus and domains of the associated Cas9 protein. The EH CRISPR‐Cas9 locus comprises three cas genes in the order of cas9 (denoted ehcas9) – cas1 – cas2 (boxes pointing toward the direction of transcription), and two 36‐bp CRISPR units (Repeat, white rectangles) separated by a 29‐bp spacer (diamond). The location of a putative tracrRNA gene is represented as a black arrow pointing toward the predicted direction of transcription. The EHCas9 protein domains (depicted below the locus representation) inferred from the alignment with orthologues (Figure S2), include the RuvC (I, II and III motifs), Bridge Helix (BH), recognition (REC), HNH, Phosphate Lock Loop (PLL), WED and PAM‐Interacting (PI) domains.CC BY · PubMed Central
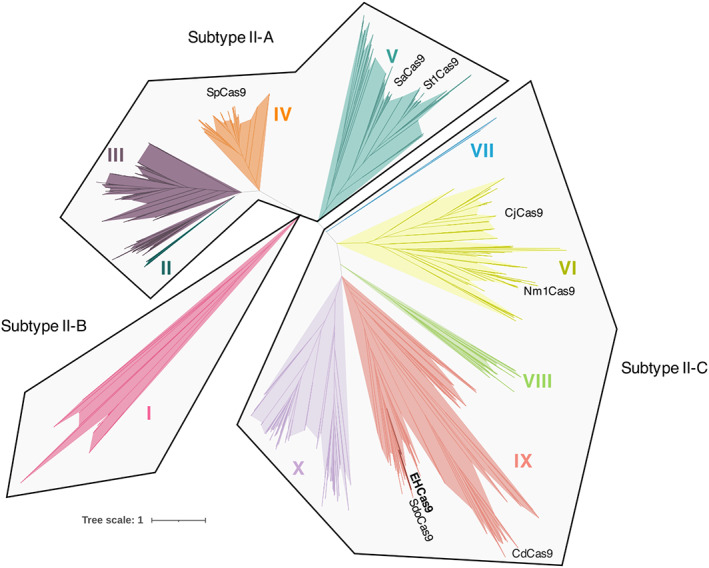
FIGURE 2 Evolutionary relationship of EHCas9. Phylogenetic tree of EHCas9 and 798 orthologues. Clades II (dark green), III (purple), IV (orange) and V (dark blue) belong to subtype II‐A, clade I (pink) to subtype II‐B, and clades VI (yellow), VII (blue), VIII (green), IX (red) and X (lilac) to subtype II‐C. Cas9 of Sulfitobacter donghicola (SdoCas9) and orthologues commonly used for genome editing (SaCas9: Staphylococcus aureus Cas9; SpCas9: Streptococcus pyogenes Cas9; NmCas9: Neisseria meningitidis Cas9; CjCas9: Campylobacter jejuni Cas9; CdCas9: Corynebacterium diphteriae Cas9; StCas9: Streptococcus thermophilus Cas9) are labelled at their approximate position in the tree.
FIGURE 2 Evolutionary relationship of EHCas9. Phylogenetic tree of EHCas9 and 798 orthologues. Clades II (dark green), III (purple), IV (orange) and V (dark blue) belong to subtype II‐A, clade I (pink) to subtype II‐B, and clades VI (yellow), VII (blue), VIII (green), IX (red) and X (lilac) to subtype II‐C. Cas9 of Sulfitobacter donghicola (SdoCas9) and orthologues commonly used for genome editing (SaCas9: Staphylococcus aureus Cas9; SpCas9: Streptococcus pyogenes Cas9; NmCas9: Neisseria meningitidis Cas9; CjCas9: Campylobacter jejuni Cas9; CdCas9: Corynebacterium diphteriae Cas9; StCas9: Streptococcus thermophilus Cas9) are labelled at their approximate position in the tree.CC BY · PubMed Central
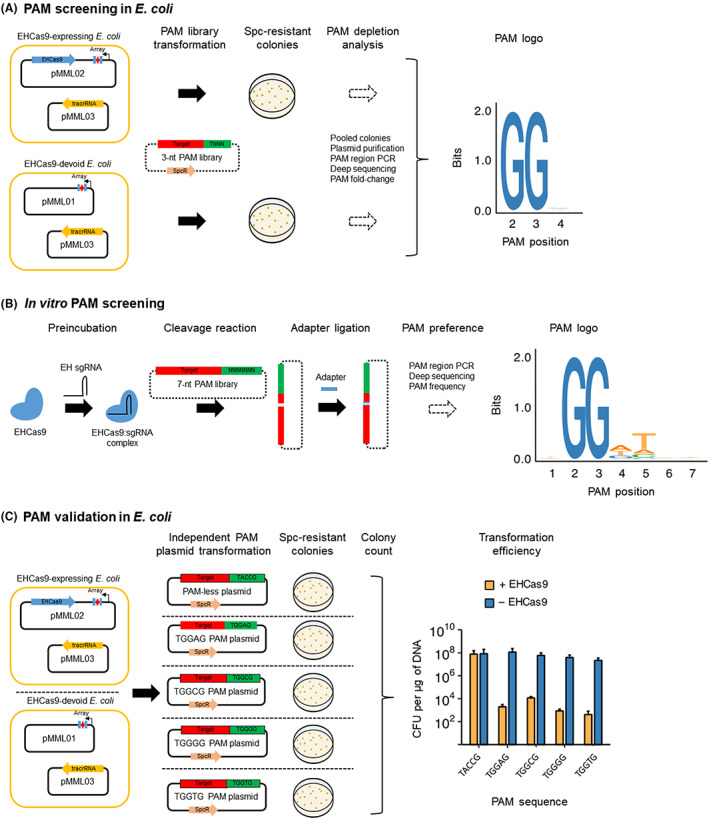
FIGURE 3 EHCas9 PAM screening and validation. Plasmids containing a spectinomycin resistance gene (SpcR) and distinct sequences in the PAM region (green) next to a target (red) matching the spacer (red diamond) of a CRISPR array (Array) composed of two repeats (blue rectangles; experiments in E. coli) or the spacer region of a sgRNA (in vitro screening) were subjected to cleavage by EHCas9. (A) Schematic representation of the PAM screening in E. coli cells. E. coli cells harbouring pMML03 (tracrRNA carrier) and either the pMML02 (EHCas9‐expressing) or the pMML01 (EH‐Cas9‐devoid) plasmid were transformed with a 3‐nt (from the 2nd to the 4th position) PAM library. Plasmids pMML01 and pMML02 encode a constitutively expressed CRISPR array. Transformants were selected on spectinomycin plates, and the PAM region was sequenced by High Throughput Sequencing of PCR products of the plasmids purified from pooled colonies (PAM depletion analysis). A logo (PAM logo) of the sequences in the PAM region preferred by EHCas9 for target cleavage was generated from the PAM fold‐change calculated after comparing PAM frequencies in pMML02 carriers with the corresponding values from cells carrying pMML01. Nucleotide positions 3′ from the end of the spacer‐matching strand of the target are indicated in the PAM logo. (B) Schematic representation of the in vitro PAM screening. EHCas9 protein was preincubated with EH sgRNA to generate EHCas9:sgRNA nucleoprotein complexes and mixed (cleavage reaction) with a plasmid library (7‐nt PAM library) with randomized nucleotides from the 1st to the 7th position of the PAM region. Adapters were ligated to the linearized DNA fragments and a logo (PAM logo) of the nucleotide sequences in the randomized region preferred by EHCas9 for target cleavage was generated from the frequencies of each sequence calculated after llumina sequencing of PAM‐sided PCR products. Nucleotide positions 3′ from the end of the spacer‐matching strand of the target are indicated in the PAM logo. (C) Schematic representation of the in vivo PAM validation in E. coli. E. coli cells bearing pMML03 and either pMML02 or pMML01 were transformed with a plasmid containing a target flanked by 5′‐TACCG‐3′ (PAM‐less plasmid), 5′‐TGGAG‐3′ (TGGAG plasmid), 5′‐TGGCG3′ (TGGCG plasmid), 5′‐TGGGG‐3′ (TGGGG plasmid) or 5′‐TGGTG‐3′ (TGGTG plasmid) in the PAM region. Transformants were selected on spectinomycin plates and the efficiency of transformation (number of colony‐forming units – CFU – per mg of plasmid DNA) of E. coli cells carrying pMML02 (+ EHCas9) or pMML01 (− EHCas9) was represented. Data are the mean of three biological replicates (error bars correspond to the standard deviation).
FIGURE 3 EHCas9 PAM screening and validation. Plasmids containing a spectinomycin resistance gene (SpcR) and distinct sequences in the PAM region (green) next to a target (red) matching the spacer (red diamond) of a CRISPR array (Array) composed of two repeats (blue rectangles; experiments in E. coli) or the spacer region of a sgRNA (in vitro screening) were subjected to cleavage by EHCas9. (A) Schematic representation of the PAM screening in E. coli cells. E. coli cells harbouring pMML03 (tracrRNA carrier) and either the pMML02 (EHCas9‐expressing) or the pMML01 (EH‐Cas9‐devoid) plasmid were transformed with a 3‐nt (from the 2nd to the 4th position) PAM library. Plasmids pMML01 and pMML02 encode a constitutively expressed CRISPR array. Transformants were selected on spectinomycin plates, and the PAM region was sequenced by High Throughput Sequencing of PCR products of the plasmids purified from pooled colonies (PAM depletion analysis). A logo (PAM logo) of the sequences in the PAM region preferred by EHCas9 for target cleavage was generated from the PAM fold‐change calculated after comparing PAM frequencies in pMML02 carriers with the corresponding values from cells carrying pMML01. Nucleotide positions 3′ from the end of the spacer‐matching strand of the target are indicated in the PAM logo. (B) Schematic representation of the in vitro PAM screening. EHCas9 protein was preincubated with EH sgRNA to generate EHCas9:sgRNA nucleoprotein complexes and mixed (cleavage reaction) with a plasmid library (7‐nt PAM library) with randomized nucleotides from the 1st to the 7th position of the PAM region. Adapters were ligated to the linearized DNA fragments and a logo (PAM logo) of the nucleotide sequences in the randomized region preferred by EHCas9 for target cleavage was generated from the frequencies of each sequence calculated after llumina sequencing of PAM‐sided PCR products. Nucleotide positions 3′ from the end of the spacer‐matching strand of the target are indicated in the PAM logo. (C) Schematic representation of the in vivo PAM validation in E. coli. E. coli cells bearing pMML03 and either pMML02 or pMML01 were transformed with a plasmid containing a target flanked by 5′‐TACCG‐3′ (PAM‐less plasmid), 5′‐TGGAG‐3′ (TGGAG plasmid), 5′‐TGGCG3′ (TGGCG plasmid), 5′‐TGGGG‐3′ (TGGGG plasmid) or 5′‐TGGTG‐3′ (TGGTG plasmid) in the PAM region. Transformants were selected on spectinomycin plates and the efficiency of transformation (number of colony‐forming units – CFU – per mg of plasmid DNA) of E. coli cells carrying pMML02 (+ EHCas9) or pMML01 (− EHCas9) was represented. Data are the mean of three biological replicates (error bars correspond to the standard deviation).CC BY · PubMed Central
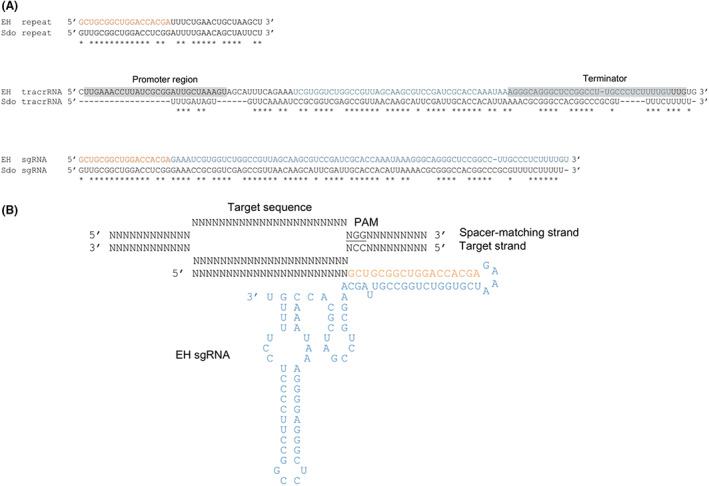
FIGURE 4 EH sgRNA design. (A) RNA sequence alignments of the EH repeat, the predicted EH tracrRNA gene region and the designed EH sgRNA with the S. donghicola (Sdo) repeat, tracrRNA coding sequence and sgRNA, correspondingly. Matching positions are marked with asterisks. Promoter and terminator regions predicted for the EH tracrRNA gene are grey shaded. The constant region of the EH sgRNA sequence was conceived by joining the EH repeat sequence in orange and the EH tracrRNA sequence in blue. (B) Scheme of the EH sgRNA including a generic 23‐nt spacer base‐paired to the target strand in a DNA substrate containing a spacer‐matching sequence and a compatible PAM (underlined). The EH sgRNA anti‐repeat and tracrRNA sequences comprising the linker (tetraloop 5′‐GAAA‐3′), the anti‐repeat and the two stem‐loop forming segments, are coloured as in panel A.
FIGURE 4 EH sgRNA design. (A) RNA sequence alignments of the EH repeat, the predicted EH tracrRNA gene region and the designed EH sgRNA with the S. donghicola (Sdo) repeat, tracrRNA coding sequence and sgRNA, correspondingly. Matching positions are marked with asterisks. Promoter and terminator regions predicted for the EH tracrRNA gene are grey shaded. The constant region of the EH sgRNA sequence was conceived by joining the EH repeat sequence in orange and the EH tracrRNA sequence in blue. (B) Scheme of the EH sgRNA including a generic 23‐nt spacer base‐paired to the target strand in a DNA substrate containing a spacer‐matching sequence and a compatible PAM (underlined). The EH sgRNA anti‐repeat and tracrRNA sequences comprising the linker (tetraloop 5′‐GAAA‐3′), the anti‐repeat and the two stem‐loop forming segments, are coloured as in panel A.CC BY · PubMed Central
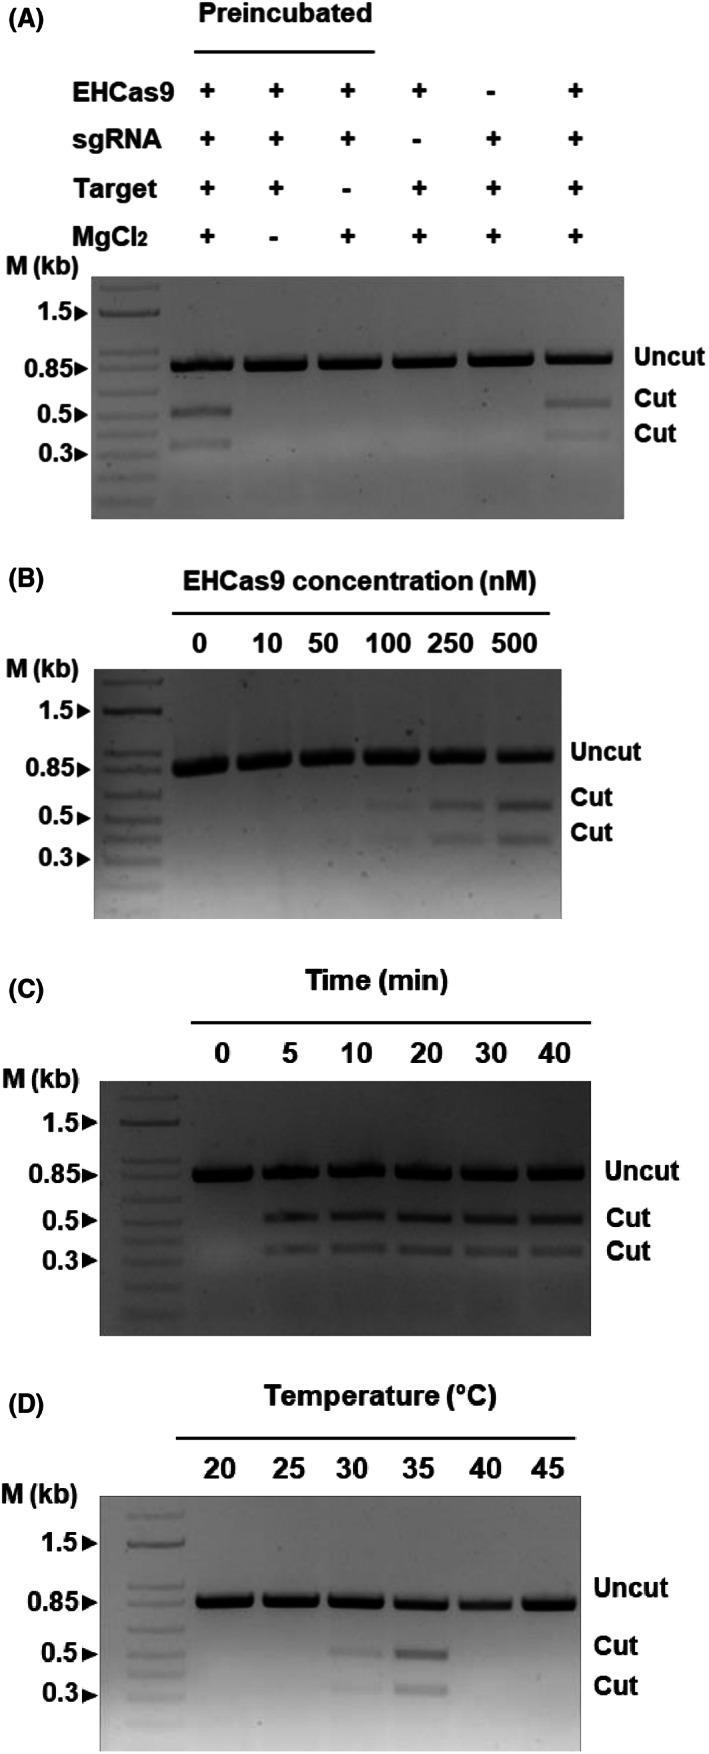
FIGURE 5 Representative agarose gel electrophoreses of in vitro EHCas9‐mediated DNA cleavage reactions. Except indicated otherwise, experiments were performed under the following standard conditions: 30 min reaction time at 37°C, 20 mM MgCl2, 25 nM of an 840 bp linear DNA containing a target sequence and a compatible PAM, preincubated (15 min at 37°C) EHCas9:EH sgRNA mixtures (0.5 mM EHCas9 and 0.5 mM EH sgRNA concentration in the digestion reaction). The length of relevant bands (in kb) of a linear dsDNA molecular weight marker (M) and the position of bands corresponding to expected cut and uncut DNA substrates are indicated. (A) Samples from standard digestion reactions, mixed either after protein:guide preincubation (lane 2) or without preincubation (lane 7), and from reactions with a missing component (MgCl2, lane 3; a compatible PAM next to the target, lane 4; a guide, lane 5; the protein, lane 6) are included. (B) Samples from digestion reactions under standard conditions but for the protein concentration (up to 500 nM). (C) Samples from standard reactions incubated for up to 40 min. (D) Samples of digestions carried out under standard conditions except by the incubation temperature (from 20°C to 45°C).
FIGURE 5 Representative agarose gel electrophoreses of in vitro EHCas9‐mediated DNA cleavage reactions. Except indicated otherwise, experiments were performed under the following standard conditions: 30 min reaction time at 37°C, 20 mM MgCl2, 25 nM of an 840 bp linear DNA containing a target sequence and a compatible PAM, preincubated (15 min at 37°C) EHCas9:EH sgRNA mixtures (0.5 mM EHCas9 and 0.5 mM EH sgRNA concentration in the digestion reaction). The length of relevant bands (in kb) of a linear dsDNA molecular weight marker (M) and the position of bands corresponding to expected cut and uncut DNA substrates are indicated. (A) Samples from standard digestion reactions, mixed either after protein:guide preincubation (lane 2) or without preincubation (lane 7), and from reactions with a missing component (MgCl2, lane 3; a compatible PAM next to the target, lane 4; a guide, lane 5; the protein, lane 6) are included. (B) Samples from digestion reactions under standard conditions but for the protein concentration (up to 500 nM). (C) Samples from standard reactions incubated for up to 40 min. (D) Samples of digestions carried out under standard conditions except by the incubation temperature (from 20°C to 45°C).CC BY · PubMed Central
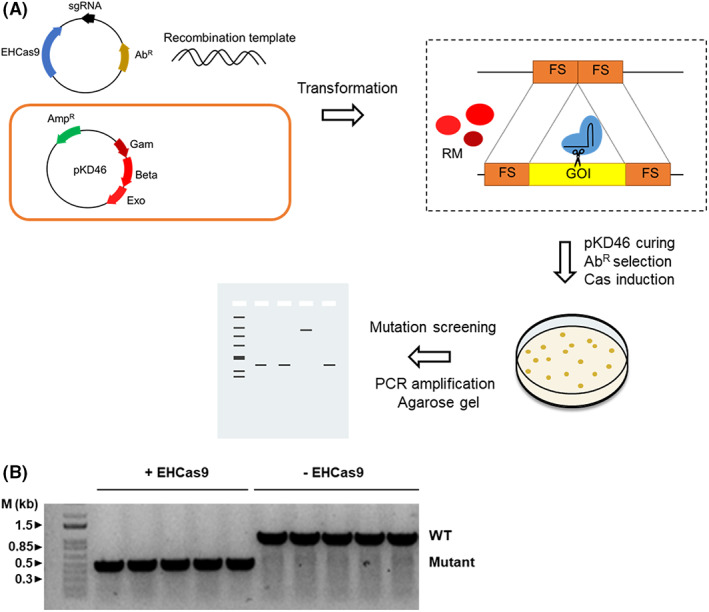
FIGURE 6 Prokaryotic genome editing with EHCas9. (A) Overview of the single‐step general procedure for positive selection of genome‐edited E. coli. E. coli cells harbouring a plasmid (e.g., pKD46; ampicillin resistance, AmpR) encoding Lambda Red recombination proteins (Gam, Beta, Exo) are co‐transformed with an antibiotic resistance (AbR) selectable plasmid carrying inducible ehcas9 gene and a sgRNA targeting a sequence within the gene of interest (GOI) and a linear dsDNA template matching both sides of the target (flanking sites, FS). Recombination between the template and the flanking sites in the gene mediated by the Lambda Red recombination machinery (RM) will result in the deletion of the target sequence. The Cas9:sgRNA ribonucleoprotein complex will produce double‐strand breaks in the non‐edited target, often leading to cell death. Colonies grown at 37°C expressing Cas9 are selected on plates (i.e., arabinose and antibiotic‐containing medium) and screened through PCR amplification and agarose gel electrophoresis to confirm the deletion. (B) An agarose gel electrophoresis of PCR products from the region surrounding pyrF (the gene of interest) in E. coli cells expressing the Lambda Red system from pKD46. DNA used for amplification was purified from chloramphenicol‐resistant colonies grown in the presence of arabinose after co‐transformation with a recombination template matching the flanks of pyrF (recombination would lead to a ca. 0.6 kb deletion), and a pBAD33‐derivative plasmid (providing chloramphenicol resistance) encoding either both EHCas9 and an EH sgRNA that targets the pyrF gene (+EHCas9) or only the EH sgRNA (−EHCas9). Each lane corresponds to a transformant clone. Bands running as linear DNA fragments with the length of the original (ca. 1 kb; WT) and the recombinant (ca. 0.5 kb; Mutant) pyrF region are indicated. The length of relevant bands of a linear dsDNA molecular weight marker is indicated.
FIGURE 6 Prokaryotic genome editing with EHCas9. (A) Overview of the single‐step general procedure for positive selection of genome‐edited E. coli. E. coli cells harbouring a plasmid (e.g., pKD46; ampicillin resistance, AmpR) encoding Lambda Red recombination proteins (Gam, Beta, Exo) are co‐transformed with an antibiotic resistance (AbR) selectable plasmid carrying inducible ehcas9 gene and a sgRNA targeting a sequence within the gene of interest (GOI) and a linear dsDNA template matching both sides of the target (flanking sites, FS). Recombination between the template and the flanking sites in the gene mediated by the Lambda Red recombination machinery (RM) will result in the deletion of the target sequence. The Cas9:sgRNA ribonucleoprotein complex will produce double‐strand breaks in the non‐edited target, often leading to cell death. Colonies grown at 37°C expressing Cas9 are selected on plates (i.e., arabinose and antibiotic‐containing medium) and screened through PCR amplification and agarose gel electrophoresis to confirm the deletion. (B) An agarose gel electrophoresis of PCR products from the region surrounding pyrF (the gene of interest) in E. coli cells expressing the Lambda Red system from pKD46. DNA used for amplification was purified from chloramphenicol‐resistant colonies grown in the presence of arabinose after co‐transformation with a recombination template matching the flanks of pyrF (recombination would lead to a ca. 0.6 kb deletion), and a pBAD33‐derivative plasmid (providing chloramphenicol resistance) encoding either both EHCas9 and an EH sgRNA that targets the pyrF gene (+EHCas9) or only the EH sgRNA (−EHCas9). Each lane corresponds to a transformant clone. Bands running as linear DNA fragments with the length of the original (ca. 1 kb; WT) and the recombinant (ca. 0.5 kb; Mutant) pyrF region are indicated. The length of relevant bands of a linear dsDNA molecular weight marker is indicated.CC BY · PubMed Central
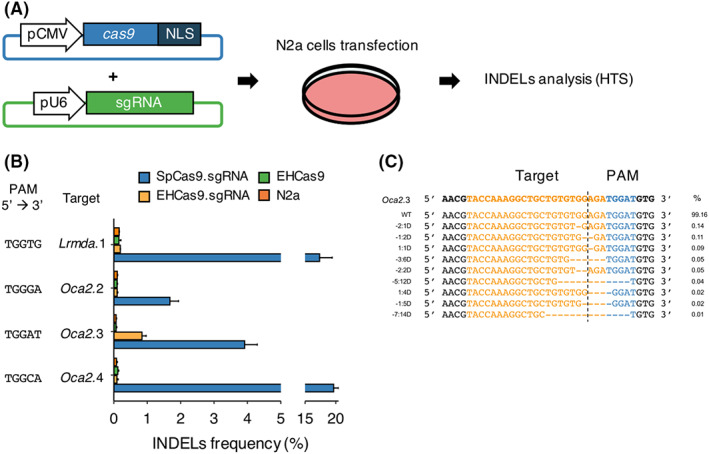
FIGURE 7 EHCas9‐mediated genome editing in mouse cells. (A) Workflow of the Cas9 genome editing assay performed in mouse N2a cell cultures. A plasmid harbouring the cas9 gene (ehcas9 or spcas9) fused to a nuclear localization signal (NLS) was co‐transfected into N2a cells with another plasmid carrying the corresponding sgRNA‐encoding sequence under constitutive promoters (CMV and U6, respectively). Insertions and deletions (INDELs) in the guide complementary region were analysed by HTS of PCR amplicons from the region encompassing the target site. (B) Percentage of reads with INDELs (n = 3 each, mean ± SD) obtained for 4 target regions (Oca2.2, Oca2.3, Oca2.4, Lrmda.1) after cell transfection with plasmids carrying SpCas9 and Sp sgRNA (SpCas9.sgRNA; blue), EHCas9 and EH sgRNA (EHCas9.sgRNA; yellow), or EHCas9 (EHCas9; green). Data from non‐transfected cells (N2a; orange) are also included. The PAM sequence of each target site is indicated. (C) Alignment of the 10 most abundant alleles revealed for Oca2.3 in EHCas9:EH sgRNA experiments. Allele frequency (mean of three biological replicates) is displayed. Left column denotes deletion positions referred to the expected cleavage‐site (dashed line) (e.g., −2:1D, one nucleotide deletion at position −2 from the cleavage site). Top line, original target region. The target sequence is coloured in orange and the PAM region in blue.
FIGURE 7 EHCas9‐mediated genome editing in mouse cells. (A) Workflow of the Cas9 genome editing assay performed in mouse N2a cell cultures. A plasmid harbouring the cas9 gene (ehcas9 or spcas9) fused to a nuclear localization signal (NLS) was co‐transfected into N2a cells with another plasmid carrying the corresponding sgRNA‐encoding sequence under constitutive promoters (CMV and U6, respectively). Insertions and deletions (INDELs) in the guide complementary region were analysed by HTS of PCR amplicons from the region encompassing the target site. (B) Percentage of reads with INDELs (n = 3 each, mean ± SD) obtained for 4 target regions (Oca2.2, Oca2.3, Oca2.4, Lrmda.1) after cell transfection with plasmids carrying SpCas9 and Sp sgRNA (SpCas9.sgRNA; blue), EHCas9 and EH sgRNA (EHCas9.sgRNA; yellow), or EHCas9 (EHCas9; green). Data from non‐transfected cells (N2a; orange) are also included. The PAM sequence of each target site is indicated. (C) Alignment of the 10 most abundant alleles revealed for Oca2.3 in EHCas9:EH sgRNA experiments. Allele frequency (mean of three biological replicates) is displayed. Left column denotes deletion positions referred to the expected cleavage‐site (dashed line) (e.g., −2:1D, one nucleotide deletion at position −2 from the cleavage site). Top line, original target region. The target sequence is coloured in orange and the PAM region in blue.CC BY · PubMed Central

Verification

Claims the paper makes

The claims and statistics of this paper haven’t been checked yet.

Run the check — free, no account needed. It reads the open-access text and checks the sources it cites.

A few free checks a day · papers already verified open instantly · results are public

Self-check

Percentages, sums and reported differences re-computed from the paper’s own numbers.

The self-check needs the paper’s full text.

Citations

Cites

Show all 1 references

Research works printed but not linked: 99

  1. 10.1007/s10123-021-00208-7 · DOI
  2. 10.1038/s41579-021-00663-z · DOI
  3. 10.1126/science.1159689 · DOI · Paper page
  4. 10.1126/science.1138140 · DOI · Paper page
  5. 10.1126/science.1165771 · DOI · Paper page
  6. 10.1038/nature09523 · DOI
  7. 10.1038/nrg2749 · DOI · Paper page
  8. 10.1038/s41579-019-0299-x · DOI · Paper page
  9. 10.1126/science.abb1400 · DOI
  10. 10.1093/nar/gkz1197 · DOI
  11. 10.1186/1745-6150-1-7 · DOI · Paper page
  12. 10.1038/nature09886 · DOI · Paper page
  13. 10.1126/science.1225829 · DOI · Paper page
  14. 10.1016/j.molcel.2013.05.001 · DOI
  15. 10.1016/j.molcel.2015.10.008 · DOI · Paper page
  16. 10.1089/crispr.2020.0093 · DOI
  17. 10.1099/mic.0.023960-0 · DOI · Paper page
  18. 10.4161/rna.23764 · DOI · Paper page
  19. 10.1080/15476286.2018.1504546 · DOI
  20. 10.1038/nature13579 · DOI · Paper page
  21. 10.1126/science.1247997 · DOI · Paper page
  22. 10.1261/rna.067355.118 · DOI
  23. 10.3389/fmolb.2020.582499 · DOI
  24. 10.1186/s12575-020-00135-3 · DOI
  25. 10.1038/nbt.2508 · DOI · Paper page
  26. 10.3390/microorganisms9040844 · DOI
  27. 10.1126/science.1231143 · DOI · Paper page
  28. 10.1126/science.1232033 · DOI · Paper page
  29. 10.1016/j.tim.2016.06.005 · DOI
  30. 10.1038/nbt.3043 · DOI · Paper page
  31. 10.1186/s13578-018-0255-x · DOI
  32. 10.1038/s41587-020-0561-9 · DOI · Paper page
  33. 10.1073/pnas.1208507109 · DOI · Paper page
  34. 10.4161/rna.24203 · DOI
  35. 10.1016/j.molcel.2017.02.007 · DOI
  36. 10.1038/s41467-019-09741-6 · DOI
  37. 10.1038/nbt.3659 · DOI · Paper page
  38. 10.1101/2022.03.30.485982 · DOI
  39. 10.1038/nbt.3404 · DOI · Paper page
  40. 10.1038/S41587-020-0412-8 · DOI
  41. 10.1126/science.aba8853 · DOI · Paper page
  42. 10.1038/s41467-020-20633-y · DOI · Paper page
  43. 10.1038/S41467-022-30228-4 · DOI
  44. 10.1093/nar/gkaa998 · DOI
  45. 10.1093/nar/gkz1225 · DOI
  46. 10.1038/s41467-020-19344-1 · DOI
  47. 10.1093/nar/gkt1262 · DOI
  48. 10.1038/nature21059 · DOI
  49. 10.1093/bib/bbx098 · DOI
  50. 10.1093/bib/bbz020 · DOI
  51. 10.4161/rna.24321 · DOI · Paper page
  52. 10.1016/j.cell.2015.08.007 · DOI
  53. 10.1016/j.molcel.2019.09.012 · DOI
  54. 10.1016/j.molcel.2019.09.025 · DOI
  55. 10.1093/nar/gkr606 · DOI
  56. 10.1093/nar/gku241 · DOI · Paper page
  57. 10.1074/jbc.M113.539726 · DOI
  58. 10.1126/sciadv.aao0027 · DOI · Paper page
  59. 10.1038/s41467-017-01591-4 · DOI
  60. 10.1073/pnas.120163297 · DOI
  61. 10.1038/ncomms14500 · DOI · Paper page
  62. 10.1038/s41467-016-0009-6 · DOI · Paper page
  63. 10.1016/j.molcel.2018.12.003 · DOI · Paper page
  64. 10.1021/jacs.7b13047 · DOI
  65. 10.1016/j.celrep.2017.11.100 · DOI
  66. 10.1016/j.molcel.2015.10.030 · DOI
  67. 10.1128/AEM.01248-15 · DOI
  68. 10.1038/s41598-021-89029-2 · DOI
  69. 10.18609/cgti.2017.008 · DOI
  70. 10.14440/jbm.2015.54.A · DOI
  71. 10.1093/nar/gkt520 · DOI · Paper page
  72. 10.1038/nbt.2842 · DOI · Paper page
  73. 10.1021/acssynbio.6b00215 · DOI
  74. 10.1186/1471-2164-15-202 · DOI
  75. 10.1038/nature14299 · DOI · Paper page
  76. 10.1038/nmeth.4278 · DOI · Paper page
  77. 10.1089/crispr.2020.0053 · DOI
  78. 10.1038/s41587-020-0555-7 · DOI
  79. 10.1080/15476286.2018.1483685 · DOI
  80. 10.1093/bioinformatics/btr026 · DOI
  81. 10.7287/peerj.preprints.1900 · DOI
  82. 10.1101/gr.213959.116 · DOI · Paper page
  83. 10.1093/nar/gky425 · DOI
  84. 10.1186/1471-2105-11-119 · DOI
  85. 10.1093/nar/gkr367 · DOI · Paper page
  86. Solovyev V , Salamov A. Automatic annotation of microbial genomes and metagenomic sequences. In: Li R , editor. Metagenomics and its applications in agriculture, biomedicine and environmental studies. Nova Science Publishers; 2011. pp. 61–78.
  87. 10.1093/nar/gkz303 · DOI
  88. 10.1093/nar/gkh340 · DOI · Paper page
  89. 10.1371/journal.pone.0009490 · DOI · Paper page
  90. 10.1093/molbev/msp077 · DOI · Paper page
  91. 10.1093/nar/gkt376 · DOI
  92. 10.1093/nar/gkg595 · DOI · Paper page
  93. 10.1038/s41592-022-01488-1 · DOI · Paper page
  94. 10.1371/journal.pone.0005553 · DOI
  95. 10.1093/nar/gkw407 · DOI
  96. 10.1093/bioinformatics/btu170 · DOI · Paper page
  97. 10.1038/nmeth.1923 · DOI · Paper page
  98. 10.1093/bioinformatics/btp352 · DOI · Paper page
  99. 10.1038/nbt.3628 · DOI

Metadata

Authors
Esquerra-Ruvira, B., Baquedano, I., Ruiz, R., Fernandez, A., Montoliu, L., & Mojica, F. J.
Affiliations
University of Alicante (ES)
Corresponding author
Mojica, Francisco JM
Venue
Microbial Biotechnology
Publisher
openRxiv
Published
2022-11-01
Volume
16
Issue
7
Pages
1505-1523
ISSN
1751-7915 (ISSN-L)
OpenAlex
W4366991807
Cited by
4
References
1
Citations by year
2024: 2 · 2023: 2
FWCI
0.36
Type
journal article
Language
en
Open access
Licence
cc-by
Locations
  • Microbial Biotechnology (publishedVersion, cc-by)
  • bioRxiv (Cold Spring Harbor Laboratory) (acceptedVersion)
  • PubMed Central (publishedVersion, cc-by)
  • PubMed (publishedVersion)
  • DIGITAL.CSIC (Spanish National Research Council (CSIC)) (submittedVersion, cc-by)
  • DOAJ (DOAJ: Directory of Open Access Journals) (submittedVersion, cc-by-sa)
  • RUA, Repositorio Institucional de la Universidad de Alicante (Universidad de Alicante) (submittedVersion, cc-by)
Funders
  • Universidad de Alicante
  • Generalitat Valenciana (PROMETEO/2021/057, PROMETEO/2017/129)
  • Ministerio de Ciencia e Innovación (RTI2018-101223-B-I00, B-I00, PID2021-127644OB-I00)
Topics
  • Life Sciences › Biochemistry, Genetics and Molecular Biology › Molecular Biology › CRISPR and Genetic Engineering
  • Life Sciences › Biochemistry, Genetics and Molecular Biology › Genetics › Bacterial Genetics and Biotechnology
  • Life Sciences › Biochemistry, Genetics and Molecular Biology › Molecular Biology › RNA regulation and disease
Keywords
CRISPR/Cas9, metagenome, genome editing, PAM sequence, Cas9 nuclease, non-coding RNA
MeSH terms
Gene Editing, CRISPR-Associated Protein 9, DNA, Metagenome, CRISPR-Cas Systems

About these checks

Registry, retraction, Cites and statistics results are computed, not judged, with one exception: a printed reference that no index lists is read once by a model before it counts as a citation error. Claims are extracted by a model and kept only when their quote appears verbatim in the text; each cited source is then checked, with a model’s help, for whether it says what the claim relies on. Those verdicts can be wrong — read the claim’s quote and the cited source before relying on one.

Statistics and arithmetic are recomputed, not judged.

Confidence bands are shown only for fields calibrated on our annotated test set. None is calibrated yet, so no band is shown.

What counts as a claim ›How we measure confidence ›How we check this ›

Are you an author, or do you see a problem with this page? Request a review

How to cite

Cite CoChat for the checks on this page, and the paper for its own findings.

This page
CoChat. (2026). Citation check: Identification of the EH CRISPR-Cas9 system on a metagenome and its application to genome engineering. https://app.cochat.ai/papers/10.1101/2022.10.31.514646
The paper
Esquerra-Ruvira, B., Baquedano, I., Ruiz, R., Fernandez, A., Montoliu, L., & Mojica, F. J. (2022). Identification of the EH CRISPR-Cas9 system on a metagenome and its application to genome engineering. Microbial Biotechnology. https://doi.org/10.1101/2022.10.31.514646