

The DOI matches its Crossref record; 64 of the 64 references it cites were found in a registry or an index; none of the 23 sources its claims cite is checked for support yet.
Fecal Microbiome Transplantation from Children with Autism Spectrum Disorder Modulates Tryptophan and Serotonergic Synapse Metabolism and Induces Altered Behaviors in Germ-Free Mice
Open accessAbstract
The relationship between the gut microbiota and ASD is not yet fully understood. Numerous studies have focused on the differences in intestinal microbial and metabolism profiles between TD and ASD children.
Overview
AI snapshot
Written from the paper’s full text.
TL;DR
Fecal microbiota from children with ASD transferred into germ-free mice induced ASD-like behaviors, distinct cecal microbial communities, and altered tryptophan/serotonin metabolism relative to mice receiving microbiota from typically developing children. The same tryptophan and serotonergic synapse pathways were altered in fecal samples from children with ASD, and key serotonin synthesis/transport proteins changed in mouse colon and prefrontal cortex.
Key findings
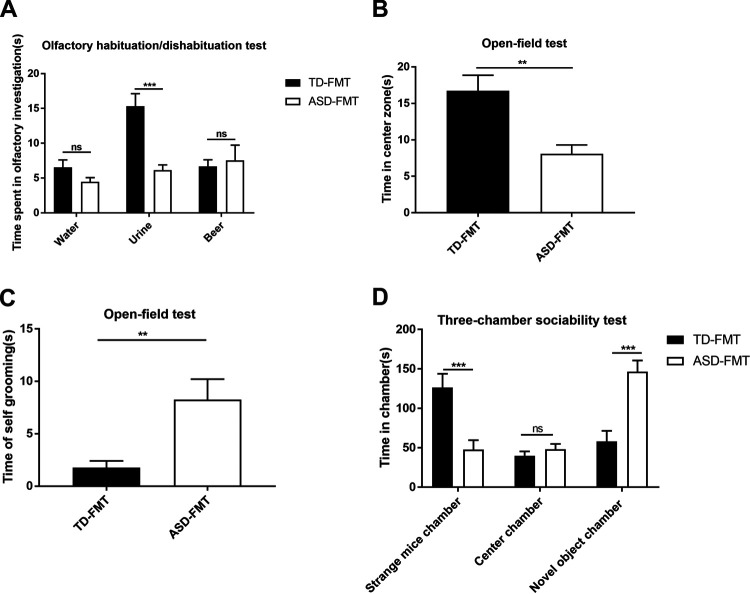
- ASD-FMT mice showed ASD-like behaviors versus TD-FMT mice: shorter sniffing of mouse urine (P < 0.001), less time in the open-field center zone (P < 0.01), more self-grooming (P < 0.01), greater novel-object chamber preference (P < 0.001), and lesser strange-mouse chamber preference (P < 0.001) (n = 16).
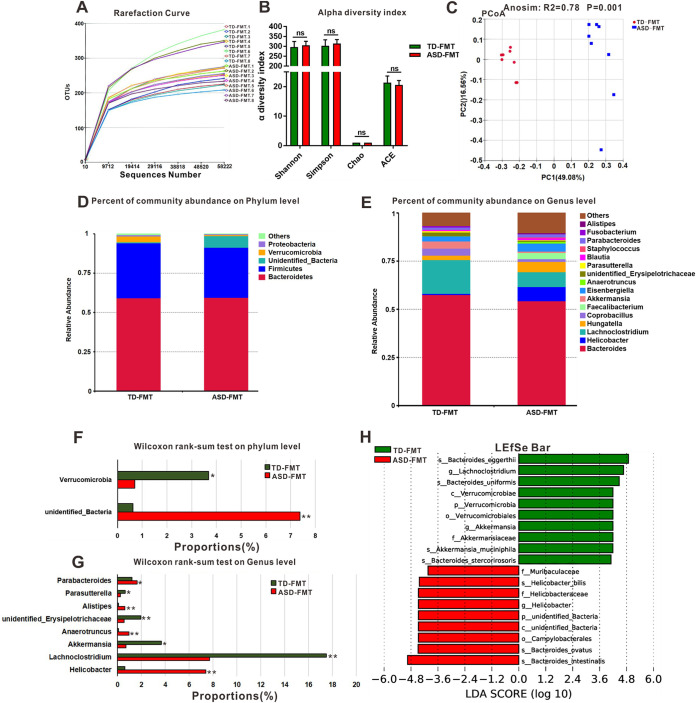
- Cecal microbiota differed between groups: no significant α-diversity differences, but ANOSIM showed between-group separation (R² = 0.78; P = 0.001). Verrucomicrobia was lower (P < 0.05) and unidentified_Bacteria higher (P < 0.01) in ASD-FMT; genera increased in ASD-FMT included Parabacteroides (P < 0.05), Alistipes (P < 0.01), Anaerotruncus (P < 0.01), and Helicobacter (P < 0.01), while Parasutterella (P < 0.05), Akkermansia (P < 0.05), Lachnoclostridium (P < 0.01), and unidentified_Erysipelotrichaceae (P < 0.01) were decreased (n = 8).
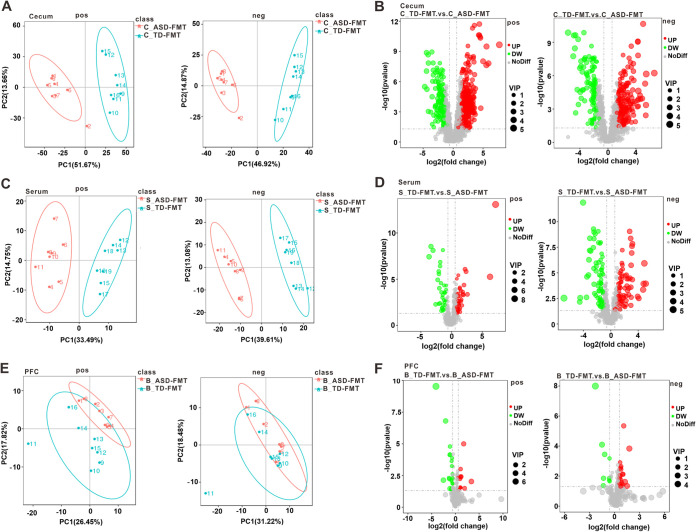
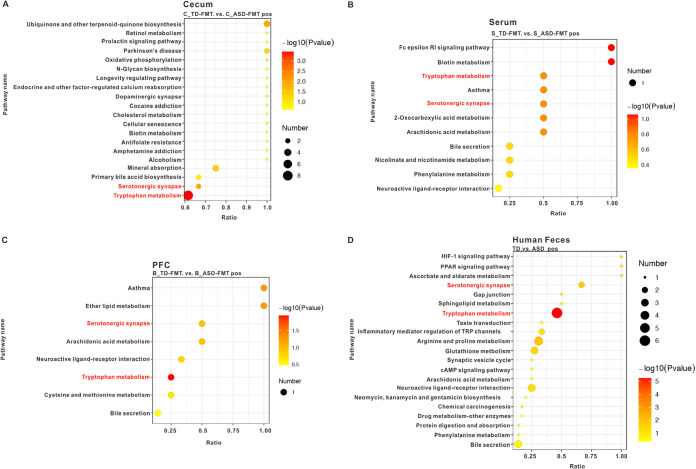
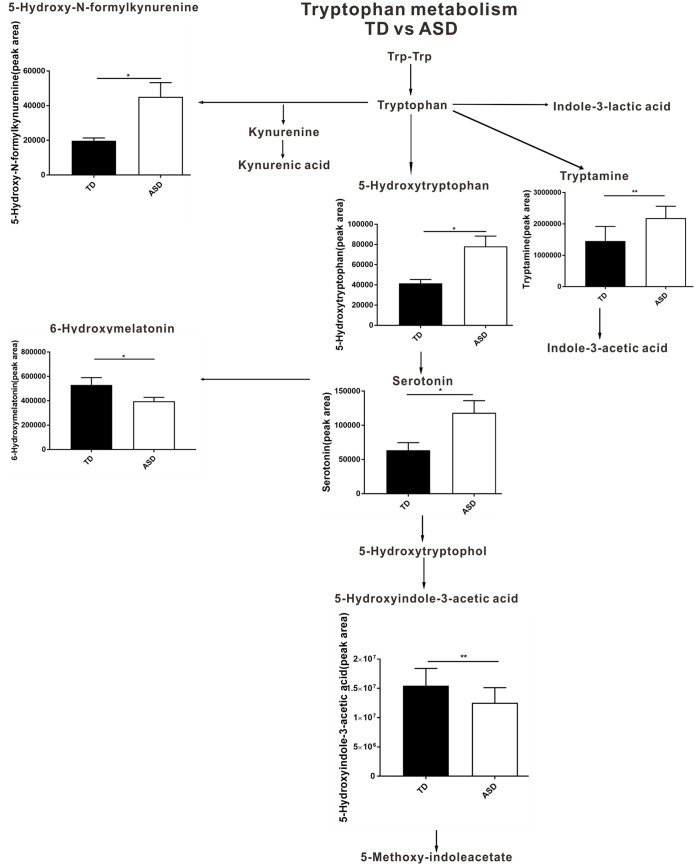
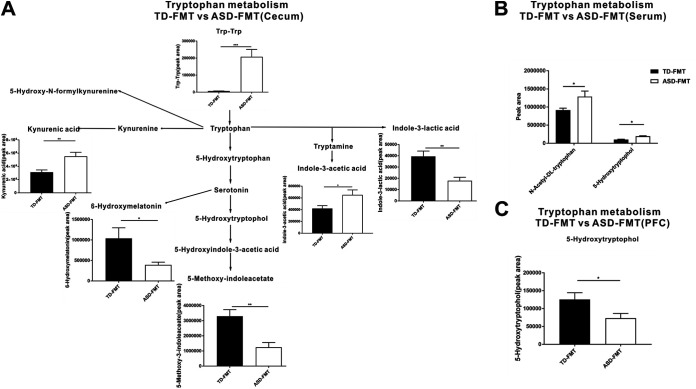
- Untargeted metabolomics found 963 differential cecal metabolites (698 down, 265 up in ASD-FMT), 239 serum metabolites (122 down, 117 up), and 65 prefrontal cortex metabolites (36 down, 29 up). Tryptophan metabolism and serotonergic synapse pathways were enriched in cecal contents, serum, prefrontal cortex, and in feces from 120 children with ASD versus 60 TD children; picky eating differed (ASD 80/120 [66.7%] vs TD 26/60 [43.3%], P < 0.001).
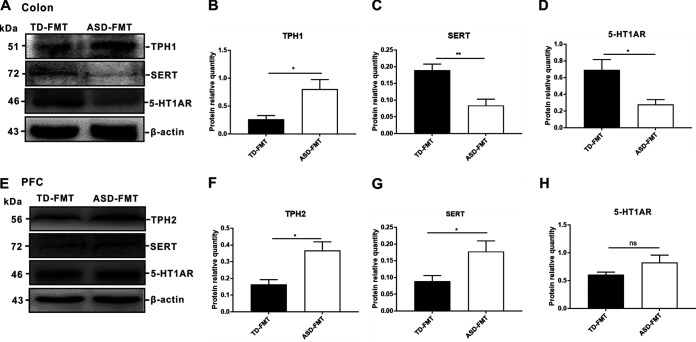
- Protein expression in ASD-FMT versus TD-FMT mice: colon TPH1 was upregulated (P < 0.05), colon SERT (P < 0.01) and 5-HT1AR (P < 0.05) were downregulated; prefrontal cortex TPH2 and SERT were upregulated (P < 0.05 for both), while prefrontal cortex 5-HT1AR did not differ (P > 0.05) (n = 3).
Methods
- Thirty-two male germ-free BALB/c mice were randomized to receive 200 μl fecal suspension from 5 TD children or 5 children with ASD (boys aged 2–6 years); behavioral testing occurred after 3 weeks, and cecal contents, serum, prefrontal cortex, colon, and other tissues were collected.
- Cecal microbiota was analyzed by 16S rRNA gene V4 sequencing with α/β diversity, PCoA, Wilcoxon tests, and LEfSe (LDA > 4); untargeted LC-MS/MS metabolomics was performed on mouse cecal contents, serum, and prefrontal cortex, plus fecal samples from 120 children with ASD and 60 TD children, with KEGG pathway enrichment and Spearman correlation.
- Western blotting measured TPH1, SERT, and 5-HT1AR in mouse colon and TPH2, SERT, and 5-HT1AR in prefrontal cortex; differential metabolites were defined by VIP ≥ 1, P < 0.05, and fold change ≥ 1.25 or ≤ 0.8, with significance generally set at P < 0.05.
Limitations
- The paper states that it is difficult to distinguish whether mouse cecal metabolites were host-derived or microbiota-derived; the causal relationship between gut microbes, metabolites, and key metabolic proteins remains unclear; and multiple factors affecting the microbiome and metabolomics could not be fully controlled.
- Evident from the text: omics analyses used small mouse sample sizes (n = 8 per group; Western blot n = 3), and the mouse donors were only boys aged 2–6 years, limiting generalizability.
- Evident from the text: the human validation cohort was separate from the 5+5 mouse donors and provided only fecal metabolomics, so human causal or protein-level findings were not directly tested.
Model-written summary. Check it against the paper before relying on it.
Integrity signals
Registry
Cites
Statistics
Figures
Verification
Claims the paper makes
43 Own result · 20 Not checked yet · 16 Own method · 9 Own interpretation · 1 No basis given
A result the paper reports from its own data — it cites no other source for it, so there is none to check. The quote shows it is in the paper.
In the paper
“in the cecal contents of mice, the levels of Trp-Trp (a dipeptide of tryptophan), kynurenic acid, and indole-3-acetic acid were significantly higher and those of 6-hydroxymelatonin, indole-3-lactic acid, and 5-methoxy-indoleacetate were significantly lower in the ASD-FMT group than in the TD-FMT group”
§ Fecal Microbiome Transplantation from Children with Autism Spectrum Disorder Modulates Tryptophan and Serotonergic Synapse Metabolism and Induces Altered Behaviors in Germ-Free Mice > RESULTS > Tryptophan metabolism and serotonergic synapse pathways were also altered in fecal samples of children with ASD.
plaincorrelational- Asserted: passes — The authors put it forward as true.
- Checkable: passes — It can be checked against evidence.
- Load-bearing: passes — The paper’s conclusions depend on it.
- Based: passes — The paper gives a reason why it holds.
A result the paper reports from its own data — it cites no other source for it, so there is none to check. The quote shows it is in the paper.
In the paper
“During this test, the time of movement in the center zone was significantly shorter in the ASD-FMT group than in the TD-FMT group (Fig. 1B) (P < 0.01).”
§ Fecal Microbiome Transplantation from Children with Autism Spectrum Disorder Modulates Tryptophan and Serotonergic Synapse Metabolism and Induces Altered Behaviors in Germ-Free Mice > RESULTS > FMT from children with ASD facilitated abnormal behaviors in GF mice.
plainn = 16 ·- Asserted: passes — The authors put it forward as true.
- Checkable: passes — It can be checked against evidence.
- Load-bearing: passes — The paper’s conclusions depend on it.
- Based: passes — The paper gives a reason why it holds.
A result the paper reports from its own data — it cites no other source for it, so there is none to check. The quote shows it is in the paper.
In the paper
“a total of 239 differentially expressed metabolites were detected in the serum samples, including 122 downregulated metabolites and 117 upregulated metabolites in the ASD-FMT group”
§ Fecal Microbiome Transplantation from Children with Autism Spectrum Disorder Modulates Tryptophan and Serotonergic Synapse Metabolism and Induces Altered Behaviors in Germ-Free Mice > RESULTS > FMT altered the tryptophan metabolism and serotonergic synapse pathways in mice.
plain- Asserted: passes — The authors put it forward as true.
- Checkable: passes — It can be checked against evidence.
- Load-bearing: passes — The paper’s conclusions depend on it.
- Based: passes — The paper gives a reason why it holds.
A result the paper reports from its own data — it cites no other source for it, so there is none to check. The quote shows it is in the paper.
In the paper
“5-hydroxy-N-formylkynurenine, tryptamine, 5-hydroxytryptophan, and serotonin were more abundant in children with ASD than in TD children”
§ Fecal Microbiome Transplantation from Children with Autism Spectrum Disorder Modulates Tryptophan and Serotonergic Synapse Metabolism and Induces Altered Behaviors in Germ-Free Mice > RESULTS > Tryptophan metabolism and serotonergic synapse pathways were also altered in fecal samples of children with ASD.
plaincorrelationaln = 120- Asserted: passes — The authors put it forward as true.
- Checkable: passes — It can be checked against evidence.
- Load-bearing: passes — The paper’s conclusions depend on it.
- Based: passes — The paper gives a reason why it holds.
A result the paper reports from its own data — it cites no other source for it, so there is none to check. The quote shows it is in the paper.
In the paper
“The expression levels of TPH2 and SERT in the prefrontal cortex were significantly upregulated in the ASD-FMT group compared with the TD-FMT group (P < 0.05 for both)”
§ Fecal Microbiome Transplantation from Children with Autism Spectrum Disorder Modulates Tryptophan and Serotonergic Synapse Metabolism and Induces Altered Behaviors in Germ-Free Mice > RESULTS > FMT from ASD donors altered key proteins involved in serotonin synthesis and transport in colonized mice.
plaincorrelational- Asserted: passes — The authors put it forward as true.
- Checkable: passes — It can be checked against evidence.
- Load-bearing: passes — The paper’s conclusions depend on it.
- Based: passes — The paper gives a reason why it holds.
A result the paper reports from its own data — it cites no other source for it, so there is none to check. The quote shows it is in the paper.
In the paper
“At the genus level, Parabacteroides (P < 0.05), Alistipes (P < 0.01), Anaerotruncus (P < 0.01), and Helicobacter (P < 0.01) were increased in the ASD-FMT group compared with the TD-FMT group”
§ Fecal Microbiome Transplantation from Children with Autism Spectrum Disorder Modulates Tryptophan and Serotonergic Synapse Metabolism and Induces Altered Behaviors in Germ-Free Mice > RESULTS > FMT from children with ASD led to differential microbial community structures in GF mice.
plaindirect- Asserted: passes — The authors put it forward as true.
- Checkable: passes — It can be checked against evidence.
- Load-bearing: unclear — It is unclear whether the paper’s conclusions depend on it.
- Based: passes — The paper gives a reason why it holds.
A result the paper reports from its own data — it cites no other source for it, so there is none to check. The quote shows it is in the paper.
In the paper
“Principal-coordinate analysis (PCoA) plots revealed conspicuous differences in microbial community structures between the TD-FMT and ASD-FMT groups”
§ Fecal Microbiome Transplantation from Children with Autism Spectrum Disorder Modulates Tryptophan and Serotonergic Synapse Metabolism and Induces Altered Behaviors in Germ-Free Mice > RESULTS > FMT from children with ASD led to differential microbial community structures in GF mice.
plaincorrelational- Asserted: passes — The authors put it forward as true.
- Checkable: passes — It can be checked against evidence.
- Load-bearing: passes — The paper’s conclusions depend on it.
- Based: passes — The paper gives a reason why it holds.
A result the paper reports from its own data — it cites no other source for it, so there is none to check. The quote shows it is in the paper.
In the paper
“The protein expression level of TPH1 in the colon was notably upregulated in the ASD-FMT group compared with the TD-FMT group (P < 0.05)”
§ Fecal Microbiome Transplantation from Children with Autism Spectrum Disorder Modulates Tryptophan and Serotonergic Synapse Metabolism and Induces Altered Behaviors in Germ-Free Mice > RESULTS > FMT from ASD donors altered key proteins involved in serotonin synthesis and transport in colonized mice.
plaincorrelational- Asserted: passes — The authors put it forward as true.
- Checkable: passes — It can be checked against evidence.
- Load-bearing: passes — The paper’s conclusions depend on it.
- Based: passes — The paper gives a reason why it holds.
A result the paper reports from its own data — it cites no other source for it, so there is none to check. The quote shows it is in the paper.
In the paper
“The time spent sniffing mouse urine was significantly shorter in the ASD-FMT group than in the TD-FMT group (P < 0.001) (Fig. 1A).”
§ Fecal Microbiome Transplantation from Children with Autism Spectrum Disorder Modulates Tryptophan and Serotonergic Synapse Metabolism and Induces Altered Behaviors in Germ-Free Mice > RESULTS > FMT from children with ASD facilitated abnormal behaviors in GF mice.
plain- Asserted: passes — The authors put it forward as true.
- Checkable: passes — It can be checked against evidence.
- Load-bearing: passes — The paper’s conclusions depend on it.
- Based: passes — The paper gives a reason why it holds.
A result the paper reports from its own data — it cites no other source for it, so there is none to check. The quote shows it is in the paper.
In the paper
“Bacteroidetes, Firmicutes, unidentified_Bacteria, Verrucomicrobia, and Proteobacteria were the most abundant bacteria present in the cecum in the two groups.”
§ Fecal Microbiome Transplantation from Children with Autism Spectrum Disorder Modulates Tryptophan and Serotonergic Synapse Metabolism and Induces Altered Behaviors in Germ-Free Mice > RESULTS > FMT from children with ASD led to differential microbial community structures in GF mice.
plain- Asserted: passes — The authors put it forward as true.
- Checkable: passes — It can be checked against evidence.
- Load-bearing: unclear — It is unclear whether the paper’s conclusions depend on it.
- Based: passes — The paper gives a reason why it holds.
- It may state two separate claims as one. 19
- Probably not a substantial claim. 23
A result the paper reports from its own data — it cites no other source for it, so there is none to check. The quote shows it is in the paper.
In the paper
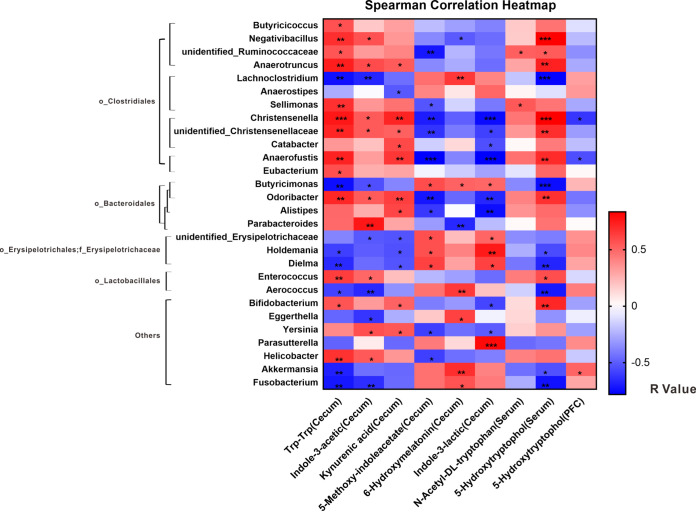
“these three significantly upregulated metabolites in the ASD-FMT group were positively correlated with some genera in the order_Bacteroidetes (o_Bacteroidetes) (but not Butyricimonas) and negatively correlated with the order_Erysipelotrichales (o_Erysipelotrichales), family_Erysipelotrichaceae (f_Erysipelotrichaceae).”
§ Fecal Microbiome Transplantation from Children with Autism Spectrum Disorder Modulates Tryptophan and Serotonergic Synapse Metabolism and Induces Altered Behaviors in Germ-Free Mice > RESULTS > Specific bacteria in mice after FMT may be associated with tryptophan and serotonin metabolism.
plaincorrelational- Asserted: passes — The authors put it forward as true.
- Checkable: passes — It can be checked against evidence.
- Load-bearing: unclear — It is unclear whether the paper’s conclusions depend on it.
- Based: passes — The paper gives a reason why it holds.
It may state two separate claims as one.
A result the paper reports from its own data — it cites no other source for it, so there is none to check. The quote shows it is in the paper.
In the paper
“Verrucomicrobia and unidentified_Bacteria showed statistically significant differences between the two groups and were identified as key phyla. At the genus level, Helicobacter, Lachnoclostridium, and Akkermansia showed significant between-group differences and were identified as key genera”
§ Fecal Microbiome Transplantation from Children with Autism Spectrum Disorder Modulates Tryptophan and Serotonergic Synapse Metabolism and Induces Altered Behaviors in Germ-Free Mice > RESULTS > FMT from children with ASD led to differential microbial community structures in GF mice.
plaincorrelational- Asserted: passes — The authors put it forward as true.
- Checkable: passes — It can be checked against evidence.
- Load-bearing: unclear — It is unclear whether the paper’s conclusions depend on it.
- Based: passes — The paper gives a reason why it holds.
It may state two separate claims as one.
A result the paper reports from its own data — it cites no other source for it, so there is none to check. The quote shows it is in the paper.
In the paper
“In the prefrontal cortex samples, 65 differentially expressed metabolites were identified, of which 36 were downregulated and 29 were upregulated in the ASD-FMT group”
§ Fecal Microbiome Transplantation from Children with Autism Spectrum Disorder Modulates Tryptophan and Serotonergic Synapse Metabolism and Induces Altered Behaviors in Germ-Free Mice > RESULTS > FMT altered the tryptophan metabolism and serotonergic synapse pathways in mice.
plain- Asserted: passes — The authors put it forward as true.
- Checkable: passes — It can be checked against evidence.
- Load-bearing: passes — The paper’s conclusions depend on it.
- Based: passes — The paper gives a reason why it holds.
It may state two separate claims as one.
What the paper did — it cites no source for this, so there is none to check. The quote shows it is in the paper.
In the paper
“The rarefaction curves for all the cecal samples collected from the TD-FMT and ASD-FMT mice tended to approach the saturation plateau (Fig. 2A), suggesting that the sequencing depth was enough to cover the whole bacterial diversity and was suitable for the present study.”
§ Fecal Microbiome Transplantation from Children with Autism Spectrum Disorder Modulates Tryptophan and Serotonergic Synapse Metabolism and Induces Altered Behaviors in Germ-Free Mice > RESULTS > FMT from children with ASD led to differential microbial community structures in GF mice.
hedged- Asserted: passes — The authors put it forward as true.
- Checkable: passes — It can be checked against evidence.
- Load-bearing: passes — The paper’s conclusions depend on it.
- Based: passes — The paper gives a reason why it holds.
It may state two separate claims as one.
In the paper
“Patients with ASD exhibit altered tryptophan metabolism, with reduced levels of tryptophan and an increased kynurenine-to-tryptophan ratio in the plasma”
§ Fecal Microbiome Transplantation from Children with Autism Spectrum Disorder Modulates Tryptophan and Serotonergic Synapse Metabolism and Induces Altered Behaviors in Germ-Free Mice > DISCUSSION
What the sources say
- Not checked yetcites [35] Kałużna-Czaplińska J, Gątarek P, Chirumbolo S, Chartrand MS, Bjørklund G. 2019. How important is tryptophan in human health? Crit Rev Food Sci Nutr 59: 72– 88. doi: 10.1080/10408398.2017.1357534. 28799778
plaincorrelational- Asserted: passes — The authors put it forward as true.
- Checkable: passes — It can be checked against evidence.
- Load-bearing: unclear — It is unclear whether the paper’s conclusions depend on it.
- Based: passes — The paper gives a reason why it holds.
It may state two separate claims as one.
In the paper
“in autistic children, the serotonin level is increased in the serum and decreased in the brain”
§ Fecal Microbiome Transplantation from Children with Autism Spectrum Disorder Modulates Tryptophan and Serotonergic Synapse Metabolism and Induces Altered Behaviors in Germ-Free Mice > DISCUSSION
What the sources say
- Not checked yetcites [36] De Theije CGM, Wu J, Da Silva SL, Kamphuis PJ, Garssen J, Korte SM, Kraneveld AD. 2011. Pathways underlying the gut-to-brain connection in autism spectrum disorders as future targets for disease management. Eur J Pharmacol 668: S70– S80. doi: 10.1016/j.ejphar.2011.07.013. 21810417
plaincorrelational- Asserted: passes — The authors put it forward as true.
- Checkable: passes — It can be checked against evidence.
- Load-bearing: unclear — It is unclear whether the paper’s conclusions depend on it.
- Based: passes — The paper gives a reason why it holds.
It may state two separate claims as one.
In the paper
“some bacteria belonging to the genera Clostridium, Ruminococcus, Blautia, and Lactobacillus have been identified as being able to convert tryptophan to tryptamine”
§ Fecal Microbiome Transplantation from Children with Autism Spectrum Disorder Modulates Tryptophan and Serotonergic Synapse Metabolism and Induces Altered Behaviors in Germ-Free Mice > DISCUSSION
What the sources say
- Not checked yetcites [40] Williams BB, Van Benschoten AH, Cimermancic P, Donia MS, Zimmermann M, Taketani M, Ishihara A, Kashyap PC, Fraser JS, Fischbach MA. 2014. Discovery and characterization of gut microbiota decarboxylases that can produce the neurotransmitter tryptamine. Cell Host Microbe 16: 495– 503. doi: 10.1016/j.chom.2014.09.001. 25263219 PMC4260654
plaindirect- Asserted: passes — The authors put it forward as true.
- Checkable: passes — It can be checked against evidence.
- Load-bearing: fails — The paper’s conclusions may not depend on it.
- Based: passes — The paper gives a reason why it holds.
Probably not a substantial claim. The paper’s conclusions may not depend on it.
In the paper
“microbiota transfer therapy, which changes the intestinal microenvironment, has improved behavioral problems and gastrointestinal symptoms in children with ASD”
§ Fecal Microbiome Transplantation from Children with Autism Spectrum Disorder Modulates Tryptophan and Serotonergic Synapse Metabolism and Induces Altered Behaviors in Germ-Free Mice > DISCUSSION
What the sources say
- Not checked yetcites [28] Kang D-W, Adams JB, Coleman DM, Pollard EL, Maldonado J, McDonough-Means S, Caporaso JG, Krajmalnik-Brown R. 2019. Long-term benefit of microbiota transfer therapy on autism symptoms and gut microbiota. Sci Rep 9: 5821. doi: 10.1038/s41598-019-42183-0. 30967657 PMC6456593 source
plaindirect- Asserted: passes — The authors put it forward as true.
- Checkable: passes — It can be checked against evidence.
- Load-bearing: unclear — It is unclear whether the paper’s conclusions depend on it.
- Based: passes — The paper gives a reason why it holds.
It may state two separate claims as one.
In the paper
“TPH1 is present mainly in peripheral organs such as the intestines and spleen, while TPH2 predominates in the brain stem”
§ Fecal Microbiome Transplantation from Children with Autism Spectrum Disorder Modulates Tryptophan and Serotonergic Synapse Metabolism and Induces Altered Behaviors in Germ-Free Mice > DISCUSSION
What the sources say
- Not checked yetcites [46] Walther DJ, Peter J-U, Bashammakh S, Hörtnagl H, Voits M, Fink H, Bader M. 2003. Synthesis of serotonin by a second tryptophan hydroxylase isoform. Science 299: 76. doi: 10.1126/science.1078197. 12511643
plain- Asserted: passes — The authors put it forward as true.
- Checkable: passes — It can be checked against evidence.
- Load-bearing: fails — The paper’s conclusions may not depend on it.
- Based: passes — The paper gives a reason why it holds.
Probably not a substantial claim. The paper’s conclusions may not depend on it. It may state two separate claims as one.
A conclusion the paper draws from its own results — it cites no other source for it, so there is none to check. The quote shows it is in the paper.
In the paper
“our findings show that ASD-related intestinal microbes induced abnormal tryptophan and serotonin metabolism in both ASD-FMT mice and children with ASD”
§ Fecal Microbiome Transplantation from Children with Autism Spectrum Disorder Modulates Tryptophan and Serotonergic Synapse Metabolism and Induces Altered Behaviors in Germ-Free Mice > RESULTS > Tryptophan metabolism and serotonergic synapse pathways were also altered in fecal samples of children with ASD.
plaindirect- Asserted: passes — The authors put it forward as true.
- Checkable: passes — It can be checked against evidence.
- Load-bearing: passes — The paper’s conclusions depend on it.
- Based: passes — The paper gives a reason why it holds.
It may state two separate claims as one.
In the paper
“Clostridia and Bacteroides can produce propionic acid”
§ Fecal Microbiome Transplantation from Children with Autism Spectrum Disorder Modulates Tryptophan and Serotonergic Synapse Metabolism and Induces Altered Behaviors in Germ-Free Mice > DISCUSSION
What the sources say
- Not checked yetcites [44] MacFabe DF, Cain NE, Boon F, Ossenkopp KP, Cain DP. 2011. Effects of the enteric bacterial metabolic product propionic acid on object-directed behavior, social behavior, cognition, and neuroinflammation in adolescent rats: relevance to autism spectrum disorder. Behav Brain Res 217: 47– 54. doi: 10.1016/j.bbr.2010.10.005. 20937326
plaindirect- Asserted: passes — The authors put it forward as true.
- Checkable: passes — It can be checked against evidence.
- Load-bearing: fails — The paper’s conclusions may not depend on it.
- Based: passes — The paper gives a reason why it holds.
Probably not a substantial claim. The paper’s conclusions may not depend on it.
What the paper did — it cites no source for this, so there is none to check. The quote shows it is in the paper.
In the paper
“it is difficult to distinguish whether the metabolites in the mouse cecum were derived from the host or from the gut microbiota.”
§ Fecal Microbiome Transplantation from Children with Autism Spectrum Disorder Modulates Tryptophan and Serotonergic Synapse Metabolism and Induces Altered Behaviors in Germ-Free Mice > DISCUSSION
plain- Asserted: passes — The authors put it forward as true.
- Checkable: passes — It can be checked against evidence.
- Load-bearing: fails — The paper’s conclusions may not depend on it.
- Based: passes — The paper gives a reason why it holds.
Probably not a substantial claim. The paper’s conclusions may not depend on it.
In the paper
“TPH catalyzes the rate-limiting step in serotonin synthesis”
§ Fecal Microbiome Transplantation from Children with Autism Spectrum Disorder Modulates Tryptophan and Serotonergic Synapse Metabolism and Induces Altered Behaviors in Germ-Free Mice > DISCUSSION
What the sources say
- Not checked yetcites [45] Khan WI, Ghia JE. 2010. Gut hormones: emerging role in immune activation and inflammation. Clin Exp Immunol 161: 19– 27. doi: 10.1111/j.1365-2249.2010.04150.x. 20408856 PMC2940144
plaindirect- Asserted: passes — The authors put it forward as true.
- Checkable: passes — It can be checked against evidence.
- Load-bearing: fails — The paper’s conclusions may not depend on it.
- Based: passes — The paper gives a reason why it holds.
Probably not a substantial claim. The paper’s conclusions may not depend on it.
In the paper
“It has been found that Bifidobacterium, Blautia, Dialister, Prevotella, Veillonella, and Turicibacter are decreased and that Lactobacillus, Bacteroides, Desulfovibrio, and Clostridium are increased in the gut microbiota of children with ASD relative to TD children”
§ Fecal Microbiome Transplantation from Children with Autism Spectrum Disorder Modulates Tryptophan and Serotonergic Synapse Metabolism and Induces Altered Behaviors in Germ-Free Mice > INTRODUCTION
What the sources say
- Not checked yetcites [11] Liu F, Li J, Wu F, Zheng H, Peng Q, Zhou H. 2019. Altered composition and function of intestinal microbiota in autism spectrum disorders: a systematic review. Transl Psychiatry 9: 43. doi: 10.1038/s41398-019-0389-6. 30696816 PMC6351640
plaincorrelational- Asserted: passes — The authors put it forward as true.
- Checkable: passes — It can be checked against evidence.
- Load-bearing: passes — The paper’s conclusions depend on it.
- Based: passes — The paper gives a reason why it holds.
It may state two separate claims as one.
A conclusion the paper draws from its own results — it cites no other source for it, so there is none to check. The quote shows it is in the paper.
In the paper
“the mice in the ASD-FMT group showed increased repetitive behaviors and decreased sociability compared to the mice in the TD-FMT group.”
§ Fecal Microbiome Transplantation from Children with Autism Spectrum Disorder Modulates Tryptophan and Serotonergic Synapse Metabolism and Induces Altered Behaviors in Germ-Free Mice > RESULTS > FMT from children with ASD facilitated abnormal behaviors in GF mice.
plaincorrelational- Asserted: passes — The authors put it forward as true.
- Checkable: passes — It can be checked against evidence.
- Load-bearing: passes — The paper’s conclusions depend on it.
- Based: passes — The paper gives a reason why it holds.
It may state two separate claims as one.
A conclusion the paper draws from its own results — it cites no other source for it, so there is none to check. The quote shows it is in the paper.
In the paper
“we hypothesized that the gut microbiota from donors with ASD resulted in abnormalities in tryptophan and serotonin metabolism and altered the key proteins involved in the synthesis and transport of serotonin in mice.”
§ Fecal Microbiome Transplantation from Children with Autism Spectrum Disorder Modulates Tryptophan and Serotonergic Synapse Metabolism and Induces Altered Behaviors in Germ-Free Mice > RESULTS > FMT from ASD donors altered key proteins involved in serotonin synthesis and transport in colonized mice.
hedgeddirect- Asserted: passes — The authors put it forward as true.
- Checkable: passes — It can be checked against evidence.
- Load-bearing: passes — The paper’s conclusions depend on it.
- Based: passes — The paper gives a reason why it holds.
It may state two separate claims as one.
None of the sources cited for this claim have been checked yet.
In the paper
“compared with specific-pathogen-free (SPF) mice, germ-free (GF) mice show social communication disorders and increased anxiety behaviors, and these abnormal social behaviors are corrected after the mice are colonized with normal microbiota”
§ Fecal Microbiome Transplantation from Children with Autism Spectrum Disorder Modulates Tryptophan and Serotonergic Synapse Metabolism and Induces Altered Behaviors in Germ-Free Mice > INTRODUCTION
What the sources say
- Not checked yetcites [8] Winek K, Dirnagl U, Meisel A. 2016. The gut microbiome as therapeutic target in central nervous system diseases: implications for stroke. Neurotherapeutics 13: 762– 774. doi: 10.1007/s13311-016-0475-x. 27714645 PMC5081128 source
- Not checked yetcites [9] Crumeyrolle-Arias M, Jaglin M, Bruneau A, Vancassel S, Cardona A, Daugé V, Naudon L, Rabot S. 2014. Absence of the gut microbiota enhances anxiety-like behavior and neuroendocrine response to acute stress in rats. Psychoneuroendocrinology 42: 207– 217. doi: 10.1016/j.psyneuen.2014.01.014. 24636517
plaindirect- Asserted: passes — The authors put it forward as true.
- Checkable: passes — It can be checked against evidence.
- Load-bearing: passes — The paper’s conclusions depend on it.
- Based: passes — The paper gives a reason why it holds.
It may state two separate claims as one.
In the paper
“it has been reported that serotonin may be associated with the symptoms of ASD”
§ Fecal Microbiome Transplantation from Children with Autism Spectrum Disorder Modulates Tryptophan and Serotonergic Synapse Metabolism and Induces Altered Behaviors in Germ-Free Mice > INTRODUCTION
What the sources say
- Not checked yetcites [19] Golubeva AV, Joyce SA, Moloney G, Burokas A, Sherwin E, Arboleya S, Flynn I, Khochanskiy D, Moya-Pérez A, Peterson V, Rea K, Murphy K, Makarova O, Buravkov S, Hyland NP, Stanton C, Clarke G, Gahan CGM, Dinan TG, Cryan JF. 2017. Microbiota-related changes in bile acid & tryptophan metabolism are associated with gastrointestinal dysfunction in a mouse model of autism. EBioMedicine 24: 166– 178. doi: 10.1016/j.ebiom.2017.09.020. 28965876 PMC5652137
hedgedcorrelational- Asserted: passes — The authors put it forward as true.
- Checkable: passes — It can be checked against evidence.
- Load-bearing: passes — The paper’s conclusions depend on it.
- Based: passes — The paper gives a reason why it holds.
Probably not a substantial claim.
What the paper did — it cites no source for this, so there is none to check. The quote shows it is in the paper.
In the paper
“Except for picky eating behavior (TD, 26/60 [43.3%]; ASD, 80/120 [66.7%] [P < 0.001]), the TD children were age, gender, region, height, weight, and socioeconomic status matched with the ASD group”
§ Fecal Microbiome Transplantation from Children with Autism Spectrum Disorder Modulates Tryptophan and Serotonergic Synapse Metabolism and Induces Altered Behaviors in Germ-Free Mice > RESULTS > Tryptophan metabolism and serotonergic synapse pathways were also altered in fecal samples of children with ASD.
plaincorrelationaln = 120- Asserted: passes — The authors put it forward as true.
- Checkable: passes — It can be checked against evidence.
- Load-bearing: unclear — It is unclear whether the paper’s conclusions depend on it.
- Based: passes — The paper gives a reason why it holds.
It may state two separate claims as one.
What the paper did — it cites no source for this, so there is none to check. The quote shows it is in the paper.
In the paper
“the causal relationship between gut microbes, metabolites, and key metabolic proteins involved remains unclear.”
§ Fecal Microbiome Transplantation from Children with Autism Spectrum Disorder Modulates Tryptophan and Serotonergic Synapse Metabolism and Induces Altered Behaviors in Germ-Free Mice > DISCUSSION
plain- Asserted: passes — The authors put it forward as true.
- Checkable: passes — It can be checked against evidence.
- Load-bearing: fails — The paper’s conclusions may not depend on it.
- Based: passes — The paper gives a reason why it holds.
Probably not a substantial claim. The paper’s conclusions may not depend on it.
None of the sources cited for this claim have been checked yet.
In the paper
“Propionic acid may induce ASD-like behaviors upon intraventricular administration, and the underlying mechanism may be related to the regulation of neurotransmitters”
§ Fecal Microbiome Transplantation from Children with Autism Spectrum Disorder Modulates Tryptophan and Serotonergic Synapse Metabolism and Induces Altered Behaviors in Germ-Free Mice > DISCUSSION
What the sources say
- Not checked yetcites [42] MacFabe DF, Cain DP, Rodriguez-Capote K, Franklin AE, Hoffman JE, Boon F, Taylor AR, Kavaliers M, Ossenkopp KP. 2007. Neurobiological effects of intraventricular propionic acid in rats: possible role of short chain fatty acids on the pathogenesis and characteristics of autism spectrum disorders. Behav Brain Res 176: 149– 169. doi: 10.1016/j.bbr.2006.07.025. 16950524 source
- Not checked yetcites [43] Mitsui R, Ono S, Karaki S, Kuwahara A. 2005. Neural and non-neural mediation of propionate-induced contractile responses in the rat distal colon. Neurogastroenterol Motil 17: 585– 594. doi: 10.1111/j.1365-2982.2005.00669.x. 16078948
hedgedconditional- Asserted: passes — The authors put it forward as true.
- Checkable: passes — It can be checked against evidence.
- Load-bearing: fails — The paper’s conclusions may not depend on it.
- Based: passes — The paper gives a reason why it holds.
Probably not a substantial claim. The paper’s conclusions may not depend on it. It may state two separate claims as one.
What the paper did — it cites no source for this, so there is none to check. The quote shows it is in the paper.
In the paper
“multiple factors can affect the gut microbiome and metabolomics, and we cannot fully control the potential impacting factors.”
§ Fecal Microbiome Transplantation from Children with Autism Spectrum Disorder Modulates Tryptophan and Serotonergic Synapse Metabolism and Induces Altered Behaviors in Germ-Free Mice > DISCUSSION
plain- Asserted: passes — The authors put it forward as true.
- Checkable: fails — It may be too vague to check against evidence.
- Load-bearing: fails — The paper’s conclusions may not depend on it.
- Based: passes — The paper gives a reason why it holds.
Probably not a substantial claim. It may be too vague to check against evidence. The paper’s conclusions may not depend on it. It may state two separate claims as one.
What the paper did — it cites no source for this, so there is none to check. The quote shows it is in the paper.
In the paper
“This clinical trial was registered in the Chinese Clinical Trial Registry (registration number ChiCTR-ROC-14005442).”
§ Fecal Microbiome Transplantation from Children with Autism Spectrum Disorder Modulates Tryptophan and Serotonergic Synapse Metabolism and Induces Altered Behaviors in Germ-Free Mice > MATERIALS AND METHODS > Animals, donor selection, and FMT.
plain- Asserted: passes — The authors put it forward as true.
- Checkable: passes — It can be checked against evidence.
- Load-bearing: fails — The paper’s conclusions may not depend on it.
- Based: passes — The paper gives a reason why it holds.
Probably not a substantial claim. The paper’s conclusions may not depend on it.
What the paper did — it cites no source for this, so there is none to check. The quote shows it is in the paper.
In the paper
“They also received health examinations and were proven to be free from any signs of developmental disorders or mental illness.”
§ Fecal Microbiome Transplantation from Children with Autism Spectrum Disorder Modulates Tryptophan and Serotonergic Synapse Metabolism and Induces Altered Behaviors in Germ-Free Mice > MATERIALS AND METHODS > Subjects.
plainn = 60- Asserted: passes — The authors put it forward as true.
- Checkable: passes — It can be checked against evidence.
- Load-bearing: passes — The paper’s conclusions depend on it.
- Based: passes — The paper gives a reason why it holds.
It may state two separate claims as one.
What the paper did — it cites no source for this, so there is none to check. The quote shows it is in the paper.
In the paper
“The exclusion criteria included a history of other developmental disorders, neurological or psychiatric diseases, genetic metabolic disease, major physical illness, recent infections, and the use of medications, antibiotics, antifungals, probiotics, or prebiotics within 3 months before the sampling.”
§ Fecal Microbiome Transplantation from Children with Autism Spectrum Disorder Modulates Tryptophan and Serotonergic Synapse Metabolism and Induces Altered Behaviors in Germ-Free Mice > MATERIALS AND METHODS > Subjects.
plain- Asserted: passes — The authors put it forward as true.
- Checkable: passes — It can be checked against evidence.
- Load-bearing: passes — The paper’s conclusions depend on it.
- Based: passes — The paper gives a reason why it holds.
Probably not a substantial claim. It may state two separate claims as one.
What the paper did — it cites no source for this, so there is none to check. The quote shows it is in the paper.
In the paper
“The 2 groups of mice were raised in 2 separate, gnotobiotic environments.”
§ Fecal Microbiome Transplantation from Children with Autism Spectrum Disorder Modulates Tryptophan and Serotonergic Synapse Metabolism and Induces Altered Behaviors in Germ-Free Mice > MATERIALS AND METHODS > Animals, donor selection, and FMT.
plainn = 2- Asserted: passes — The authors put it forward as true.
- Checkable: passes — It can be checked against evidence.
- Load-bearing: passes — The paper’s conclusions depend on it.
- Based: passes — The paper gives a reason why it holds.
Probably not a substantial claim.
What the paper did — it cites no source for this, so there is none to check. The quote shows it is in the paper.
In the paper
“In addition, none of the donors had received any medications, antibiotics, antifungals, probiotics, or prebiotics in the past 3 months.”
§ Fecal Microbiome Transplantation from Children with Autism Spectrum Disorder Modulates Tryptophan and Serotonergic Synapse Metabolism and Induces Altered Behaviors in Germ-Free Mice > MATERIALS AND METHODS > Animals, donor selection, and FMT.
plainn = 10- Asserted: passes — The authors put it forward as true.
- Checkable: passes — It can be checked against evidence.
- Load-bearing: passes — The paper’s conclusions depend on it.
- Based: passes — The paper gives a reason why it holds.
Probably not a substantial claim.
What the paper did — it cites no source for this, so there is none to check. The quote shows it is in the paper.
In the paper
“Health examinations were also conducted for the TD donors to confirm that they did not have any signs of developmental disorders or psychiatric diseases.”
§ Fecal Microbiome Transplantation from Children with Autism Spectrum Disorder Modulates Tryptophan and Serotonergic Synapse Metabolism and Induces Altered Behaviors in Germ-Free Mice > MATERIALS AND METHODS > Animals, donor selection, and FMT.
plainn = 5- Asserted: passes — The authors put it forward as true.
- Checkable: passes — It can be checked against evidence.
- Load-bearing: passes — The paper’s conclusions depend on it.
- Based: passes — The paper gives a reason why it holds.
Probably not a substantial claim.
In the paper
“the number of postsynaptic 5-HT1A receptors is decreased in the brains of patients with anxiety and depression”
§ Fecal Microbiome Transplantation from Children with Autism Spectrum Disorder Modulates Tryptophan and Serotonergic Synapse Metabolism and Induces Altered Behaviors in Germ-Free Mice > DISCUSSION
What the sources say
- Not checked yetcites [50] Meunier CNJ, Chameau P, Fossier PM. 2017. Modulation of synaptic plasticity in the cortex needs to understand all the players. Front Synaptic Neurosci 9: 2. doi: 10.3389/fnsyn.2017.00002. 28203201 PMC5285384
plaincorrelational- Asserted: passes — The authors put it forward as true.
- Checkable: passes — It can be checked against evidence.
- Load-bearing: fails — The paper’s conclusions may not depend on it.
- Based: passes — The paper gives a reason why it holds.
Probably not a substantial claim. The paper’s conclusions may not depend on it.
A conclusion the paper draws from its own results — it cites no other source for it, so there is none to check. The quote shows it is in the paper.
In the paper
“In addition, ASD-related intestinal microorganisms may alter the expressions of related proteins involved in serotonin synthesis and transport in GF mice, which may be the molecular basis for the changes in tryptophan and serotonin metabolism.”
§ Fecal Microbiome Transplantation from Children with Autism Spectrum Disorder Modulates Tryptophan and Serotonergic Synapse Metabolism and Induces Altered Behaviors in Germ-Free Mice > DISCUSSION > Conclusions.
hedgedconditional- Asserted: passes — The authors put it forward as true.
- Checkable: passes — It can be checked against evidence.
- Load-bearing: passes — The paper’s conclusions depend on it.
- Based: fails — The paper may give no reason why it holds.
Probably not a substantial claim. The paper may give no reason why it holds.
- Rests on an assumption: The 5 ASD donors are representative of children with ASD.
In the paper
“High peripheral serotonin levels are associated with changes in SERTs and serotonin receptors in children with ASD”
§ Fecal Microbiome Transplantation from Children with Autism Spectrum Disorder Modulates Tryptophan and Serotonergic Synapse Metabolism and Induces Altered Behaviors in Germ-Free Mice > DISCUSSION
What the sources say
- Not checked yetcites [47] Maes M, Anderson G, Betancort Medina SR, Seo M, Ojala JO. 2019. Integrating autism spectrum disorder pathophysiology: mitochondria, vitamin A, CD38, oxytocin, serotonin and melatonergic alterations in the placenta and gut. Curr Pharm Des 25: 4405– 4420. doi: 10.2174/1381612825666191102165459. 31682209
plaincorrelational- Asserted: passes — The authors put it forward as true.
- Checkable: passes — It can be checked against evidence.
- Load-bearing: fails — The paper’s conclusions may not depend on it.
- Based: passes — The paper gives a reason why it holds.
Probably not a substantial claim. The paper’s conclusions may not depend on it.
In the paper
“alterations in SERT levels can lead to physiological dysfunction”
§ Fecal Microbiome Transplantation from Children with Autism Spectrum Disorder Modulates Tryptophan and Serotonergic Synapse Metabolism and Induces Altered Behaviors in Germ-Free Mice > DISCUSSION
What the sources say
- Not checked yetcites [49] Baganz NL, Blakely RD. 2013. A dialogue between the immune system and brain, spoken in the language of serotonin. ACS Chem Neurosci 4: 48– 63. doi: 10.1021/cn300186b. 23336044 PMC3547518
plaindirect- Asserted: passes — The authors put it forward as true.
- Checkable: passes — It can be checked against evidence.
- Load-bearing: fails — The paper’s conclusions may not depend on it.
- Based: passes — The paper gives a reason why it holds.
Probably not a substantial claim. The paper’s conclusions may not depend on it.
What the paper did — it cites no source for this, so there is none to check. The quote shows it is in the paper.
In the paper
“The diagnosis of ASD was made by a developmental pediatrician or psychologist through a series of structured interviews, according to DSM-5 criteria.”
- Also stated in: § Subjects. · plain
“ASD was diagnosed by a developmental pediatrician or psychologist through a series of structured interviews according to DSM-5 criteria.”
§ Fecal Microbiome Transplantation from Children with Autism Spectrum Disorder Modulates Tryptophan and Serotonergic Synapse Metabolism and Induces Altered Behaviors in Germ-Free Mice > MATERIALS AND METHODS > Animals, donor selection, and FMT.
plain- Asserted: passes — The authors put it forward as true.
- Checkable: passes — It can be checked against evidence.
- Load-bearing: passes — The paper’s conclusions depend on it.
- Based: passes — The paper gives a reason why it holds.
Probably not a substantial claim.
- Also stated in: § Subjects. · plain
What the paper did — it cites no source for this, so there is none to check. The quote shows it is in the paper.
In the paper
“All 10 donors were boys aged 2 to 6 years with no history of other developmental disorders, neurological or psychiatric diseases, genetic metabolic diseases, or major physical illness.”
§ Fecal Microbiome Transplantation from Children with Autism Spectrum Disorder Modulates Tryptophan and Serotonergic Synapse Metabolism and Induces Altered Behaviors in Germ-Free Mice > MATERIALS AND METHODS > Animals, donor selection, and FMT.
plainn = 10- Asserted: passes — The authors put it forward as true.
- Checkable: passes — It can be checked against evidence.
- Load-bearing: fails — The paper’s conclusions may not depend on it.
- Based: passes — The paper gives a reason why it holds.
Probably not a substantial claim. The paper’s conclusions may not depend on it. It may state two separate claims as one.
What the paper did — it cites no source for this, so there is none to check. The quote shows it is in the paper.
In the paper
“The mice could freely move through a small opening (6 by 6 cm) in each divider and were observed for 5 min in the empty box to confirm that each animal had no bias for any of the chambers.”
§ Fecal Microbiome Transplantation from Children with Autism Spectrum Disorder Modulates Tryptophan and Serotonergic Synapse Metabolism and Induces Altered Behaviors in Germ-Free Mice > MATERIALS AND METHODS > (iii) Three-chamber sociability test.
plain- Asserted: passes — The authors put it forward as true.
- Checkable: passes — It can be checked against evidence.
- Load-bearing: fails — The paper’s conclusions may not depend on it.
- Based: passes — The paper gives a reason why it holds.
Probably not a substantial claim. The paper’s conclusions may not depend on it.
What the paper did — it cites no source for this, so there is none to check. The quote shows it is in the paper.
In the paper
“GF mice aged 4 weeks were randomly divided into 2 groups: the mice in the TD-FMT group were gavaged with 200 μl of the fecal suspension obtained from the TD children, and the mice in the ASD-FMT group were gavaged with the same volume of the fecal suspension obtained from the children with ASD.”
§ Fecal Microbiome Transplantation from Children with Autism Spectrum Disorder Modulates Tryptophan and Serotonergic Synapse Metabolism and Induces Altered Behaviors in Germ-Free Mice > MATERIALS AND METHODS > Animals, donor selection, and FMT.
plainn = 2- Asserted: passes — The authors put it forward as true.
- Checkable: passes — It can be checked against evidence.
- Load-bearing: passes — The paper’s conclusions depend on it.
- Based: passes — The paper gives a reason why it holds.
Probably not a substantial claim.
In the paper
“SERTs are located on presynaptic serotonin nerve terminals as well as on axons and serotonin cell bodies in the raphe”
§ Fecal Microbiome Transplantation from Children with Autism Spectrum Disorder Modulates Tryptophan and Serotonergic Synapse Metabolism and Induces Altered Behaviors in Germ-Free Mice > DISCUSSION
What the sources say
- Not checked yetcites [48] Daws LC, Gould GG. 2011. Ontogeny and regulation of the serotonin transporter: providing insights into human disorders. Pharmacol Ther 131: 61– 79. doi: 10.1016/j.pharmthera.2011.03.013. 21447358 PMC3131109
plain- Asserted: passes — The authors put it forward as true.
- Checkable: passes — It can be checked against evidence.
- Load-bearing: fails — The paper’s conclusions may not depend on it.
- Based: passes — The paper gives a reason why it holds.
Probably not a substantial claim. The paper’s conclusions may not depend on it.
The paper relies on this without support.
The causal relationship between gut microbes and metabolites and ASD symptoms is not yet established.
“The relationship between the gut microbiota and ASD is not yet fully understood.”
“However, it is still not clear if these microbes and metabolites cause the development of ASD symptoms.”
The paper relies on this without support.
The 5 ASD donors are representative of children with ASD.
“In this study, 5 TD children and 5 ASD children were recruited, and their fecal samples were collected as donor samples.”
The paper relies on this without support.
The 5 TD donors are representative of typically developing children.
“In this study, 5 TD children and 5 ASD children were recruited, and their fecal samples were collected as donor samples.”
Claims other papers make about this one
Each is checked against this paper’s own text: does it say what the citing paper says it does?
In the citing paper
“This is further confirmed by Xiao et al. [151], who performed a similar experiment, where mice seeded with ASD microbiota presented more autistic-like behaviors.”
From Unraveling the Connections: Eating Issues, Microbiome, and Gastrointestinal Symptoms in Autism Spectrum Disorder (2025) · cites this paper as [151]
Citations
Cites
Diagnostic and Statistical Manual of Mental Disorders
American Psychiatric Association (2013) · doi:10.1176/appi.books.9780890425596 · Cited by 116,369
MUSCLE: multiple sequence alignment with high accuracy and high throughput
Edgar, R. C. (2004) · Nucleic Acids Research · doi:10.1093/nar/gkh340 · Cited by 44,662
QIIME allows analysis of high-throughput community sequencing data
Caporaso, J. G., Kuczynski, J., Stombaugh, J., Bittinger, K., Bushman, F. D., Costello, E. K., Fierer, N., Peña, A. G., Goodrich, J. K., Gordon, J. I., et al. (2010) · Nature Methods · doi:10.1038/nmeth.f.303 · Cited by 34,887
The SILVA ribosomal RNA gene database project: improved data processing and web-based tools
Quast, C., Pruesse, E., Yilmaz, P., Gerken, J., Schweer, T., Yarza, P., Peplies, J., & Glöckner, F. O. (2012) · Nucleic Acids Research · doi:10.1093/nar/gks1219 · Cited by 33,055
UPARSE: highly accurate OTU sequences from microbial amplicon reads
Edgar, R. C. (2013) · Nature Methods · doi:10.1038/nmeth.2604 · Cited by 16,770
UCHIME improves sensitivity and speed of chimera detection
Edgar, R. C., Haas, B. J., Clemente, J. C., Quince, C., & Knight, R. (2011) · Bioinformatics · doi:10.1093/bioinformatics/btr381 · Cited by 15,114
Gut microbiota regulate motor deficits and neuroinflammation in a model of Parkinson's disease
Sampson, T. R., Debelius, J. W., Thron, T., Janssen, S., Shastri, G. G., Ilhan, Z. E., Challis, C., Schretter, C. E., Rocha, S., Gradinaru, V., et al. (2016) · Cell · doi:10.1016/j.cell.2016.11.018 · Cited by 3,622
Indigenous bacteria from the gut microbiota regulate host serotonin biosynthesis
Yano, J. M., Yu, K., Donaldson, G. P., Shastri, G. G., Ann, P., Ma, L., Nagler, C. R., Ismagilov, R. F., Mazmanian, S. K., & Hsiao, E. Y. (2015) · Cell · doi:10.1016/j.cell.2015.02.047 · Cited by 3,614
Chimeric 16S rRNA sequence formation and detection in Sanger and 454-pyrosequenced PCR ampliconsPreprint
Haas, B. J., Gevers, D., Earl, A. M., Feldgarden, M., Ward, D. V., Giannoukos, G., Ciulla, D., Tabbaa, D., Highlander, S. K., Sodergren, E. J., et al. (2011) · Genome Research · doi:10.1101/gr.112730.110 · Cited by 3,527
Hsiao, E. Y., McBride, S. W., Hsien, S., Sharon, G., Hyde, E. R., McCue, T., Codelli, J. A., Chow, J., Reisman, S. E., Petrosino, J. F., et al. (2013) · Cell · doi:10.1016/j.cell.2013.11.024 · Cited by 3,283
Gut Microbiota Regulation of Tryptophan Metabolism in Health and Disease
Agus, A., Planchais, J., & Sokol, H. (2018) · Cell Host & Microbe · doi:10.1016/j.chom.2018.05.003 · Cited by 3,180 · cited 1×
“Tryptophan can also be metabolized by the gut microbiota into indole and its derivatives (34).”
BackgroundReducing the Effects of PCR Amplification and Sequencing Artifacts on 16S rRNA-Based Studies
Schloss, P. D., Gevers, D., & Westcott, S. L. (2011) · PLoS ONE · doi:10.1371/journal.pone.0027310 · Cited by 2,112
Clarke, G., Grenham, S., Scully, P., Fitzgerald, P., Moloney, R. D., Shanahan, F., Dinan, T. G., & Cryan, J. F. (2013) · Molecular Psychiatry · doi:10.1038/mp.2012.77 · Cited by 1,893
Identification, Evaluation, and Management of Children With Autism Spectrum Disorder
Hyman, S. L., Levy, S. E., Myers, S. M., COUNCIL ON CHILDREN WITH DISABILITIES, S. O. D. A. B. P., Kuo, D. Z., Apkon, S., Davidson, L. F., Ellerbeck, K. A., Foster, J. E. A., Noritz, G. H., et al. (2020) · Pediatrics · doi:10.1542/peds.2019-3447 · Cited by 1,798
The interplay between the intestinal microbiota and the brain
Collins, S. M., Surette, M., & Bercik, P. (2012) · Nature Reviews Microbiology · doi:10.1038/nrmicro2876 · Cited by 1,611 · cited 1×
“communication between the gut microbes and the brain (5, 6).”
BackgroundSynthesis of Serotonin by a Second Tryptophan Hydroxylase Isoform
Walther, D. J., Peter, J., Bashammakh, S., Hörtnagl, H., Voits, M., Fink, H., & Bäder, M. (2003) · Science · doi:10.1126/science.1078197 · Cited by 1,576
Андреевич, К. А., Boyarskikh, U. A., Kel, A. E., & Филипенко, М. Л. (2017) · Journal of Computational Biology · doi:10.1089/cmb.2017.0096 · Cited by 1,395
Kynurenines: Tryptophan’s metabolites in exercise, inflammation, and mental health
Cervenka, I., Agudelo, L. Z., & Ruas, J. L. (2017) · Science · doi:10.1126/science.aaf9794 · Cited by 1,382
Human Gut Microbiota from Autism Spectrum Disorder Promote Behavioral Symptoms in Mice
Sharon, G., Cruz, N. J., Kang, D.-W., Gandal, M. J., Wang, B., Kim, Y.-M., Zink, E. M., Casey, C. P., Taylor, B. C., Lane, C. J., et al. (2019) · Cell · doi:10.1016/j.cell.2019.05.004 · Cited by 1,182
Serotonin signalling in the gut: functions, dysfunctions and therapeutic targets
Mawe, G. M., & Hoffman, J. M. (2013) · Nature Reviews Gastroenterology & Hepatology · doi:10.1038/nrgastro.2013.105 · Cited by 1,165
The microbiome-gut-brain axis in health and disease
Dinan, T. G., & Cryan, J. F. (2017) · Gastroenterology Clinics of North America · doi:10.1016/j.gtc.2016.09.007 · Cited by 1,111
Tryptophan Metabolism: A Link Between the Gut Microbiota and Brain
Gao, K., Mu, C.-L., Farzi, A., & Zhu, W.-Y. (2020) · Advances in Nutrition · doi:10.1093/advances/nmz127 · Cited by 1,029
The neuropharmacology of butyrate: the bread and butter of the microbiota-gut-brain axis
Stilling, R. M., van de Wouw, M., Clarke, G., Stanton, C., Dinan, T. G., & Cryan, J. F. (2016) · Neurochemistry International · doi:10.1016/j.neuint.2016.06.011 · Cited by 891
De Angelis, M., Piccolo, M., Vannini, L., Siragusa, S., De Giacomo, A., Serrazzanetti, D. I., Cristofori, F., Guerzoni, M. E., Gobbetti, M., & Francavilla, R. (2013) · PLoS ONE · doi:10.1371/journal.pone.0076993 · Cited by 887
Meyer, U., Nyffeler, M., Engler, A., Urwyler, A., Schedlowski, M., Knuesel, I., Yee, B. K., & Feldon, J. (2006) · The Journal of Neuroscience · doi:10.1523/jneurosci.0099-06.2006 · Cited by 774
Long-term benefit of microbiota transfer therapy on autism symptoms and gut microbiota
Kang, D.-W., Adams, J. B., Coleman, D. M., Pollard, E. L., Maldonado, J., McDonough-Means, S., Caporaso, J. G., & Krajmalnik-Brown, R. (2019) · Scientific Reports · doi:10.1038/s41598-019-42183-0 · Cited by 749
Sun, M.-F., Zhu, Y.-L., Zhou, Z.-L., Jia, X.-B., Xu, Y.-D., Yang, Q., Cui, C., & Shen, Y.-Q. (2018) · Brain, Behavior, and Immunity · doi:10.1016/j.bbi.2018.02.005 · Cited by 736
Williams, B. B., Van Benschoten, A. H., Cimermancic, P., Donia, M. S., Zimmermann, M., Taketani, M., Ishihara, A., Kashyap, P. C., Fraser, J. S., & Fischbach, M. A. (2014) · Cell Host & Microbe · doi:10.1016/j.chom.2014.09.001 · Cited by 732
Zheng, P., Zeng, B., Liu, M., Chen, J., Pan, J., Han, Y., Liu, Y., Cheng, K., Zhou, C., Wang, H., et al. (2019) · Science Advances · doi:10.1126/sciadv.aau8317 · Cited by 704
Self-citationMalkova, N. V., Yu, C. Z., Hsiao, E. Y., Moore, M. J., & Patterson, P. H. (2012) · Brain, Behavior, and Immunity · doi:10.1016/j.bbi.2012.01.011 · Cited by 662
Short-Term Benefit From Oral Vancomycin Treatment of Regressive-Onset Autism
Sandler, R. H., Finegold, S. M., Bolte, E. R., Buchanan, C. P., Maxwell, A. P., Väisänen, M.-L., Nelson, M. N., & Wexler, H. M. (2000) · Journal of Child Neurology · doi:10.1177/088307380001500701 · Cited by 614
Crumeyrolle-Arias, M., Jaglin, M., Bruneau, A., Vancassel, S., Cardona, A., Daugé, V., Naudon, L., & Rabot, S. (2014) · Psychoneuroendocrinology · doi:10.1016/j.psyneuen.2014.01.014 · Cited by 581
MACFABE, D., CAIN, D., RODRIGUEZCAPOTE, K., FRANKLIN, A., HOFFMAN, J., BOON, F., TAYLOR, A., KAVALIERS, M., & OSSENKOPP, K. (2007) · Behavioural Brain Research · doi:10.1016/j.bbr.2006.07.025 · Cited by 497
Estaki, M., Pither, J., Baumeister, P., Little, J. P., Gill, S. K., Ghosh, S., Ahmadi-Vand, Z., Marsden, K. R., & Gibson, D. L. (2016) · Microbiome · doi:10.1186/s40168-016-0189-7 · Cited by 476
Altered gut microbiota and short chain fatty acids in Chinese children with autism spectrum disorder
Liu, S., Li, E., Sun, Z., Fu, D., Duan, G., Jiang, M., Yu, Y., Mei, L., Yang, P., Tang, Y., et al. (2019) · Scientific Reports · doi:10.1038/s41598-018-36430-z · Cited by 457
Wang, L., Christophersen, C. T., Sorich, M. J., Gerber, J. P., Angley, M. T., & Conlon, M. A. (2011) · Applied and Environmental Microbiology · doi:10.1128/aem.05212-11 · Cited by 432
Wang, L., Christophersen, C. T., Sorich, M. J., Gerber, J. P., Angley, M. T., & Conlon, M. A. (2012) · Digestive Diseases and Sciences · doi:10.1007/s10620-012-2167-7 · Cited by 412
MacFabe, D. F., Cain, N. E., Boon, F., Ossenkopp, K.-P., & Cain, D. P. (2011) · Behavioural Brain Research · doi:10.1016/j.bbr.2010.10.005 · Cited by 365
Golubeva, A. V., Joyce, S. A., Moloney, G., Burokas, A., Sherwin, E., Arboleya, S., Flynn, I., Khochanskiy, D., Moya-Pérez, A., Peterson, V., et al. (2017) · EBioMedicine · doi:10.1016/j.ebiom.2017.09.020 · Cited by 364
Dan, Z., Mao, X., Liu, Q., Guo, M., Zhuang, Y., Liu, Z., Chen, K., Chen, J., Xu, R., Tang, J., et al. (2020) · Gut Microbes · doi:10.1080/19490976.2020.1747329 · Cited by 350
Self-citationLiu, F., Li, J., Wu, F., Zheng, H., Peng, Q., & Zhou, H. (2019) · Translational Psychiatry · doi:10.1038/s41398-019-0389-6 · Cited by 336
How important is tryptophan in human health?
Kałużna-Czaplińska, J., Gątarek, P., Chirumbolo, S., Chartrand, M. S., & Bjørklund, G. (2019) · Critical Reviews in Food Science and Nutrition · doi:10.1080/10408398.2017.1357534 · Cited by 333
A Dialogue between the Immune System and Brain, Spoken in the Language of Serotonin
Baganz, N. L., & Blakely, R. (2012) · ACS Chemical Neuroscience · doi:10.1021/cn300186b · Cited by 316
Autism spectrum disorders and intestinal microbiota
De Angelis, M., Francavilla, R., Piccolo, M., De Giacomo, A., & Gobbetti, M. (2015) · Gut Microbes · doi:10.1080/19490976.2015.1035855 · Cited by 311
Xu, M., Xu, X., Li, J., & Li, F. (2019) · Frontiers in Psychiatry · doi:10.3389/fpsyt.2019.00473 · Cited by 309
Luna, R. A., Oezguen, N., Balderas, M., Venkatachalam, A., Runge, J. K., Versalovic, J., Veenstra-VanderWeele, J., Anderson, G. M., Savidge, T., & Williams, K. C. (2017) · Cellular and Molecular Gastroenterology and Hepatology · doi:10.1016/j.jcmgh.2016.11.008 · Cited by 295
Mandy, W., & Lai, M. (2016) · Journal of Child Psychology and Psychiatry · doi:10.1111/jcpp.12501 · Cited by 283
MacFabe, D. F. (2015) · Microbial Ecology in Health and Disease · doi:10.3402/mehd.v26.28177 · Cited by 263
de Theije, C. G. M., Wu, J., da Silva, S. L., Kamphuis, P. J. G. H., Garssen, J., Korte, S. M., & Kraneveld, A. D. (2011) · European Journal of Pharmacology · doi:10.1016/j.ejphar.2011.07.013 · Cited by 212
Zhang, M., Ma, W., Zhang, J., He, Y., & Wang, J. (2018) · Scientific Reports · doi:10.1038/s41598-018-32219-2 · Cited by 188
Gut hormones: emerging role in immune activation and inflammation
Khan, W. I., & Ghia, J. (2010) · Clinical & Experimental Immunology · doi:10.1111/j.1365-2249.2010.04150.x · Cited by 184
Chen, T., Kim, C. Y., Kaur, A., Lamothe, L. M., Shaikh, M. W., Keshavarzian, A., & Hamaker, B. R. (2017) · Food & Function · doi:10.1039/c6fo01532h · Cited by 139
Ontogeny and regulation of the serotonin transporter: Providing insights into human disorders
Daws, L. C., & Gould, G. G. (2011) · Pharmacology & Therapeutics · doi:10.1016/j.pharmthera.2011.03.013 · Cited by 121
Maternal immune activation, central nervous system development and behavioral phenotypes
Minakova, E., & Warner, B. B. (2018) · Birth Defects Research · doi:10.1002/bdr2.1416 · Cited by 114
The Gut Microbiome as Therapeutic Target in Central Nervous System Diseases: Implications for Stroke
Winek, K., Dirnagl, U., & Meisel, A. (2016) · Neurotherapeutics · doi:10.1007/s13311-016-0475-x · Cited by 108
Neural and non‐neural mediation of propionate‐induced contractile responses in the rat distal colon
Mitsui, R., Ono, S., Karaki, S.-I., & Kuwahara, A. (2005) · Neurogastroenterology & Motility · doi:10.1111/j.1365-2982.2005.00669.x · Cited by 105
Sanctuary, M. R., Kain, J. N., Angkustsiri, K., & German, J. B. (2018) · Frontiers in Nutrition · doi:10.3389/fnut.2018.00040 · Cited by 97
Modulation of Synaptic Plasticity in the Cortex Needs to Understand All the Players
Meunier, C. N. J., Chameau, P. J. P., & Fossier, P. (2017) · Frontiers in Synaptic Neuroscience · doi:10.3389/fnsyn.2017.00002 · Cited by 86
Xiao, L., Cui, T., Liu, S., Chen, B., Wang, Y., Yang, T., Li, T., & Chen, J. (2018) · Nutrition · doi:10.1016/j.nut.2018.06.007 · Cited by 84
Self-citationLi, Q., Chen, H., Zhang, M., Wu, T., & Liu, R. (2019) · Food & Function · doi:10.1039/c9fo01465a · Cited by 82
Cristiano, C., Lama, A., Lembo, F., Mollica, M. P., Calignano, A., & Raso, G. M. (2018) · Frontiers in Physiology · doi:10.3389/fphys.2018.00184 · Cited by 60
Liang, W., Huang, Y., Tan, X., Wu, J., Duan, J., Zhang, H., Yin, B., Li, Y., Zheng, P., Wei, H., et al. (2019) · Neuropsychiatric Disease and Treatment · doi:10.2147/ndt.s225982 · Cited by 36
Self-citationMaes, M. H. J., Anderson, G., Medina, S. R. B., Seo, M., & Ojala, J. O. (2019) · Current Pharmaceutical Design · doi:10.2174/1381612825666191102165459 · Cited by 34
Wacker, D. W., Tobin, V. A., Noack, J., Bishop, V. R., Duszkiewicz, A. J., Engelmann, M., Meddle, S., & Ludwig, M. (2010) · The Journal of Physiology · doi:10.1113/jphysiol.2010.196139 · Cited by 26
Cited by
Sorted by citations
Chen, Y., Xu, J., & Chen, Y. (2021) · Nutrients · doi:10.3390/nu13062099 · Cited by 917
Hou, H., Chen, D., Zhang, K., Zhang, W., Liu, T., Wang, S., Dai, X., Wang, B., Zhong, W., & Cao, H. (2021) · Cancer Letters · doi:10.1016/j.canlet.2021.11.027 · Cited by 274
Hou, Y., Li, J., & Ying, S. (2023) · Metabolites · doi:10.3390/metabo13111166 · Cited by 244
Gut microbiota modulates neurotransmitter and gut-brain signaling
Qu, S., Yu, Z., Zhou, Y., Wang, S., Jia, M., Chen, T., & Zhang, X. (2024) · Microbiological Research · doi:10.1016/j.micres.2024.127858 · Cited by 212
Wang, T., Chen, B., Luo, M., Xie, L., Lu, M., Lu, X., Zhang, S., Wei, L., Zhou, X., Yao, B., et al. (2023) · Microbiome · doi:10.1186/s40168-023-01656-1 · Cited by 118
Metadata
- Authors
- Xiao, L., Yan, J., Yang, T., Zhu, J., Li, T., Wei, H., & Chen, J.
- Affiliations
- Children's Hospital of Chongqing Medical University (CN)
- Army Medical University (CN)
- Corresponding author
- Wei, Hong
- Chen, Jie
- Venue
- mSystems
- Publisher
- American Society for Microbiology
- Published
- 2021-04-27
- Volume
- 6
- Issue
- 2
- ISSN
- 2379-5077 (ISSN-L)
- PMC
- PMC8547010
- OpenAlex
- W3144114196
- Semantic Scholar
- 596a405f3452caa2386fa6290c0680dabbf7a2d5
- Cited by
- 141
- References
- 64
- Citations by year
- 2026: 30 · 2025: 32 · 2024: 27 · 2023: 25 · 2022: 19 · 2021: 8
- FWCI
- 6.27
- Type
- journal article
- Language
- en
- Open access
- gold
- doi.org
- Licence
- Locations
- mSystems (publishedVersion, cc-by)
- Europe PMC (PubMed Central) (publishedVersion, other-oa)
- PubMed Central (publishedVersion, cc-by)
- PubMed (publishedVersion)
- DOAJ (DOAJ: Directory of Open Access Journals) (submittedVersion)
- DOAJ (DOAJ: Directory of Open Access Journals) (submittedVersion, cc-by-sa)
- Funders
- National Natural Science Foundation of China (81470799, 31971089, 81770526)
- Topics
- Life Sciences › Biochemistry, Genetics and Molecular Biology › Molecular Biology › Gut microbiota and health
- Life Sciences › Neuroscience › Cognitive Neuroscience › Autism Spectrum Disorder Research
- Life Sciences › Neuroscience › Biological Psychiatry › Tryptophan and brain disorders
- Keywords
- autism spectrum disorder, gut microbiota, germ-free mice, tryptophan metabolism, serotonin metabolism, microbial metabolites
About these checks
Registry, retraction, Cites and statistics results are computed, not judged, with one exception: a printed reference that no index lists is read once by a model before it counts as a citation error. Claims are extracted by a model and kept only when their quote appears verbatim in the text; each cited source is then checked, with a model’s help, for whether it says what the claim relies on. Those verdicts can be wrong — read the claim’s quote and the cited source before relying on one.
A language model drew the claims from the paper on 2026-10-06, under version 3 of the claim definition (model deepseek-v4.1-flash, prompt extract-v3).
A second model labelled each claim on 2026-10-06 (model jev-1.13-20260917, definition revision gold-guideline-v0.2).
Statistics and arithmetic are recomputed, not judged.
Confidence bands are shown only for fields calibrated on our annotated test set. None is calibrated yet, so no band is shown.
What counts as a claim ›How we measure confidence ›How we check this ›
Are you an author, or do you see a problem with this page? Request a review
