

The DOI matches its Crossref record; 31 of the 32 references it cites were found in a registry or an index.
Ranking treatments in frequentist network meta-analysis works without resampling methods
Open accessAbstract
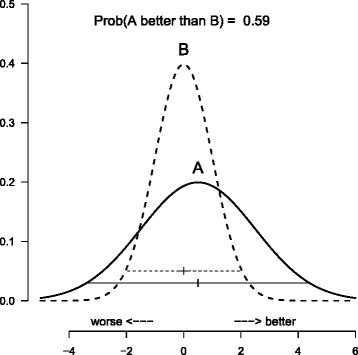
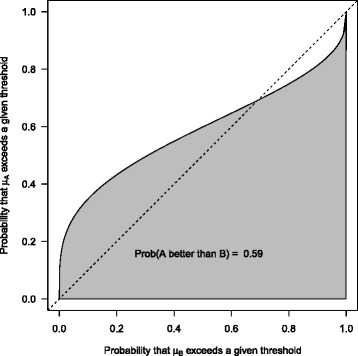
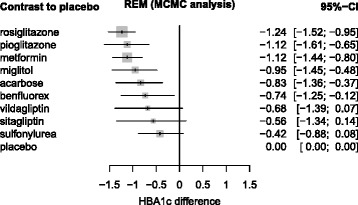
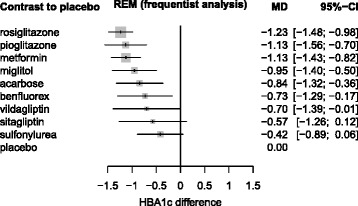
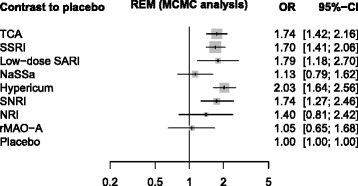
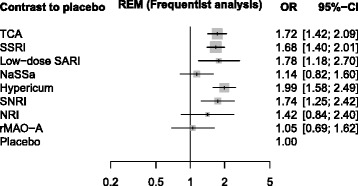
BACKGROUND: Network meta-analysis is used to compare three or more treatments for the same condition. Within a Bayesian framework, for each treatment the probability of being best, or, more general, the probability that it has a certain rank can be derived from the posterior distributions of all treatments. The treatments can then be ranked by the surface under the cumulative ranking curve (SUCRA). For comparing treatments in a network meta-analysis, we propose a frequentist analogue to SUCRA which we call P-score that works without resampling. METHODS: P-scores are based solely on the point estimates and standard errors of the frequentist network meta-analysis estimates under normality assumption and can easily be calculated as means of one-sided p-values. They measure the mean extent of certainty that a treatment is better than the competing treatments. RESULTS: Using case studies of network meta-analysis in diabetes and depression, we demonstrate that the numerical values of SUCRA and P-Score are nearly identical. CONCLUSIONS: Ranking treatments in frequentist network meta-analysis works without resampling. Like the SUCRA values, P-scores induce a ranking of all treatments that mostly follows that of the point estimates, but takes precision into account. However, neither SUCRA nor P-score offer a major advantage compared to looking at credible or confidence intervals.
Overview
The claims and statistics of this paper haven’t been checked yet.
Run the check — free, no account needed. It reads the open-access text and checks the sources it cites.
Integrity signals
Registry
Cites
Statistics
Figures
Verification
Claims the paper makes
The claims and statistics of this paper haven’t been checked yet.
Run the check — free, no account needed. It reads the open-access text and checks the sources it cites.
Claims other papers make about this one
Each is checked against this paper’s own text: does it say what the citing paper says it does?
The source backs part of the claim, not all of it — or backs it for a different population, condition or comparison.
In the citing paper
“This approach is often misleading, as it considers only the point estimate of effect and not the associated precision or certainty of evidence and ignores absolute differences between treatment alternatives.[56][57][58]”
From Management of chronic pain secondary to temporomandibular disorders: a systematic review and network meta-analysis of randomised trials (2023) · cites this paper as [57]
Experimental — accuracy not yet measured
Self-check
Percentages, sums and reported differences re-computed from the paper’s own numbers.
The self-check needs the paper’s full text.
Citations
Cites
R: A Language and Environment for Statistical Computing
R Core Team (2000) · doi:10.32614/r.manuals · Cited by 355,893
Statistical significance for genomewide studies
Storey, J. D., & Tibshirani, R. (2003) · Proceedings of the National Academy of Sciences · doi:10.1073/pnas.1530509100 · Cited by 9,692
Salanti, G., Ades, A. E., & Ioannidis, J. P. A. (2011) · Journal of Clinical Epidemiology · doi:10.1016/j.jclinepi.2010.03.016 · Cited by 3,766
Graphical tools for network meta-analysis in STATA
Chaimani, A., Higgins, J. P. T., Mavridis, D., Spyridonos, P., & Salanti, G. (2013) · PLoS ONE · doi:10.1371/journal.pone.0076654 · Cited by 2,473
Salanti, G. (2012) · Research Synthesis Methods · doi:10.1002/jrsm.1037 · Cited by 1,729
Cipriani, A., Furukawa, T. A., Salanti, G., Geddes, J. R., Higgins, J. P., Churchill, R., Watanabe, N., Nakagawa, A., Omori, I. M., McGuire, H., et al. (2009) · The Lancet · doi:10.1016/s0140-6736(09)60046-5 · Cited by 1,654
Dias, S., Sutton, A. J., Ades, A. E., & Welton, N. J. (2013) · Medical Decision Making · doi:10.1177/0272989x12458724 · Cited by 1,207
White, I. R., Barrett, J. K., Jackson, D., & Higgins, J. P. T. (2012) · Research Synthesis Methods · doi:10.1002/jrsm.1045 · Cited by 1,114
Jansen, J. P., Fleurence, R., Devine, B., Itzler, R. F., Barrett, A., Hawkins, N., Lee, K., Boersma, C., Annemans, L., & Cappelleri, J. C. (2011) · Value in Health · doi:10.1016/j.jval.2011.04.002 · Cited by 1,029
Hoaglin, D. C., Hawkins, N., Jansen, J. P., Scott, D. A., Itzler, R. F., Cappelleri, J. C., Boersma, C., Thompson, D., Larholt, K. M., Díaz, M., et al. (2011) · Value in Health · doi:10.1016/j.jval.2011.01.011 · Cited by 769
Cited by
Sorted by citations
Items 1,001–1,003 of 1,003
Hu, J., Wang, J., Zhang, H., Jiang, Y., Deng, L., Long, E., & Liu, S. (2026) · Frontiers in Cardiovascular Medicine · doi:10.3389/fcvm.2026.1758366 · Cited by 3
“The P -score is a frequentist metric that quantifies the relative ranking of treatments and serves as a direct analogue to the Bayesian Surface Under the Cumulative Ranking curve (SUCRA) (17).”
Wu, A.-X., Wang, X.-J., Zhao, C., Hu, J.-Q., Li, J.-W., Xu, Y., Li, Y., & Liu, S. (2026) · Pharmacological Research · doi:10.1016/j.phrs.2026.108178 · Cited by 1
Li, Y., Liu, X., Guo, Z., Lai, L., Bryant, R. A., Zhang, T., Song, H., Mi, T., & Ren, Z. (2025) · Stress and Health · doi:10.1002/smi.70124
Metadata
- Authors
- Rücker, G., & Schwarzer, G.
- Affiliations
- University of Freiburg (DE)
- Corresponding author
- Rücker, Gerta
- Venue
- BMC Medical Research Methodology
- Published
- 2015-07-31
- Volume
- 15
- Issue
- 1
- Pages
- 58-58
- ISSN
- 1471-2288 (ISSN-L)
- PMC
- PMC4521472
- OpenAlex
- W2111999709
- Cited by
- 1,732
- References
- 32
- Citations by year
- 2026: 249 · 2025: 253 · 2024: 267 · 2023: 229 · 2022: 226 · 2021: 191 · 2020: 148 · 2019: 76 · 2018: 52 · 2017: 32 · 2016: 8 · 2015: 1
- FWCI
- 28.58
- Type
- journal article
- Language
- en
- Open access
- gold
- doi.org
- Licence
- Locations
- BMC Medical Research Methodology (publishedVersion, other-oa)
- PubMed Central (publishedVersion, cc-by)
- PubMed (publishedVersion)
- FreiDok plus (Universitätsbibliothek Freiburg) (submittedVersion)
- Funders
- Deutsche Forschungsgemeinschaft (RU1747/1-1)
- Topics
- Social Sciences › Decision Sciences › Statistics, Probability and Uncertainty › Meta-analysis and systematic reviews
- Physical Sciences › Mathematics › Statistics and Probability › Statistical Methods in Clinical Trials
- Social Sciences › Sociology and Political Science › Delphi Technique in Research
- Keywords
- treatment ranking, P-score, surface under the cumulative ranking curve, confidence intervals, diabetes mellitus, depression
- MeSH terms
- Algorithms, Bayes Theorem, Biometry, Data Interpretation, Statistical, Humans, Review Literature as Topic, Meta-Analysis as Topic, Reproducibility of Results, Biomedical Research
About these checks
Registry, retraction, Cites and statistics results are computed, not judged, with one exception: a printed reference that no index lists is read once by a model before it counts as a citation error. Claims are extracted by a model and kept only when their quote appears verbatim in the text; each cited source is then checked, with a model’s help, for whether it says what the claim relies on. Those verdicts can be wrong — read the claim’s quote and the cited source before relying on one.
Statistics and arithmetic are recomputed, not judged.
Confidence bands are shown only for fields calibrated on our annotated test set. None is calibrated yet, so no band is shown.
What counts as a claim ›How we measure confidence ›How we check this ›
Are you an author, or do you see a problem with this page? Request a review
