

The CAFA challenge reports improved protein function prediction and new functional annotations for hundreds of genes through experimental screens
Open accessPublished version of a preprint
The DOI matches its Crossref record; 69 of the 69 references it cites were found in a registry or an index.
Abstract
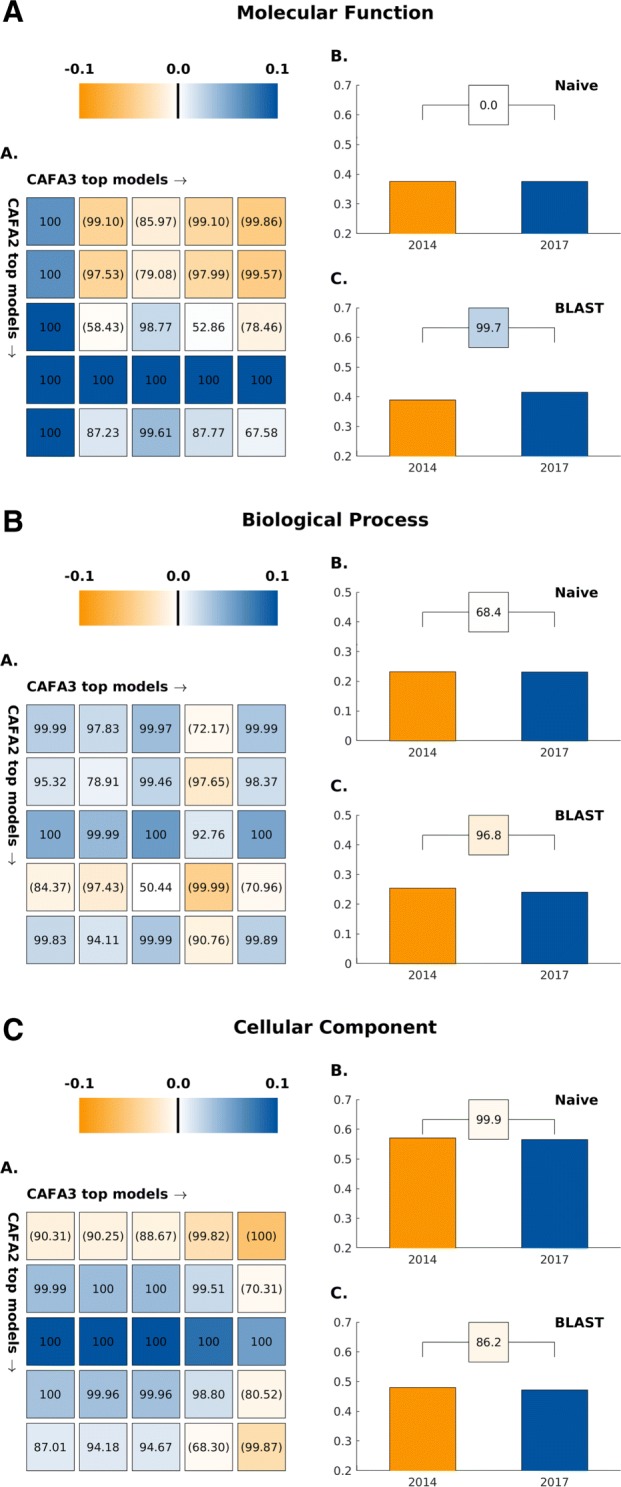
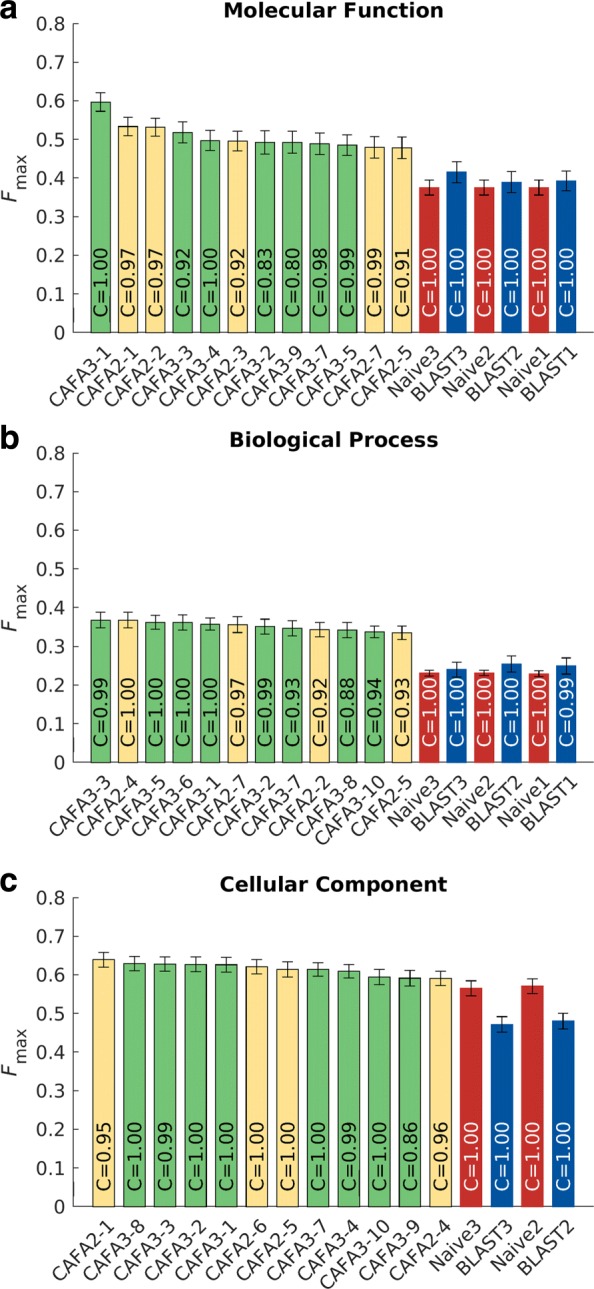
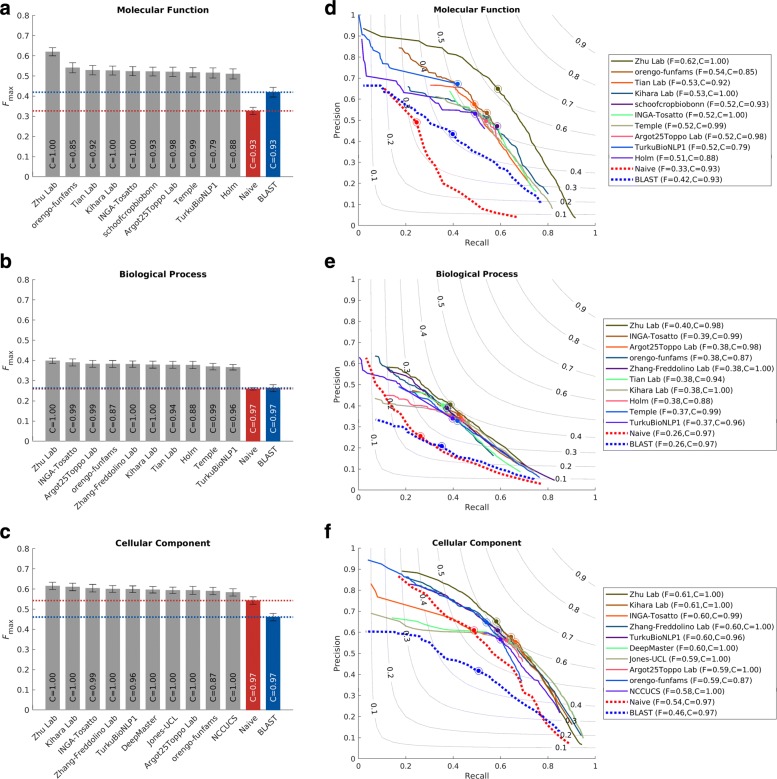
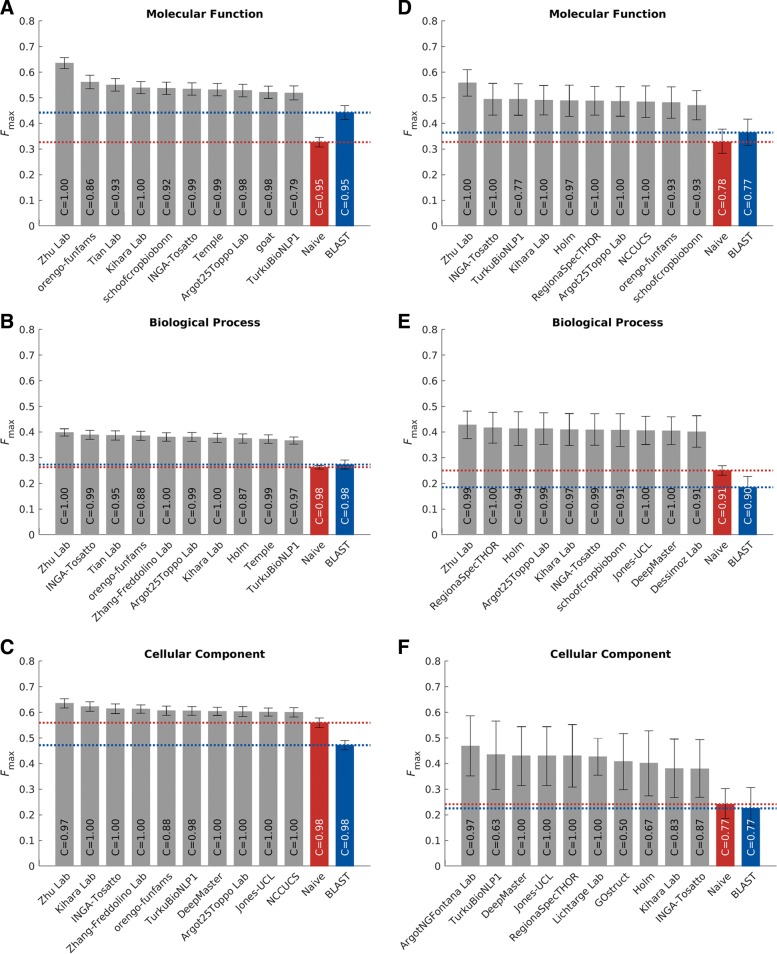
Background: The Critical Assessment of Functional Annotation (CAFA) is an ongoing, global, community-driven effort to evaluate and improve the computational annotation of protein function. Results: Here, we report on the results of the third CAFA challenge, CAFA3, that featured an expanded analysis over the previous CAFA rounds, both in terms of volume of data analyzed and the types of analysis performed. In a novel and major new development, computational predictions and assessment goals drove some of the experimental assays, resulting in new functional annotations for more than 1000 genes. Specifically, we performed experimental whole-genome mutation screening in Candida albicans and Pseudomonas aureginosa genomes, which provided us with genome-wide experimental data for genes associated with biofilm formation and motility. We further performed targeted assays on selected genes in Drosophila melanogaster , which we suspected of being involved in long-term memory. Conclusion: We conclude that while predictions of the molecular function and biological process annotations have slightly improved over time, those of the cellular component have not. Term-centric prediction of experimental annotations remains equally challenging; although the performance of the top methods is significantly better than the expectations set by baseline methods in C. albicans and D. melanogaster , it leaves considerable room and need for improvement. Finally, we report that the CAFA community now involves a broad range of participants with expertise in bioinformatics, biological experimentation, biocuration, and bio-ontologies, working together to improve functional annotation, computational function prediction, and our ability to manage big data in the era of large experimental screens.
Overview
The claims and statistics of this paper haven’t been checked yet.
Free: it reads the open-access text and checks the first 5 claims that cite a source we can check. Create a free account to check every claim.
Integrity signals
Registry
Cites
Statistics
Figures





Verification
Claims the paper makes
The claims and statistics of this paper haven’t been checked yet.
Free: it reads the open-access text and checks the first 5 claims that cite a source we can check. Create a free account to check every claim.
Claims other papers make about this one
Each is checked against this paper’s own text: does it say what the citing paper says it does?
The check wasn’t confident either way, so it gives no verdict — never disputed.
In the citing paper
“This pipeline has been shown to accurately assign functions for many proteins in microbes22 and in humans25 and is among the top predictors in the most recent Critical Assessment of Function Annotation round 3 (CAFA3) and CAFA PI competitions.26”
From Functions of Essential Genes and a Scale-Free Protein Interaction Network Revealed by Structure-Based Function and Interaction Prediction for a Minimal Genome (2021) · cites this paper as [26]
Experimental — accuracy not yet measured
Self-check
Percentages, sums and reported differences re-computed from the paper’s own numbers.
The self-check needs the paper’s full text.
Citations
Cites
Gapped BLAST and PSI-BLAST: a new generation of protein database search programs
Altschul, S. (1997) · Nucleic Acids Research · doi:10.1093/nar/25.17.3389 · Cited by 73,302
Gene Ontology: tool for the unification of biology
Ashburner, M., Ball, C. A., Blake, J. A., Botstein, D., Butler, H., Cherry, J. M., Davis, A. P., Dolinski, K., Dwight, S. S., Eppig, J. T., et al. (2000) · Nature Genetics · doi:10.1038/75556 · Cited by 43,206
STRING v10: protein–protein interaction networks, integrated over the tree of life
Szklarczyk, D., Franceschini, A., Wyder, S., Forslund, K., Heller, D., Huerta-Cepas, J., Simonovic, M., Roth, A., Santos, A., Tsafou, K. P., et al. (2015) · Nucleic Acids Research · doi:10.1093/nar/gku1003 · Cited by 10,436
UniProt: the Universal Protein knowledgebase
Apweiler, R. (2004) · Nucleic Acids Research · doi:10.1093/nar/gkh131 · Cited by 7,498
Mass spectrometry-based proteomics
Aebersold, R., & Mann, M. (2003) · Nature · doi:10.1038/nature01511 · Cited by 6,955
UniProt: the universal protein knowledgebase
The UniProt Consortium (2017) · Nucleic Acids Research · doi:10.1093/nar/gkw1099 · Cited by 4,436
Coming of age: ten years of next-generation sequencing technologies
Goodwin, S., McPherson, J. D., & McCombie, W. R. (2016) · Nature Reviews Genetics · doi:10.1038/nrg.2016.49 · Cited by 4,352
Assigning protein functions by comparative genome analysis: Protein phylogenetic profiles
Pellegrini, M., Marcotte, E. M., Thompson, M. J., Eisenberg, D., & Yeates, T. O. (1999) · Proceedings of the National Academy of Sciences · doi:10.1073/pnas.96.8.4285 · Cited by 1,585
Network‐based prediction of protein function
Sharan, R., Ulitsky, I., & Shamir, R. (2007) · Molecular Systems Biology · doi:10.1038/msb4100129 · Cited by 1,074
Mostafavi, S., Ray, D., Warde-Farley, D., Grouios, C., & Morris, Q. (2008) · Genome Biology · doi:10.1186/gb-2008-9-s1-s4 · Cited by 1,055
Cited by
Highly accurate protein structure prediction for the human proteome
Tunyasuvunakool, K., Adler, J., Wu, Z., Green, T., Zielinski, M., Žídek, A., Bridgland, A., Cowie, A., Meyer, C., Laydon, A., et al. (2021) · Nature · doi:10.1038/s41586-021-03828-1 · Cited by 3,025
A guide to machine learning for biologists
Greener, J. G., Kandathil, S. M., Moffat, L., & Jones, D. T. (2022) · Nature Reviews Molecular Cell Biology · doi:10.1038/s41580-021-00407-0 · Cited by 2,127
Self-citationStructure-based protein function prediction using graph convolutional networks
Gligorijević, V., Renfrew, P. D., Kosciolek, T., Leman, J. K., Berenberg, D., Vatanen, T., Chandler, C., Taylor, B. C., Fisk, I. M., Vlamakis, H., et al. (2021) · Nature Communications · doi:10.1038/s41467-021-23303-9 · Cited by 906
Self-citationDeep Learning for ECG Analysis: Benchmarks and Insights from PTB-XL
Strodthoff, N., Wagner, P., Schaeffter, T., & Samek, W. (2021) · IEEE Journal of Biomedical and Health Informatics · doi:10.1109/jbhi.2020.3022989 · Cited by 491
“For the selection of sample-centric metrics, we follow the evaluation procedures over the course of todate three CAFA classification challenges [37].”
MethodCATH: increased structural coverage of functional space
Sillitoe, I., Bordin, N., Dawson, N., Waman, V. P., Ashford, P., Scholes, H. M., Pang, C. S. M., Woodridge, L., Rauer, C., Sen, N., et al. (2021) · Nucleic Acids Research · doi:10.1093/nar/gkaa1079 · Cited by 509
“Function prediction pipelines developed using FunFams are consistently ranked among the top performers for Molecular Function and Biological Process Gene Ontology terms in the Critical Assessment of Functional Annotation competition (CAFA) (12,13).”
MethodSelf-citation
Metadata
- Authors
- Zhou, N., Jiang, Y., Bergquist, T. R., Lee, A. J., Kacsoh, B. Z., Crocker, A. W., Lewis, K. A., Georghiou, G., Nguyen, H. N., Hamid, M. N., Davis, L., Dogan, T., Atalay, V., Rifaioglu, A. S., Dalkıran, A., Cetin Atalay, R., Zhang, C., Hurto, R. L., Freddolino, P. L., Zhang, Y., Bhat, P., Supek, F., Fernández, J. M., Gemovic, B., Perovic, V. R., Davidović, R. S., Sumonja, N., Veljkovic, N., Asgari, E., Mofrad, M. R. K., Profiti, G., Savojardo, C., Martelli, P. L., Casadio, R., Boecker, F., Schoof, H., Kahanda, I., Thurlby, N., McHardy, A. C., Renaux, A., Saidi, R., Gough, J., Freitas, A. A., Antczak, M., Fabris, F., Wass, M. N., Hou, J., Cheng, J., Wang, Z., Romero, A. E., Paccanaro, A., Yang, H., Goldberg, T., Zhao, C., Holm, L., Törönen, P., Medlar, A. J., Zosa, E., Borukhov, I., Novikov, I., Wilkins, A., Lichtarge, O., Chi, P.-H., Tseng, W.-C., Linial, M., Rose, P. W., Dessimoz, C., Vidulin, V., Dzeroski, S., Sillitoe, I., Das, S., Lees, J. G., Jones, D. T., Wan, C., Cozzetto, D., Fa, R., Torres, M., Warwick Vesztrocy, A., Rodriguez, J. M., Tress, M. L., Frasca, M., Notaro, M., Grossi, G., Petrini, A., Re, M., Valentini, G., Mesiti, M., Roche, D. B., Reeb, J., Ritchie, D. W., Aridhi, S., Alborzi, S. Z., Devignes, M.-D., Koo, D. C. E., Bonneau, R., Gligorijević, V., Barot, M., Fang, H., Toppo, S., Lavezzo, E., Falda, M., Berselli, M., Tosatto, S. C. E., Carraro, M., Piovesan, D., Ur Rehman, H., Mao, Q., Zhang, S., Vucetic, S., Black, G. S., Jo, D., Suh, E., Dayton, J. B., Larsen, D. J., Omdahl, A. R., McGuffin, L. J., Brackenridge, D. A., Babbitt, P. C., Yunes, J. M., Fontana, P., Zhang, F., Zhu, S., You, R., Zhang, Z., Dai, S., Yao, S., Tian, W., Cao, R., Chandler, C., Amezola, M., Johnson, D., Chang, J.-M., Liao, W.-H., Liu, Y.-W., Pascarelli, S., Frank, Y., Hoehndorf, R., Kulmanov, M., Boudellioua, I., Politano, G., Di Carlo, S., Benso, A., Hakala, K., Ginter, F., Mehryary, F., Kaewphan, S., Björne, J., Moen, H., Tolvanen, M. E. E., Salakoski, T., Kihara, D., Jain, A., Šmuc, T., Altenhoff, A., Ben-Hur, A., Rost, B., Brenner, S. E., Orengo, C. A., Jeffery, C. J., Bosco, G., Hogan, D. A., Martin, M. J., O’Donovan, C., Mooney, S. D., Greene, C. S., Radivojac, P., & Friedberg, I.
- Affiliations
- Iowa State University (US)
- Indiana University Bloomington (US)
- University of Washington (US)
- University of Pennsylvania (US)
- Dartmouth College (US)
- European Bioinformatics Institute (GB)
- Middle East Technical University (TR)
- University of Michigan (US)
- Institució Catalana de Recerca i Estudis Avançats (ES)
- Barcelona Supercomputing Center (ES)
- University of Belgrade (RS)
- Helmholtz Centre for Infection Research (DE)
- University of California, Berkeley (US)
- National Research Council (IT)
- University of Bologna (IT)
- University of Bonn (DE)
- Montana State University (US)
- University of Bristol (GB)
- Université Libre de Bruxelles (BE)
- MRC Laboratory of Molecular Biology (GB)
- University of Kent (GB)
- University of Missouri (US)
- University of Miami (US)
- Royal Holloway University of London (GB)
- Ollscoil na Gaillimhe – University of Galway (IE)
- Technical University of Munich (DE)
- University of Southern Mississippi (US)
- University of Helsinki (FI)
- Compugen (Israel) (IL)
- Baylor College of Medicine (US)
- National Tsing Hua University (TW)
- San Diego Supercomputer Center (US)
- SIB Swiss Institute of Bioinformatics (CH)
- Jožef Stefan Institute (SI)
- University College London (GB)
- Oxford Brookes University (GB)
- The Francis Crick Institute (GB)
- Spanish National Cancer Research Centre (ES)
- University of Milan (IT)
- Centre National de la Recherche Scientifique (FR)
- New York University (US)
- Flatiron Institute (US)
- Simons Foundation (US)
- Centre for Human Genetics (GB)
- University of Padua (IT)
- University of California, Riverside (US)
- Temple University (US)
- Brigham Young University (US)
- University of Reading (GB)
- University of California, San Francisco (US)
- Fondazione Edmund Mach (IT)
- Fudan University (CN)
- Cincinnati Children's Hospital Medical Center (US)
- Pacific Lutheran University (US)
- National Chengchi University (TW)
- Okinawa Institute of Science and Technology Graduate University (JP)
- Tel Aviv University (IL)
- King Abdullah University of Science and Technology (SA)
- Politecnico di Torino (IT)
- University of Turku (FI)
- Purdue University West Lafayette (US)
- Ruđer Bošković Institute (HR)
- University of Illinois Chicago (US)
- Alex's Lemonade Stand Foundation (US)
- Corresponding author
- Friedberg, Iddo
- ORCID
- Jiang, Yuxiang
- Bergquist, Timothy R.
- Kacsoh, Balint Z.
- Crocker, Alex W.
- Lewis, Kimberley A.
- Georghiou, George
- Hamid, Md Nafiz
- Atalay, Volkan
- Dalkıran, Alperen
- Zhang, Chengxin
- Zhang, Yang
- Supek, Fran
- Fernández, José M.
- Davidović, Radoslav S.
- Asgari, Ehsaneddin
- Mofrad, Mohammad R.K.
- Profiti, Giuseppe
- Savojardo, Castrense
- Martelli, Pier Luigi
- Casadio, Rita
- Boecker, Florian
- Schoof, Heiko
- Kahanda, Indika
- McHardy, Alice C.
- Renaux, Alexandre
- Saidi, Rabie
- Gough, Julian
- Freitas, Alex A.
- Antczak, Magdalena
- Wass, Mark N.
- Hou, Jie
- Cheng, Jianlin
- Wang, Zheng
- Romero, Alfonso E.
- Paccanaro, Alberto
- Yang, Haixuan
- Zhao, Chenguang
- Holm, Liisa
- Törönen, Petri
- Medlar, Alan J.
- Zosa, Elaine
- Borukhov, Itamar
- Novikov, Ilya
- Lichtarge, Olivier
- Chi, Po-Han
- Rose, Peter W.
- Dessimoz, Christophe
- Vidulin, Vedrana
- Sillitoe, Ian
- Das, Sayoni
- Lees, Jonathan Gill
- Jones, David T.
- Wan, Cen
- Cozzetto, Domenico
- Fa, Rui
- Torres, Mateo
- Tress, Michael L.
- Frasca, Marco
- Notaro, Marco
- Grossi, Giuliano
- Petrini, Alessandro
- Valentini, Giorgio
- Mesiti, Marco
- Roche, Daniel B.
- Reeb, Jonas
- Ritchie, David W.
- Aridhi, Sabeur
- Devignes, Marie-Dominique
- Koo, Da Chen Emily
- Bonneau, Richard
- Gligorijević, Vladimir
- Barot, Meet
- Fang, Hai
- Toppo, Stefano
- Lavezzo, Enrico
- Falda, Marco
- Berselli, Michele
- Tosatto, Silvio C.E.
- Carraro, Marco
- Piovesan, Damiano
- Zhang, Shanshan
- Jo, Dane
- Suh, Erica
- Omdahl, Ashton R.
- McGuffin, Liam J.
- Babbitt, Patricia C.
- Yunes, Jeffrey M.
- Fontana, Paolo
- Zhang, Feng
- Zhu, Shanfeng
- You, Ronghui
- Zhang, Zihan
- Tian, Weidong
- Cao, Renzhi
- Chang, Jia-Ming
- Liao, Wen-Hung
- Pascarelli, Stefano
- Hoehndorf, Robert
- Kulmanov, Maxat
- Politano, Gianfranco
- Benso, Alfredo
- Hakala, Kai
- Ginter, Filip
- Mehryary, Farrokh
- Kaewphan, Suwisa
- Björne, Jari
- Moen, Hans
- Tolvanen, Martti E.E.
- Kihara, Daisuke
- Jain, Aashish
- Šmuc, Tomislav
- Altenhoff, Adrian
- Rost, Burkhard
- Brenner, Steven E.
- Orengo, Christine A.
- Jeffery, Constance J.
- Bosco, Giovanni
- Hogan, Deborah A.
- Martin, Maria J.
- O’Donovan, Claire
- Mooney, Sean D.
- Greene, Casey S.
- Friedberg, Iddo
- Venue
- Genome Biology
- Published
- 2019-11-19
- Volume
- 20
- Issue
- 1
- Pages
- 244-244
- ISSN
- 1465-6906 (ISSN-L)
- 1474-760X
- PMC
- PMC6864930
- OpenAlex
- W2989608901
- Cited by
- 452
- References
- 68
- Citations by year
- 2026: 50 · 2025: 71 · 2024: 73 · 2023: 61 · 2022: 66 · 2021: 75 · 2020: 42 · 2019: 13
- FWCI
- 16.21
- Type
- journal article
- Language
- en
- Open access
- gold
- doi.org
- Licence
- cc-by
- creativecommons.org/licenses/by/4.0 (tdm)
- creativecommons.org/licenses/by/4.0 (vor)
- Locations
- Genome biology (publishedVersion, cc-by)
- PubMed Central (publishedVersion, cc-by)
- PubMed (publishedVersion)
- SERVAL (Université de Lausanne) (publishedVersion, cc-by)
- CentAUR (University of Reading) (acceptedVersion, public-domain)
- Kent Academic Repository (University of Kent) (acceptedVersion, public-domain)
- Edinburgh Research Explorer (University of Edinburgh) (acceptedVersion, public-domain)
- Deep Blue (University of Michigan) (submittedVersion, public-domain)
- PORTO@Iris (submittedVersion, cc-by)
- IRIS (submittedVersion, cc-by)
- CINECA IRIS Institutional Research Information System (Fondazione Edmund Mach) (submittedVersion, cc-by)
- UTUPub (University of Turku) (submittedVersion, cc-by)
- Padua Research Archive (University of Padova) (submittedVersion, cc-by)
- UTUPub (University of Turku) (submittedVersion, public-domain)
- HAL (submittedVersion)
- Archivio Istituzionale della Ricerca (Universita Degli Studi Di Milano) (submittedVersion, cc-by)
- Archivio istituzionale della ricerca (Alma Mater Studiorum Università di Bologna) (submittedVersion, cc-by)
- DOAJ (DOAJ: Directory of Open Access Journals) (submittedVersion, cc-by-sa)
- eScholarship (California Digital Library) (submittedVersion, cc-by)
- Työväentutkimus Vuosikirja (submittedVersion)
- OpenMETU (Middle East Technical University) (submittedVersion, cc-by-nc-nd)
- mediaTUM (Technical University of Munich) (submittedVersion, other-oa)
- HZI (Helmholtz Centre for Infection Research) (submittedVersion, cc-by-nc-sa)
- King Abdullah University of Science and Technology Repository (King Abdullah University of Science and Technology) (submittedVersion, cc-by)
- King Abdullah University of Science and Technology Repository (King Abdullah University of Science and Technology) (submittedVersion, other-oa)
- Bristol Research (University of Bristol) (submittedVersion, cc-by)
- VinaR (Institute of Nuclear Sciences "Vinča") (submittedVersion, cc-by)
- VUBIR (Vrije Universiteit Brussel) (submittedVersion)
- Repository for Publications and Research Data (ETH Zurich) (submittedVersion, cc-by)
- ETH Zürich Research Collection (cc-by)
- Funders
- National Science Foundation (DBI 1458359)
- Topics
- Life Sciences › Biochemistry, Genetics and Molecular Biology › Molecular Biology › Bioinformatics and Genomic Networks
- Life Sciences › Biochemistry, Genetics and Molecular Biology › Molecular Biology › Genomics and Phylogenetic Studies
- Health Sciences › Medicine › Health Informatics › Biomedical Text Mining and Ontologies
- Keywords
- protein function prediction, functional annotation, Candida albicans, biofilm formation, bacterial motility, Drosophila melanogaster, long-term memory, biological process annotation
- MeSH terms
- Animals, Candida albicans, Drosophila melanogaster, Humans, Locomotion, Pseudomonas aeruginosa, Genome, Bacterial, Genome, Fungal, Biofilms, Memory, Long-Term, Molecular Sequence Annotation
About these checks
Registry, retraction, Cites and statistics results are computed, not judged, with one exception: a printed reference that no index lists is read once by a model before it counts as a citation error. Claims are extracted by a model and kept only when their quote appears verbatim in the text; each cited source is then checked, with a model’s help, for whether it says what the claim relies on. Those verdicts can be wrong — read the claim’s quote and the cited source before relying on one.
Statistics and arithmetic are recomputed, not judged.
Confidence bands are shown only for fields calibrated on our annotated test set. None is calibrated yet, so no band is shown.
What counts as a claim ›How we measure confidence ›How we check this ›
Are you an author, or do you see a problem with this page? Request a review
How to cite
Cite CoChat for the checks on this page, and the paper for its own findings.
- This page
- CoChat. (2026). Citation check: The CAFA challenge reports improved protein function prediction and new functional annotations for hundreds of genes through experimental screens. https://app.cochat.ai/papers/10.1186/s13059-019-1835-8
- The paper
- Zhou, N., Jiang, Y., Bergquist, T. R., Lee, A. J., Kacsoh, B. Z., Crocker, A. W., Lewis, K. A., Georghiou, G., Nguyen, H. N., Hamid, M. N., Davis, L., Dogan, T., Atalay, V., Rifaioglu, A. S., Dalkıran, A., Cetin Atalay, R., Zhang, C., Hurto, R. L., Freddolino, P. L., . . . Friedberg, I. (2019). The CAFA challenge reports improved protein function prediction and new functional annotations for hundreds of genes through experimental screens. Genome Biology. https://doi.org/10.1186/s13059-019-1835-8
Data sources
Bibliographic data: Semantic Scholar, OpenAlex, Crossref.
Contains information from the Semantic Scholar Academic Graph Datasets, made available under the ODC Attribution License (ODC-BY 1.0).
Semantic Scholar’s data is described in: Kinney, R., et al. (2023). The Semantic Scholar Open Data Platform. arXiv:2301.10140.
