

The DOI matches its Crossref record; 6 of the 6 references it cites were found in a registry or an index.
Critical role of deadenylation in regulating poly(A) rhythms and circadian gene expression
Open accessPublished version of a preprint
Abstract
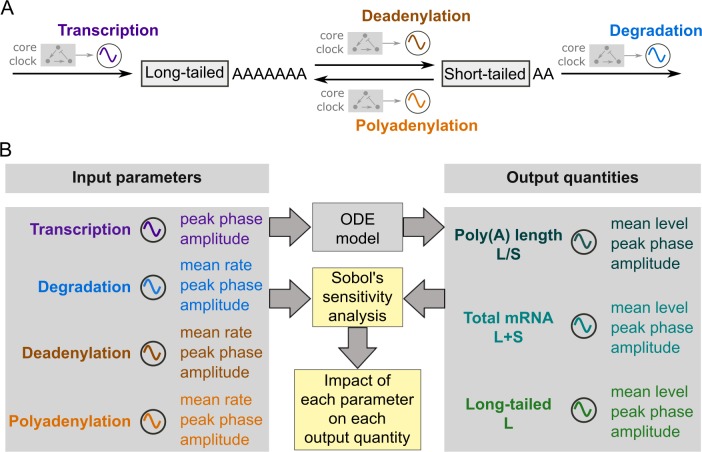
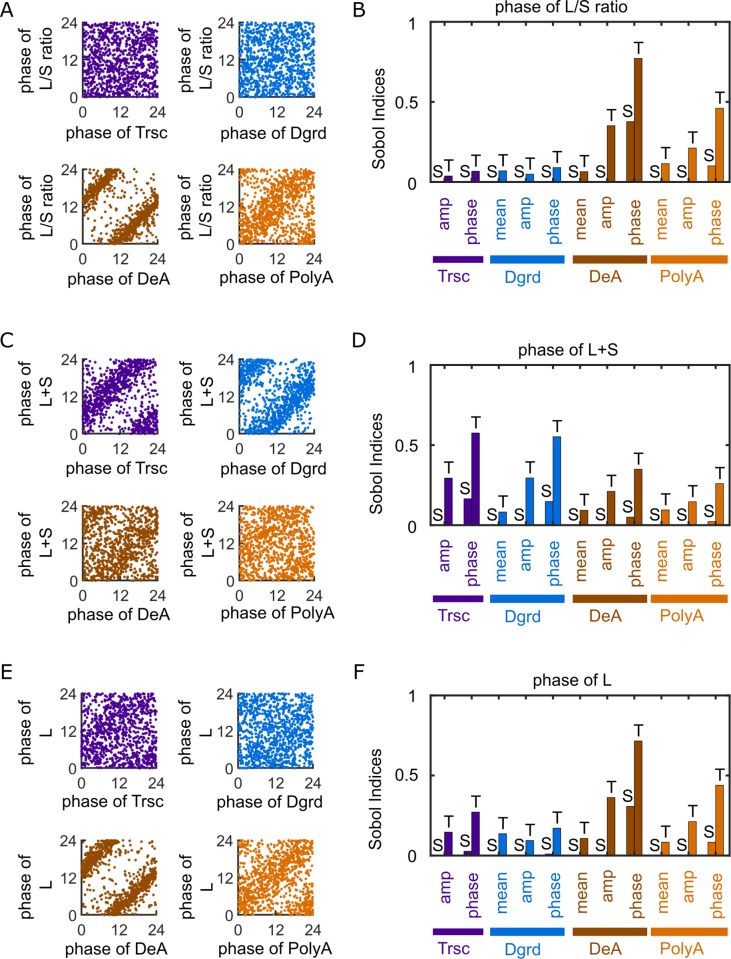
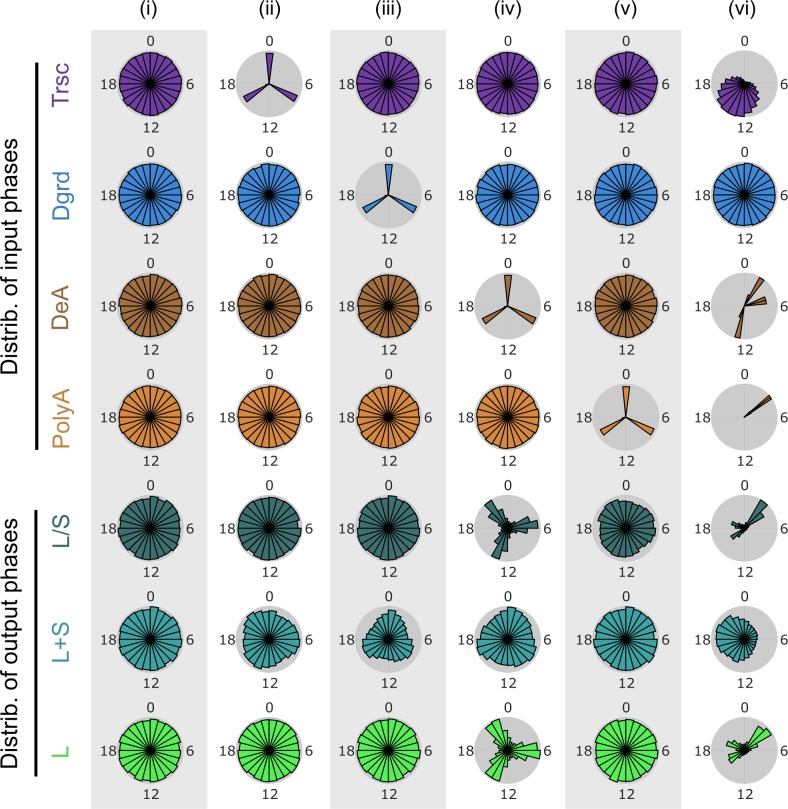
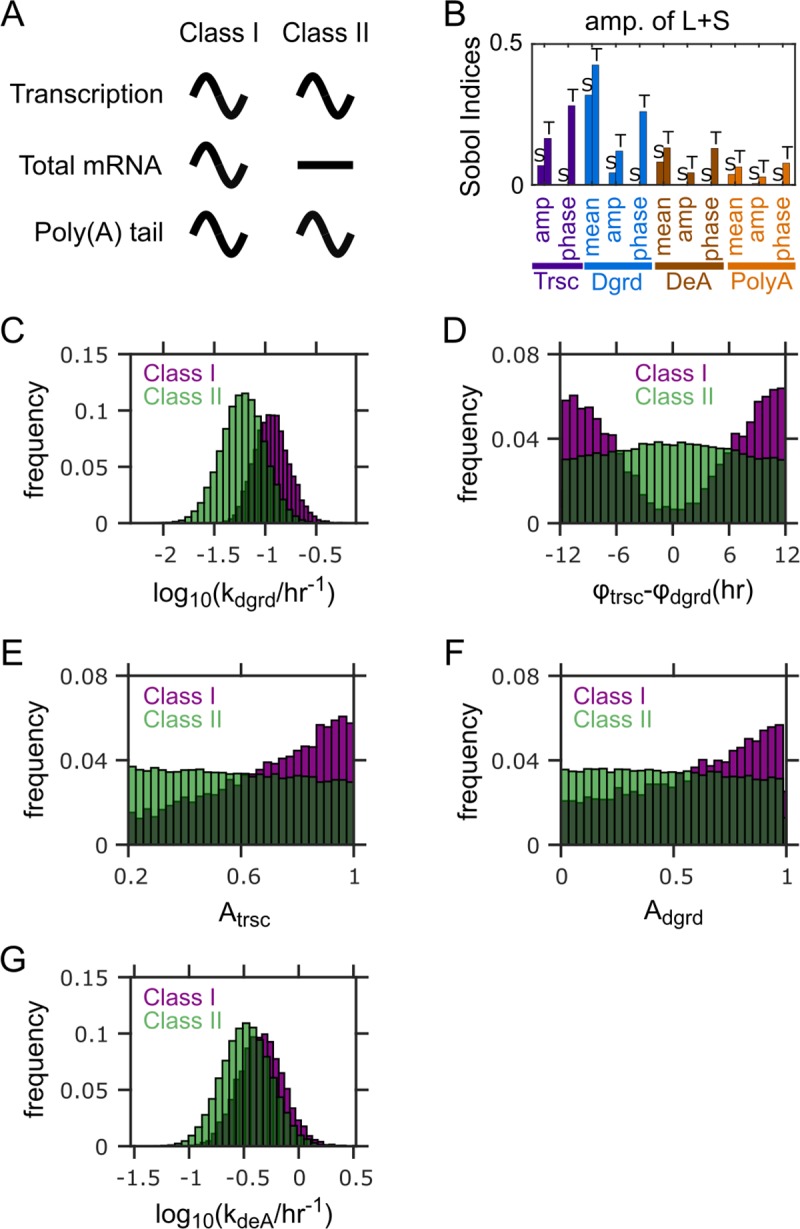
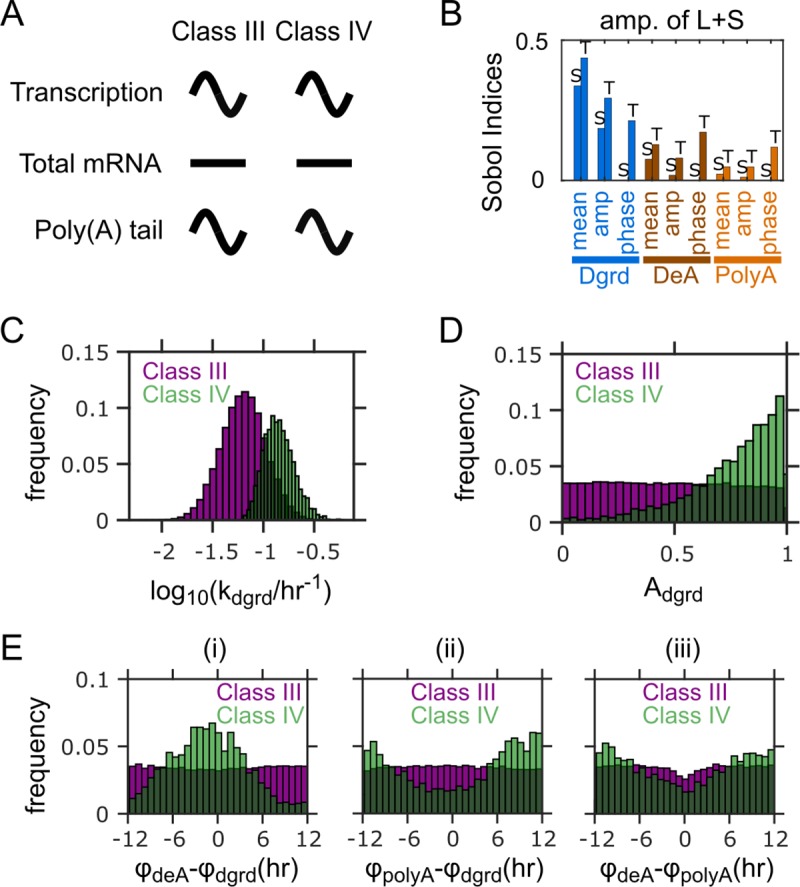
The mammalian circadian clock is deeply rooted in rhythmic regulation of gene expression. Rhythmic transcriptional control mediated by the circadian transcription factors is thought to be the main driver of mammalian circadian gene expression. However, mounting evidence has demonstrated the importance of rhythmic post-transcriptional controls, and it remains unclear how the transcriptional and post-transcriptional mechanisms collectively control rhythmic gene expression. In mouse liver, hundreds of genes were found to exhibit rhythmicity in poly(A) tail length, and the poly(A) rhythms are strongly correlated with the protein expression rhythms. To understand the role of rhythmic poly(A) regulation in circadian gene expression, we constructed a parsimonious model that depicts rhythmic control imposed upon basic mRNA expression and poly(A) regulation processes, including transcription, deadenylation, polyadenylation, and degradation. The model results reveal the rhythmicity in deadenylation as the strongest contributor to the rhythmicity in poly(A) tail length and the rhythmicity in the abundance of the mRNA subpopulation with long poly(A) tails (a rough proxy for mRNA translatability). In line with this finding, the model further shows that the experimentally observed distinct peak phases in the expression of deadenylases, regardless of other rhythmic controls, can robustly cluster the rhythmic mRNAs by their peak phases in poly(A) tail length and abundance of the long-tailed subpopulation. This provides a potential mechanism to synchronize the phases of target gene expression regulated by the same deadenylases. Our findings highlight the critical role of rhythmic deadenylation in regulating poly(A) rhythms and circadian gene expression.
Overview
The claims and statistics of this paper haven’t been checked yet.
Run the check — free, no account needed. It reads the open-access text and checks the sources it cites.
Integrity signals
Registry
Cites
Statistics
Figures
Verification
Claims the paper makes
The claims and statistics of this paper haven’t been checked yet.
Run the check — free, no account needed. It reads the open-access text and checks the sources it cites.
Self-check
Percentages, sums and reported differences re-computed from the paper’s own numbers.
The self-check needs the paper’s full text.
Citations
Cites
Global quantification of mammalian gene expression control
Schwanhäusser, B., Busse, D., Li, N., Dittmar, G., Schuchhardt, J., Wolf, J., Chen, W., & Selbach, M. (2011) · Nature · doi:10.1038/nature10098 · Cited by 6,566 · cited 1×
“23(2)) (Log-normal) Fitting with half-life distribution measured in [56]”
BackgroundTranscriptional architecture and chromatin landscape of the core circadian clock in mammals
Koike, N., Yoo, S.-H., Huang, H.-C., Kumar, V., Lee, C., Kim, T.-K., & Takahashi, J. S. (2012) · Science · doi:10.1126/science.1226339 · Cited by 1,464
Kornmann, B., Schaad, O., Bujard, H., Takahashi, J. S., & Schibler, U. (2007) · PLoS Biology · doi:10.1371/journal.pbio.0050034 · Cited by 658
Regulation of cytoplasmic mRNA decay
Schoenberg, D. R., & Maquat, L. E. (2012) · Nature Reviews Genetics · doi:10.1038/nrg3160 · Cited by 656
Clocks not winding down: unravelling circadian networks
Zhang, E. E., & Kay, S. A. (2010) · Nature Reviews Molecular Cell Biology · doi:10.1038/nrm2995 · Cited by 446
Widespread use of poly(A) tail length control to accentuate expression of the yeast transcriptome
Beilharz, T. H., & Preiss, T. (2007) · RNA · doi:10.1261/rna.569407 · Cited by 144
Research works printed but not linked: 68
- JA Mohawk, 2012, Central and peripheral circadian clocks in mammals, Annu Rev Neurosci, 35, 445, 10.1146/annurev-neuro-060909-153128 · DOI · Paper page
- JS Takahashi, 2008, The genetics of mammalian circadian order and disorder: implications for physiology and disease, Nat Rev Genet, 9, 764, 10.1038/nrg2430 · DOI · Paper page
- GE Duffield, 2003, DNA microarray analyses of circadian timing: the genomic basis of biological time, J Neuroendocrinol, 15, 991, 10.1046/j.1365-2826.2003.01082.x · DOI · Paper page
- S Kojima, 2015, Circadian genomics reveal a role for post-transcriptional regulation in mammals, Biochemistry, 54, 124, 10.1021/bi500707c · DOI
- R Zhang, 2014, A circadian gene expression atlas in mammals: Implications for biology and medicine, Proceedings of the National Academy of Sciences of the United States of America, 111, 16219, 10.1073/pnas.1408886111 · DOI · Paper page
- JS Takahashi, 2015, Molecular components of the circadian clock in mammals, Diabetes Obes Metab, 17, 6, 10.1111/dom.12514 · DOI · Paper page
- CL Partch, 2014, Molecular architecture of the mammalian circadian clock, Trends Cell Biol, 24, 90, 10.1016/j.tcb.2013.07.002 · DOI · Paper page
- HR Ueda, 2005, System-level identification of transcriptional circuits underlying mammalian circadian clocks, Nat Genet, 37, 187, 10.1038/ng1504 · DOI
- S Kojima, 2011, Post-transcriptional control of circadian rhythms, J Cell Sci, 124, 311, 10.1242/jcs.065771 · DOI
- A Hirano, 2016, The intricate dance of post-translational modifications in the rhythm of life, Nat Struct Mol Biol, 23, 1053, 10.1038/nsmb.3326 · DOI
- C Gobet, 2017, Ribosome profiling and dynamic regulation of translation in mammals, Curr Opin Genet Dev, 43, 120, 10.1016/j.gde.2017.03.005 · DOI
- JS Menet, 2012, Nascent-Seq reveals novel features of mouse circadian transcriptional regulation., eLife, 1, e00011, 10.7554/eLife.00011 · DOI
- AJ Trott, 2018, Regulation of circadian clock transcriptional output by CLOCK:BMAL1., Plos Genet., 14, e1007156, 10.1371/journal.pgen.1007156 · DOI
- S Luck, 2014, Rhythmic degradation explains and unifies circadian transcriptome and proteome data, Cell reports, 9, 741, 10.1016/j.celrep.2014.09.021 · DOI
- J Wang, 2018, Circadian clock-dependent and -independent posttranscriptional regulation underlies temporal mRNA accumulation in mouse liver, Proc Natl Acad Sci U S A, 115, E1916, 10.1073/pnas.1715225115 · DOI
- JD Keene, 2010, Minireview: global regulation and dynamics of ribonucleic Acid, Endocrinology, 151, 1391, 10.1210/en.2009-1250 · DOI
- S Kojima, 2010, MicroRNA-122 modulates the rhythmic expression profile of the circadian deadenylase Nocturnin in mouse liver, PLoS One, 5, e11264, 10.1371/journal.pone.0011264 · DOI
- NH Du, 2014, MicroRNAs shape circadian hepatic gene expression on a transcriptome-wide scale, eLife, 3, e02510, 10.7554/eLife.02510 · DOI
- TD Kim, 2005, Rhythmic serotonin N-acetyltransferase mRNA degradation is essential for the maintenance of its circadian oscillation, Mol Cell Biol, 25, 3232, 10.1128/MCB.25.8.3232-3246.2005 · DOI
- K Vanselow, 2006, Differential effects of PER2 phosphorylation: molecular basis for the human familial advanced sleep phase syndrome (FASPS)., Genes Dev, 20, 2660, 10.1101/gad.397006 · DOI
- T Schafmeier, 2008, Circadian activity and abundance rhythms of the Neurospora clock transcription factor WCC associated with rapid nucleo-cytoplasmic shuttling, Genes Dev, 22, 3397, 10.1101/gad.507408 · DOI
- AR Jang, 2015, Drosophila TIM binds importin alpha1, and acts as an adapter to transport PER to the nucleus., Plos Genet., 11, e1004974, 10.1371/journal.pgen.1004974 · DOI
- M Preussner, 2014, Rhythmic U2af26 alternative splicing controls PERIOD1 stability and the circadian clock in mice, Mol Cell, 54, 651, 10.1016/j.molcel.2014.04.015 · DOI
- AL Jalkanen, 2014, Determinants and implications of mRNA poly(A) tail size—does this protein make my tail look big?, Semin Cell Dev Biol, 34, 24, 10.1016/j.semcdb.2014.05.018 · DOI · Paper page
- CR Eckmann, 2011, Control of poly(A) tail length., Wiley interdisciplinary reviews RNA, 2, 348, 10.1002/wrna.56 · DOI
- S Kojima, 2012, Circadian control of mRNA polyadenylation dynamics regulates rhythmic protein expression, Genes Dev, 26, 2724, 10.1101/gad.208306.112 · DOI
- BG Robinson, 1988, Vasopressin mRNA in the suprachiasmatic nuclei: daily regulation of polyadenylate tail length, Science, 241, 342, 10.1126/science.3388044 · DOI
- JR Gerstner, 2012, Time of day regulates subcellular trafficking, tripartite synaptic localization, and polyadenylation of the astrocytic Fabp7 mRNA, The Journal of neuroscience: the official journal of the Society for Neuroscience, 32, 1383, 10.1523/JNEUROSCI.3228-11.2012 · DOI
- JJ Stubblefield, 2018, Temporal Control of Metabolic Amplitude by Nocturnin, Cell reports, 22, 1225, 10.1016/j.celrep.2018.01.011 · DOI
- Y Wang, 2001, Rhythmic expression of Nocturnin mRNA in multiple tissues of the mouse, BMC Dev Biol, 1, 9, 10.1186/1471-213X-1-9 · DOI
- L Weill, 2012, Translational control by changes in poly(A) tail length: recycling mRNAs, Nature Structural & Molecular Biology, 19, 577, 10.1038/nsmb.2311 · DOI · Paper page
- SE Wells, 1998, Circularization of mRNA by eukaryotic translation initiation factors, Mol Cell, 2, 135, 10.1016/S1097-2765(00)80122-7 · DOI
- A Jacobson, 1983, Possible involvement of poly(A) in protein synthesis., Nucleic Acids Res, 11, 6353, 10.1093/nar/11.18.6353 · DOI
- DR Gallie, 1991, The cap and poly(A) tail function synergistically to regulate mRNA translational efficiency., Genes Dev, 5, 2108, 10.1101/gad.5.11.2108 · DOI · Paper page
- DR Gallie, 1998, A tale of two termini: a functional interaction between the termini of an mRNA is a prerequisite for efficient translation initiation, Gene, 216, 1
- J Zhao, 1999, Formation of mRNA 3 ' ends in eukaryotes: Mechanism, regulation, and interrelationships with other steps in mRNA synthesis, Microbiology and Molecular Biology Reviews, 63, 405, 10.1128/MMBR.63.2.405-445.1999 · DOI
- NL Garneau, 2007, The highways and byways of mRNA decay, Nat Rev Mol Cell Biol, 8, 113, 10.1038/nrm2104 · DOI · Paper page
- R Mendez, 2001, Translational control by CPEB: A means to the end, Nature Reviews Molecular Cell Biology, 2, 521, 10.1038/35080081 · DOI
- A Charlesworth, 2013, Specificity factors in cytoplasmic polyadenylation, Wiley interdisciplinary reviews RNA, 4, 437, 10.1002/wrna.1171 · DOI
- J Cui, 2013, Cytoplasmic polyadenylation is a major mRNA regulator during oogenesis and egg activation in Drosophila, Dev Biol, 383, 121, 10.1016/j.ydbio.2013.08.013 · DOI
- JE Kwak, 2008, GLD2 poly(A) polymerase is required for long-term memory., Proceedings of the National Academy of Sciences of the United States of America, 105, 14644, 10.1073/pnas.0803185105 · DOI
- M Sun, 2013, Global analysis of eukaryotic mRNA degradation reveals Xrn1-dependent buffering of transcript levels, Mol Cell, 52, 52, 10.1016/j.molcel.2013.09.010 · DOI
- J Grigull, 2004, Genome-wide analysis of mRNA stability using transcription inhibitors and microarrays reveals posttranscriptional control of ribosome biogenesis factors, Molecular and Cellular Biology, 24, 5534, 10.1128/MCB.24.12.5534-5547.2004 · DOI
- X Wu, 2012, The regulation of mRNA stability in mammalian cells: 2.0, Gene, 500, 10, 10.1016/j.gene.2012.03.021 · DOI · Paper page
- CJ Decker, 1993, A Turnover Pathway for Both Stable and Unstable Messenger-Rnas in Yeast—Evidence for a Requirement for Deadenylation, Gene Dev, 7, 1632, 10.1101/gad.7.8.1632 · DOI
- D Muhlrad, 1992, Mutations affecting stability and deadenylation of the yeast MFA2 transcript, Genes Dev, 6, 2100, 10.1101/gad.6.11.2100 · DOI
- NJ Proudfoot, 2011, Ending the message: poly(A) signals then and now., Genes Dev, 25, 1770, 10.1101/gad.17268411 · DOI
- K Thurley, 2017, Principles for circadian orchestration of metabolic pathways, Proc Natl Acad Sci U S A, 114, 1572, 10.1073/pnas.1613103114 · DOI
- IM Sobol, 2001, Global sensitivity indices for nonlinear mathematical models and their Monte Carlo estimates., Math Comput Simulat, 55, 271, 10.1016/S0378-4754(00)00270-6 · DOI · Paper page
- B Iooss, 2015, A Review on Global Sensitivity Analysis Methods., 10.1007/978-1-4899-7547-8_5 · DOI
- S Panda, 2002, Coordinated transcription of key pathways in the mouse by the circadian clock, Cell, 109, 307, 10.1016/S0092-8674(02)00722-5 · DOI
- KF Storch, 2002, Extensive and divergent circadian gene expression in liver and heart, Nature, 417, 78, 10.1038/nature744 · DOI
- J Mermet, 2017, Systems Chronobiology: Global Analysis of Gene Regulation in a 24-Hour Periodic World., Csh Perspect Biol., 9
- J Yeung, 2018, Transcription factor activity rhythms and tissue-specific chromatin interactions explain circadian gene expression across organs, Genome Res, 28, 182, 10.1101/gr.222430.117 · DOI
- A Pizarro, 2013, CircaDB: a database of mammalian circadian gene expression profiles, Nucleic Acids Res, 41, D1009, 10.1093/nar/gks1161 · DOI
- TJ Eisen, 2019, The Dynamics of Cytoplasmic mRNA Metabolism, Mol Cell
- C Deneke, 2013, Complex Degradation Processes Lead to Non-Exponential Decay Patterns and Age-Dependent Decay Rates of Messenger RNA, Plos One, 8, 10.1371/journal.pone.0055442 · DOI
- JC Locke, 2008, Global parameter search reveals design principles of the mammalian circadian clock, Bmc Syst Biol, 2, 22, 10.1186/1752-0509-2-22 · DOI
- B Ananthasubramaniam, 2020, Amplitude Effects Allow Short Jet Lags and Large Seasonal Phase Shifts in Minimal Clock Models, J Mol Biol
- JP Pett, 2018, Co-existing feedback loops generate tissue-specific circadian rhythms, Life Sci Alliance, 1, e201800078, 10.26508/lsa.201800078 · DOI · Paper page
- T Gotoh, 2016, Model-driven experimental approach reveals the complex regulatory distribution of p53 by the circadian factor Period 2, Proc Natl Acad Sci U S A, 113, 13516, 10.1073/pnas.1607984113 · DOI
- R Dallmann, 2014, Chronopharmacology: new insights and therapeutic implications, Annu Rev Pharmacol Toxicol, 54, 339, 10.1146/annurev-pharmtox-011613-135923 · DOI
- T Hirota, 2012, Identification of small molecule activators of cryptochrome, Science, 337, 1094, 10.1126/science.1223710 · DOI
- JK Kim, 2013, Modeling and validating chronic pharmacological manipulation of circadian rhythms., CPT Pharmacometrics Syst Pharmacol, 2, e57, 10.1038/psp.2013.34 · DOI
- A. Saltelli, 2008, Global sensitivity analysis: the primer
- MD Mckay, 1979, A Comparison of Three Methods for Selecting Values of Input Variables in the Analysis of Output from a Computer Code., Technometrics, 21, 239
- H Yi, 2018, PABP Cooperates with the CCR4-NOT Complex to Promote mRNA Deadenylation and Block Precocious Decay, Mol Cell, 70, 1081, 10.1016/j.molcel.2018.05.009 · DOI
- A Saltelli, 2010, Variance based sensitivity analysis of model output. Design and estimator for the total sensitivity index, Comput Phys Commun, 181, 259, 10.1016/j.cpc.2009.09.018 · DOI · Paper page
Metadata
- Authors
- Yao, X., Kojima, S., & Chen, J.
- Affiliations
- Virginia Tech (US)
- Corresponding author
- Chen, Jing
- Venue
- PLOS Computational Biology
- Publisher
- Public Library of Science (PLoS)
- Published
- 2020-04-27
- Volume
- 16
- Issue
- 4
- Pages
- e1007842
- ISSN
- 1553-734X (ISSN-L)
- 1553-7358
- PMC
- PMC7205317
- OpenAlex
- W3018942718
- Cited by
- 9
- References
- 6
- Citations by year
- 2026: 2 · 2025: 1 · 2024: 1 · 2022: 1 · 2021: 3 · 2020: 1
- FWCI
- 0.64
- Type
- journal article
- Language
- en
- Update notices
- Open access
- gold
- doi.org
- Licence
- Locations
- PLoS Computational Biology (publishedVersion, cc-by)
- PubMed Central (publishedVersion, cc-by)
- PubMed (publishedVersion)
- DOAJ (DOAJ: Directory of Open Access Journals) (submittedVersion, cc-by-sa)
- Figshare (submittedVersion, cc-by)
- VTechWorks (Virginia Tech) (submittedVersion, cc-by)
- Topics
- Life Sciences › Neuroscience › Endocrine and Autonomic Systems › Circadian rhythm and melatonin
- Life Sciences › Biochemistry, Genetics and Molecular Biology › Molecular Biology › RNA Research and Splicing
- Life Sciences › Biochemistry, Genetics and Molecular Biology › Molecular Biology › Circular RNAs in diseases
- Keywords
- deadenylation, poly(A) tail length, circadian gene expression, circadian clock, post-transcriptional regulation, mRNA degradation, polyadenylation, deadenylase, phase synchronization, mouse liver
- MeSH terms
- Adenine, Animals, Computer Simulation, Gene Expression Regulation, Liver, Models, Genetic, Poly A, RNA, Messenger, Computational Biology, Polyadenylation, Mice, Circadian Clocks
About these checks
Registry, retraction, Cites and statistics results are computed, not judged, with one exception: a printed reference that no index lists is read once by a model before it counts as a citation error. Claims are extracted by a model and kept only when their quote appears verbatim in the text; each cited source is then checked, with a model’s help, for whether it says what the claim relies on. Those verdicts can be wrong — read the claim’s quote and the cited source before relying on one.
Statistics and arithmetic are recomputed, not judged.
Confidence bands are shown only for fields calibrated on our annotated test set. None is calibrated yet, so no band is shown.
What counts as a claim ›How we measure confidence ›How we check this ›
Are you an author, or do you see a problem with this page? Request a review
