

The DOI matches its Crossref record; 57 of the 57 references it cites were found in a registry or an index.
Microglial Morphology and Dynamic Behavior Is Regulated by Ionotropic Glutamatergic and GABAergic Neurotransmission
Open accessAbstract
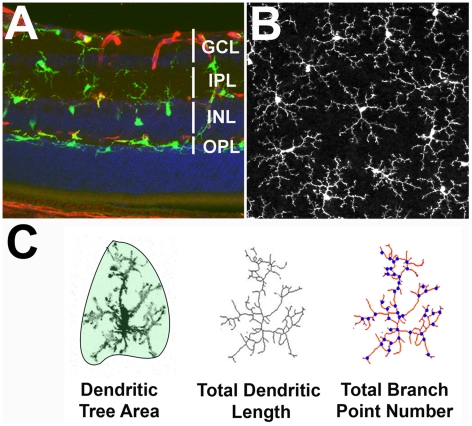
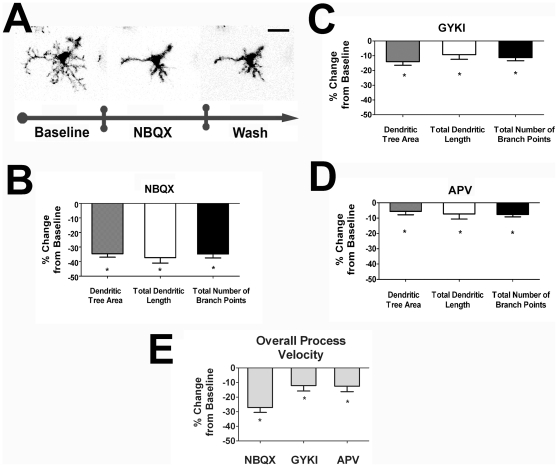
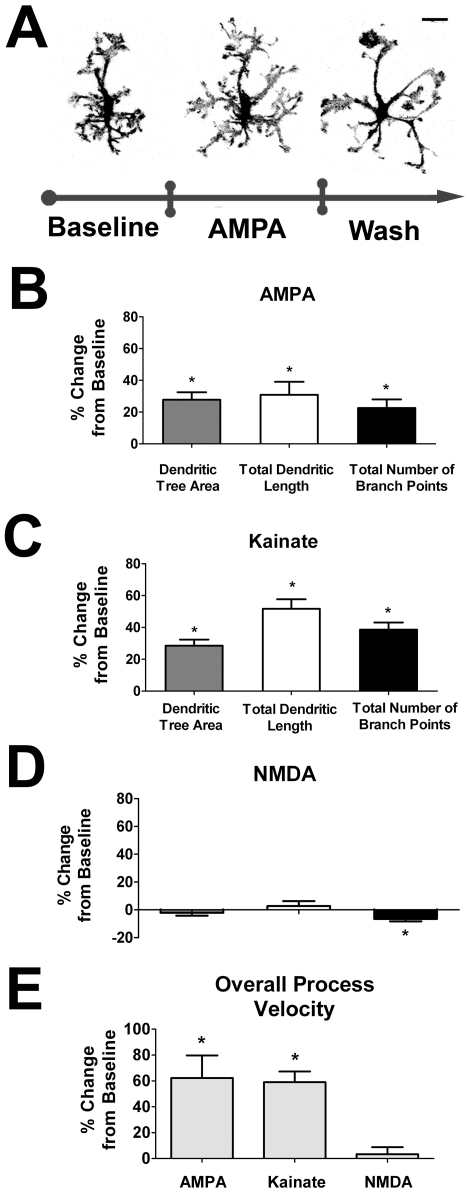
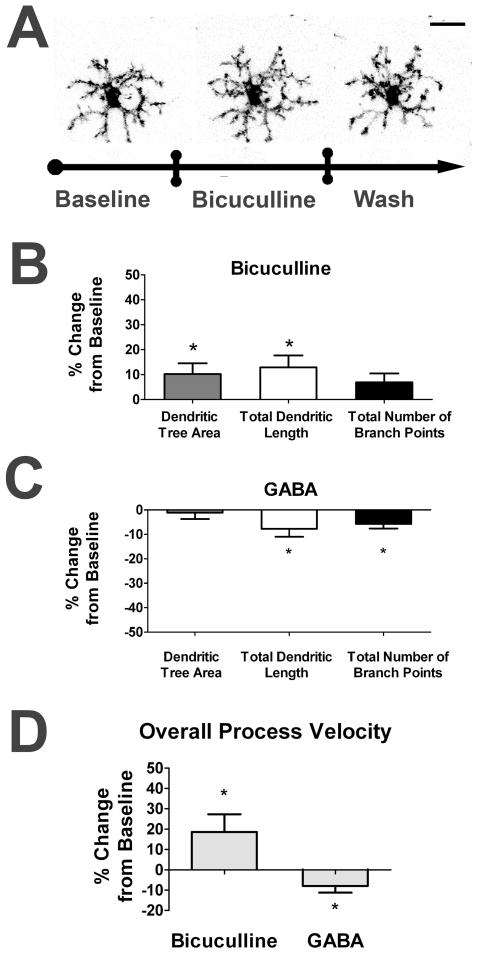
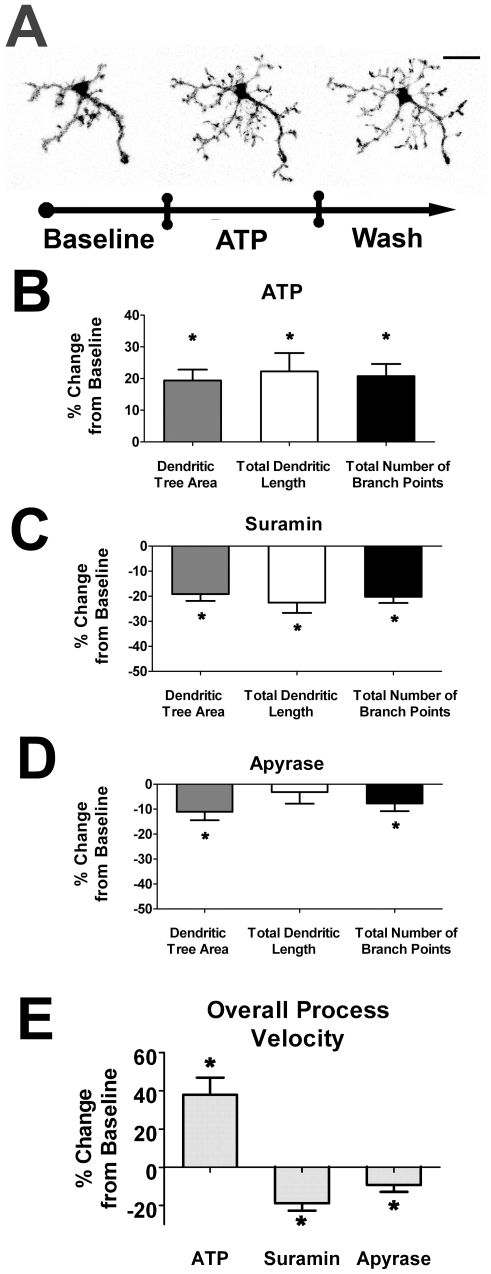
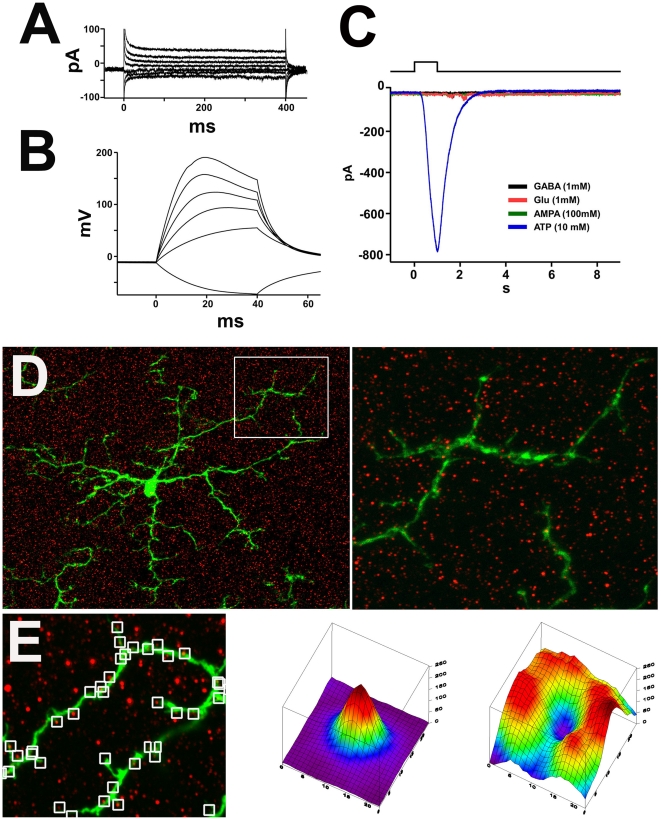
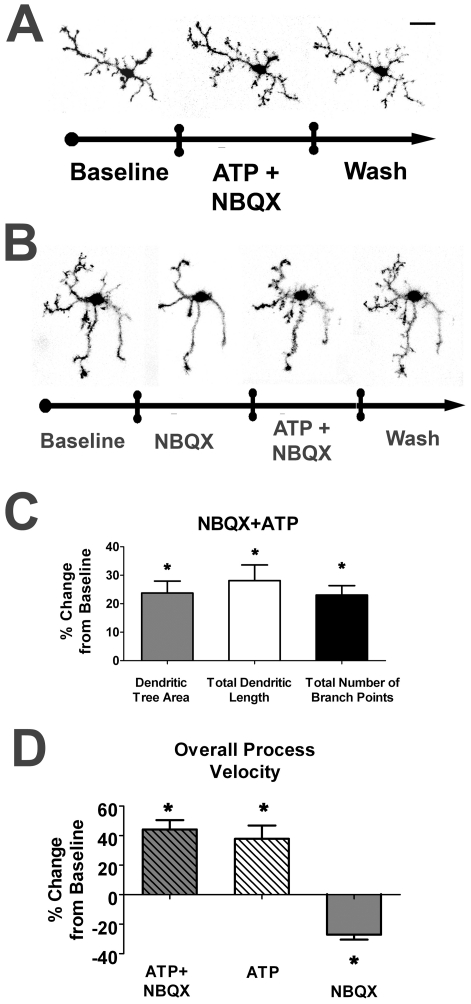
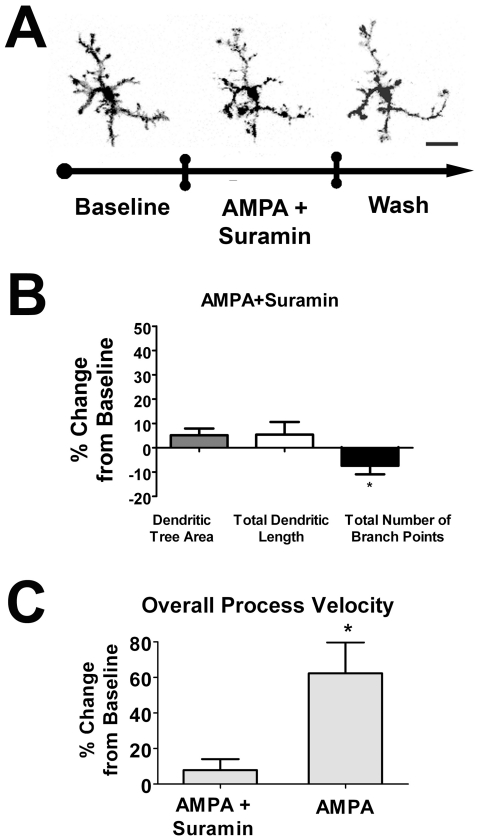
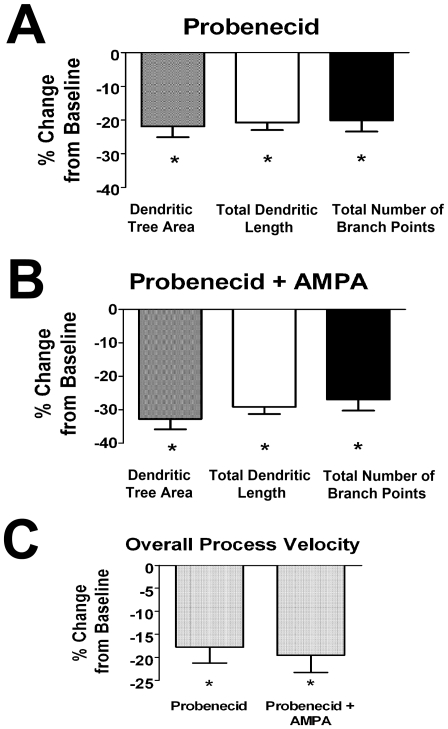
PURPOSE: Microglia represent the primary resident immune cells in the CNS, and have been implicated in the pathology of neurodegenerative diseases. Under basal or "resting" conditions, microglia possess ramified morphologies and exhibit dynamic surveying movements in their processes. Despite the prominence of this phenomenon, the function and regulation of microglial morphology and dynamic behavior are incompletely understood. We investigate here whether and how neurotransmission regulates "resting" microglial morphology and behavior. METHODS: We employed an ex vivo mouse retinal explant system in which endogenous neurotransmission and dynamic microglial behavior are present. We utilized live-cell time-lapse confocal imaging to study the morphology and behavior of GFP-labeled retinal microglia in response to neurotransmitter agonists and antagonists. Patch clamp electrophysiology and immunohistochemical localization of glutamate receptors were also used to investigate direct-versus-indirect effects of neurotransmission by microglia. RESULTS: Retinal microglial morphology and dynamic behavior were not cell-autonomously regulated but are instead modulated by endogenous neurotransmission. Morphological parameters and process motility were differentially regulated by different modes of neurotransmission and were increased by ionotropic glutamatergic neurotransmission and decreased by ionotropic GABAergic neurotransmission. These neurotransmitter influences on retinal microglia were however unlikely to be directly mediated; local applications of neurotransmitters were unable to elicit electrical responses on microglia patch-clamp recordings and ionotropic glutamatergic receptors were not located on microglial cell bodies or processes by immunofluorescent labeling. Instead, these influences were mediated indirectly via extracellular ATP, released in response to glutamatergic neurotransmission through probenecid-sensitive pannexin hemichannels. CONCLUSIONS: Our results demonstrate that neurotransmission plays an endogenous role in regulating the morphology and behavior of "resting" microglia in the retina. These findings illustrate a mode of constitutive signaling between the neural and immune compartments of the CNS through which immune cells may be regulated in concert with levels of neural activity.
Overview
The claims and statistics of this paper haven’t been checked yet.
Run the check — free, no account needed. It reads the open-access text and checks the sources it cites.
Integrity signals
Registry
Cites
Statistics
Figures
Verification
Claims the paper makes
The claims and statistics of this paper haven’t been checked yet.
Run the check — free, no account needed. It reads the open-access text and checks the sources it cites.
Claims other papers make about this one
Each is checked against this paper’s own text: does it say what the citing paper says it does?
The source backs part of the claim, not all of it — or backs it for a different population, condition or comparison.
In the citing paper
“Previous work has demonstrated that microglia have the capacity to interact with synaptic elements in response to neurotransmitter release and/or sensory experience (Biber et al., 2007; Fontainhas et al., 2011; Nimmerjahn et al., 2005; Ransohoff and Perry, 2009; Tremblay et al., 2010a; Wake et al., 2009).”
From Microglia Sculpt Postnatal Neural Circuits in an Activity and Complement-Dependent Manner (2012) · cites this paper as Fontainhas et al., 2011
Experimental — accuracy not yet measuredIn the citing paper
“and that microglia respond to changes in ionotropic neurotransmission via the intermediary release of ATP by astrocytes20.”
From Microglial P2Y12 is necessary for synaptic plasticity in mouse visual cortex (2016) · cites this paper as [20]
Self-check
Percentages, sums and reported differences re-computed from the paper’s own numbers.
The self-check needs the paper’s full text.
Citations
Cites
Resting microglial cells are highly dynamic surveillants of brain parenchyma in vivo
Nimmerjahn, A., Kirchhoff, F., & Helmchen, F. (2005) · Science · doi:10.1126/science.1110647 · Cited by 5,827
ATP mediates rapid microglial response to local brain injury in vivo
Davalos, D., Grutzendler, J., Yang, G., Kim, J. V., Zuo, Y., Jung, S., Littman, D. R., Dustin, M. L., & Gan, W.-B. (2005) · Nature Neuroscience · doi:10.1038/nn1472 · Cited by 3,913
Microglia: Active sensor and versatile effector cells in the normal and pathologic brain
Hanisch, U.-K., & Kettenmann, H. (2007) · Nature Neuroscience · doi:10.1038/nn1997 · Cited by 3,676
Jung, S., Aliberti, J., Graemmel, P., Sunshine, M. J., Kreutzberg, G. W., Sher, A., & Littman, D. R. (2000) · Molecular and Cellular Biology · doi:10.1128/mcb.20.11.4106-4114.2000 · Cited by 2,632
Heterogeneity in the distribution and morphology of microglia in the normal adult mouse brain
Lawson, L. J., Perry, V. H., Dri, P., & Gordon, S. (1990) · Neuroscience · doi:10.1016/0306-4522(90)90229-w · Cited by 2,045
Microglial physiology: unique stimuli, specialized responses
Ransohoff, R. M., & Perry, V. H. (2009) · Annual Review of Immunology · doi:10.1146/annurev.immunol.021908.132528 · Cited by 1,858
Wake, H., Moorhouse, A. J., Jinno, S., Kohsaka, S., & Nabekura, J. (2009) · The Journal of Neuroscience · doi:10.1523/jneurosci.4363-08.2009 · Cited by 1,619
The P2Y12 receptor regulates microglial activation by extracellular nucleotides
Haynes, S. E., Hollopeter, G., Yang, G., Kurpius, D., Dailey, M. E., Gan, W.-B., & Julius, D. (2006) · Nature Neuroscience · doi:10.1038/nn1805 · Cited by 1,542
Neuronal ‘On’ and ‘Off’ signals control microglia
Biber, K., Neumann, H., Inoue, K., & Boddeke, H. W. G. M. (2007) · Trends in Neurosciences · doi:10.1016/j.tins.2007.08.007 · Cited by 787
Neurotransmitter receptors on microglia
Pocock, J. M., & Kettenmann, H. (2007) · Trends in Neurosciences · doi:10.1016/j.tins.2007.07.007 · Cited by 650
Cited by
Sorted by citations
Microglia Sculpt Postnatal Neural Circuits in an Activity and Complement-Dependent Manner
Schafer, D. P., Lehrman, E. K., Kautzman, A. G., Koyama, R., Mardinly, A. R., Yamasaki, R., Ransohoff, R. M., Greenberg, M. E., Barres, B. A., & Stevens, B. (2012) · Neuron · doi:10.1016/j.neuron.2012.03.026 · Cited by 4,089
“…work has demonstrated that microglia have the capacity to interact with synaptic elements in response to neurotransmitter release and/or sensory experience (Biber et al., 2007; Fontainhas et al., 2011; Nimmerjahn et al., 2005; Ransohoff and Perry, 2009; Tremblay et al., 2010a; Wake et al., 2009).”
Microglia emerge as central players in brain disease
Salter, M. W., & Stevens, B. (2017) · Nature Medicine · doi:10.1038/nm.4397 · Cited by 1,767
Microglia: new roles for the synaptic stripper
Kettenmann, H., Kirchhoff, F., & Verkhratsky, A. (2013) · Neuron · doi:10.1016/j.neuron.2012.12.023 · Cited by 1,173
The Role of Microglia in the Healthy Brain: Figure 1.
Tremblay, M.-È., Stevens, B., Sierra, A., Wake, H., Bessis, A., & Nimmerjahn, A. (2011) · The Journal of Neuroscience · doi:10.1523/jneurosci.4158-11.2011 · Cited by 992
Microglia Heterogeneity in the Single-Cell Era
Masuda, T., Sankowski, R., Staszewski, O., & Prinz, M. (2020) · Cell Reports · doi:10.1016/j.celrep.2020.01.010 · Cited by 784
Integrating neuroimmune systems in the neurobiology of depression
Wohleb, E. S., Franklin, T., Iwata, M., & Duman, R. S. (2016) · Nature Reviews Neuroscience · doi:10.1038/nrn.2016.69 · Cited by 668
Microglia: Dynamic Mediators of Synapse Development and Plasticity
Wu, Y., Dissing-Olesen, L., MacVicar, B. A., & Stevens, B. (2015) · Trends in Immunology · doi:10.1016/j.it.2015.08.008 · Cited by 661
The “quad‐partite” synapse: Microglia‐synapse interactions in the developing and mature CNS
Schafer, D. P., Lehrman, E. K., & Stevens, B. (2013) · Glia · doi:10.1002/glia.22389 · Cited by 570
Tay, T. L., Savage, J. C., Hui, C. W., Bisht, K., & Tremblay, M. (2017) · The Journal of Physiology · doi:10.1113/jp272134 · Cited by 562
Reciprocal Regulation between Resting Microglial Dynamics and Neuronal Activity In Vivo
Li, Y., Du, X.-F., Liu, C., Wen, Z., & Du, J. (2012) · Developmental Cell · doi:10.1016/j.devcel.2012.10.027 · Cited by 590
Retinal microglia: Just bystander or target for therapy?
Karlstetter, M., Scholz, R., Rutar, M., Wong, W. T., Provis, J. M., & Langmann, T. (2014) · Progress in Retinal and Eye Research · doi:10.1016/j.preteyeres.2014.11.004 · Cited by 570
Self-citationMicroglia during development and aging
Harry, G. J. (2013) · Pharmacology & Therapeutics · doi:10.1016/j.pharmthera.2013.04.013 · Cited by 524
Microglial P2Y12 is necessary for synaptic plasticity in mouse visual cortex
Sipe, G. O., Lowery, Tremblay, M.-È., Kelly, E. A., Lamantia, C. E., & Majewska, A. K. (2016) · Nature Communications · doi:10.1038/ncomms10905 · Cited by 512
Eyo, U. B., Peng, J., Swiatkowski, P., Mukherjee, A., Bispo, A., & Wu, L.-J. (2014) · Journal of Neuroscience · doi:10.1523/jneurosci.0416-14.2014 · Cited by 509
Morrison, H. W., & Filosa, J. A. (2013) · Journal of Neuroinflammation · doi:10.1186/1742-2094-10-4 · Cited by 506
Bidirectional Microglia–Neuron Communication in Health and Disease
Szepesi, Z., Manouchehrian, O., Bachiller, S., & Deierborg, T. (2018) · Frontiers in Cellular Neuroscience · doi:10.3389/fncel.2018.00323 · Cited by 459
Microglial phagocytosis of living photoreceptors contributes to inherited retinal degeneration
Zhao, L., Zabel, M. K., Wang, X., Ma, W., Shah, P., Fariss, R. N., Qian, H., Parkhurst, C. N., Gan, W., & Wong, W. T. (2015) · EMBO Molecular Medicine · doi:10.15252/emmm.201505298 · Cited by 457
Self-citationMicroglia: actively surveying and shaping neuronal circuit structure and function
Wake, H., Moorhouse, A. J., Miyamoto, A., & Nabekura, J. (2013) · Trends in Neurosciences · doi:10.1016/j.tins.2012.11.007 · Cited by 448
Microglia in the Retina: Roles in Development, Maturity, and Disease
Silverman, S. M., & Wong, W. T. (2018) · Annual Review of Vision Science · doi:10.1146/annurev-vision-091517-034425 · Cited by 364
Self-citationMicroglial Dynamics and Role in the Healthy and Diseased Brain: A Paradigm of Functional Plasticity
Gomez-Nicola, D., & Perry, V. H. (2015) · The Neuroscientist · doi:10.1177/1073858414530512 · Cited by 340
Reichenbach, A., & Bringmann, A. (2019) · Glia · doi:10.1002/glia.23727 · Cited by 327
Acute and Chronic Stress-Induced Disturbances of Microglial Plasticity, Phenotype and Function
Walker, F. R., Nilsson, M., & Jones, K. (2013) · Current Drug Targets · doi:10.2174/13894501113149990208 · Cited by 336
GABA-Receptive Microglia Selectively Sculpt Developing Inhibitory Circuits
Favuzzi, E., Huang, S., Saldi, G.-A., Binan, L., Ibrahim, L. A., Fernández-Otero, M., Cao, Y., Zeine, A., Sefah, A., Zheng, K., et al. (2020) · Cell · doi:10.1016/j.cell.2021.06.018 · Cited by 327
Activation of Neuronal NMDA Receptors Triggers Transient ATP-Mediated Microglial Process Outgrowth
Dissing-Olesen, L., LeDue, J. M., Rungta, R. L., Hefendehl, J. K., Choi, H. B., & MacVicar, B. A. (2014) · Journal of Neuroscience · doi:10.1523/jneurosci.0405-14.2014 · Cited by 286
Microglia in depression: current perspectives
Jia, X., Gao, Z., & Hu, H. (2020) · Science China Life Sciences · doi:10.1007/s11427-020-1815-6 · Cited by 288
Morrison, H., Young, K., Qureshi, M., Rowe, R. K., & Lifshitz, J. (2017) · Scientific Reports · doi:10.1038/s41598-017-13581-z · Cited by 276
Neuroprotective function for ramified microglia in hippocampal excitotoxicity
Vinet, J., van Weering, H. R., Heinrich, A., Kälin, R. E., Wegner, A., Brouwer, N., Heppner, F. L., van Rooijen, N., Boddeke, H. W., & Biber, K. (2012) · Journal of Neuroinflammation · doi:10.1186/1742-2094-9-27 · Cited by 274
“The more recent findings that ramified microglia contact active synapses [20,21], suggests a cell-cell interaction between ramified microglia and neurons, which however, is not yet understood.”
BackgroundCross talk: the microbiota and neurodevelopmental disorders
Kelly, J. R., Minuto, C., Cryan, J. F., Clarke, G., & Dinan, T. G. (2017) · Frontiers in Neuroscience · doi:10.3389/fnins.2017.00490 · Cited by 271
Orre, M., Kamphuis, W., Osborn, L. M., Melief, J., Kooijman, L., Huitinga, I., Klooster, J., Bossers, K., & Hol, E. M. (2013) · Neurobiology of Aging · doi:10.1016/j.neurobiolaging.2013.07.008 · Cited by 279
Shaping Neuronal Fate: Functional Heterogeneity of Direct Microglia-Neuron Interactions
Cserép, C., Pósfai, B., & Dénes, Á. (2021) · Neuron · doi:10.1016/j.neuron.2020.11.007 · Cited by 256
Wang, X., Zhao, L., Zhang, J., Fariss, R. N., Ma, W., Kretschmer, F., Wang, M., Qian, H., Badea, T. C., Diamond, J. S., et al. (2016) · Journal of Neuroscience · doi:10.1523/jneurosci.3575-15.2016 · Cited by 249
Self-citationAge‐Related Macular Degeneration: New Paradigms for Treatment and Management of AMD
Hernández-Zimbrón, L. F., Zamora-Alvarado, R., la Paz, L. D. O.-D., Vélez-Montoya, R., Zenteno, E., Gulías-Cañizo, R., Quiroz–Mercado, H., & González-Salinas, R. (2018) · Oxidative Medicine and Cellular Longevity · doi:10.1155/2018/8374647 · Cited by 247
How microglia sense and regulate neuronal activity
Umpierre, A. D., & Wu, L. (2021) · Glia · doi:10.1002/glia.23961 · Cited by 237
Walker, F. R., Beynon, S. B., Jones, K., Zhao, Z., Kongsui, R., Cairns, M. J., & Nilsson, M. (2014) · Brain Behavior and Immunity · doi:10.1016/j.bbi.2013.12.010 · Cited by 237
Morris, G. P., Clark, I. A., Zinn, R., & Vissel, B. (2013) · Neurobiology of Learning and Memory · doi:10.1016/j.nlm.2013.07.002 · Cited by 236
Targeting Neuroinflammation to Treat Alzheimer’s Disease
Ardura-Fabregat, A., Boddeke, E., Boza‐Serrano, A., Brioschi, S., Castro‐Gomez, S., Ceyzériat, K., Dansokho, C., Dierkes, T., Gelders, G., Heneka, M. T., et al. (2017) · CNS Drugs · doi:10.1007/s40263-017-0483-3 · Cited by 241
Paolicelli, R. C., & Ferretti, M. T. (2017) · Frontiers in Synaptic Neuroscience · doi:10.3389/fnsyn.2017.00009 · Cited by 252
Regulation of Microglial Functions by Purinergic Mechanisms in the Healthy and Diseased CNS
Illés, P., Rubini, P., Ulrich, H., Zhao, Y., & Tang, Y. (2020) · Cells · doi:10.3390/cells9051108 · Cited by 249
Microglia-neuron crosstalk: Signaling mechanism and control of synaptic transmission
Marinelli, S., Basilico, B., Marrone, M. C., & Ragozzino, D. (2019) · Seminars in Cell & Developmental Biology · doi:10.1016/j.semcdb.2019.05.017 · Cited by 233
Microglial aging in the healthy CNS: phenotypes, drivers, and rejuvenation
Wong, W. T. (2013) · Frontiers in Cellular Neuroscience · doi:10.3389/fncel.2013.00022 · Cited by 241
Self-citationBenarroch, E. E. (2013) · Neurology · doi:10.1212/wnl.0b013e3182a4a577 · Cited by 232
Zabel, M. K., Zhao, L., Zhang, Y., Gonzalez, S. R., Ma, W., Wang, X., Fariss, R. N., & Wong, W. T. (2016) · Glia · doi:10.1002/glia.23016 · Cited by 210
Self-citationBidirectional Microglia‐Neuron Communication in the Healthy Brain
Eyo, U. B., & Wu, L. (2013) · Neural Plasticity · doi:10.1155/2013/456857 · Cited by 208
Wang, M., Wang, X., Zhao, L., Ma, W., Rodríguez, I. R., Fariss, R. N., & Wong, W. T. (2014) · Journal of Neuroscience · doi:10.1523/jneurosci.3153-13.2014 · Cited by 211
Self-citationIntersection of pathological tau and microglia at the synapse
Vogels, T., Murgoci, A.-N., & Hromádka, T. (2019) · Acta Neuropathologica Communications · doi:10.1186/s40478-019-0754-y · Cited by 197
Glutamate and GABA in Microglia-Neuron Cross-Talk in Alzheimer’s Disease
Czapski, G. A., & Strosznajder, J. B. (2021) · International Journal of Molecular Sciences · doi:10.3390/ijms222111677 · Cited by 198
Microglia regulate synaptic development and plasticity
Andoh, M., & Koyama, R. (2021) · Developmental Neurobiology · doi:10.1002/dneu.22814 · Cited by 195
Rojas, B., Gallego, B., Ramirez, A. I., Salazar, J. J., de Hoz, R., Valiente‐Soriano, F. J., Avilés‐Trigueros, M., Villegas‐Pérez, M. P., Vidal‐Sanz, M., Triviño, A., et al. (2014) · Journal of Neuroinflammation · doi:10.1186/1742-2094-11-133 · Cited by 188
Neurotransmitter receptors on microglia
Liu, H., Leak, R. K., & Hu, X. (2016) · Stroke and Vascular Neurology · doi:10.1136/svn-2016-000012 · Cited by 185
Koizumi, S., Ohsawa, K., Inoue, K., & Kohsaka, S. (2013) · Glia · doi:10.1002/glia.22358 · Cited by 184
Depression as a Glial-Based Synaptic Dysfunction
Rial, D., Lemos, C., Pinheiro, H., Duarte, J. M., Gonçalves, F. Q., Real, J. I., Prediger, R. D., Gonçalves, N., Gomes, C. A., Canas, P. M., et al. (2016) · Frontiers in Cellular Neuroscience · doi:10.3389/fncel.2015.00521 · Cited by 193
Abiega, O., Beccari, S., Díaz‐Aparicio, I., Nadjar, A., Layé, S., Leyrolle, Q., Gómez‐Nicola, D., Domercq, M., Pérez‐Samartín, A., Sánchez-Zafra, V., et al. (2016) · PLoS Biology · doi:10.1371/journal.pbio.1002466 · Cited by 190
Tolner, E. A., Sheikh, A., Yukin, A. Y., Kaila, K., & Kanold, P. O. (2012) · Journal of Neuroscience · doi:10.1523/jneurosci.1538-11.2012 · Cited by 180
Beynon, S. B., & Walker, F. R. (2012) · Neuroscience · doi:10.1016/j.neuroscience.2012.07.029 · Cited by 178
Neurotransmitter signaling in the pathophysiology of microglia
Domercq, M., Vázquez‐Villoldo, N., & Matute, C. (2013) · Frontiers in Cellular Neuroscience · doi:10.3389/fncel.2013.00049 · Cited by 174
Sáez, P. J., Vargas, P., Shoji, K. F., Harcha, P. A., Lennon‐Duménil, A., & Sáez, J. C. (2017) · Science Signaling · doi:10.1126/scisignal.aah7107 · Cited by 164
Microglia activation states and cannabinoid system: Therapeutic implications
Mecha, M., Carrillo-Salinas, F. J., Feliú, A., Mestre, L., & Guaza, C. (2016) · Pharmacology & Therapeutics · doi:10.1016/j.pharmthera.2016.06.011 · Cited by 165
Microglia in neuronal plasticity: Influence of stress
Delpech, J.-C., Madore, C., Nadjar, A., Joffre, C., Wohleb, E. S., & Layé, S. (2015) · Neuropharmacology · doi:10.1016/j.neuropharm.2014.12.034 · Cited by 161
Modulation of Microglial Process Convergence Toward Neuronal Dendrites by Extracellular Calcium
Eyo, U. B., Gu, N., De, S., Dong, H., Richardson, J. R., & Wu, L.-J. (2015) · The Journal of Neuroscience · doi:10.1523/jneurosci.3279-14.2015 · Cited by 154
Cai, Q., Li, Y., & Pei, G. (2017) · Journal of Neuroinflammation · doi:10.1186/s12974-017-0839-0 · Cited by 158
Nijs, J., Loggia, M. L., Polli, A., Moens, M., Huysmans, E., Goudman, L., Meeus, M., Vanderweeën, L., Ickmans, K., & Clauw, D. J. (2017) · Expert Opinion on Therapeutic Targets · doi:10.1080/14728222.2017.1353603 · Cited by 156
Zhang, Y., Zhao, L., Wang, X., Ma, W., Lazere, A., Qian, H., Zhang, J., Abu-Asab, M. S., Fariss, R. N., Roger, J. E., et al. (2018) · Science Advances · doi:10.1126/sciadv.aap8492 · Cited by 145
Self-citationWhat Do Microglia Really Do in Healthy Adult Brain?
Augusto‐Oliveira, M., Arrifano, G. D. P., Lopes-Araújo, A., Santos-Sacramento, L., Takeda, P. Y., Anthony, D. C., Malva, J. O., & Lopez, M. E. C. (2019) · Cells · doi:10.3390/cells8101293 · Cited by 158
Endocannabinoid Modulation of Microglial Phenotypes in Neuropathology
Tanaka, M., Sackett, S., & Zhang, Y. (2020) · Frontiers in Neurology · doi:10.3389/fneur.2020.00087 · Cited by 151
Microglia and synapse interactions: fine tuning neural circuits and candidate molecules
Miyamoto, A., Wake, H., Moorhouse, A. J., & Nabekura, J. (2013) · Frontiers in Cellular Neuroscience · doi:10.3389/fncel.2013.00070 · Cited by 147
Axon Initial Segment–Associated Microglia
Baalman, K., Marin, M. A., Ho, T., Godoy, M. I., Cherian, L., Robertson, C., & Rasband, M. (2015) · Journal of Neuroscience · doi:10.1523/jneurosci.3751-14.2015 · Cited by 129
Microglia: Key Elements in Neural Development, Plasticity, and Pathology
Eyo, U. B., & Dailey, M. E. (2013) · Journal of Neuroimmune Pharmacology · doi:10.1007/s11481-013-9434-z · Cited by 144
York, E. M., LeDue, J. M., Bernier, L., & MacVicar, B. A. (2018) · eNeuro · doi:10.1523/eneuro.0266-18.2018 · Cited by 135
Microglia and the Purinergic Signaling System
Calovi, S., Mut-Arbona, P., & Sperlágh, B. (2018) · Neuroscience · doi:10.1016/j.neuroscience.2018.12.021 · Cited by 143
Microglia-Müller Cell Interactions in the Retina
Wang, M., & Wong, W. T. (2014) · Advances in experimental medicine and biology · doi:10.1007/978-1-4614-3209-8_42 · Cited by 136
Self-citationAlzheimer's Disease: The Role of Microglia in Brain Homeostasis and Proteopathy
Clayton, K. A., Enoo, A. A. V., & Ikezu, T. (2017) · Frontiers in Neuroscience · doi:10.3389/fnins.2017.00680 · Cited by 137
Microglial P2Y12 receptors regulate microglial activation and surveillance during neuropathic pain
Gu, N., Eyo, U. B., Murugan, M., Peng, J., Matta, S., Dong, H., & Wu, L. (2015) · Brain Behavior and Immunity · doi:10.1016/j.bbi.2015.11.007 · Cited by 135
Microglial Contact Prevents Excess Depolarization and Rescues Neurons from Excitotoxicity
Kato, G., Inada, H., Wake, H., Akiyoshi, R., Miyamoto, A., Eto, K., Ishikawa, T., Moorhouse, A. J., Strassman, A. M., & Nabekura, J. (2016) · eNeuro · doi:10.1523/eneuro.0004-16.2016 · Cited by 128
Targeting innate immunity for neurodegenerative disorders of the central nervous system
Andreasson, K. I., Bachstetter, A. D., Colonna, M., Ginhoux, F., Holmes, C., Lamb, B., Landreth, G., Lee, D. C., Low, D., Lynch, M. A., et al. (2016) · Journal of Neurochemistry · doi:10.1111/jnc.13667 · Cited by 126
A microglia-cytokine axis to modulate synaptic connectivity and function
Werneburg, S., Feinberg, P. A., Johnson, K. M., & Schafer, D. P. (2017) · Current Opinion in Neurobiology · doi:10.1016/j.conb.2017.10.002 · Cited by 126
Mills, S. A., Jobling, A. I., Dixon, M., Bui, B. V., Vessey, K. A., Phipps, J. A., Greferath, U., Venables, G., Wong, V. H. Y., Wong, C. H. Y., et al. (2021) · Proceedings of the National Academy of Sciences · doi:10.1073/pnas.2112561118 · Cited by 122
Baron, R., Babcock, A. A., Nemirovsky, A., Finsen, B., & Monsonego, A. (2014) · Aging Cell · doi:10.1111/acel.12210 · Cited by 118
The innate immune system in diabetic retinopathy
Pan, W. W., Lin, F., & Fort, P. E. (2021) · Progress in Retinal and Eye Research · doi:10.1016/j.preteyeres.2021.100940 · Cited by 117
Ronzano, R., Roux, T., Thétiot, M., Aigrot, M., Richard, L., Lejeune, F., Mazuir, E., Vallat, J., Lubetzki, C., & Desmazières, A. (2021) · Nature Communications · doi:10.1038/s41467-021-25486-7 · Cited by 122
Glia: A Neglected Player in Non-invasive Direct Current Brain Stimulation
Gellner, A., Reis, J., & Fritsch, B. (2016) · Frontiers in Cellular Neuroscience · doi:10.3389/fncel.2016.00188 · Cited by 114
Microglia: Lifelong patrolling immune cells of the brain
Eyo, U. B., & Wu, L. (2019) · Progress in Neurobiology · doi:10.1016/j.pneurobio.2019.04.003 · Cited by 118
GABAergic signaling by cells of the immune system: more the rule than the exception
Bhandage, A. K., & Barragán, A. (2021) · Cellular and Molecular Life Sciences · doi:10.1007/s00018-021-03881-z · Cited by 114
Receptors, Ion Channels, and Signaling Mechanisms Underlying Microglial Dynamics
Madry, C., & Attwell, D. (2015) · Journal of Biological Chemistry · doi:10.1074/jbc.r115.637157 · Cited by 109
“Increases in neuronal activity evoked by glutamate (or analogues like NMDA, AMPA, or kainate), or by blocking GABAergic inhibition, led to microglial process extension and enhanced baseline motility, whereas block of AMPA receptors had the opposite effect (5, 37, 50, 75).”
BackgroundResultInfluentialThe role of microglia at synapses in the healthy CNS: novel insights from recent imaging studies
Tremblay, M. (2011) · Neuron Glia Biology · doi:10.1017/s1740925x12000038 · Cited by 117
Ma, W., Cojocaru, R. I., Gotoh, N., Gieser, L. M., Villasmil, R., Cogliati, T., Swaroop, A., & Wong, W. T. (2013) · Neurobiology of Aging · doi:10.1016/j.neurobiolaging.2013.03.022 · Cited by 108
Self-citationAugusto‐Oliveira, M., Arrifano, G. D. P., Delage, C. I., Tremblay, M., Lopez, M. E. C., & Verkhratsky, A. (2021) · Biological reviews/Biological reviews of the Cambridge Philosophical Society · doi:10.1111/brv.12797 · Cited by 114
Parellada, E., & Gassó, P. (2021) · Translational Psychiatry · doi:10.1038/s41398-021-01385-9 · Cited by 108
Macrophagic and microglial complexity after neuronal injury
Mesquida-Veny, F., del Río, J. A., & Hervera, A. (2020) · Progress in Neurobiology · doi:10.1016/j.pneurobio.2020.101970 · Cited by 105
Ma, W., Zhang, Y., Gao, C., Fariss, R. N., Tam, J., & Wong, W. T. (2017) · Scientific Reports · doi:10.1038/s41598-017-08702-7 · Cited by 102
Self-citationP2X4 receptors control the fate and survival of activated microglia
Vázquez‐Villoldo, N., Domercq, M., Martín, A., Llop, J., Gómez‐Vallejo, V., & Matute, C. (2013) · Glia · doi:10.1002/glia.22596 · Cited by 105
Central Role of GABA in Neuron–Glia Interactions
Vélez‐Fort, M., Audinat, É., & Angulo, M. C. (2011) · The Neuroscientist · doi:10.1177/1073858411403317 · Cited by 114
Microglial modulation of neuronal activity in the healthy brain
York, E. M., Bernier, L., & MacVicar, B. A. (2018) · Developmental Neurobiology · doi:10.1002/dneu.22571 · Cited by 98
Glial connexin expression and function in the context of Alzheimer's disease
Koulakoff, A., Mei, X., Orellana, J. A., Sáez, J. C., & Giaume, C. (2011) · Biochimica et Biophysica Acta (BBA) - Biomembranes · doi:10.1016/j.bbamem.2011.10.001 · Cited by 100
The role of neurogenesis in neurorepair after ischemic stroke
Marques, B. L., Carvalho, G. A., Freitas, E. M. M., Chiareli, R. A., Barbosa, T. G., Araújo, A. G. P. D., Nogueira, Y. L., Ribeiro, R. I., Parreira, R. C., Vieira, M. S., et al. (2019) · Seminars in Cell and Developmental Biology · doi:10.1016/j.semcdb.2018.12.003 · Cited by 99
The Gut–Brain Axis in Schizophrenia: The Implications of the Gut Microbiome and SCFA Production
Ju, S., Shin, Y., Han, S., Kwon, J., Choi, T. G., Kang, I., & Kim, S. S. (2023) · Nutrients · doi:10.3390/nu15204391 · Cited by 97
Sandvig, I., Augestad, I. L., Håberg, A. K., & Sandvig, A. (2018) · European Journal of Neuroscience · doi:10.1111/ejn.13959 · Cited by 94
Microglia‐dependent remodeling of neuronal circuits
Guedes, J. R., Ferreira, P. A., Costa, J. M., Cardoso, A. L., & Peça, J. (2022) · Journal of Neurochemistry · doi:10.1111/jnc.15689 · Cited by 93
Microglia: Driving critical periods and sexual differentiation of the brain
VanRyzin, J. W., Pickett, L. A., & McCarthy, M. M. (2017) · Developmental Neurobiology · doi:10.1002/dneu.22569 · Cited by 97
Deciphering Resting Microglial Morphology and Process Motility from a Synaptic Prospect
Hristovska, I., & Pascual, O. (2016) · Frontiers in Integrative Neuroscience · doi:10.3389/fnint.2015.00073 · Cited by 92
Ohsawa, K., & Kohsaka, S. (2011) · Glia · doi:10.1002/glia.21238 · Cited by 92
Metadata
- Authors
- Fontainhas, A. M., Wang, M., Liang, K. J., Chen, S., Mettu, P., Damani, M., Fariss, R. N., Li, W., & Wong, W. T.
- Affiliations
- National Institutes of Health (US)
- Corresponding author
- Wong, Wai T.
- Venue
- PLoS ONE
- Publisher
- Public Library of Science (PLoS)
- Published
- 2011-01-25
- Volume
- 6
- Issue
- 1
- Pages
- e15973
- ISSN
- 1932-6203 (ISSN-L)
- PMC
- PMC3026789
- OpenAlex
- W1997602206
- Cited by
- 334
- References
- 57
- Citations by year
- 2026: 8 · 2025: 12 · 2024: 15 · 2023: 18 · 2022: 20 · 2021: 44 · 2020: 30 · 2019: 28 · 2018: 19 · 2017: 27 · 2016: 28 · 2015: 21 · 2014: 20 · 2013: 24 · 2012: 12
- FWCI
- 11.32
- Type
- journal article
- Language
- en
- Open access
- gold
- doi.org
- Licence
- Locations
- PLoS ONE (publishedVersion, public-domain)
- PubMed Central (publishedVersion, public-domain)
- PubMed (publishedVersion)
- DOAJ (DOAJ: Directory of Open Access Journals) (submittedVersion, cc-by-sa)
- Figshare (submittedVersion, cc-by)
- Funders
- National Eye Institute
- Topics
- Life Sciences › Neuroscience › Neurology › Neuroinflammation and Neurodegeneration Mechanisms
- Life Sciences › Neuroscience › Cellular and Molecular Neuroscience › Neuroscience and Neuropharmacology Research
- Health Sciences › Medicine › Radiology, Nuclear Medicine and Imaging › Retinal Imaging and Analysis
- Keywords
- microglia, microglial morphology, microglial motility, resting microglia, retinal microglia, extracellular ATP, glutamate receptors, neuroimmune signaling, neurodegenerative diseases
- MeSH terms
- Animals, Immune System, Synaptic Transmission, Retina, Microglia, Receptors, GABA, Microscopy, Video, Cell Shape, Green Fluorescent Proteins, Mice, Receptors, Ionotropic Glutamate, In Vitro Techniques
About these checks
Registry, retraction, Cites and statistics results are computed, not judged, with one exception: a printed reference that no index lists is read once by a model before it counts as a citation error. Claims are extracted by a model and kept only when their quote appears verbatim in the text; each cited source is then checked, with a model’s help, for whether it says what the claim relies on. Those verdicts can be wrong — read the claim’s quote and the cited source before relying on one.
Statistics and arithmetic are recomputed, not judged.
Confidence bands are shown only for fields calibrated on our annotated test set. None is calibrated yet, so no band is shown.
What counts as a claim ›How we measure confidence ›How we check this ›
Are you an author, or do you see a problem with this page? Request a review
