

The Precision-Recall Plot Is More Informative than the ROC Plot When Evaluating Binary Classifiers on Imbalanced Datasets
Open accessThe DOI matches its Crossref record; 55 of the 56 references it cites were found in a registry or an index.
Abstract
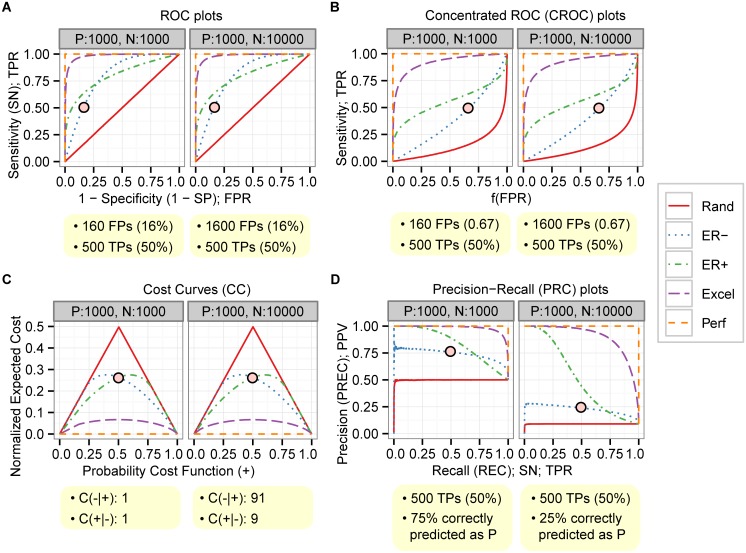
Binary classifiers are routinely evaluated with performance measures such as sensitivity and specificity, and performance is frequently illustrated with Receiver Operating Characteristics (ROC) plots. Alternative measures such as positive predictive value (PPV) and the associated Precision/Recall (PRC) plots are used less frequently. Many bioinformatics studies develop and evaluate classifiers that are to be applied to strongly imbalanced datasets in which the number of negatives outweighs the number of positives significantly. While ROC plots are visually appealing and provide an overview of a classifier's performance across a wide range of specificities, one can ask whether ROC plots could be misleading when applied in imbalanced classification scenarios. We show here that the visual interpretability of ROC plots in the context of imbalanced datasets can be deceptive with respect to conclusions about the reliability of classification performance, owing to an intuitive but wrong interpretation of specificity. PRC plots, on the other hand, can provide the viewer with an accurate prediction of future classification performance due to the fact that they evaluate the fraction of true positives among positive predictions. Our findings have potential implications for the interpretation of a large number of studies that use ROC plots on imbalanced datasets.
Overview
The claims and statistics of this paper haven’t been checked yet.
Free: it reads the open-access text and checks the first 5 claims that cite a source we can check. Create a free account to check every claim.
Integrity signals
Registry
Cites
Statistics
Figures

Verification
Claims the paper makes
The claims and statistics of this paper haven’t been checked yet.
Free: it reads the open-access text and checks the first 5 claims that cite a source we can check. Create a free account to check every claim.
Claims other papers make about this one
Each is checked against this paper’s own text: does it say what the citing paper says it does?
The cited source says what the claim attributes to it.
In the citing paper
“which is a more informative measure than ROC analysis in imbalanced scenarios59.”
From K-STAMM: a knowledge-enhanced spatial - temporal attention model with multimodal fusion for pneumonia prediction (2026) · cites this paper as [59]
The cited source says what the claim attributes to it.
In the citing paper
“When dealing with highly imbalanced data as is the case with fraud detection, AUC (and ROC curves) may be too optimistic and the Area under the Precision-Recall Curve (AUPRC) gives a more informative picture of a classifier's performance (Davis and Goadrich, 2006; Saito and Rehmsmeier, 2015; Fern´ andez et al., 2018).”
From Data engineering for fraud detection (2021) · cites this paper as Saito and Rehmsmeier, 2015
The cited source says what the claim attributes to it.
In the citing paper
“When dealing with highly imbalanced data as is the case with fraud detection, AUC (and ROC curves) may be too optimistic and the Area under the Precision-Recall Curve (AUPRC) gives a more informative picture of a classifier's performance (Davis and Goadrich, 2006; Saito and Rehmsmeier, 2015; Fern´ andez et al., 2018).”
From Data engineering for fraud detection (2021) · cites this paper as Saito and Rehmsmeier, 2015
The cited source says what the claim attributes to it.
In the citing paper
“Because extreme prediction is by definition an imbalanced classification problem, we base our analysis on precision-recall plots which are well-suited for this case [42].”
From Learning skillful medium-range global weather forecasting (2023) · cites this paper as [42]
In the citing paper
“Furthermore, careful consideration should be given when selecting evaluation metrics, as the precision-recall curve is more informative for imbalanced datasets than the most commonly used receiver-operating characteristic curve (true positive rate vs. false positive rate) (Fig. 5C).115”
From Use of artificial intelligence for liver diseases: A survey from the EASL congress 2024 (2024) · cites this paper as [115]
1 more claim about this paper
Create a free account to see every claim other papers make about this one.
Self-check
Percentages, sums and reported differences re-computed from the paper’s own numbers.
The self-check needs the paper’s full text.
Citations
Cites
LIBSVM: A library for support vector machines
Chang, C.-C., & Lin, C.-J. (2011) · ACM Transactions on Intelligent Systems and Technology · doi:10.1145/1961189.1961199 · Cited by 40,918
Bartel (2004) · doi:10.1016/s0092-8674(04)00045-5 · Cited by 34,714
SMOTE synthetic minority over-sampling technique
Chawla, N. V., Bowyer, K. W., Hall, L. O., & Kegelmeyer, W. P. (2002) · Journal of Artificial Intelligence Research · doi:10.1613/jair.953 · Cited by 32,865
An introduction to ROC analysis
Fawcett, T. (2006) · Pattern Recognition Letters · doi:10.1016/j.patrec.2005.10.010 · Cited by 21,879 · cited 3×
“Here, we review the theoretical background of commonly used evaluation measures, specifically ROC [24, 25], PRC [26], concentrated ROC (CROC) [27], and Cost Curves (CC) [28].”
BackgroundMethodThe meaning and use of the area under a receiver operating characteristic (ROC) curve.
Hanley, J. A., & McNeil, B. J. (1982) · Radiology · doi:10.1148/radiology.143.1.7063747 · Cited by 21,856
The WEKA data mining software: an update
Hall, M., Frank, E., Holmes, G., Pfahringer, B., Reutemann, P., & Witten, I. H. (2009) · ACM SIGKDD Explorations Newsletter · doi:10.1145/1656274.1656278 · Cited by 17,750
Bioconductor: open software development for computational biology and bioinformatics
Gentleman, R. C., Carey, V. J., Bates, D. M., Bolstad, B., Dettling, M., Dudoit, S., Ellis, B., Gautier, L., Ge, Y., Gentry, J., et al. (2004) · Genome Biology · doi:10.1186/gb-2004-5-10-r80 · Cited by 12,172 · cited 1×
“Several integrated machine learning and bioinformatics platforms such as WEKA [34] and Bioconductor [42, 43] also have basic functions or libraries for making ROC and PRC plots.”
MethodA training algorithm for optimal margin classifiers
Boser, B. E., Guyon, I. M., & Vapnik, V. N. (1992) · Proceedings of the fifth annual workshop on Computational learning theory · doi:10.1145/130385.130401 · Cited by 11,992
R: A Language for Data Analysis and Graphics
Ihaka, R., & Gentleman, R. (1996) · Journal of Computational and Graphical Statistics · doi:10.1080/10618600.1996.10474713 · Cited by 11,220
He, H., & Garcia, E. A. (2009) · IEEE Transactions on Knowledge and Data Engineering · doi:10.1109/tkde.2008.239 · Cited by 10,359
Cited by
Items 1,001–1,023 of 1,023
Xia, X., Zhu, C., Zhong, F., & Liu, L. (2024) · BMC Biology · doi:10.1186/s12915-024-02023-8 · Cited by 32
Muller, A. E., Ames, H. M. R., Jardim, P. S. J., & Rose, C. J. (2022) · Research Synthesis Methods · doi:10.1002/jrsm.1541 · Cited by 21
Essential guidelines for computational method benchmarking
Weber, L. M., Saelens, W., Cannoodt, R., Soneson, C., Hapfelmeier, A., Gardner, P. P., Boulesteix, A.-L., Saeys, Y., & Robinson, M. D. (2019) · Genome Biology · doi:10.1186/s13059-019-1738-8 · Cited by 21
Feng, S.-H., Xia, C.-Q., & Shen, H.-B. (2022) · Bioinformatics · doi:10.1093/bioinformatics/btab744 · Cited by 21
Khan, K. S., Fawzy, M., & Chien, P. F. W. (2023) · International Journal of Gynecology & Obstetrics · doi:10.1002/ijgo.14837 · Cited by 20
Using deep learning and electronic health records to detect Noonan syndrome in pediatric patients
Yang, Z., Shikany, A., Ni, Y., Zhang, G., Weaver, K. N., & Chen, J. (2022) · Genetics in Medicine · doi:10.1016/j.gim.2022.08.002 · Cited by 20
Current challenges in adopting machine learning to critical care and emergency medicine
Kang, C.-Y., & Yoon, J. H. (2023) · Clinical and Experimental Emergency Medicine · doi:10.15441/ceem.23.041 · Cited by 20
Uyeda, A. M., Curtis, J. R., Engelberg, R. A., Brumback, L. C., Guo, Y., Sibley, J., Lober, W. B., Cohen, T., Torrence, J., Heywood, J., et al. (2022) · Journal of Pain and Symptom Management · doi:10.1016/j.jpainsymman.2022.02.006 · Cited by 19
Lai, D. K.-H., Cheng, E. S.-W., So, B. P.-H., Mao, Y.-J., Cheung, S. M.-Y., Cheung, D. S. K., Wong, D. W.-C., & Cheung, J. C.-W. (2023) · Mathematics · doi:10.3390/math11143081 · Cited by 18
Maarseveen, T. D., Glas, H. K., Veris-van Dieren, J., van den Akker, E., & Knevel, R. (2025) · npj Digital Medicine · doi:10.1038/s41746-025-01495-4 · Cited by 17
Interpretable Unsupervised Anomaly Detection For RAN Cell Trace Analysis
Chawla, A., Jacob, P., Feghhi, S., Rughwani, D., van der Meer, S., & Fallon, S. (2020) · 2020 16th International Conference on Network and Service Management (CNSM) · doi:10.23919/cnsm50824.2020.9269108 · Cited by 14
“The AUROC [27] (Area Under Receiver Operating Characteristic) and AUPR (Area Under Precision-Recall) are holistic metrics that summarize the performance of a detection method across multiple thresholds.”
MethodDadabhoy, F. Z., Driver, L., McEvoy, D. S., Stevens, R., Rubins, D., & Dutta, S. (2023) · Annals of Emergency Medicine · doi:10.1016/j.annemergmed.2022.11.012 · Cited by 10
Ahmad, I., & Ahmed, T. (2026) · Sustainability · doi:10.3390/su18020794 · Cited by 9
Nafea, M. S., & Ismail, Z. H. (2025) · AI · doi:10.3390/ai6060120 · Cited by 8
Langer, B. E., Roscito, J. G., & Hiller, M. (2018) · Molecular Biology and Evolution · doi:10.1093/molbev/msy187 · Cited by 8
Martin, K., Adam, O., Obin, N., & Dufour, V. (2022) · doi:10.1101/2022.02.19.481011 · Cited by 6
Ke, J. X. C., McIsaac, D. I., George, R. B., Branco, P., Cook, E. F., Beattie, W. S., Urquhart, R., & MacDonald, D. B. (2022) · Canadian Journal of Anesthesia/Journal canadien d'anesthésie · doi:10.1007/s12630-022-02287-0 · Cited by 6
Generative Medical Event Models Improve with Scale
Waxler, S., Blazek, P., White, D., Sneider, D., Chung, K., Nagarathnam, M., Williams, P., Voeller, H., Wong, K., Swanhorst, M., et al. (2025) · arXiv · doi:10.48550/arxiv.2508.12104 · Cited by 4
Genome-scale annotation of protein binding sites via language model and geometric deep learning
(2023) · doi:10.1101/2023.11.02.565344 · Cited by 2
Anbukkarasi, S., Hemalatha, S., Balakrishnan, A., Varadhaganapathy, S., & Easwaramoorthy, S. V. (2026) · Scientific reports · doi:10.1038/s41598-026-47146-w · Cited by 1
“…was chosen as a threshold, independent measure of discriminative ability: where As pneumonia prediction was a problem with class imbalance, the main focus was on the Area Under the Precision Recall Curve (AUPRC): which is a more informative measure than ROC analysis in imbalanced scenarios 59 .”
Jiang, W., Bronk, G., Lake, M. T., Hoffman, N., Zar, H. J., Breen, M. S., Stein, D. J., Koen, N., Ressler, K. J., & Klengel, T. (2026) · American Journal of Psychiatry · doi:10.1176/appi.ajp.20251098
Genome-scale annotation of protein binding sites via language model and geometric deep learning
Yuan, Q., Tian, C., & Yang, Y. (2024) · doi:10.7554/elife.93695.2
Senchaki, N., & Rokhim, R. (2026) · Journal of Accounting and Finance Management · doi:10.38035/jafm.v7i2.3266
Metadata
- Authors
- Saito, T., & Rehmsmeier, M.
- Affiliations
- University of Bergen (NO)
- Corresponding author
- Saito, Takaya
- Rehmsmeier, Marc
- Venue
- PLOS ONE
- Publisher
- Public Library of Science (PLoS)
- Published
- 2015-03-04
- Volume
- 10
- Issue
- 3
- Pages
- e0118432
- ISSN
- 1932-6203 (ISSN-L)
- PMC
- PMC4349800
- OpenAlex
- W1966716734
- Cited by
- 5,309
- References
- 56
- Citations by year
- 2026: 1482 · 2025: 762 · 2024: 528 · 2023: 505 · 2022: 551 · 2021: 563 · 2020: 402 · 2019: 283 · 2018: 133 · 2017: 64 · 2016: 27 · 2015: 3
- FWCI
- 74.84
- Type
- journal article
- Language
- en
- Open access
- gold
- doi.org
- Licence
- Locations
- PLoS ONE (publishedVersion, cc-by)
- Europe PMC (PubMed Central) (publishedVersion, cc-by)
- PubMed Central (publishedVersion, cc-by)
- PubMed (publishedVersion)
- RePEc: Research Papers in Economics (submittedVersion)
- DOAJ (DOAJ: Directory of Open Access Journals) (submittedVersion, cc-by-sa)
- Funders
- Universitetet i Bergen
- Topics
- Physical Sciences › Computer Science › Artificial Intelligence › Imbalanced Data Classification Techniques
- Physical Sciences › Computer Science › Artificial Intelligence › Machine Learning and Data Classification
- Physical Sciences › Mathematics › Statistics and Probability › Statistical Methods in Epidemiology
- Keywords
- class imbalance, binary classification, classifier evaluation, specificity, positive predictive value, sensitivity, bioinformatics classification, visual interpretability
- MeSH terms
- Classification, ROC Curve, Datasets as Topic
About these checks
Registry, retraction, Cites and statistics results are computed, not judged, with one exception: a printed reference that no index lists is read once by a model before it counts as a citation error. Claims are extracted by a model and kept only when their quote appears verbatim in the text; each cited source is then checked, with a model’s help, for whether it says what the claim relies on. Those verdicts can be wrong — read the claim’s quote and the cited source before relying on one.
Statistics and arithmetic are recomputed, not judged.
Confidence bands are shown only for fields calibrated on our annotated test set. None is calibrated yet, so no band is shown.
What counts as a claim ›How we measure confidence ›How we check this ›
Are you an author, or do you see a problem with this page? Request a review
Data sources
Bibliographic data: Semantic Scholar, OpenAlex, Crossref.
Contains information from the Semantic Scholar Academic Graph Datasets, made available under the ODC Attribution License (ODC-BY 1.0).
Semantic Scholar’s data is described in: Kinney, R., et al. (2023). The Semantic Scholar Open Data Platform. arXiv:2301.10140.
