

The DOI matches its Crossref record; 69 of the 70 references it cites were found in a registry or an index; none of the 50 sources its claims cite is checked for support yet.
Combined Effects of Time Spent in Physical Activity, Sedentary Behaviors and Sleep on Obesity and Cardio-Metabolic Health Markers: A Novel Compositional Data Analysis Approach
Open accessAbstract
The associations between time spent in sleep, sedentary behaviors (SB) and physical activity with health are usually studied without taking into account that time is finite during the day, so time spent in each of these behaviors are codependent. Therefore, little is known about the combined effect of time spent in sleep, SB and physical activity, that together constitute a composite whole, on obesity and cardio-metabolic health markers. Cross-sectional analysis of NHANES 2005-6 cycle on N = 1937 adults, was undertaken using a compositional analysis paradigm, which accounts for this intrinsic codependence. Time spent in SB, light intensity (LIPA) and moderate to vigorous activity (MVPA) was determined from accelerometry and combined with self-reported sleep time to obtain the 24 hour time budget composition. The distribution of time spent in sleep, SB, LIPA and MVPA is significantly associated with BMI, waist circumference, triglycerides, plasma glucose, plasma insulin (all p<0.001), and systolic (p<0.001) and diastolic blood pressure (p<0.003), but not HDL or LDL. Within the composition, the strongest positive effect is found for the proportion of time spent in MVPA. Strikingly, the effects of MVPA replacing another behavior and of MVPA being displaced by another behavior are asymmetric. For example, re-allocating 10 minutes of SB to MVPA was associated with a lower waist circumference by 0.001% but if 10 minutes of MVPA is displaced by SB this was associated with a 0.84% higher waist circumference. The proportion of time spent in LIPA and SB were detrimentally associated with obesity and cardiovascular disease markers, but the association with SB was stronger. For diabetes risk markers, replacing SB with LIPA was associated with more favorable outcomes. Time spent in MVPA is an important target for intervention and preventing transfer of time from LIPA to SB might lessen the negative effects of physical inactivity.
Overview
AI snapshot
Written from the paper’s full text.
TL;DR
Using NHANES 2005–6 data on 1,937 adults, this study applies compositional data analysis to the 24-hour time budget of sleep, sedentary behavior (SB), light activity (LIPA), and moderate-to-vigorous activity (MVPA). The overall composition is associated with most obesity and cardiometabolic markers, with MVPA generally favorable, SB detrimental, and effects of reallocating time being asymmetric.
Key findings
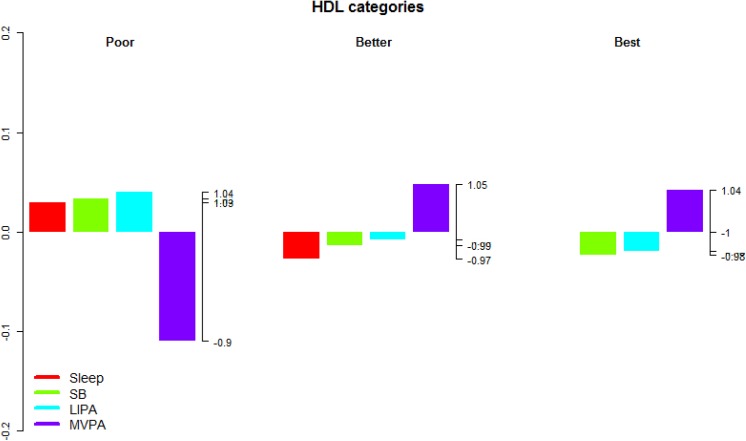
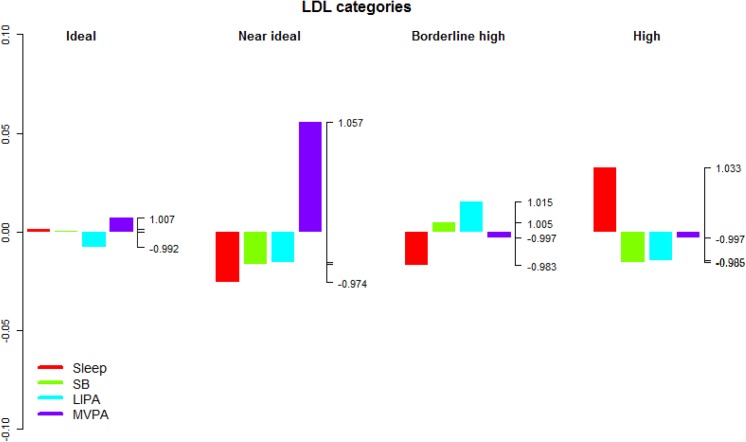
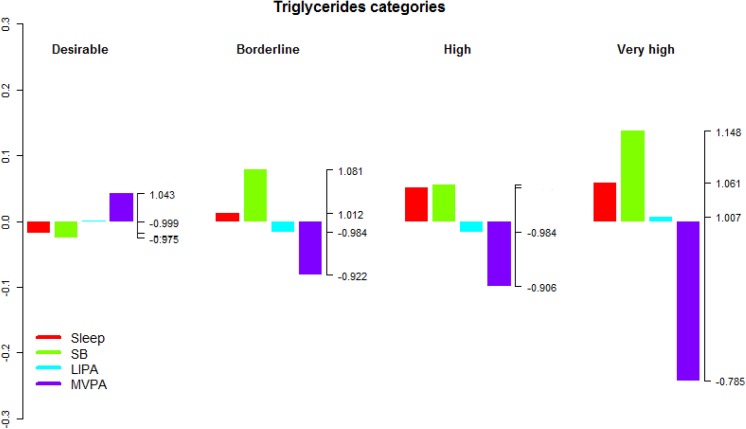
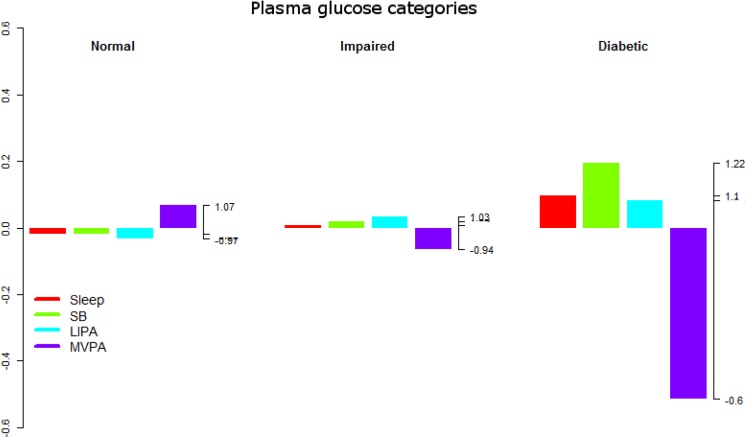
- The 24-hour composition of sleep, SB, LIPA, and MVPA was significantly associated with BMI, waist circumference, triglycerides, plasma glucose, plasma insulin, HOMA, systolic blood pressure (all p<0.001), and diastolic blood pressure (p=0.003), but not HDL (p=0.121) or LDL (p=0.434).
- Within the composition, MVPA showed the strongest favorable associations; for example, MVPA was associated with lower waist circumference (B = -2.96, p<0.001) and lower BMI (B = -0.98, p<0.001), while SB was associated with higher waist circumference (B = 2.41, p=0.023) and higher BMI (B = 1.40, p=0.002).
- Reallocating 10 minutes was asymmetric: replacing 10 minutes of SB with MVPA was associated with 0.001% lower waist circumference, whereas displacing 10 minutes of MVPA with SB was associated with 0.84% higher waist circumference. For BMI, displacing 10 minutes of MVPA with SB changed BMI by 1.21%, while the opposite change was -0.001%.
- For diabetes risk markers, replacing SB with LIPA was associated with more favorable outcomes; LIPA contrasted favorably with other behaviors for triglycerides (B = -0.21, p<0.001), plasma insulin (B = -0.13, p=0.033), and HOMA (B = -0.15, p=0.020).
Methods
- Secondary cross-sectional analysis of NHANES 2005–6, including adults aged 21–64 with at least 5 valid days of accelerometry data; N=1,937 were available for analysis.
- Sleep was self-reported; SB, LIPA, and MVPA were measured with an Actigraph 7164 accelerometer and classified using count thresholds (<100, 100–1951, and ≥1952 counts/min, respectively), then expressed as proportions of 24 hours and normalized to sum to one.
- Compositional data analysis used isometric log-ratio transformations in linear regression models (CODA), compared with single-behavior models (SINGLE), and estimated effects of 10-minute time reallocations; confounders were retained by backward elimination if p<0.2, with analyses in R 3.1.1.
Limitations
- The paper states that objective sleep data were unavailable, sleep was self-reported only for week/workdays while accelerometry was averaged over the whole week, and this likely introduced random error.
- The paper states that accelerometer thresholds are less accurate for distinguishing SB from LIPA, that different thresholds might lead to different results, and that data loss from the full NHANES sample was around 50%, affecting representativity.
- The paper states that cross-sectional analysis limits causal inference and that estimated effects reflect population shifts in time distribution rather than actual individual effects; it also notes that absolute estimates depend on confounding-variable values, though trends remained similar.
Model-written summary. Check it against the paper before relying on it.
Integrity signals
Registry
Cites
Statistics
Figures
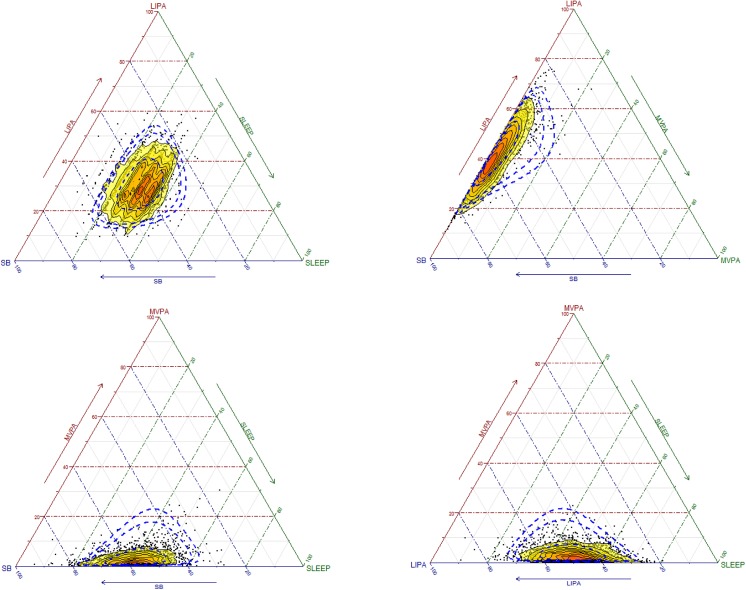
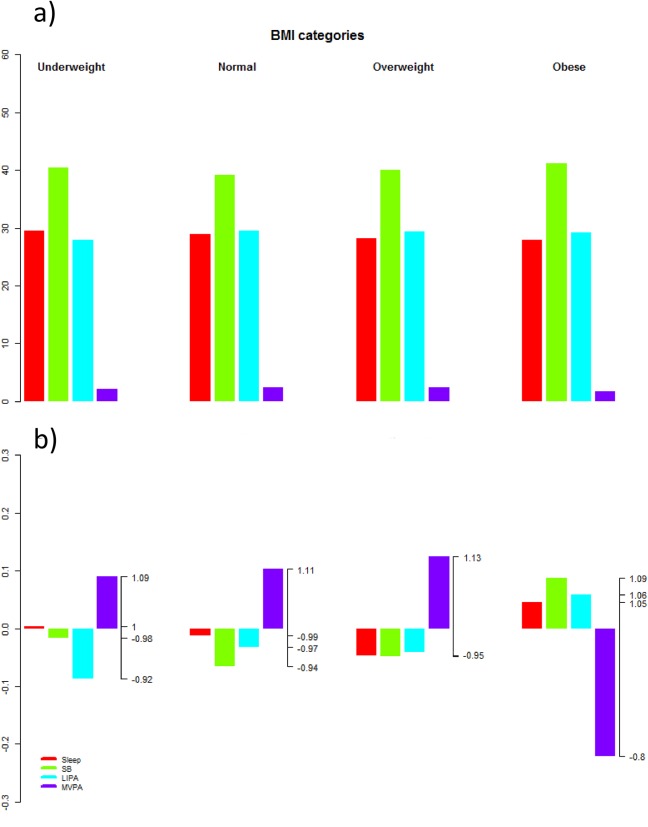
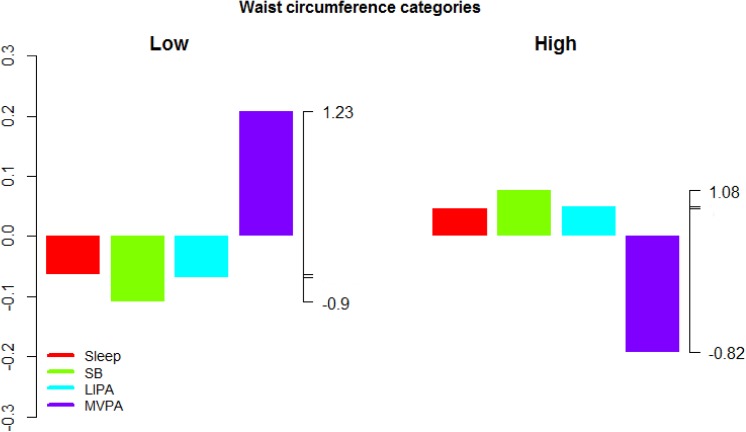
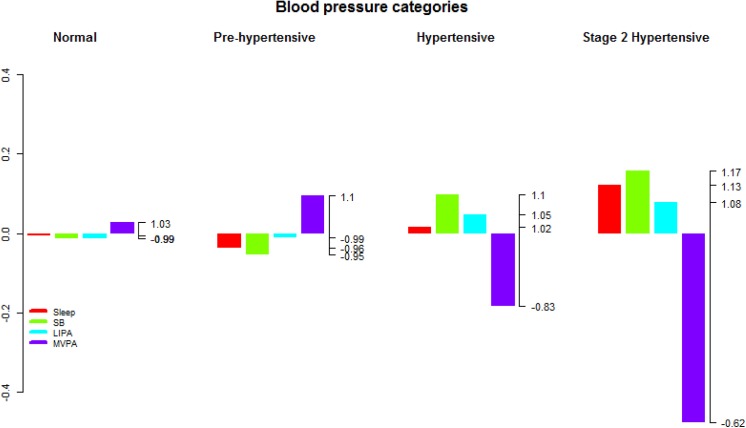
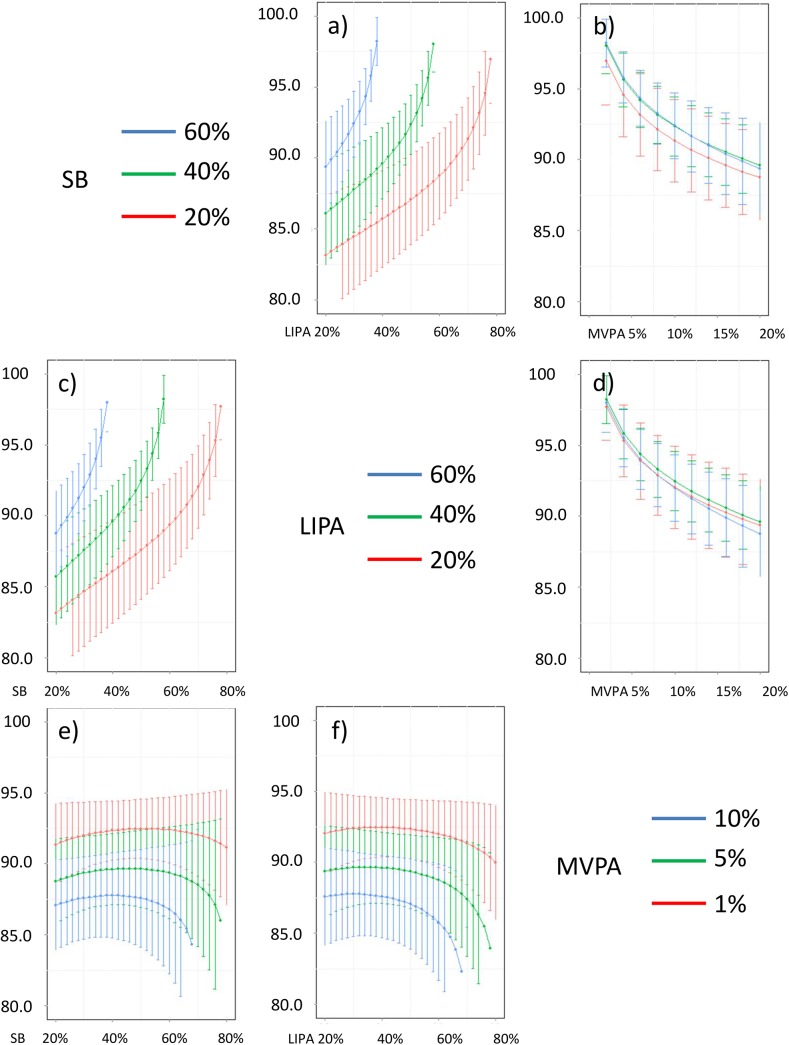
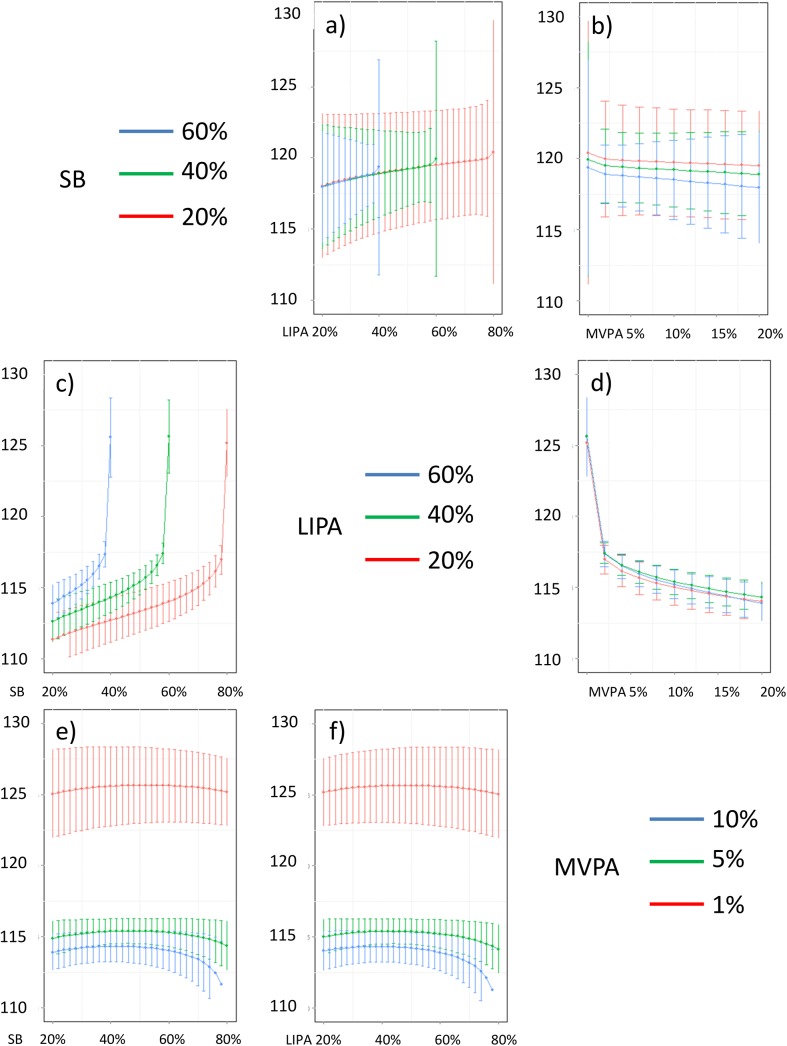
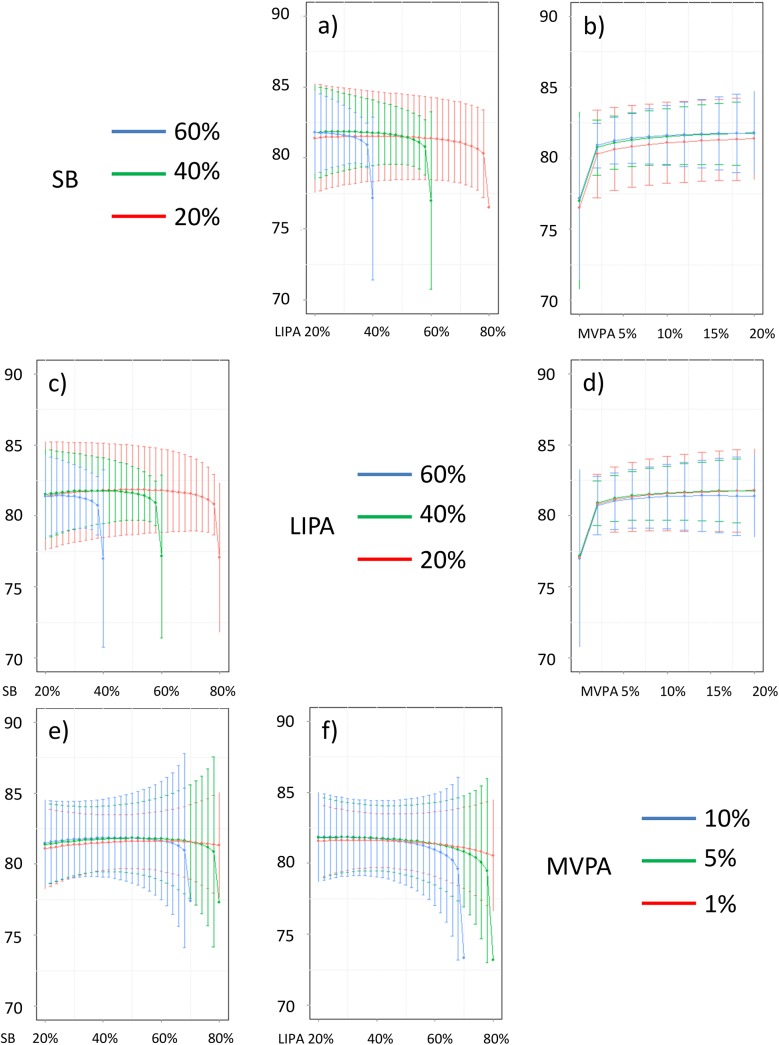
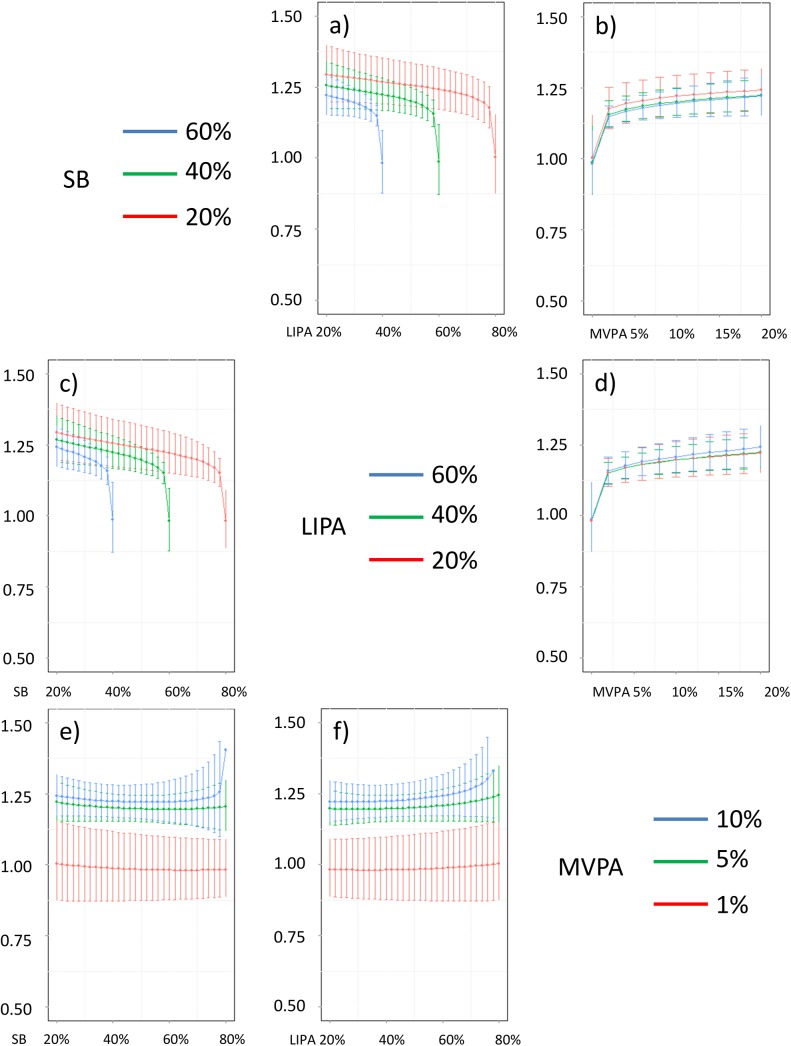
Verification
Claims the paper makes
64 Own result · 26 Not checked yet · 19 Own interpretation · 7 No basis given · 5 Own method
A result the paper reports from its own data — it cites no other source for it, so there is none to check. The quote shows it is in the paper.
In the paper
“Within the composition, the strongest positive effect is found for the proportion of time spent in MVPA.”
§ Combined Effects of Time Spent in Physical Activity, Sedentary Behaviors and Sleep on Obesity and Cardio-Metabolic Health Markers: A Novel Compositional Data Analysis Approach > Abstract
plaincorrelationaln = 1,937- Asserted: passes — The authors put it forward as true.
- Checkable: passes — It can be checked against evidence.
- Load-bearing: passes — The paper’s conclusions depend on it.
- Based: passes — The paper gives a reason why it holds.
A result the paper reports from its own data — it cites no other source for it, so there is none to check. The quote shows it is in the paper.
In the paper
“The distribution of time spent in sleep, SB, LIPA and MVPA is significantly associated with BMI, waist circumference, triglycerides, plasma glucose, plasma insulin (all p<0.001), and systolic (p<0.001) and diastolic blood pressure (p<0.003), but not HDL or LDL.”
- Also stated in: § Linear regression models · plain
“The CODA models show that the relative distribution of time amongst the four behaviors as a whole is statistically significantly associated with all outcomes (BMI p<0.001, waist circumference p<0.001, systolic blood pressure p<0.001, diastolic blood pressure p = 0.003, triglycerides p<0.001, plasma glucose p<0.001, plasma insulin p<0.001, HOMA p<0.001) except cholesterol levels (HDL p = 0.121 and”
§ Combined Effects of Time Spent in Physical Activity, Sedentary Behaviors and Sleep on Obesity and Cardio-Metabolic Health Markers: A Novel Compositional Data Analysis Approach > Abstract
plainn = 1,937- Asserted: passes — The authors put it forward as true.
- Checkable: passes — It can be checked against evidence.
- Load-bearing: passes — The paper’s conclusions depend on it.
- Based: passes — The paper gives a reason why it holds.
- Rests on an assumption: Self-reported sleep duration accurately reflects actual sleep time.
- Also stated in: § Linear regression models · plain
A result the paper reports from its own data — it cites no other source for it, so there is none to check. The quote shows it is in the paper.
In the paper
“Strikingly, the effects of MVPA replacing another behavior and of MVPA being displaced by another behavior are asymmetric.”
§ Combined Effects of Time Spent in Physical Activity, Sedentary Behaviors and Sleep on Obesity and Cardio-Metabolic Health Markers: A Novel Compositional Data Analysis Approach > Abstract
plaincorrelationaln = 1,937- Asserted: passes — The authors put it forward as true.
- Checkable: passes — It can be checked against evidence.
- Load-bearing: passes — The paper’s conclusions depend on it.
- Based: passes — The paper gives a reason why it holds.
- Rests on an assumption: The absolute values of the time re-allocation estimates will vary if computed around a different starting composition, but the direction and relative size of the effects should be the same.
A result the paper reports from its own data — it cites no other source for it, so there is none to check. The quote shows it is in the paper.
In the paper
“The distribution of time spent in sleep, SB, LIPA and MVPA is significantly associated with BMI, waist circumference, triglycerides, plasma glucose, plasma insulin (all p<0.001), and systolic (p<0.001) and diastolic blood pressure (p<0.003), but not HDL or LDL.”
- Also stated in: § Linear regression models · plain
“The CODA models show that the relative distribution of time amongst the four behaviors as a whole is statistically significantly associated with all outcomes (BMI p<0.001, waist circumference p<0.001, systolic blood pressure p<0.001, diastolic blood pressure p = 0.003, triglycerides p<0.001, plasma glucose p<0.001, plasma insulin p<0.001, HOMA p<0.001) except cholesterol levels (HDL p = 0.121 and”
§ Combined Effects of Time Spent in Physical Activity, Sedentary Behaviors and Sleep on Obesity and Cardio-Metabolic Health Markers: A Novel Compositional Data Analysis Approach > Abstract
plaincorrelationaln = 1,937 ·- Asserted: passes — The authors put it forward as true.
- Checkable: passes — It can be checked against evidence.
- Load-bearing: passes — The paper’s conclusions depend on it.
- Based: passes — The paper gives a reason why it holds.
- Rests on an assumption: Self-reported sleep duration accurately reflects actual sleep time.
- Also stated in: § Linear regression models · plain
A result the paper reports from its own data — it cites no other source for it, so there is none to check. The quote shows it is in the paper.
In the paper
“The most obvious difference is found with the mean relative amount of time spent in MVPA, which is over-estimated by the arithmetic mean with respect to the compositional alternative by almost 0.7% of a day, roughly 10 minutes.”
§ Combined Effects of Time Spent in Physical Activity, Sedentary Behaviors and Sleep on Obesity and Cardio-Metabolic Health Markers: A Novel Compositional Data Analysis Approach > Results > Descriptive statistics
plain- Asserted: passes — The authors put it forward as true.
- Checkable: passes — It can be checked against evidence.
- Load-bearing: unclear — It is unclear whether the paper’s conclusions depend on it.
- Based: passes — The paper gives a reason why it holds.
A result the paper reports from its own data — it cites no other source for it, so there is none to check. The quote shows it is in the paper.
In the paper
“For diabetes risk markers, replacing SB with LIPA was associated with more favorable outcomes.”
§ Combined Effects of Time Spent in Physical Activity, Sedentary Behaviors and Sleep on Obesity and Cardio-Metabolic Health Markers: A Novel Compositional Data Analysis Approach > Abstract
plaincorrelational- Asserted: passes — The authors put it forward as true.
- Checkable: passes — It can be checked against evidence.
- Load-bearing: passes — The paper’s conclusions depend on it.
- Based: passes — The paper gives a reason why it holds.
- Rests on an assumption: The absolute values of the time re-allocation estimates will vary if computed around a different starting composition, but the direction and relative size of the effects should be the same.
A result the paper reports from its own data — it cites no other source for it, so there is none to check. The quote shows it is in the paper.
In the paper
“No parts of the composition were significantly associated with systolic blood pressure”
§ Combined Effects of Time Spent in Physical Activity, Sedentary Behaviors and Sleep on Obesity and Cardio-Metabolic Health Markers: A Novel Compositional Data Analysis Approach > Results > Linear regression models
plain- Asserted: passes — The authors put it forward as true.
- Checkable: passes — It can be checked against evidence.
- Load-bearing: unclear — It is unclear whether the paper’s conclusions depend on it.
- Based: passes — The paper gives a reason why it holds.
The paper states this without a source or data behind it here, so there is nothing to check it against. The quote shows it is in the paper.
In the paper
“The amount of variance explained varied little between the SINGLE and CODA models.”
§ Combined Effects of Time Spent in Physical Activity, Sedentary Behaviors and Sleep on Obesity and Cardio-Metabolic Health Markers: A Novel Compositional Data Analysis Approach > Results > Linear regression models
plain- Asserted: passes — The authors put it forward as true.
- Checkable: passes — It can be checked against evidence.
- Load-bearing: unclear — It is unclear whether the paper’s conclusions depend on it.
- Based: passes — The paper gives a reason why it holds.
A result the paper reports from its own data — it cites no other source for it, so there is none to check. The quote shows it is in the paper.
In the paper
“but sleep was favorably associated with diastolic blood pressure (B = -2.22, p = 0.048).”
§ Combined Effects of Time Spent in Physical Activity, Sedentary Behaviors and Sleep on Obesity and Cardio-Metabolic Health Markers: A Novel Compositional Data Analysis Approach > Results > Linear regression models
plaincorrelational- Asserted: passes — The authors put it forward as true.
- Checkable: passes — It can be checked against evidence.
- Load-bearing: unclear — It is unclear whether the paper’s conclusions depend on it.
- Based: passes — The paper gives a reason why it holds.
- Rests on an assumption: Self-reported sleep duration accurately reflects actual sleep time.
A result the paper reports from its own data — it cites no other source for it, so there is none to check. The quote shows it is in the paper.
In the paper
“Sleep time was statistically significantly associated with higher CRP (B = 0.23, p = 0.024).”
§ Combined Effects of Time Spent in Physical Activity, Sedentary Behaviors and Sleep on Obesity and Cardio-Metabolic Health Markers: A Novel Compositional Data Analysis Approach > Results > Linear regression models
plaincorrelational- Asserted: passes — The authors put it forward as true.
- Checkable: passes — It can be checked against evidence.
- Load-bearing: passes — The paper’s conclusions depend on it.
- Based: passes — The paper gives a reason why it holds.
- Rests on an assumption: Self-reported sleep duration accurately reflects actual sleep time.
- It may state two separate claims as one. 51
- Probably not a substantial claim. 13
A result the paper reports from its own data — it cites no other source for it, so there is none to check. The quote shows it is in the paper.
In the paper
“The proportion of time spent in LIPA and SB were detrimentally associated with obesity and cardiovascular disease markers, but the association with SB was stronger.”
§ Combined Effects of Time Spent in Physical Activity, Sedentary Behaviors and Sleep on Obesity and Cardio-Metabolic Health Markers: A Novel Compositional Data Analysis Approach > Abstract
plaincorrelational- Asserted: passes — The authors put it forward as true.
- Checkable: passes — It can be checked against evidence.
- Load-bearing: passes — The paper’s conclusions depend on it.
- Based: passes — The paper gives a reason why it holds.
It may state two separate claims as one.
- Rests on an assumption: The absolute values of the time re-allocation estimates will vary if computed around a different starting composition, but the direction and relative size of the effects should be the same.
A result the paper reports from its own data — it cites no other source for it, so there is none to check. The quote shows it is in the paper.
In the paper
“Both proportion of time spent in LIPA and MVPA were associated with better outcomes for waist circumference, triglycerides, plasma insulin and HOMA, with MVPA showing much higher effect sizes.”
§ Combined Effects of Time Spent in Physical Activity, Sedentary Behaviors and Sleep on Obesity and Cardio-Metabolic Health Markers: A Novel Compositional Data Analysis Approach > Results > Linear regression models
plaincorrelational- Asserted: passes — The authors put it forward as true.
- Checkable: passes — It can be checked against evidence.
- Load-bearing: passes — The paper’s conclusions depend on it.
- Based: passes — The paper gives a reason why it holds.
It may state two separate claims as one.
A result the paper reports from its own data — it cites no other source for it, so there is none to check. The quote shows it is in the paper.
In the paper
“and sleep deleteriously associated with triglycerides (B = 0.17, p = 0.018), CRP (B = 0.23, p = 0.024) and plasma glucose (B = 0.04, p = 0.044).”
§ Combined Effects of Time Spent in Physical Activity, Sedentary Behaviors and Sleep on Obesity and Cardio-Metabolic Health Markers: A Novel Compositional Data Analysis Approach > Results > Linear regression models
plaincorrelational- Asserted: passes — The authors put it forward as true.
- Checkable: passes — It can be checked against evidence.
- Load-bearing: passes — The paper’s conclusions depend on it.
- Based: passes — The paper gives a reason why it holds.
It may state two separate claims as one.
- Rests on an assumption: Self-reported sleep duration accurately reflects actual sleep time.
A result the paper reports from its own data — it cites no other source for it, so there is none to check. The quote shows it is in the paper.
In the paper
“Less variance was explained by the models for BMI (R2 adj = 0.10), waist circumference (R2 adj = 0.12), diastolic blood pressure (R2 adj = 0.12), triglycerides (R2 adj = 0.12) and very little for LDL (R2 adj = 0.04).”
§ Combined Effects of Time Spent in Physical Activity, Sedentary Behaviors and Sleep on Obesity and Cardio-Metabolic Health Markers: A Novel Compositional Data Analysis Approach > Results > Linear regression models
plain- Asserted: passes — The authors put it forward as true.
- Checkable: passes — It can be checked against evidence.
- Load-bearing: unclear — It is unclear whether the paper’s conclusions depend on it.
- Based: passes — The paper gives a reason why it holds.
It may state two separate claims as one.
A result the paper reports from its own data — it cites no other source for it, so there is none to check. The quote shows it is in the paper.
In the paper
“For BMI, the proportion of time spent in each behavior compared to the other three was statistically significantly detrimentally associated with SB (B = 1.40, p = 0.002) and LIPA (B = 0.98 and p = 0.029) but favorably with sleep (B = -1.40, p = 0.009) and MVPA (B = -0.098, p<0.001).”
§ Combined Effects of Time Spent in Physical Activity, Sedentary Behaviors and Sleep on Obesity and Cardio-Metabolic Health Markers: A Novel Compositional Data Analysis Approach > Results > Linear regression models
plaincorrelational- Asserted: passes — The authors put it forward as true.
- Checkable: passes — It can be checked against evidence.
- Load-bearing: passes — The paper’s conclusions depend on it.
- Based: passes — The paper gives a reason why it holds.
It may state two separate claims as one.
- Rests on an assumption: Self-reported sleep duration accurately reflects actual sleep time.
A result the paper reports from its own data — it cites no other source for it, so there is none to check. The quote shows it is in the paper.
In the paper
“For example, the variance of log(sleep/SB) is 0.148, which reflects the highest (proportional) relationship or co-dependence (not correlation in the usual sense) between two behaviors.”
§ Combined Effects of Time Spent in Physical Activity, Sedentary Behaviors and Sleep on Obesity and Cardio-Metabolic Health Markers: A Novel Compositional Data Analysis Approach > Results > Descriptive statistics
plaincorrelational- Asserted: passes — The authors put it forward as true.
- Checkable: passes — It can be checked against evidence.
- Load-bearing: unclear — It is unclear whether the paper’s conclusions depend on it.
- Based: passes — The paper gives a reason why it holds.
It may state two separate claims as one.
None of the sources cited for this claim have been checked yet.
In the paper
“The models’ fit to the data was in line with previous reports [1,6,10,14–17], with moderate amount of variance explained for systolic blood pressure (R2 adj = 0.21), HDL (R2 adj = 0.22), CRP (R2 adj = 0.26), plasma glucose (R2 adj = 0.33), insulin (R2 adj = 0.40) and HOMA (R2 adj = 0.42).”
§ Combined Effects of Time Spent in Physical Activity, Sedentary Behaviors and Sleep on Obesity and Cardio-Metabolic Health Markers: A Novel Compositional Data Analysis Approach > Results > Linear regression models
What the sources say
- Not checked yetcites [1] P Bansil, 2011, Associations between sleep disorders, sleep duration, quality of sleep, and hypertension: results from the National Health and Nutrition Examination Survey, 2005 to 2008, J Clin Hypertens source
- Not checked yetcites [6] GN Healy, 2011, Sedentary time and cardio-metabolic biomarkers in US adults: NHANES 2003–06, Eur Heart J source
- Not checked yetcites [10] C Maher, 2014, Reconsidering the Sedentary Behaviour Paradigm. Johannsen D, editor, PLoS One source
- Not checked yetcites [14] MP Buman, 2014, Reallocating time to sleep, sedentary behaviors, or active behaviors: associations with cardiovascular disease risk biomarkers, NHANES 2005–2006, Am J Epidemiol source
- Not checked yetcites [15] CE Matthews, 2008, Amount of time spent in sedentary behaviors in the United States, 2003–2004, Am J Epidemiol source
- Not checked yetcites [16] PD Loprinzi, 2014, Daily movement patterns and biological markers among adults in the United States, Prev Med (Baltim) source
- Not checked yetcites [17] RP Troiano, 2008, Physical activity in the United States measured by accelerometer, Med Sci Sports Exerc source
plain- Asserted: passes — The authors put it forward as true.
- Checkable: passes — It can be checked against evidence.
- Load-bearing: unclear — It is unclear whether the paper’s conclusions depend on it.
- Based: passes — The paper gives a reason why it holds.
It may state two separate claims as one.
A result the paper reports from its own data — it cites no other source for it, so there is none to check. The quote shows it is in the paper.
In the paper
“In the SINGLE models, the proportion of time spent sleeping was statistically significantly associated with higher triglycerides and CRP levels, but associated with lower BMI and diastolic blood pressure.”
§ Combined Effects of Time Spent in Physical Activity, Sedentary Behaviors and Sleep on Obesity and Cardio-Metabolic Health Markers: A Novel Compositional Data Analysis Approach > Results > Linear regression models
plaincorrelational- Asserted: passes — The authors put it forward as true.
- Checkable: passes — It can be checked against evidence.
- Load-bearing: unclear — It is unclear whether the paper’s conclusions depend on it.
- Based: passes — The paper gives a reason why it holds.
It may state two separate claims as one.
- Rests on an assumption: Self-reported sleep duration accurately reflects actual sleep time.
A result the paper reports from its own data — it cites no other source for it, so there is none to check. The quote shows it is in the paper.
In the paper
“Statistical support was obtained to conclude that the contrast between LIPA and the other behaviors was favorably associated with triglycerides (B = -0.21, p<0.001), plasma insulin (B = -0.13, p = 0.033), and HOMA (B = -0.15,p = 0.020)”
§ Combined Effects of Time Spent in Physical Activity, Sedentary Behaviors and Sleep on Obesity and Cardio-Metabolic Health Markers: A Novel Compositional Data Analysis Approach > Results > Linear regression models
boostedcorrelational- Asserted: passes — The authors put it forward as true.
- Checkable: passes — It can be checked against evidence.
- Load-bearing: passes — The paper’s conclusions depend on it.
- Based: passes — The paper gives a reason why it holds.
It may state two separate claims as one.
A result the paper reports from its own data — it cites no other source for it, so there is none to check. The quote shows it is in the paper.
In the paper
“Small positive effects were also observed on systolic and diastolic blood pressure when displacing LIPA and MVPA with sleep, with larger effects observed when sleep replaces MVPA.”
§ Combined Effects of Time Spent in Physical Activity, Sedentary Behaviors and Sleep on Obesity and Cardio-Metabolic Health Markers: A Novel Compositional Data Analysis Approach > Results > Effect of time re-allocation
plaindirect- Asserted: passes — The authors put it forward as true.
- Checkable: passes — It can be checked against evidence.
- Load-bearing: passes — The paper’s conclusions depend on it.
- Based: passes — The paper gives a reason why it holds.
It may state two separate claims as one.
A result the paper reports from its own data — it cites no other source for it, so there is none to check. The quote shows it is in the paper.
In the paper
“On the other end, it can be observed that the highest log-ratio variances all involve MVPA, which shows that time spent in MVPA is the least co-dependent on the other behaviors.”
§ Combined Effects of Time Spent in Physical Activity, Sedentary Behaviors and Sleep on Obesity and Cardio-Metabolic Health Markers: A Novel Compositional Data Analysis Approach > Results > Descriptive statistics
plaincorrelational- Asserted: passes — The authors put it forward as true.
- Checkable: passes — It can be checked against evidence.
- Load-bearing: unclear — It is unclear whether the paper’s conclusions depend on it.
- Based: passes — The paper gives a reason why it holds.
It may state two separate claims as one.
A result the paper reports from its own data — it cites no other source for it, so there is none to check. The quote shows it is in the paper.
In the paper
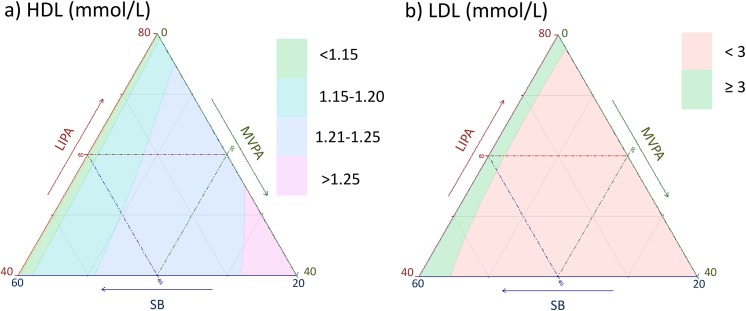
“The proportion of time spent in MVPA was associated beneficially with HDL levels (B = 0.02, p = 0.012) and this was the only part of the composition statistically significantly associated with this outcome.”
§ Combined Effects of Time Spent in Physical Activity, Sedentary Behaviors and Sleep on Obesity and Cardio-Metabolic Health Markers: A Novel Compositional Data Analysis Approach > Results > Linear regression models
plaincorrelational- Asserted: passes — The authors put it forward as true.
- Checkable: passes — It can be checked against evidence.
- Load-bearing: unclear — It is unclear whether the paper’s conclusions depend on it.
- Based: passes — The paper gives a reason why it holds.
It may state two separate claims as one.
A result the paper reports from its own data — it cites no other source for it, so there is none to check. The quote shows it is in the paper.
In the paper
“The effect of re-allocating time from one behavior to another one whilst the other two are kept stable was found to be small and not symmetric.”
§ Combined Effects of Time Spent in Physical Activity, Sedentary Behaviors and Sleep on Obesity and Cardio-Metabolic Health Markers: A Novel Compositional Data Analysis Approach > Results > Effect of time re-allocation
plain- Asserted: passes — The authors put it forward as true.
- Checkable: passes — It can be checked against evidence.
- Load-bearing: passes — The paper’s conclusions depend on it.
- Based: passes — The paper gives a reason why it holds.
It may state two separate claims as one.
A result the paper reports from its own data — it cites no other source for it, so there is none to check. The quote shows it is in the paper.
In the paper
“In our results, the relative times spent in SB and LIPA were both detrimentally associated with obesity markers, HDL, CRP and blood pressure, while MVPA showed a health enhancing relationship.”
§ Combined Effects of Time Spent in Physical Activity, Sedentary Behaviors and Sleep on Obesity and Cardio-Metabolic Health Markers: A Novel Compositional Data Analysis Approach > Discussion
plaincorrelational- Asserted: passes — The authors put it forward as true.
- Checkable: passes — It can be checked against evidence.
- Load-bearing: passes — The paper’s conclusions depend on it.
- Based: passes — The paper gives a reason why it holds.
It may state two separate claims as one.
A result the paper reports from its own data — it cites no other source for it, so there is none to check. The quote shows it is in the paper.
In the paper
“Replacing MVPA with sleep changed positively log(HDL) by 0.09%, but only 0.004% and 0.003% changes were observed when sleep replaces LIPA and SB respectively.”
§ Combined Effects of Time Spent in Physical Activity, Sedentary Behaviors and Sleep on Obesity and Cardio-Metabolic Health Markers: A Novel Compositional Data Analysis Approach > Results > Effect of time re-allocation
plaindirect- Asserted: passes — The authors put it forward as true.
- Checkable: passes — It can be checked against evidence.
- Load-bearing: passes — The paper’s conclusions depend on it.
- Based: passes — The paper gives a reason why it holds.
It may state two separate claims as one.
A result the paper reports from its own data — it cites no other source for it, so there is none to check. The quote shows it is in the paper.
In the paper
“On the contrary, LIPA had favorable effects on LDL, triglycerides, glucose, insulin and HOMA, substantially more pronounced when replacing sleep than when replacing SB.”
§ Combined Effects of Time Spent in Physical Activity, Sedentary Behaviors and Sleep on Obesity and Cardio-Metabolic Health Markers: A Novel Compositional Data Analysis Approach > Results > Effect of time re-allocation
plaindirect- Asserted: passes — The authors put it forward as true.
- Checkable: passes — It can be checked against evidence.
- Load-bearing: passes — The paper’s conclusions depend on it.
- Based: passes — The paper gives a reason why it holds.
It may state two separate claims as one.
A result the paper reports from its own data — it cites no other source for it, so there is none to check. The quote shows it is in the paper.
In the paper
“SB was found to lead to higher obesity markers if it displaced any of the other behaviors, but only by sizeable amounts if it replaced MVPA.”
§ Combined Effects of Time Spent in Physical Activity, Sedentary Behaviors and Sleep on Obesity and Cardio-Metabolic Health Markers: A Novel Compositional Data Analysis Approach > Results > Effect of time re-allocation
plaindirect- Asserted: passes — The authors put it forward as true.
- Checkable: passes — It can be checked against evidence.
- Load-bearing: passes — The paper’s conclusions depend on it.
- Based: passes — The paper gives a reason why it holds.
It may state two separate claims as one.
In the paper
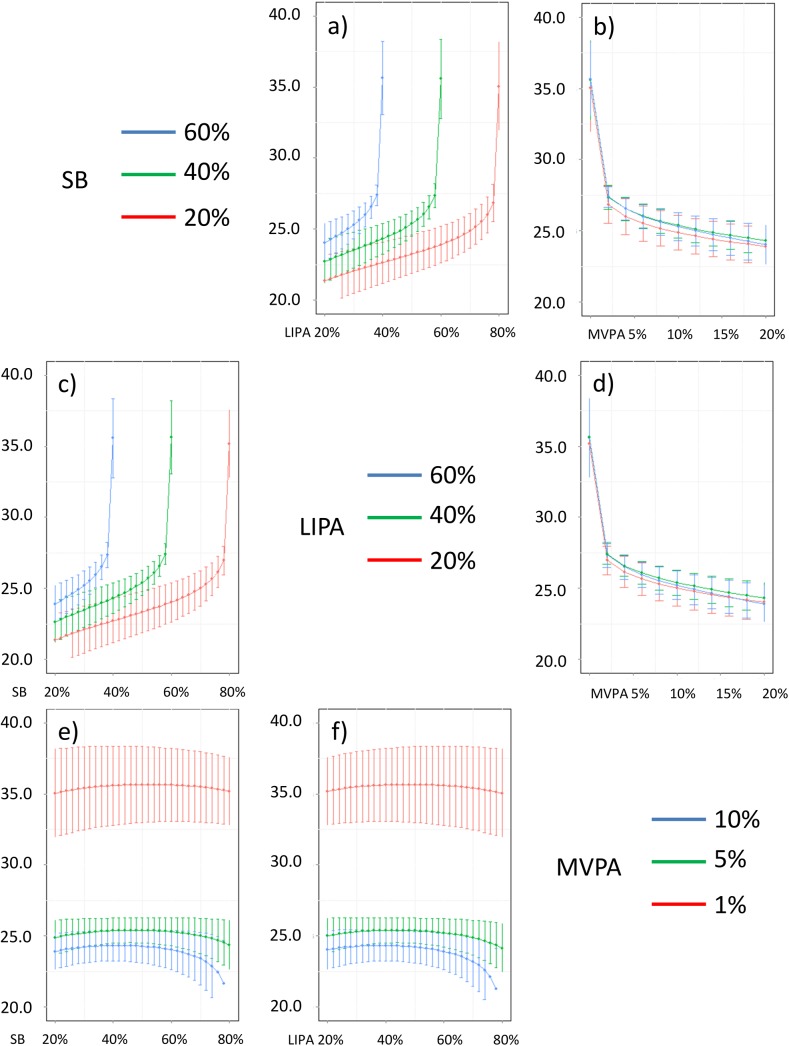
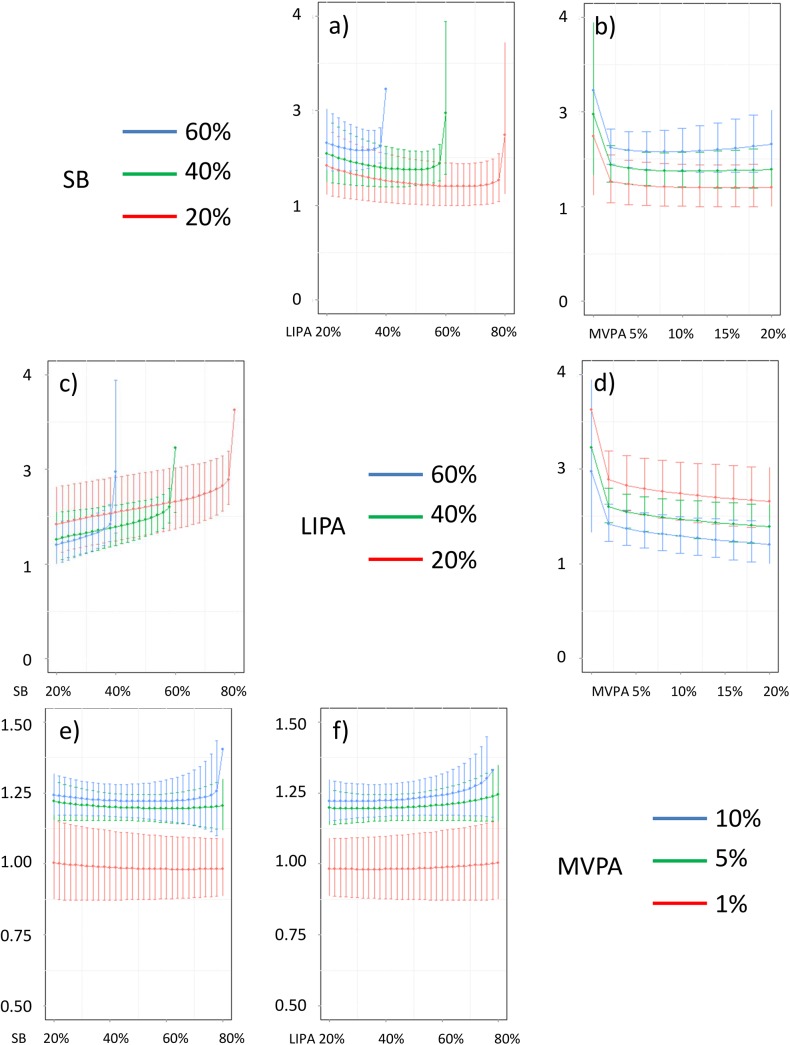
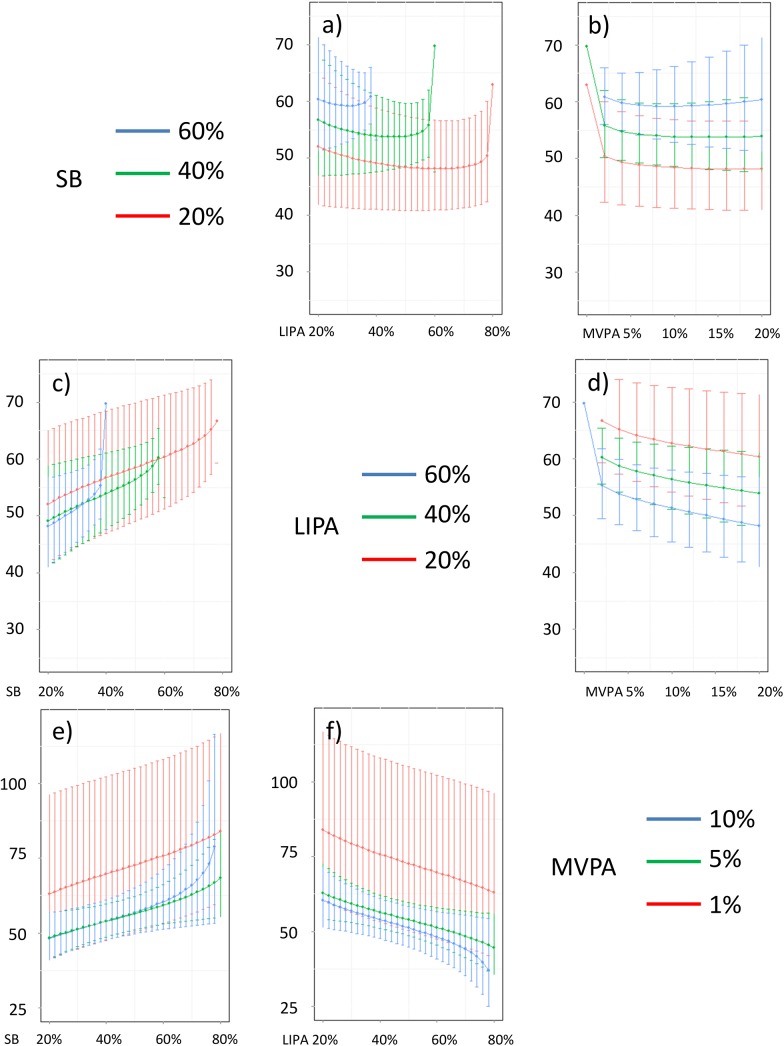
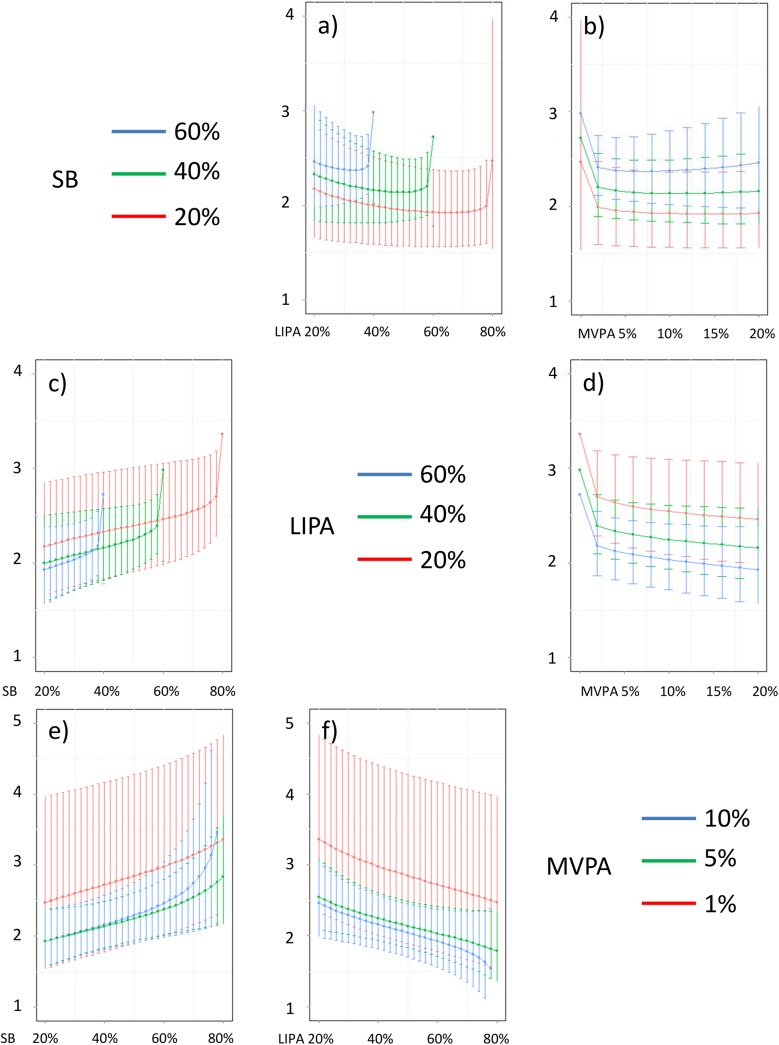
“The effect was relatively stronger at lower proportions of MVPA and weakened as the proportion of time spent on MVPA was higher, which is consistent with current evidence on dose-response [3].”
§ Combined Effects of Time Spent in Physical Activity, Sedentary Behaviors and Sleep on Obesity and Cardio-Metabolic Health Markers: A Novel Compositional Data Analysis Approach > Results > Mapping the effect of behavior compositions on cardiometabolic outcomes
What the sources say
- Not checked yetcites [3] WL Haskell, 2007, Physical activity and public health: updated recommendation for adults from the American College of Sports Medicine and the American Heart Association, Med Sci Sports Exerc source
plaincorrelational- Asserted: passes — The authors put it forward as true.
- Checkable: passes — It can be checked against evidence.
- Load-bearing: passes — The paper’s conclusions depend on it.
- Based: passes — The paper gives a reason why it holds.
It may state two separate claims as one.
A result the paper reports from its own data — it cites no other source for it, so there is none to check. The quote shows it is in the paper.
In the paper
“Detrimental effects were observed when replacing MVPA and sleep with LIPA for both obesity markers, with stronger magnitude when LIPA replaced MVPA.”
§ Combined Effects of Time Spent in Physical Activity, Sedentary Behaviors and Sleep on Obesity and Cardio-Metabolic Health Markers: A Novel Compositional Data Analysis Approach > Results > Effect of time re-allocation
plaindirect- Asserted: passes — The authors put it forward as true.
- Checkable: passes — It can be checked against evidence.
- Load-bearing: passes — The paper’s conclusions depend on it.
- Based: passes — The paper gives a reason why it holds.
It may state two separate claims as one.
A result the paper reports from its own data — it cites no other source for it, so there is none to check. The quote shows it is in the paper.
In the paper
“However the strength of the negative relationship was higher with SB than with LIPA, and in Table 4 the effect of replacing MVPA with SB was stronger than with LIPA.”
§ Combined Effects of Time Spent in Physical Activity, Sedentary Behaviors and Sleep on Obesity and Cardio-Metabolic Health Markers: A Novel Compositional Data Analysis Approach > Discussion
plaincorrelational- Asserted: passes — The authors put it forward as true.
- Checkable: passes — It can be checked against evidence.
- Load-bearing: passes — The paper’s conclusions depend on it.
- Based: passes — The paper gives a reason why it holds.
It may state two separate claims as one.
A result the paper reports from its own data — it cites no other source for it, so there is none to check. The quote shows it is in the paper.
In the paper
“These results are for 8 hours of time spent sleeping. The magnitude of the effect varied when other proportions of sleep time were considered but the trends and observed co-dependences between waking day behaviors remained unchanged.”
§ Combined Effects of Time Spent in Physical Activity, Sedentary Behaviors and Sleep on Obesity and Cardio-Metabolic Health Markers: A Novel Compositional Data Analysis Approach > Results > Mapping the effect of behavior compositions on cardiometabolic outcomes
plaincorrelational- Asserted: passes — The authors put it forward as true.
- Checkable: passes — It can be checked against evidence.
- Load-bearing: unclear — It is unclear whether the paper’s conclusions depend on it.
- Based: passes — The paper gives a reason why it holds.
It may state two separate claims as one.
A result the paper reports from its own data — it cites no other source for it, so there is none to check. The quote shows it is in the paper.
In the paper
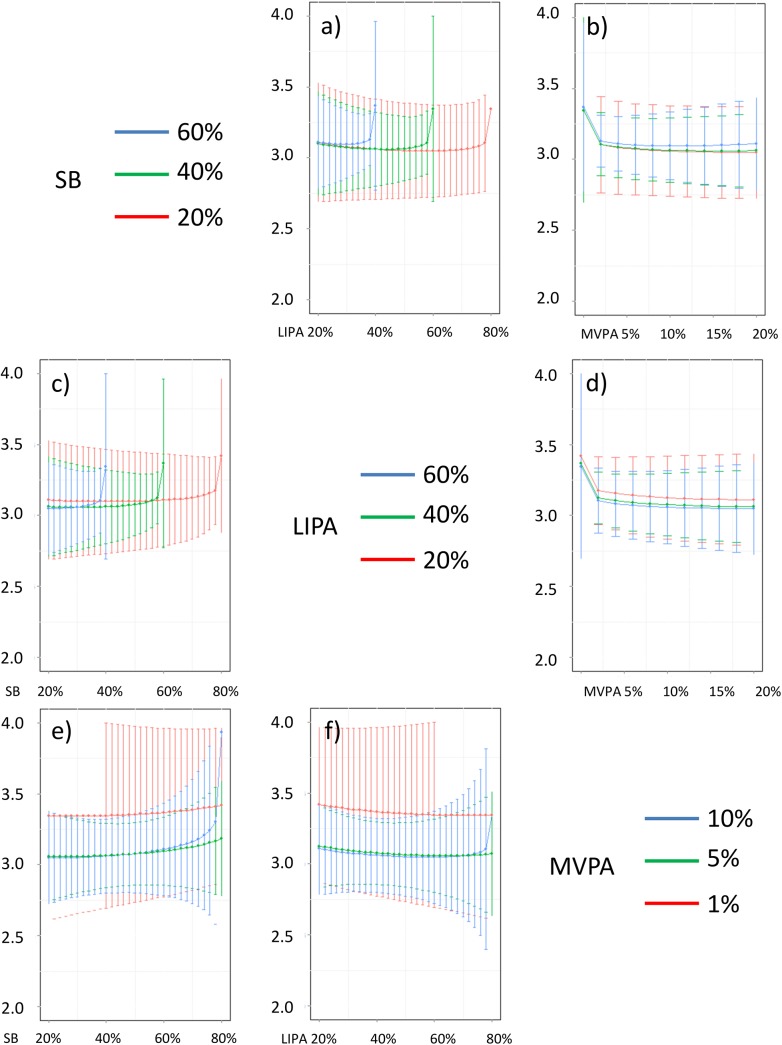
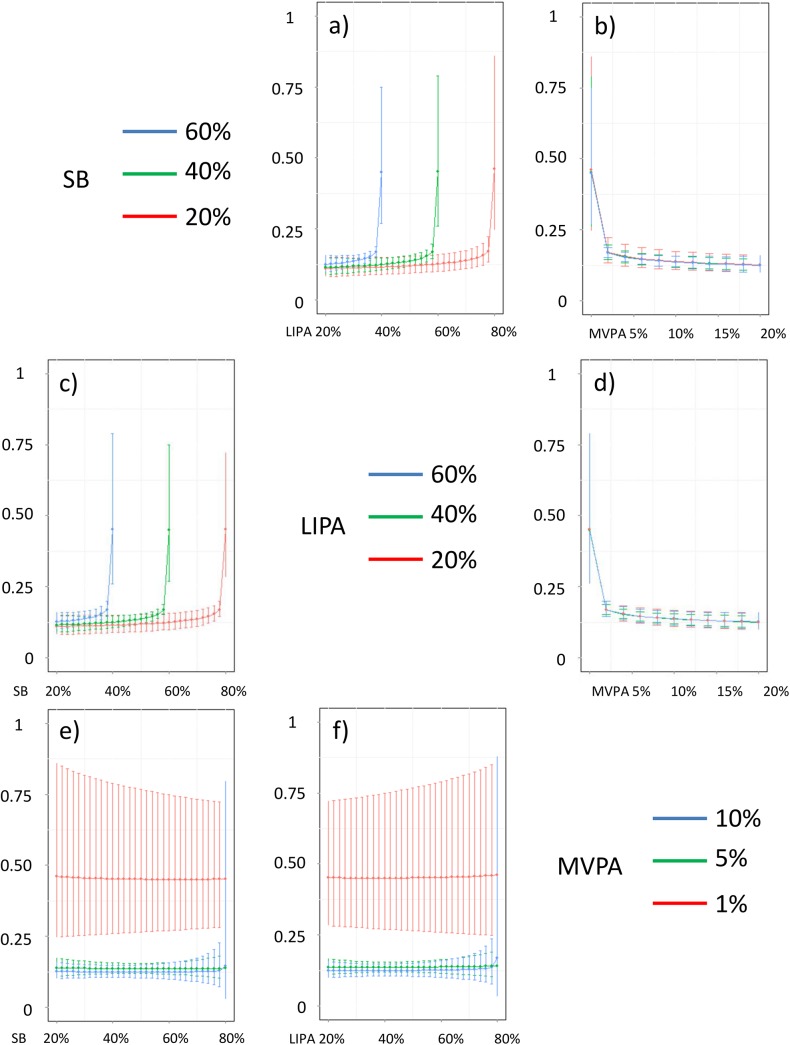
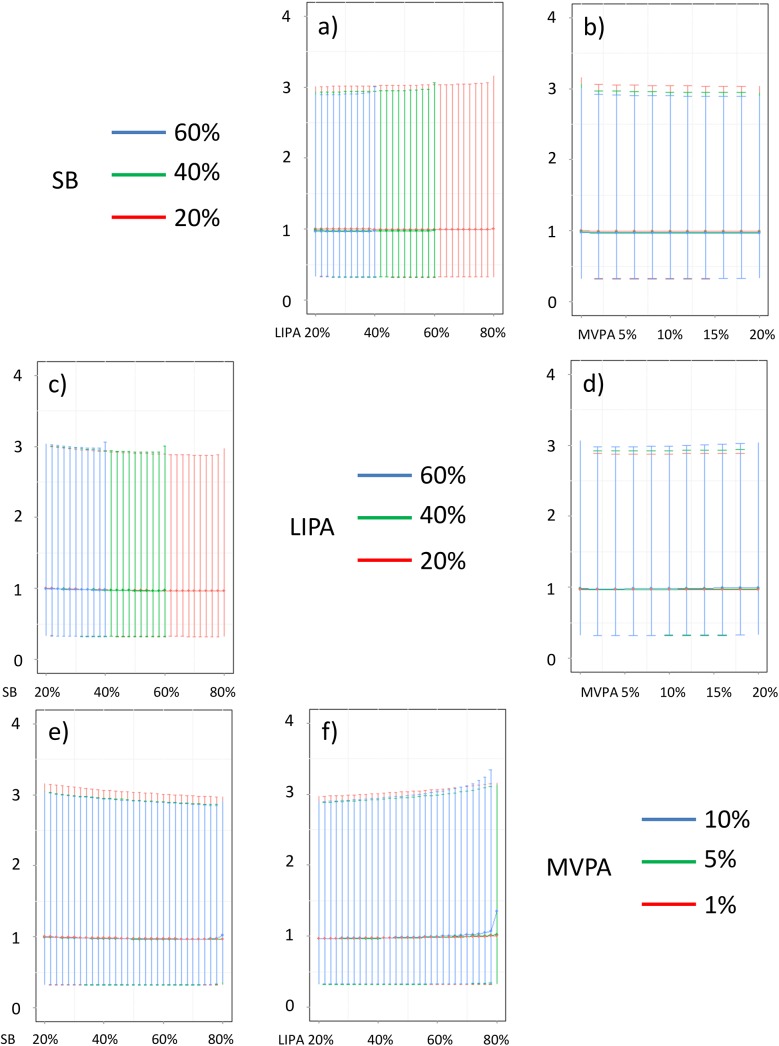
“However these effects depended on the proportion of MVPA and were strongest when LIPA replaced SB (Figs 25F and 26F).”
§ Combined Effects of Time Spent in Physical Activity, Sedentary Behaviors and Sleep on Obesity and Cardio-Metabolic Health Markers: A Novel Compositional Data Analysis Approach > Results > Mapping the effect of behavior compositions on cardiometabolic outcomes
plaincorrelational- Asserted: passes — The authors put it forward as true.
- Checkable: passes — It can be checked against evidence.
- Load-bearing: passes — The paper’s conclusions depend on it.
- Based: passes — The paper gives a reason why it holds.
It may state two separate claims as one.
A result the paper reports from its own data — it cites no other source for it, so there is none to check. The quote shows it is in the paper.
In the paper
“Re-allocating time to MVPA from the other behaviors only had very small effect, most noticeable on lipids.”
§ Combined Effects of Time Spent in Physical Activity, Sedentary Behaviors and Sleep on Obesity and Cardio-Metabolic Health Markers: A Novel Compositional Data Analysis Approach > Results > Effect of time re-allocation
plain- Asserted: passes — The authors put it forward as true.
- Checkable: passes — It can be checked against evidence.
- Load-bearing: passes — The paper’s conclusions depend on it.
- Based: passes — The paper gives a reason why it holds.
It may state two separate claims as one.
A result the paper reports from its own data — it cites no other source for it, so there is none to check. The quote shows it is in the paper.
In the paper
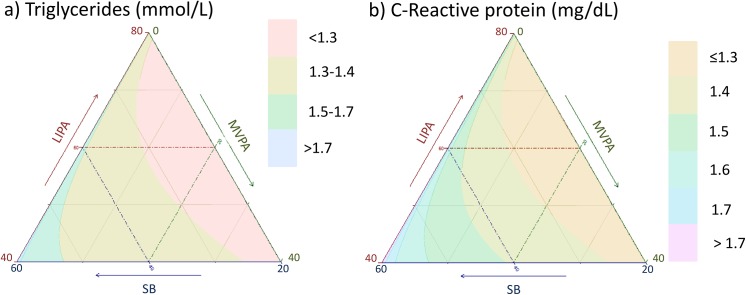
“A similar, but more pronounced, pattern was observed for CRP, with sleep reducing the log(CRP) by 2.1% when replacing MVPA, but only by 0.004% and 0.002% when displacing LIPA and SB in that order.”
§ Combined Effects of Time Spent in Physical Activity, Sedentary Behaviors and Sleep on Obesity and Cardio-Metabolic Health Markers: A Novel Compositional Data Analysis Approach > Results > Effect of time re-allocation
plaindirect- Asserted: passes — The authors put it forward as true.
- Checkable: passes — It can be checked against evidence.
- Load-bearing: passes — The paper’s conclusions depend on it.
- Based: passes — The paper gives a reason why it holds.
It may state two separate claims as one.
A result the paper reports from its own data — it cites no other source for it, so there is none to check. The quote shows it is in the paper.
In the paper
“For example, replacing 10 minutes of MVPA with 10 minutes of SB corresponded to a 1.2% higher BMI, while the opposite, replacing 10 minutes of SB with 10 minutes of MVPA, had a 1000 fold lower effect.”
§ Combined Effects of Time Spent in Physical Activity, Sedentary Behaviors and Sleep on Obesity and Cardio-Metabolic Health Markers: A Novel Compositional Data Analysis Approach > Discussion
plaindirect- Asserted: passes — The authors put it forward as true.
- Checkable: passes — It can be checked against evidence.
- Load-bearing: passes — The paper’s conclusions depend on it.
- Based: passes — The paper gives a reason why it holds.
It may state two separate claims as one.
A result the paper reports from its own data — it cites no other source for it, so there is none to check. The quote shows it is in the paper.
In the paper
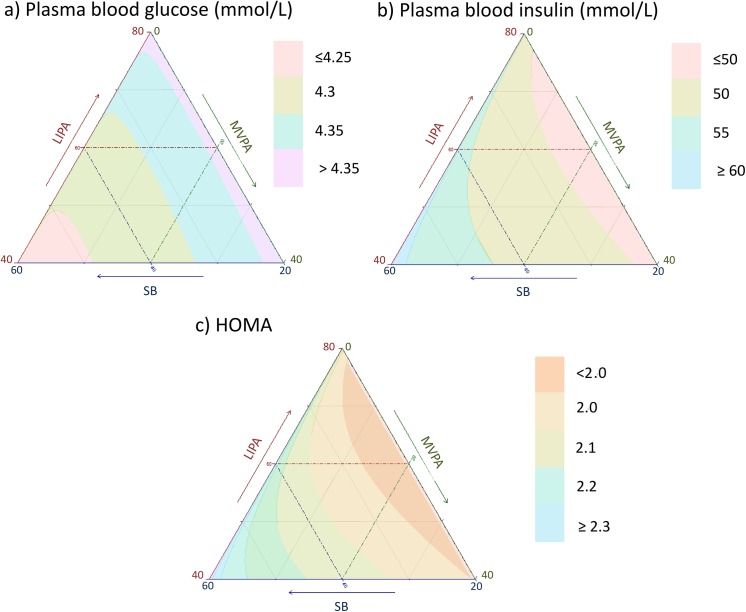
“Taken together, these plots show that MVPA positively affects all outcomes, except glucose (Figs 15 and 24) when replacing either LIPA or SB time.”
§ Combined Effects of Time Spent in Physical Activity, Sedentary Behaviors and Sleep on Obesity and Cardio-Metabolic Health Markers: A Novel Compositional Data Analysis Approach > Results > Mapping the effect of behavior compositions on cardiometabolic outcomes
plaindirect- Asserted: passes — The authors put it forward as true.
- Checkable: passes — It can be checked against evidence.
- Load-bearing: passes — The paper’s conclusions depend on it.
- Based: passes — The paper gives a reason why it holds.
It may state two separate claims as one.
A result the paper reports from its own data — it cites no other source for it, so there is none to check. The quote shows it is in the paper.
In the paper
“Finally, sleep showed detrimental effects on LDL, triglycerides, glucose and insulin level and HOMA, which were much stronger when sleep displaced MVPA.”
§ Combined Effects of Time Spent in Physical Activity, Sedentary Behaviors and Sleep on Obesity and Cardio-Metabolic Health Markers: A Novel Compositional Data Analysis Approach > Results > Effect of time re-allocation
plaindirect- Asserted: passes — The authors put it forward as true.
- Checkable: passes — It can be checked against evidence.
- Load-bearing: passes — The paper’s conclusions depend on it.
- Based: passes — The paper gives a reason why it holds.
It may state two separate claims as one.
A result the paper reports from its own data — it cites no other source for it, so there is none to check. The quote shows it is in the paper.
In the paper
“Indeed, we found that a small decrease in MVPA time has a large effect while an increase in MVPA has more moderate effects.”
§ Combined Effects of Time Spent in Physical Activity, Sedentary Behaviors and Sleep on Obesity and Cardio-Metabolic Health Markers: A Novel Compositional Data Analysis Approach > Discussion
plaindirect- Asserted: passes — The authors put it forward as true.
- Checkable: passes — It can be checked against evidence.
- Load-bearing: passes — The paper’s conclusions depend on it.
- Based: passes — The paper gives a reason why it holds.
It may state two separate claims as one.
In the paper
“and that sedentary time is detrimental to health [5].”
§ Combined Effects of Time Spent in Physical Activity, Sedentary Behaviors and Sleep on Obesity and Cardio-Metabolic Health Markers: A Novel Compositional Data Analysis Approach > Introduction > Background
What the sources say
- Not checked yetcites [5] N Owen, 2009, Too much sitting: a novel and important predictor of chronic disease risk?, Br J Sports Med source
plaindirect- Asserted: passes — The authors put it forward as true.
- Checkable: passes — It can be checked against evidence.
- Load-bearing: passes — The paper’s conclusions depend on it.
- Based: passes — The paper gives a reason why it holds.
Probably not a substantial claim.
In the paper
“There is some evidence that the influence of SB might be independent of time spent in MVPA [6]”
§ Combined Effects of Time Spent in Physical Activity, Sedentary Behaviors and Sleep on Obesity and Cardio-Metabolic Health Markers: A Novel Compositional Data Analysis Approach > Introduction > Background
What the sources say
- Not checked yetcites [6] GN Healy, 2011, Sedentary time and cardio-metabolic biomarkers in US adults: NHANES 2003–06, Eur Heart J source
hedgedconditional- Asserted: passes — The authors put it forward as true.
- Checkable: passes — It can be checked against evidence.
- Load-bearing: passes — The paper’s conclusions depend on it.
- Based: passes — The paper gives a reason why it holds.
Probably not a substantial claim.
The paper states this without a source or data behind it here, so there is nothing to check it against. The quote shows it is in the paper.
In the paper
“Indeed time is finite, in a circadian or diurnal cycle, and time spent in one behavior necessarily displaces time spent in, at least, another one.”
§ Combined Effects of Time Spent in Physical Activity, Sedentary Behaviors and Sleep on Obesity and Cardio-Metabolic Health Markers: A Novel Compositional Data Analysis Approach > Introduction > Background
plaindirect- Asserted: passes — The authors put it forward as true.
- Checkable: passes — It can be checked against evidence.
- Load-bearing: passes — The paper’s conclusions depend on it.
- Based: passes — The paper gives a reason why it holds.
Probably not a substantial claim. It may state two separate claims as one.
None of the sources cited for this claim have been checked yet.
In the paper
“Compositional data analysis is currently a mature and well-established field of statistics which has been used in diverse fields of research concerned with multivariate proportion-type data such as nutrition (e.g. fatty acid composition in meat) [19], geochemistry (e.g. sedimentary composition of rocks or chemistry of groundwaters) [20, 21], politics (e.g. multiparty electoral data) [22], and”
§ Combined Effects of Time Spent in Physical Activity, Sedentary Behaviors and Sleep on Obesity and Cardio-Metabolic Health Markers: A Novel Compositional Data Analysis Approach > Methods > Data analysis
What the sources say
- Not checked yetcites [19] R Ros-Freixedes, 2013, On the Compositional Analysis of Fatty Acids in Pork, J Agric Biol Environ Stat source
- Not checked yetcites [20] A Buccianti, 2014, Methods to investigate the geochemistry of groundwaters with values for nitrogen compounds below the detection limit, J Geochemical Explor source
- Not checked yetcites [21] JC Montero-Serrano, 2010, Sedimentary chemofacies characterization by means of multivariate analysis, Sediment Geol source
- Not checked yetcites [22] J Honaker, 2002, A Fast, Easy, and Efficient Estimator for Multiparty Electoral Data, Polit Anal source
boosted- Asserted: passes — The authors put it forward as true.
- Checkable: passes — It can be checked against evidence.
- Load-bearing: fails — The paper’s conclusions may not depend on it.
- Based: passes — The paper gives a reason why it holds.
Probably not a substantial claim. The paper’s conclusions may not depend on it.
In the paper
“In accordance with STROBE guidelines, a sensitivity analysis [26] was conducted for each model by removing 10% of cases at random and checking for a statistically significant change in the results.”
§ Combined Effects of Time Spent in Physical Activity, Sedentary Behaviors and Sleep on Obesity and Cardio-Metabolic Health Markers: A Novel Compositional Data Analysis Approach > Methods > Data analysis
What the sources say
- Not checked yetcites [26] E Von Elm, 2007, Strengthening the Reporting of Observational Studies in Epidemiology (STROBE) statement: guidelines for reporting observational studies, BMJ source
plain- Asserted: passes — The authors put it forward as true.
- Checkable: passes — It can be checked against evidence.
- Load-bearing: fails — The paper’s conclusions may not depend on it.
- Based: passes — The paper gives a reason why it holds.
Probably not a substantial claim. The paper’s conclusions may not depend on it.
In the paper
“Similarly, time spent in LIPA might have effects independent of time spent on MVPA [7]”
§ Combined Effects of Time Spent in Physical Activity, Sedentary Behaviors and Sleep on Obesity and Cardio-Metabolic Health Markers: A Novel Compositional Data Analysis Approach > Introduction > Background
What the sources say
- Not checked yetcites [7] GN Healy, 2007, Objectively measured light-intensity physical activity is independently associated with 2-h plasma glucose, Diabetes Care source
hedgedconditional- Asserted: passes — The authors put it forward as true.
- Checkable: passes — It can be checked against evidence.
- Load-bearing: passes — The paper’s conclusions depend on it.
- Based: passes — The paper gives a reason why it holds.
Probably not a substantial claim.
None of the sources cited for this claim have been checked yet.
In the paper
“For example, there is good evidence that 5 to 7 hours of sleep [1], and over 30 minutes of MVPA per day [2,3] are associated with better health outcomes.”
§ Combined Effects of Time Spent in Physical Activity, Sedentary Behaviors and Sleep on Obesity and Cardio-Metabolic Health Markers: A Novel Compositional Data Analysis Approach > Introduction > Background
What the sources say
- Not checked yetcites [1] P Bansil, 2011, Associations between sleep disorders, sleep duration, quality of sleep, and hypertension: results from the National Health and Nutrition Examination Survey, 2005 to 2008, J Clin Hypertens source
- Not checked yetcites [2] Department of Health. Start active, stay active: a report on physical activity from the four home countries’ Chief Medical Officers. 2011.
- Not checked yetcites [3] WL Haskell, 2007, Physical activity and public health: updated recommendation for adults from the American College of Sports Medicine and the American Heart Association, Med Sci Sports Exerc source
boostedcorrelational- Asserted: passes — The authors put it forward as true.
- Checkable: passes — It can be checked against evidence.
- Load-bearing: fails — The paper’s conclusions may not depend on it.
- Based: passes — The paper gives a reason why it holds.
Probably not a substantial claim. The paper’s conclusions may not depend on it. It may state two separate claims as one.
In the paper
“More recently, it has emerged that time spent in LIPA might play a positive role in preventing obesity [4]”
§ Combined Effects of Time Spent in Physical Activity, Sedentary Behaviors and Sleep on Obesity and Cardio-Metabolic Health Markers: A Novel Compositional Data Analysis Approach > Introduction > Background
What the sources say
- Not checked yetcites [4] CM Kotz, 2005, Role of nonexercise activity thermogenesis (NEAT) in obesity, Minn Med
hedgedconditional- Asserted: passes — The authors put it forward as true.
- Checkable: passes — It can be checked against evidence.
- Load-bearing: fails — The paper’s conclusions may not depend on it.
- Based: passes — The paper gives a reason why it holds.
Probably not a substantial claim. The paper’s conclusions may not depend on it.
The paper states this without a source or data behind it here, so there is nothing to check it against. The quote shows it is in the paper.
In the paper
“However, we know very little about the combined effect of allocating time to these different behaviors that together constitutes a composite whole.”
§ Combined Effects of Time Spent in Physical Activity, Sedentary Behaviors and Sleep on Obesity and Cardio-Metabolic Health Markers: A Novel Compositional Data Analysis Approach > Introduction > Background
plain- Asserted: passes — The authors put it forward as true.
- Checkable: fails — It may be too vague to check against evidence.
- Load-bearing: passes — The paper’s conclusions depend on it.
- Based: passes — The paper gives a reason why it holds.
Probably not a substantial claim. It may be too vague to check against evidence.
None of the sources cited for this claim have been checked yet.
In the paper
“We chose 10 minutes as this is the smallest unit of change in activity recognized to have beneficial health effect [2,3].”
§ Combined Effects of Time Spent in Physical Activity, Sedentary Behaviors and Sleep on Obesity and Cardio-Metabolic Health Markers: A Novel Compositional Data Analysis Approach > Results > Effect of time re-allocation
What the sources say
- Not checked yetcites [2] Department of Health. Start active, stay active: a report on physical activity from the four home countries’ Chief Medical Officers. 2011.
- Not checked yetcites [3] WL Haskell, 2007, Physical activity and public health: updated recommendation for adults from the American College of Sports Medicine and the American Heart Association, Med Sci Sports Exerc source
plain- Asserted: passes — The authors put it forward as true.
- Checkable: passes — It can be checked against evidence.
- Load-bearing: passes — The paper’s conclusions depend on it.
- Based: passes — The paper gives a reason why it holds.
Probably not a substantial claim.
A conclusion the paper draws from its own results — it cites no other source for it, so there is none to check. The quote shows it is in the paper.
In the paper
“For diabetes risk markers (insulin and HOMA) time spent in SB and LIPA had the opposite relationship, suggesting that replacing sitting time with light activity might be beneficial (Table 3, Figs 15B, 15C, 25F and 26F).”
§ Combined Effects of Time Spent in Physical Activity, Sedentary Behaviors and Sleep on Obesity and Cardio-Metabolic Health Markers: A Novel Compositional Data Analysis Approach > Discussion
hedgedconditional- Asserted: passes — The authors put it forward as true.
- Checkable: passes — It can be checked against evidence.
- Load-bearing: passes — The paper’s conclusions depend on it.
- Based: passes — The paper gives a reason why it holds.
It may state two separate claims as one.
None of the sources cited for this claim have been checked yet.
In the paper
“In our view, this study addresses two important gaps in the literature. First, it contributes to mitigate the dearth of information about the combined effect of sleep, SB, LIPA and MVPA on health [14,27]. Second, it provides a solution to study the relationship between health and time budgets without encountering issues of spurious correlations and collinearity [8].”
§ Combined Effects of Time Spent in Physical Activity, Sedentary Behaviors and Sleep on Obesity and Cardio-Metabolic Health Markers: A Novel Compositional Data Analysis Approach > Discussion
What the sources say
- Not checked yetcites [14] MP Buman, 2014, Reallocating time to sleep, sedentary behaviors, or active behaviors: associations with cardiovascular disease risk biomarkers, NHANES 2005–2006, Am J Epidemiol source
- Not checked yetcites [27] M Hamer, 2014, Effects of Substituting Sedentary Time with Physical Activity on Metabolic Risk, Med Sci Sports Exerc source
- Not checked yetcites [8] Zeljko Pedisic, 2014, Measurement issues and poor adjustments for physical activity and sleep undermine sedentary behaviour research, Kinesiology
plaincorrelational- Asserted: passes — The authors put it forward as true.
- Checkable: passes — It can be checked against evidence.
- Load-bearing: passes — The paper’s conclusions depend on it.
- Based: passes — The paper gives a reason why it holds.
It may state two separate claims as one.
A conclusion the paper draws from its own results — it cites no other source for it, so there is none to check. The quote shows it is in the paper.
In the paper
“The fact that time is finite during the day strongly suggests that the debate on whether or not the effect of a single behavior is independent of another one might be conceptually wrong.”
§ Combined Effects of Time Spent in Physical Activity, Sedentary Behaviors and Sleep on Obesity and Cardio-Metabolic Health Markers: A Novel Compositional Data Analysis Approach > Discussion
hedged- Asserted: passes — The authors put it forward as true.
- Checkable: unclear — It is unclear whether it could be checked against evidence.
- Load-bearing: passes — The paper’s conclusions depend on it.
- Based: passes — The paper gives a reason why it holds.
It may state two separate claims as one.
A conclusion the paper draws from its own results — it cites no other source for it, so there is none to check. The quote shows it is in the paper.
In the paper
“Time spent in one behavior is naturally co-dependent of the time spent in others and the effect of time spent in one behavior should naturally depend on the composition of the rest of the day.”
§ Combined Effects of Time Spent in Physical Activity, Sedentary Behaviors and Sleep on Obesity and Cardio-Metabolic Health Markers: A Novel Compositional Data Analysis Approach > Discussion
plaincorrelational- Asserted: passes — The authors put it forward as true.
- Checkable: passes — It can be checked against evidence.
- Load-bearing: passes — The paper’s conclusions depend on it.
- Based: passes — The paper gives a reason why it holds.
It may state two separate claims as one.
What the paper did — it cites no source for this, so there is none to check. The quote shows it is in the paper.
In the paper
“The absolute values of these estimates varied depending on the value of the confounding variables. The trends observed however remained similar.”
§ Combined Effects of Time Spent in Physical Activity, Sedentary Behaviors and Sleep on Obesity and Cardio-Metabolic Health Markers: A Novel Compositional Data Analysis Approach > Results > Mapping the effect of behavior compositions on cardiometabolic outcomes
plain- Asserted: passes — The authors put it forward as true.
- Checkable: passes — It can be checked against evidence.
- Load-bearing: unclear — It is unclear whether the paper’s conclusions depend on it.
- Based: passes — The paper gives a reason why it holds.
It may state two separate claims as one.
A conclusion the paper draws from its own results — it cites no other source for it, so there is none to check. The quote shows it is in the paper.
In the paper
“In addition, when the compositional model is compared to the single behavior models we found that the strength of association is greatly attenuated. This is in particular for MVPA, which suggests that the effect of MVPA is not entirely independent of SB, LIPA and sleep.”
§ Combined Effects of Time Spent in Physical Activity, Sedentary Behaviors and Sleep on Obesity and Cardio-Metabolic Health Markers: A Novel Compositional Data Analysis Approach > Discussion
hedgedcorrelational- Asserted: passes — The authors put it forward as true.
- Checkable: passes — It can be checked against evidence.
- Load-bearing: passes — The paper’s conclusions depend on it.
- Based: passes — The paper gives a reason why it holds.
It may state two separate claims as one.
A conclusion the paper draws from its own results — it cites no other source for it, so there is none to check. The quote shows it is in the paper.
In the paper
“Our results do not disagree with the overwhelming evidence that MVPA is beneficial to health, but the analysis shows that this relationship depends on the composition of the rest of the day.”
§ Combined Effects of Time Spent in Physical Activity, Sedentary Behaviors and Sleep on Obesity and Cardio-Metabolic Health Markers: A Novel Compositional Data Analysis Approach > Discussion
plaincorrelational- Asserted: passes — The authors put it forward as true.
- Checkable: passes — It can be checked against evidence.
- Load-bearing: passes — The paper’s conclusions depend on it.
- Based: passes — The paper gives a reason why it holds.
It may state two separate claims as one.
A conclusion the paper draws from its own results — it cites no other source for it, so there is none to check. The quote shows it is in the paper.
In the paper
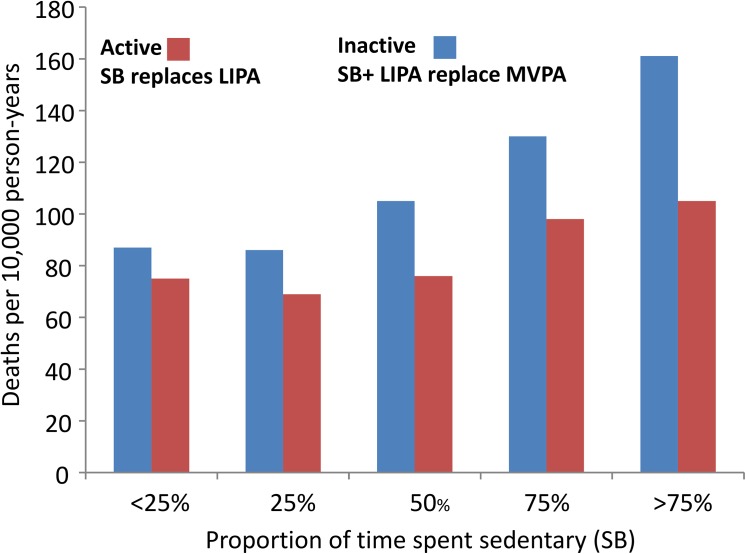
“But, at equal proportion of MVPA, if SB replaces LIPA the detrimental effect of inactivity could be higher, then explaining the added mortality for active people who sit for a long time (Fig 27).”
§ Combined Effects of Time Spent in Physical Activity, Sedentary Behaviors and Sleep on Obesity and Cardio-Metabolic Health Markers: A Novel Compositional Data Analysis Approach > Discussion
hedgedconditional- Asserted: passes — The authors put it forward as true.
- Checkable: passes — It can be checked against evidence.
- Load-bearing: passes — The paper’s conclusions depend on it.
- Based: passes — The paper gives a reason why it holds.
It may state two separate claims as one.
A conclusion the paper draws from its own results — it cites no other source for it, so there is none to check. The quote shows it is in the paper.
In the paper
“Our analysis shows that each behavior might affect health both directly and also indirectly because it displaces the others.”
§ Combined Effects of Time Spent in Physical Activity, Sedentary Behaviors and Sleep on Obesity and Cardio-Metabolic Health Markers: A Novel Compositional Data Analysis Approach > Discussion
hedgedconditional- Asserted: passes — The authors put it forward as true.
- Checkable: passes — It can be checked against evidence.
- Load-bearing: passes — The paper’s conclusions depend on it.
- Based: passes — The paper gives a reason why it holds.
It may state two separate claims as one.
In the paper
“The accelerometer data were classified every minute of the day as MVPA, SB or LIPA depending on a threshold. This method is less accurate than postural allocation at distinguishing between SB and LIPA [57], therefore it is possible that these two components of the composition might not be entirely accurate and that different thresholds might lead to different results.”
§ Combined Effects of Time Spent in Physical Activity, Sedentary Behaviors and Sleep on Obesity and Cardio-Metabolic Health Markers: A Novel Compositional Data Analysis Approach > Discussion
What the sources say
- Not checked yetcites [57] SFM Chastin, 2010, Methods for objective measure, quantification and analysis of sedentary behaviour and inactivity, Gait Posture source
hedged- Asserted: passes — The authors put it forward as true.
- Checkable: passes — It can be checked against evidence.
- Load-bearing: unclear — It is unclear whether the paper’s conclusions depend on it.
- Based: passes — The paper gives a reason why it holds.
It may state two separate claims as one.
A conclusion the paper draws from its own results — it cites no other source for it, so there is none to check. The quote shows it is in the paper.
In the paper
“Although replacing SB by MVPA has a stronger positive health effect, our results show that replacing SB by LIPA could have beneficial health effects as well.”
§ Combined Effects of Time Spent in Physical Activity, Sedentary Behaviors and Sleep on Obesity and Cardio-Metabolic Health Markers: A Novel Compositional Data Analysis Approach > Conclusion
hedgedconditional- Asserted: passes — The authors put it forward as true.
- Checkable: passes — It can be checked against evidence.
- Load-bearing: passes — The paper’s conclusions depend on it.
- Based: passes — The paper gives a reason why it holds.
It may state two separate claims as one.
What the paper did — it cites no source for this, so there is none to check. The quote shows it is in the paper.
In the paper
“Finally, as with all cross-sectional analysis, causal inference is limited and the estimated effects reflects more a population shift in distribution of time rather than actual effects for individuals.”
§ Combined Effects of Time Spent in Physical Activity, Sedentary Behaviors and Sleep on Obesity and Cardio-Metabolic Health Markers: A Novel Compositional Data Analysis Approach > Discussion
hedged- Asserted: passes — The authors put it forward as true.
- Checkable: passes — It can be checked against evidence.
- Load-bearing: fails — The paper’s conclusions may not depend on it.
- Based: passes — The paper gives a reason why it holds.
Probably not a substantial claim. The paper’s conclusions may not depend on it. It may state two separate claims as one.
None of the sources cited for this claim have been checked yet.
In the paper
“This was not reported previously by analysis of this wave of NHANES [14] but it is consistent with evidence that long sleep duration are generally associated with worse health outcomes [50–53].”
§ Combined Effects of Time Spent in Physical Activity, Sedentary Behaviors and Sleep on Obesity and Cardio-Metabolic Health Markers: A Novel Compositional Data Analysis Approach > Discussion
What the sources say
- Not checked yetcites [14] MP Buman, 2014, Reallocating time to sleep, sedentary behaviors, or active behaviors: associations with cardiovascular disease risk biomarkers, NHANES 2005–2006, Am J Epidemiol source
- Not checked yetcites [50] FP Cappuccio, 2010, Sleep duration and all-cause mortality: a systematic review and meta-analysis of prospective studies, Sleep source
- Not checked yetcites [51] FP Cappuccio, 2010, Quantity and quality of sleep and incidence of type 2 diabetes: A systematic review and meta-analysis, Diabetes Care source
- Not checked yetcites [52] FP Cappuccio, 2011, Sleep duration predicts cardiovascular outcomes: A systematic review and meta-analysis of prospective studies, European Heart Journal
- Not checked yetcites [53] MA Grandner, 2013, Sleep duration, cardiovascular disease, and proinflammatory biomarkers, Nat Sci Sleep source
plaincorrelational- Asserted: passes — The authors put it forward as true.
- Checkable: passes — It can be checked against evidence.
- Load-bearing: fails — The paper’s conclusions may not depend on it.
- Based: passes — The paper gives a reason why it holds.
Probably not a substantial claim. The paper’s conclusions may not depend on it. It may state two separate claims as one.
A conclusion the paper draws from its own results — it cites no other source for it, so there is none to check. The quote shows it is in the paper.
In the paper
“Our analysis adds to the current evidence that decreasing inactivity, in particular sedentary time, and maintaining or increasing time spent in moderate to vigorous physical activity, contributes toward a more favorable cardiometabolic risk profile.”
§ Combined Effects of Time Spent in Physical Activity, Sedentary Behaviors and Sleep on Obesity and Cardio-Metabolic Health Markers: A Novel Compositional Data Analysis Approach > Conclusion
plaindirect- Asserted: passes — The authors put it forward as true.
- Checkable: passes — It can be checked against evidence.
- Load-bearing: passes — The paper’s conclusions depend on it.
- Based: passes — The paper gives a reason why it holds.
It may state two separate claims as one.
What the paper did — it cites no source for this, so there is none to check. The quote shows it is in the paper.
In the paper
“In addition, sleep was only evaluated over week or working days, while the accelerometry was averaged over the whole week. It is likely that this introduced some random error.”
§ Combined Effects of Time Spent in Physical Activity, Sedentary Behaviors and Sleep on Obesity and Cardio-Metabolic Health Markers: A Novel Compositional Data Analysis Approach > Discussion
hedgedconditional- Asserted: passes — The authors put it forward as true.
- Checkable: passes — It can be checked against evidence.
- Load-bearing: unclear — It is unclear whether the paper’s conclusions depend on it.
- Based: passes — The paper gives a reason why it holds.
It may state two separate claims as one.
- Rests on an assumption: Activity patterns can be different at weekends or non-working days.
- Rests on an assumption: Sleep duration varies at weekends or non-working days depending on chronotypes.
A conclusion the paper draws from its own results — it cites no other source for it, so there is none to check. The quote shows it is in the paper.
In the paper
“In summary, time spent on a physical behavior is co-dependent on the other ones and, therefore, it should be analysed and conceptualised within a compositional paradigm to obtain meaningful and accurate inferences.”
§ Combined Effects of Time Spent in Physical Activity, Sedentary Behaviors and Sleep on Obesity and Cardio-Metabolic Health Markers: A Novel Compositional Data Analysis Approach > Conclusion
plaincorrelational- Asserted: passes — The authors put it forward as true.
- Checkable: passes — It can be checked against evidence.
- Load-bearing: passes — The paper’s conclusions depend on it.
- Based: passes — The paper gives a reason why it holds.
Probably not a substantial claim. It may state two separate claims as one.
None of the sources cited for this claim have been checked yet.
In the paper
“Secondly, it is also well known that deconditioning or weight gain occurs rapidly when activity levels are dropped, and that it takes a larger amount of exercise overload to return to the same weight or fitness [46–48].”
§ Combined Effects of Time Spent in Physical Activity, Sedentary Behaviors and Sleep on Obesity and Cardio-Metabolic Health Markers: A Novel Compositional Data Analysis Approach > Discussion
What the sources say
- Not checked yetcites [46] MJ Carvalho, 2009, Training and detraining effects on functional fitness after a multicomponent training in older women, Gerontology source
- Not checked yetcites [47] A Lobo, 2010, Effects of Training and Detraining on Physical Fitness, Physical Activity Patterns, Cardiovascular Variables, and HRQoL after 3 Health-Promotion Interventions in Institutionalized Elders, Int J Family Med
- Not checked yetcites [48] R Mora-Rodriguez, 2014, Time-course effects of aerobic interval training and detraining in patients with metabolic syndrome, Nutr Metab Cardiovasc Dis source
boosteddirect- Asserted: passes — The authors put it forward as true.
- Checkable: passes — It can be checked against evidence.
- Load-bearing: passes — The paper’s conclusions depend on it.
- Based: passes — The paper gives a reason why it holds.
It may state two separate claims as one.
In the paper
“Objective measurements are less prone to error [56], especially for quantifying time spent in MVPA. This is however less true for SB and LIPA time.”
§ Combined Effects of Time Spent in Physical Activity, Sedentary Behaviors and Sleep on Obesity and Cardio-Metabolic Health Markers: A Novel Compositional Data Analysis Approach > Discussion
What the sources say
- Not checked yetcites [56] KR Westerterp, 2009, Assessment of physical activity: A critical appraisal, European Journal of Applied Physiology
plain- Asserted: passes — The authors put it forward as true.
- Checkable: passes — It can be checked against evidence.
- Load-bearing: unclear — It is unclear whether the paper’s conclusions depend on it.
- Based: passes — The paper gives a reason why it holds.
It may state two separate claims as one.
In the paper
“Firstly, removing 10 minutes from MVPA is actually a large amount of MVPA equal to one third of the recommended guidelines [2], while decreasing SB time by 10 minutes only accounts for a 2 to 5% change in total SB time.”
§ Combined Effects of Time Spent in Physical Activity, Sedentary Behaviors and Sleep on Obesity and Cardio-Metabolic Health Markers: A Novel Compositional Data Analysis Approach > Discussion
What the sources say
- Not checked yetcites [2] Department of Health. Start active, stay active: a report on physical activity from the four home countries’ Chief Medical Officers. 2011.
plain- Asserted: passes — The authors put it forward as true.
- Checkable: passes — It can be checked against evidence.
- Load-bearing: passes — The paper’s conclusions depend on it.
- Based: passes — The paper gives a reason why it holds.
It may state two separate claims as one.
In the paper
“The data loss from the full NHANES sample is relatively high (around 50% see S1 File) due to compliance with objective monitoring and this selection bias affects the representativity of the sample analyzed.”
§ Combined Effects of Time Spent in Physical Activity, Sedentary Behaviors and Sleep on Obesity and Cardio-Metabolic Health Markers: A Novel Compositional Data Analysis Approach > Discussion
What the sources say
- Not checked yetcites S1 File
plaindirect- Asserted: passes — The authors put it forward as true.
- Checkable: passes — It can be checked against evidence.
- Load-bearing: unclear — It is unclear whether the paper’s conclusions depend on it.
- Based: passes — The paper gives a reason why it holds.
It may state two separate claims as one.
A conclusion the paper draws from its own results — it cites no other source for it, so there is none to check. The quote shows it is in the paper.
In the paper
“Sleep in our analysis was directly beneficially associated with obesity and blood pressure markers but could have negative effects if it displaced MVPA.”
§ Combined Effects of Time Spent in Physical Activity, Sedentary Behaviors and Sleep on Obesity and Cardio-Metabolic Health Markers: A Novel Compositional Data Analysis Approach > Discussion
hedgedconditional- Asserted: passes — The authors put it forward as true.
- Checkable: passes — It can be checked against evidence.
- Load-bearing: passes — The paper’s conclusions depend on it.
- Based: passes — The paper gives a reason why it holds.
It may state two separate claims as one.
The paper relies on this without support.
The absolute values of the time re-allocation estimates will vary if computed around a different starting composition, but the direction and relative size of the effects should be the same.
“The absolute values of these estimates will vary if the time re-allocation is computed around a different starting composition, but the direction and relative size of the effects should be the same.”
The paper relies on this without support.
Self-reported sleep duration accurately reflects actual sleep time.
“Sleep duration was self-reported as an integer from 1 to 24 hours in response to the question “How much sleep do you actually get at night on weekdays or workdays”.”
The paper relies on this without support.
This study is the first to use compositional analysis to investigate associations between the relative distribution of time in physical behaviors and cardiometabolic health markers.
“This study is the first to our knowledge to use a compositional analysis to provide a statistically sound and comprehensive investigation of the associations between the relative distribution of time spent in different physical behaviors that make up the day and cardio-metabolic health markers.”
The paper relies on this without support.
Humans cannot perform MVPA all day.
“Humans cannot perform MVPA all day, therefore, although LIPA might be detrimental, spending the rest of the day in LIPA might be better than sitting (SB).”
The paper relies on this without support.
Activity patterns can be different at weekends or non-working days.
“It is known that activity patterns can be different at weekends or non-working days.”
The paper relies on this without support.
Sleep duration varies at weekends or non-working days depending on chronotypes.
“Similarly sleep duration varies at weekends or non-working days depending on chronotypes.”
Claims other papers make about this one
Each is checked against this paper’s own text: does it say what the citing paper says it does?
In the citing paper
“research has shown that these three behaviours are codependent and should be considered simultaneously [15, 16].”
Self-check
Percentages, sums and reported differences re-computed from the paper’s own numbers.
Each contradiction between two passages listed here was confirmed by an independent check.
Rated major: it would touch a result — a value a result rests on, reported and recomputed p-values on opposite sides of the significance level, two passages that conflict with no sign which is right, or a cited work retracted before this paper was published.
In the paper
§ Combined Effects of Time Spent in Physical Activity, Sedentary Behaviors and Sleep on Obesity and Cardio-Metabolic Health Markers: A Novel Compositional Data Analysis Approach > Results > Mapping the effect of behavior compositions on cardiometabolic outcomes
“The proportion of time spent in SB had notable negative effects on BMI (Figs 11 and 16), waist circumference (Figs 11 and 17), systolic blood pressure (Figs 12 and 18), HDL (Figs 13 and 20), CRP (Figs 14 and 23), triglycerides (Figs 14 and 24), insulin (Figs 15 and 25) and HOMA (Figs 15 and 26) when it replaced MVPA time.”
§ Combined Effects of Time Spent in Physical Activity, Sedentary Behaviors and Sleep on Obesity and Cardio-Metabolic Health Markers: A Novel Compositional Data Analysis Approach > Results > Effect of time re-allocation
“| SB | 0.005 | | 0.000 | -0.950 | SB | -0.001 | | -0.001 | -0.260 |”
Rated minor: it would not touch a result — a value no result rests on, a p-value that stays on the same side of the significance level, or a conflict that is clerical, resolved elsewhere in the paper, or outside its own findings.
In the paper
§ Combined Effects of Time Spent in Physical Activity, Sedentary Behaviors and Sleep on Obesity and Cardio-Metabolic Health Markers: A Novel Compositional Data Analysis Approach > Results > Mapping the effect of behavior compositions on cardiometabolic outcomes
“The reciprocal plot showing differences in outcome as a function of the proportion of time spent in MVPA for a given proportion of SB is displayed in Fig 6B.”
§ Combined Effects of Time Spent in Physical Activity, Sedentary Behaviors and Sleep on Obesity and Cardio-Metabolic Health Markers: A Novel Compositional Data Analysis Approach > Results > Mapping the effect of behavior compositions on cardiometabolic outcomes
“Figure: Fig 16 Estimated BMI (in kg/m2) for different composition as a function the proportion of a) LIPA and b) MVPA when SB is held constant”
Rated minor: it would not touch a result — a value no result rests on, a p-value that stays on the same side of the significance level, or a conflict that is clerical, resolved elsewhere in the paper, or outside its own findings.
In the paper
§ Combined Effects of Time Spent in Physical Activity, Sedentary Behaviors and Sleep on Obesity and Cardio-Metabolic Health Markers: A Novel Compositional Data Analysis Approach > Results > Linear regression models
“MVPA (B = -0.098, p<0.001)”
§ Combined Effects of Time Spent in Physical Activity, Sedentary Behaviors and Sleep on Obesity and Cardio-Metabolic Health Markers: A Novel Compositional Data Analysis Approach > Results > Linear regression models
“| BMI | -1.40 | 0.009 | 1.40 | 0.002 | 0.98 | 0.029 | -0.98 | <0.001 | <0.001 |”
Citations
Cites
von Elm, E., Altman, D. G., Egger, M., Pocock, S. J., Gøtzsche, P. C., Vandenbroucke, J. P., & Initiative, F. T. S. (2007) · PLoS Medicine · doi:10.1371/journal.pmed.0040296 · Cited by 23,020
Elm, E. V., Altman, D. G., Egger, M., Pocock, S. J., Gøtzsche, P. C., & Vandenbroucke, J. P. (2007) · BMJ · doi:10.1136/bmj.39335.541782.ad · Cited by 10,766 · cited 1×
“In accordance with STROBE guidelines, a sensitivity analysis [26] was conducted for each model by removing 10% of cases at random and checking for a statistically significant change in the results.”
‘Small Changes' to Diet and Physical Activity Behaviors for Weight Management
Hills, A. P., Byrne, N. M., Lindstrom, R. C., & Hill, J. O. (2013) · Obesity Facts · doi:10.1159/000345030 · Cited by 9,526
Physical Activity in the United States Measured by Accelerometer
TROIANO, R. P., BERRIGAN, D., DODD, K. W., MÂSSE, L. C., TILERT, T., & MCDOWELL, M. (2008) · Medicine & Science in Sports & Exercise · doi:10.1249/mss.0b013e31815a51b3 · Cited by 7,638 · cited 3×
“Time spent in SB, LIPA and MVPA was assessed objectively following the protocol detailed previously [15,17], using an accelerometer (Actigraph 7164; Actigraph, LLC, Pensacola, FL).”
InfluentialStone, N. J., Robinson, J. G., Lichtenstein, A. H., Bairey Merz, C. N., Blum, C. B., Eckel, R. H., Goldberg, A. C., Gordon, D., Levy, D., Lloyd-Jones, D. M., et al. (2014) · Circulation · doi:10.1161/01.cir.0000437738.63853.7a · Cited by 7,081
HASKELL, W. L., LEE, I.-M., PATE, R. R., POWELL, K. E., BLAIR, S. N., FRANKLIN, B. A., MACERA, C. A., HEATH, G. W., THOMPSON, P. D., & BAUMAN, A. (2007) · Medicine & Science in Sports & Exercise · doi:10.1249/mss.0b013e3180616b27 · Cited by 4,616
The Statistical Analysis of Compositional Data
Aitchison, J. (1986) · doi:10.1007/978-94-009-4109-0 · Cited by 4,383
Stone, N. J., Robinson, J. G., Lichtenstein, A. H., Bairey Merz, C. N., Blum, C. B., Eckel, R. H., Goldberg, A. C., Gordon, D., Levy, D., Lloyd-Jones, D. M., et al. (2014) · Journal of the American College of Cardiology · doi:10.1016/j.jacc.2013.11.002 · Cited by 3,845
Calibration of the Computer Science and Applications, Inc. accelerometer
FREEDSON, P. S., MELANSON, E., & SIRARD, J. (1998) · Medicine & Science in Sports & Exercise · doi:10.1097/00005768-199805000-00021 · Cited by 3,825 · cited 1×
“Each minute epoch was classified using standard count per minutes thresholds as SB (<100 counts/min), LIPA (100 to 1951 counts/min) or MVPA ( 1952 counts/min) [18].”
The Statistical Analysis of Compositional Data
Aitchison, J. (1982) · Journal of the Royal Statistical Society Series B (Statistical Methodology) · doi:10.1111/j.2517-6161.1982.tb01195.x · Cited by 3,457
Research works printed but not linked: 1
- Zeljko Pedisic, 2014, Measurement issues and poor adjustments for physical activity and sleep undermine sedentary behaviour research, Kinesiology, 46, 135
Cited by
Sorted by citations
Poitras, V. J., Gray, C. E., Borghese, M. M., Carson, V., Chaput, J.-P., Janssen, I., Katzmarzyk, P. T., Pate, R. R., Connor Gorber, S., Kho, M. E., et al. (2016) · Applied Physiology, Nutrition, and Metabolism · doi:10.1139/apnm-2015-0663 · Cited by 2,217
Tremblay, M. S., Carson, V., Chaput, J.-P., Connor Gorber, S., Dinh, T., Duggan, M., Faulkner, G., Gray, C. E., Gruber, R., Janson, K., et al. (2016) · Applied Physiology, Nutrition, and Metabolism · doi:10.1139/apnm-2016-0151 · Cited by 2,024
Carson, V., Hunter, S., Kuzik, N., Gray, C. E., Poitras, V. J., Chaput, J.-P., Saunders, T. J., Katzmarzyk, P. T., Okely, A. D., Connor Gorber, S., et al. (2016) · Applied Physiology, Nutrition, and Metabolism · doi:10.1139/apnm-2015-0630 · Cited by 1,380
Ross, R., Chaput, J., Giangregorio, L., Janssen, I., Saunders, T. J., Kho, M. E., Poitras, V. J., Tomasone, J. R., El-Kotob, R., McLaughlin, E. C., et al. (2020) · Applied Physiology, Nutrition, and Metabolism · doi:10.1139/apnm-2020-0467 · Cited by 1,060
Self-citationTremblay, M. S., Chaput, J., Adamo, K. B., Aubert, S., Barnes, J. D., Choquette, L., Duggan, M., Faulkner, G., Goldfield, G. S., Gray, C. E., et al. (2017) · BMC Public Health · doi:10.1186/s12889-017-4859-6 · Cited by 693
Rollo, S., Antsygina, O., & Tremblay, M. S. (2020) · Journal of sport and health science/Journal of Sport and Health Science · doi:10.1016/j.jshs.2020.07.004 · Cited by 620
Saunders, T. J., Gray, C. E., Poitras, V. J., Chaput, J.-P., Janssen, I., Katzmarzyk, P. T., Olds, T., Connor Gorber, S., Kho, M. E., Sampson, M., et al. (2016) · Applied Physiology, Nutrition, and Metabolism · doi:10.1139/apnm-2015-0626 · Cited by 589
Compositional data analysis for physical activity, sedentary time and sleep research
Dumuid, D., Stanford, T., Fernández, J. A. M., Pedišić, Ž., Maher, C. A., Lewis, L. K., Hron, K., Katzmarzyk, P. T., Chaput, J., Fogelholm, M., et al. (2017) · Statistical Methods in Medical Research · doi:10.1177/0962280217710835 · Cited by 548
Chastin, S. F. M., De Craemer, M., De Cocker, K., Powell, L., Van Cauwenberg, J., Dall, P., Hamer, M., & Stamatakis, E. (2019) · British Journal of Sports Medicine · doi:10.1136/bjsports-2017-097563 · Cited by 465
Self-citationSampasa-Kanyinga, H., Colman, I., Goldfield, G. S., Janssen, I., Wang, J., Podinic, I., Tremblay, M. S., Saunders, T. J., Sampson, M., & Chaput, J.-P. (2020) · International Journal of Behavioral Nutrition and Physical Activity · doi:10.1186/s12966-020-00976-x · Cited by 430
Carson, V., Tremblay, M. S., Chaput, J.-P., & Chastin, S. F. M. (2016) · Applied Physiology, Nutrition, and Metabolism · doi:10.1139/apnm-2016-0026 · Cited by 414
Self-citationThe 24-Hour Activity Cycle: A New Paradigm for Physical Activity
Rosenberger, M. E., Fulton, J. E., Buman, M. P., Troiano, R. P., Grandner, M. A., Büchner, D. M., & Haskell, W. L. (2018) · Medicine & Science in Sports & Exercise · doi:10.1249/mss.0000000000001811 · Cited by 395
Dumuid, D., Pedišić, Ž., Stanford, T., Fernández, J. A. M., Hron, K., Maher, C. A., Lewis, L. K., & Olds, T. (2017) · Statistical Methods in Medical Research · doi:10.1177/0962280217737805 · Cited by 369
Grgić, J., Dumuid, D., Bengoechea, E. G., Shrestha, N., Bauman, A. E., Olds, T., & Pedišić, Ž. (2018) · International Journal of Behavioral Nutrition and Physical Activity · doi:10.1186/s12966-018-0691-3 · Cited by 397
Füzéki, E., Engeroff, T., & Banzer, W. B. (2017) · Sports Medicine · doi:10.1007/s40279-017-0724-0 · Cited by 399
Tremblay, M. S., Carson, V., & Chaput, J. (2016) · Applied Physiology, Nutrition, and Metabolism · doi:10.1139/apnm-2016-0203 · Cited by 358
Cliff, D. P., Hesketh, K. D., Vella, S. A., Hinkley, T., Tsiros, M. D., Ridgers, N. D., Carver, A., Veitch, J., Parrish, A., Hardy, L. L., et al. (2016) · Obesity Reviews · doi:10.1111/obr.12371 · Cited by 327
Matthews, C. E., Keadle, S. K., Troiano, R. P., Kahle, L., Koster, A., Brychta, R. J., Domelen, D. R. V., Caserotti, P., Chen, K. Y., Harris, T. B., et al. (2016) · American Journal of Clinical Nutrition · doi:10.3945/ajcn.116.135129 · Cited by 318
Compositional Data Analysis in Time-Use Epidemiology: What, Why, How
Dumuid, D., Pedišić, Ž., Palarea‐Albaladejo, J., Fernández, J. A. M., Hron, K., & Olds, T. (2020) · International Journal of Environmental Research and Public Health · doi:10.3390/ijerph17072220 · Cited by 294
Self-citationDeterminants of sleep quality in college students: A literature review
Wang, F., & Bíró, É. (2020) · EXPLORE · doi:10.1016/j.explore.2020.11.003 · Cited by 314
WINKLER, E. A. H., Bodicoat, D. H., Healy, G. N., Bakrania, K., Yates, T. E., Owen, N. G., Dunstan, D. W., & Edwardson, C. L. (2016) · Physiological Measurement · doi:10.1088/0967-3334/37/10/1653 · Cited by 290
Health associations with meeting new 24-hour movement guidelines for Canadian children and youth
Carson, V., Chaput, J.-P., Janssen, I., & Tremblay, M. S. (2017) · Preventive Medicine · doi:10.1016/j.ypmed.2016.12.005 · Cited by 285
Stamatakis, E., Ekelund, U., Ding, D., Hamer, M., Bauman, A. E., & Lee, I.-M. (2019) · British Journal of Sports Medicine · doi:10.1136/bjsports-2018-099131 · Cited by 284
Dempsey, P. C., Biddle, S. J. H., Buman, M. P., Chastin, S., Ekelund, U., Friedenreich, C. M., Katzmarzyk, P. T., Leitzmann, M. F., Stamatakis, E., van der Ploeg, H. P., et al. (2020) · International Journal of Behavioral Nutrition and Physical Activity · doi:10.1186/s12966-020-01044-0 · Cited by 275
Self-citationChaput, J., Colley, R. C., Aubert, S., Carson, V., Janssen, I., Roberts, K. C., & Tremblay, M. S. (2017) · BMC Public Health · doi:10.1186/s12889-017-4854-y · Cited by 256
Sedentary Behavior and Cardiovascular Disease in Older Women: The OPACH Study
Bellettiere, J., LaMonte, M. J., Evenson, K. R., Rillamas-Sun, E., Kerr, J., Lee, I.-M., Di, C., Rosenberg, D. E., Stefanick, M. L., Buchner, D. M., et al. (2019) · Circulation · doi:10.1161/circulationaha.118.035312 · Cited by 252
Walmsley, R., Chan, S., Smith-Byrne, K., Ramakrishnan, R., Woodward, M., Rahimi, K., Dwyer, T., Bennett, D., & Doherty, A. (2022) · British Journal of Sports Medicine · doi:10.1136/bjsports-2021-104050 · Cited by 238
“18 19”
Pedišić, Ž., Dumuid, D., & Olds, T. (2017) · Victoria University Research Repository (Victoria University) · Cited by 247
Kuzik, N., Poitras, V. J., Tremblay, M. S., Lee, E.-Y., Hunter, S., & Carson, V. (2017) · BMC Public Health · doi:10.1186/s12889-017-4851-1 · Cited by 246
Lack of sleep as a contributor to obesity in adolescents: impacts on eating and activity behaviors
Chaput, J.-P., & Dutil, C. (2016) · International Journal of Behavioral Nutrition and Physical Activity · doi:10.1186/s12966-016-0428-0 · Cited by 243
Measurement of physical activity in clinical practice using accelerometers
Arvidsson, D., Fridolfsson, J., & Börjesson, M. (2019) · Journal of Internal Medicine · doi:10.1111/joim.12908 · Cited by 268
Copeland, J. L., Ashe, M. C., Biddle, S., Brown, W. J., Buman, M. P., CHASTIN, S. F. M., Gardiner, P. A., Inoue, S., Jefferis, B. J. M. H., Oka, K., et al. (2017) · British Journal of Sports Medicine · doi:10.1136/bjsports-2016-097210 · Cited by 247
Self-citationAmagasa, S., Machida, M., Fukushima, N., Kikuchi, H., Takamiya, T., Odagiri, Y., & Inoue, S. (2018) · International Journal of Behavioral Nutrition and Physical Activity · doi:10.1186/s12966-018-0695-z · Cited by 225
Janssen, I., Clarke, A. E., Carson, V., Chaput, J., Giangregorio, L., Kho, M. E., Poitras, V. J., Ross, R., Saunders, T. J., Ross‐White, A., et al. (2020) · Applied Physiology, Nutrition, and Metabolism · doi:10.1139/apnm-2020-0160 · Cited by 227
Self-citationSaunders, T. J., & Vallance, J. K. (2016) · Applied Health Economics and Health Policy · doi:10.1007/s40258-016-0289-3 · Cited by 252
Ding, D., Varela, A. R., Bauman, A. E., Ekelund, U., Lee, I.-M. M., Heath, G. W., Katzmarzyk, P. T., Reis, R. S., & Pratt, M. (2019) · British Journal of Sports Medicine · doi:10.1136/bjsports-2019-101001 · Cited by 225
Wilhite, K. L., Booker, B., Huang, B., Antczak, D., Corbett, L., Parker, P. D., Noetel, M., Rissel, C. E., Lonsdale, C., Cruz, B. D. P., et al. (2022) · American Journal of Epidemiology · doi:10.1093/aje/kwac212 · Cited by 240
Hadgraft, N. T., WINKLER, E. A. H., Climie, R. E., Grace, M. S., Romero, L., Owen, N. G., Dunstan, D. W., Healy, G. N., & Dempsey, P. C. (2020) · British Journal of Sports Medicine · doi:10.1136/bjsports-2019-101154 · Cited by 191
Targeting Reductions in Sitting Time to Increase Physical Activity and Improve Health
Keadle, S. K., Conroy, D. E., Buman, M. P., Dunstan, D. W., & Matthews, C. E. (2017) · Medicine & Science in Sports & Exercise · doi:10.1249/mss.0000000000001257 · Cited by 198
Bellettiere, J., Winkler, E. A. H., Chastin, S. F. M., Kerr, J., Owen, N., Dunstan, D. W., & Healy, G. N. (2017) · PLOS ONE · doi:10.1371/journal.pone.0180119 · Cited by 169
Self-citationFairclough, S. J., Dumuid, D., Taylor, S., Curry, W. B., McGrane, B., Stratton, G., Maher, C. A., & Olds, T. (2017) · International Journal of Behavioral Nutrition and Physical Activity · doi:10.1186/s12966-017-0521-z · Cited by 181
Dempsey, P. C., Owen, N. G., Yates, T. E., Kingwell, B. A., & Dunstan, D. W. (2016) · Current Diabetes Reports · doi:10.1007/s11892-016-0797-4 · Cited by 165
Chastin, S., McGregor, D., Palarea-Albaladejo, J., Diaz, K. M., Hagströmer, M., Hallal, P. C., van Hees, V. T., Hooker, S., Howard, V. J., Lee, I.-M., et al. (2021) · British Journal of Sports Medicine · doi:10.1136/bjsports-2020-102345 · Cited by 162
Self-citationDumuid, D., Olds, T., Lewis, L. K., Fernández, J. A. M., Katzmarzyk, P. T., Barreira, T. V., Broyles, S. T., Chaput, J., Fogelholm, M., Hu, G., et al. (2017) · The Journal of Pediatrics · doi:10.1016/j.jpeds.2016.12.048 · Cited by 148
Rethinking the sleep-health link
Matricciani, L., Bin, Y. S., Lallukka, T. M., Kronholm, E., Wake, M. A., Paquet, C., Dumuid, D., & Olds, T. (2018) · Sleep Health · doi:10.1016/j.sleh.2018.05.004 · Cited by 167
Skrede, T., Steene‐Johannessen, J., Anderssen, S. A., Resaland, G. K., & Ekelund, U. (2018) · Obesity Reviews · doi:10.1111/obr.12758 · Cited by 158
Migueles, J. H., Aadland, E., Andersen, L. B., Brønd, J. C., CHASTIN, S. F. M., Hansen, B. H., Konstabel, K., Kvalheim, O. M., McGregor, D., Rowlands, A. V., et al. (2021) · British Journal of Sports Medicine · doi:10.1136/bjsports-2020-103604 · Cited by 155
Self-citationSedentary Behavior and Chronic Disease: Mechanisms and Future Directions
Dempsey, P. C., Matthews, C. E., Dashti, S. G., Doherty, A., Bergouignan, A., van Roekel, E. H., Dunstan, D. W., Wareham, N. J., Yates, T. E., Wijndaele, K., et al. (2019) · Journal of Physical Activity and Health · doi:10.1123/jpah.2019-0377 · Cited by 150
Chaput, J., Saunders, T. J., & Carson, V. (2017) · Obesity Reviews · doi:10.1111/obr.12508 · Cited by 139
Janssen, I., Roberts, K. C., & Thompson, W. (2017) · Applied Physiology, Nutrition, and Metabolism · doi:10.1139/apnm-2016-0681 · Cited by 137
Dall, P., Ellis, S. L. H., Ellis, B., Grant, P., Colyer, A., Gee, N. R., Granat, M. H., & Mills, D. S. (2017) · BMC Public Health · doi:10.1186/s12889-017-4422-5 · Cited by 148
Blodgett, J. M., Ahmadi, M. N., Atkin, A. J., CHASTIN, S. F. M., Chan, H., Suorsa, K., Bakker, E. A., Hettiarcachchi, P., Johansson, P. J., Sherar, L. B., et al. (2023) · European Heart Journal · doi:10.1093/eurheartj/ehad717 · Cited by 151
Self-citationSedentary behaviour across the primary-secondary school transition: A systematic review
Pearson, N., Haycraft, E., Johnston, J., & Atkin, A. J. (2016) · Preventive Medicine · doi:10.1016/j.ypmed.2016.11.010 · Cited by 130
Replacing Sedentary Time: Meta-analysis of Objective-Assessment Studies
del Pozo-Cruz, J., García‐Hermoso, A., Alfonso‐Rosa, R. M., Álvarez‐Barbosa, F., Owen, N. G., CHASTIN, S. F. M., & Cruz, B. D. P. (2018) · American Journal of Preventive Medicine · doi:10.1016/j.amepre.2018.04.042 · Cited by 141
Self-citationToo much sitting and all-cause mortality: is there a causal link?
Biddle, S., Bennie, J. A., Bauman, A. E., Chau, J. Y., Dunstan, D. W., Owen, N. G., Stamatakis, E., & van Uffelen, J. G. Z. (2016) · BMC Public Health · doi:10.1186/s12889-016-3307-3 · Cited by 139
“Accounting for these behaviours across 24 h may require investigation using compositional data analysis [70, 71].”
Dumuid, D., Stanford, T., Pedišić, Ž., Maher, C. A., Lewis, L. K., Fernández, J. A. M., Katzmarzyk, P. T., Chaput, J., Fogelholm, M., Standage, M., et al. (2018) · BMC Public Health · doi:10.1186/s12889-018-5207-1 · Cited by 121
Carson, V., Tremblay, M. S., & CHASTIN, S. F. M. (2017) · BMC Public Health · doi:10.1186/s12889-017-4852-0 · Cited by 114
Self-citationShrestha, N., Grgić, J., Wiesner, G., Parker, A. G., Podnar, H., Bennie, J. A., Biddle, S., & Pedišić, Ž. (2018) · British Journal of Sports Medicine · doi:10.1136/bjsports-2017-098270 · Cited by 108
Changes in sedentary behaviour in European Union adults between 2002 and 2017
López‐Valenciano, A., Mayo, X., Liguori, G. A., Copeland, R. J., Lamb, M., & Jiménez, A. (2020) · BMC Public Health · doi:10.1186/s12889-020-09293-1 · Cited by 123
Santos, R., Zhang, Z., Pereira, J. R., Sousa‐Sá, E., Cliff, D. P., & Okely, A. D. (2017) · BMC Public Health · doi:10.1186/s12889-017-4857-8 · Cited by 104
Cassidy, S., Chau, J. Y., Catt, M., Bauman, A. E., & Trenell, M. I. (2017) · International Journal of Behavioral Nutrition and Physical Activity · doi:10.1186/s12966-017-0514-y · Cited by 105
Gupta, N., Mathiassen, S. E., Mateu‐Figueras, G., Heiden, M., Hallman, D., Jørgensen, M. B., & Holtermann, A. (2018) · International Journal of Behavioral Nutrition and Physical Activity · doi:10.1186/s12966-018-0685-1 · Cited by 107
Gupta, N., Heiden, M., Aadahl, M., Korshøj, M., Jørgensen, M. B., & Holtermann, A. (2016) · PLoS ONE · doi:10.1371/journal.pone.0154935 · Cited by 97
McGregor, D. E., Carson, V., Palarea‐Albaladejo, J., Dall, P., Tremblay, M. S., & CHASTIN, S. F. M. (2018) · International Journal of Environmental Research and Public Health · doi:10.3390/ijerph15081779 · Cited by 97
Self-citationThe multivariate physical activity signature associated with metabolic health in children
Aadland, E., Kvalheim, O. M., Anderssen, S. A., Resaland, G. K., & Andersen, L. B. (2018) · International Journal of Behavioral Nutrition and Physical Activity · doi:10.1186/s12966-018-0707-z · Cited by 96
Time-Use Patterns and Health-Related Quality of Life in Adolescents
Wong, M., Olds, T., Gold, L. H., Lycett, K., Dumuid, D., Muller, J., Mensah, F. K., Burgner, D. P., Carlin, J. B., Edwards, B., et al. (2017) · PEDIATRICS · doi:10.1542/peds.2016-3656 · Cited by 96
Gupta, N., Dencker-Larsen, S., Rasmussen, C. L., McGregor, D., Rasmussen, C. L., Thorsen, S. V., Jørgensen, M. B., CHASTIN, S. F. M., & Holtermann, A. (2020) · International Journal of Behavioral Nutrition and Physical Activity · doi:10.1186/s12966-020-00988-7 · Cited by 94
Self-citationTalarico, R., & Janssen, I. (2018) · International Journal of Obesity · doi:10.1038/s41366-018-0053-x · Cited by 91
Ross, R., & Tremblay, M. S. (2020) · Applied Physiology Nutrition and Metabolism · doi:10.1139/apnm-2020-0843 · Cited by 90
Kandola, A. A., Cruz, B. D. P., Osborn, D., Stubbs, B., Choi, K. W., & Hayes, J. (2021) · BMC Medicine · doi:10.1186/s12916-021-02007-3 · Cited by 105
The relation between sleep duration and sedentary behaviours in European adults
Lakerveld, J., Mackenbach, J. D., Horváth, E., Rutters, F., Compernolle, S., Bárdos, H., Bourdeaudhuij, I. D., Charreire, H., Rutter, H., Oppert, J., et al. (2016) · Obesity Reviews · doi:10.1111/obr.12381 · Cited by 89
Duvivier, B. M. F. M., Schaper, N. C., Koster, A., van Kan, L., Peters, H. P. F., Adam, J. J., Giesbrecht, T., Moonen‐Kornips, E., Hulsbosch, M. M., Willems, P. J. B., et al. (2017) · Frontiers in Physiology · doi:10.3389/fphys.2017.00353 · Cited by 94
Introducing 24-Hour Movement Guidelines for the Early Years: A New Paradigm Gaining Momentum
Tremblay, M. S. (2019) · Journal of Physical Activity and Health · doi:10.1123/jpah.2019-0401 · Cited by 91
García‐Hermoso, A., Ezzatvar, Y., Ramírez‐Vélez, R., Olloquequi, J., & Izquierdo, M. (2020) · Journal of sport and health science/Journal of Sport and Health Science · doi:10.1016/j.jshs.2020.12.001 · Cited by 103
Lee, E., Hesketh, K. D., Hunter, S., Kuzik, N., Rhodes, R. E., Rinaldi, C. M., Spence, J. C., & Carson, V. (2017) · BMC Public Health · doi:10.1186/s12889-017-4855-x · Cited by 90
Burchartz, A., Anedda, B., Auerswald, T., Giurgiu, M., Hill, H., Ketelhut, S., Kolb, S., Mall, C., Manz, K., Nigg, C. R., et al. (2020) · Psychology of sport and exercise · doi:10.1016/j.psychsport.2020.101703 · Cited by 104
Giné‐Garriga, M., Sansano-Nadal, O., Tully, M. A., Caserotti, P., Coll‐Planas, L., Rothenbacher, D., Dallmeier, D., Denkinger, M. D., Wilson, J. J., Martín-Borràs, C., et al. (2020) · The Journals of Gerontology Series A · doi:10.1093/gerona/glaa016 · Cited by 96
Carson, V., Tremblay, M. S., Chaput, J., McGregor, D., & CHASTIN, S. F. M. (2019) · PLoS ONE · doi:10.1371/journal.pone.0220009 · Cited by 85
Self-citationObjective measurement of sedentary behaviour using accelerometers
Byrom, B., Stratton, G., Carthy, M. M., & Muehlhausen, W. (2016) · International Journal of Obesity · doi:10.1038/ijo.2016.136 · Cited by 86
Adherence to the 24-Hour Movement Guidelines among 10- to 17-year-old Canadians
Janssen, I., Roberts, K. C., & Thompson, W. (2017) · Health Promotion and Chronic Disease Prevention in Canada · doi:10.24095/hpcdp.37.11.01 · Cited by 84
Cepeda, M., Koolhaas, C. M., van Rooij, F. J. A., Tiemeier, H. W., Guxens, M., Franco, O. H., & Schoufour, J. D. (2018) · Maturitas · doi:10.1016/j.maturitas.2018.01.016 · Cited by 94
Dumuid, D., Olds, T., Lewis, L. K., Fernández, J. A. M., Barreira, T. V., Broyles, S. T., Chaput, J., Fogelholm, M., Hu, G., Kuriyan, R., et al. (2016) · Pediatric Obesity · doi:10.1111/ijpo.12196 · Cited by 91
Cruz, B. D. P., Alfonso‐Rosa, R. M., McGregor, D., CHASTIN, S. F. M., Palarea‐Albaladejo, J., & Cruz, J. D. P. (2020) · Journal of Affective Disorders · doi:10.1016/j.jad.2020.01.023 · Cited by 84
Self-citationMiatke, A., Olds, T., Maher, C. A., Fraysse, F., Mellow, M. L., Smith, A. E., Pedišić, Ž., Grgić, J., & Dumuid, D. (2023) · International Journal of Behavioral Nutrition and Physical Activity · doi:10.1186/s12966-023-01526-x · Cited by 84
Cardiometabolic Impact of Changing Sitting, Standing, and Stepping in the Workplace
WINKLER, E. A. H., CHASTIN, S. F. M., Eakin, E., Owen, N. G., LaMontagne, A. D., Moodie, M., Dempsey, P. C., Kingwell, B. A., Dunstan, D. W., & Healy, G. N. (2017) · Medicine & Science in Sports & Exercise · doi:10.1249/mss.0000000000001453 · Cited by 82
Self-citationKatzmarzyk, P. T., Chaput, J., Fogelholm, M., Hu, G., Maher, C. A., Maia, J. A. R., Olds, T., Sarmiento, O. L., Standage, M., Tremblay, M. S., et al. (2019) · Nutrients · doi:10.3390/nu11040848 · Cited by 86
Bezerra, T. A., Clark, C. C. T., Filho, A. N. D. S., Fortes, L. D. S., Mota, J. A. P. S., Duncan, M. J., & Martins, C. (2020) · European Journal of Sport Science · doi:10.1080/17461391.2020.1795274 · Cited by 80
Taylor, R. W., Haszard, J. J., Meredith-Jones, K. A., Galland, B. C., Heath, A. M., Lawrence, J., Gray, A. R., Sayers, R., Hanna, M., & Taylor, B. J. (2018) · International Journal of Behavioral Nutrition and Physical Activity · doi:10.1186/s12966-018-0753-6 · Cited by 80
McGregor, D. E., Palarea‐Albaladejo, J., Dall, P., Cruz, B. D. P., & CHASTIN, S. F. M. (2019) · European Journal of Preventive Cardiology · doi:10.1177/2047487319867783 · Cited by 78
Self-citationCraemer, M. D., McGregor, D., Androutsos, O., Μanios, Y., & Cardon, G. (2018) · International Journal of Environmental Research and Public Health · doi:10.3390/ijerph15102171 · Cited by 78
Mekary, R. A., & Ding, E. L. (2019) · International Journal of Environmental Research and Public Health · doi:10.3390/ijerph16050797 · Cited by 79
Hayes, J. F., Balantekin, K. N., Altman, M., Wilfley, D. E., Taylor, C. B., & Williams, J. W. (2017) · Childhood Obesity · doi:10.1089/chi.2017.0148 · Cited by 78
Stańczykiewicz, B., Banik, A., Knoll, N., Keller, J., Hohl, D. H., Rosińćzuk, J., & Łuszczyńska, A. (2019) · BMC Public Health · doi:10.1186/s12889-019-6715-3 · Cited by 83
Rosique-Esteban, N., Díaz‐López, A., Martínez‐González, M. Á., Corella, D., Goday, A., Martínez, J. A., Romaguera, D., Vioqué, J., Arós, F., García‐Ríos, A., et al. (2017) · PLoS ONE · doi:10.1371/journal.pone.0172253 · Cited by 74
Frank, L. D., Hong, A., & Ngo, V. D. (2019) · Preventive Medicine · doi:10.1016/j.ypmed.2019.01.011 · Cited by 82
Dumuid, D., Lewis, L. K., Olds, T., Maher, C. A., Bondarenko, C., & Norton, L. (2018) · Maturitas · doi:10.1016/j.maturitas.2018.02.003 · Cited by 75
Verswijveren, S. J. J. M., Lamb, K. E., Bell, L. A., Timperio, A. F., Salmon, J., & Ridgers, N. D. (2018) · PLoS ONE · doi:10.1371/journal.pone.0201947 · Cited by 78
Marçal, I. R., Fernandes, B., Viana, A. A., & Ciolac, E. G. (2020) · Frontiers in Endocrinology · doi:10.3389/fendo.2020.584642 · Cited by 75
A Review of Accelerometer-based Activity Monitoring in Cancer Survivorship Research
Peddle‐McIntyre, C. J., Cavalheri, V., Boyle, T., McVeigh, J. A., Jeffery, E., Lynch, B. M., & Vallance, J. K. (2018) · Medicine & Science in Sports & Exercise · doi:10.1249/mss.0000000000001644 · Cited by 73
Pereira, J. R., Cliff, D. P., Sousa‐Sá, E., Zhang, Z., & Santos, R. (2018) · Scandinavian Journal of Medicine and Science in Sports · doi:10.1111/sms.13339 · Cited by 74
Metadata
- Authors
- Chastin, S. F. M., Palarea-Albaladejo, J., Dontje, M. L., & Skelton, D. A.
- Affiliations
- Glasgow Caledonian University (GB)
- Corresponding author
- Chastin, Sebastien F. M.
- Venue
- PLOS ONE
- Publisher
- Public Library of Science (PLoS)
- Published
- 2015-10-13
- Volume
- 10
- Issue
- 10
- Pages
- e0139984
- ISSN
- 1932-6203 (ISSN-L)
- PMC
- PMC4604082
- OpenAlex
- W1818552750
- Semantic Scholar
- 26e3231050045c392eb982c52747c0cf1c3a90ec
- Cited by
- 1,034
- References
- 70
- Citations by year
- 2026: 81 · 2025: 115 · 2024: 124 · 2023: 108 · 2022: 90 · 2021: 109 · 2020: 140 · 2019: 90 · 2018: 72 · 2017: 67 · 2016: 36
- FWCI
- 42.99
- Type
- journal article
- Language
- en
- Open access
- gold
- doi.org
- Licence
- Locations
- PLoS ONE (publishedVersion, cc-by)
- Europe PMC (PubMed Central) (publishedVersion, cc-by)
- PubMed Central (publishedVersion, cc-by)
- PubMed (publishedVersion)
- ResearchOnline (Glasgow Caledonian University) (acceptedVersion, cc-by)
- DOAJ (DOAJ: Directory of Open Access Journals) (submittedVersion, cc-by-sa)
- Figshare (submittedVersion, cc-by)
- Funders
- Rural and Environment Science and Analytical Services Division
- Scottish Government
- Topics
- Health Sciences › Medicine › Public Health, Environmental and Occupational Health › Physical Activity and Health
- Health Sciences › Medicine › Public Health, Environmental and Occupational Health › Obesity, Physical Activity, Diet
- Social Sciences › Psychology › Experimental and Cognitive Psychology › Sleep and related disorders
- Keywords
- physical activity, sedentary behavior, sleep, time budget, compositional data analysis, obesity, cardiometabolic health, waist circumference, blood pressure, insulin, triglycerides, light physical activity, moderate-to-vigorous physical activity, time displacement, diabetes risk, NHANES
- MeSH terms
- Adult, Behavior, Blood Glucose, Blood Pressure, C-Reactive Protein, Diastole, Fasting, Humans, Insulin, Lipids, Middle Aged, Motor Activity, Obesity, Sleep, Statistics as Topic, Systole, Time Factors, Body Mass Index, Linear Models, Waist Circumference, Young Adult, Sedentary Behavior
About these checks
Registry, retraction, Cites and statistics results are computed, not judged, with one exception: a printed reference that no index lists is read once by a model before it counts as a citation error. Claims are extracted by a model and kept only when their quote appears verbatim in the text; each cited source is then checked, with a model’s help, for whether it says what the claim relies on. Those verdicts can be wrong — read the claim’s quote and the cited source before relying on one.
A language model drew the claims from the paper on 2026-10-10, under version 3 of the claim definition (model deepseek-v4.1-flash, prompt extract-v3).
A second model labelled each claim on 2026-10-10 (model jev-1.13-20260917, definition revision gold-guideline-v0.2).
Statistics and arithmetic are recomputed, not judged.
Confidence bands are shown only for fields calibrated on our annotated test set. None is calibrated yet, so no band is shown.
What counts as a claim ›How we measure confidence ›How we check this ›
Are you an author, or do you see a problem with this page? Request a review
