

The DOI matches its Crossref record; 49 of the 49 references it cites were found in a registry or an index; none of the 55 sources its claims cite is checked for support yet.
Relationship between food waste, diet quality, and environmental sustainability
Open accessAbstract
Improving diet quality while simultaneously reducing environmental impact is a critical focus globally. Metrics linking diet quality and sustainability have typically focused on a limited suite of indicators, and have not included food waste. To address this important research gap, we examine the relationship between food waste, diet quality, nutrient waste, and multiple measures of sustainability: use of cropland, irrigation water, pesticides, and fertilizers. Data on food intake, food waste, and application rates of agricultural amendments were collected from diverse US government sources. Diet quality was assessed using the Healthy Eating Index-2015. A biophysical simulation model was used to estimate the amount of cropland associated with wasted food. This analysis finds that US consumers wasted 422g of food per person daily, with 30 million acres of cropland used to produce this food every year. This accounts for 30% of daily calories available for consumption, one-quarter of daily food (by weight) available for consumption, and 7% of annual cropland acreage. Higher quality diets were associated with greater amounts of food waste and greater amounts of wasted irrigation water and pesticides, but less cropland waste. This is largely due to fruits and vegetables, which are health-promoting and require small amounts of cropland, but require substantial amounts of agricultural inputs. These results suggest that simultaneous efforts to improve diet quality and reduce food waste are necessary. Increasing consumers' knowledge about how to prepare and store fruits and vegetables will be one of the practical solutions to reducing food waste.
Overview
AI snapshot
Written from the paper’s full text.
TL;DR
US consumers wasted 422 g of food per person daily from 2007–2014, with about 30 million acres of cropland used annually to produce that wasted food. Higher diet quality was associated with greater food waste and greater wasted irrigation water and pesticides, but less cropland waste.
Key findings
- Daily per capita food waste was 421.5 g (95% CI: 409.1–433.9 g), representing nearly 26% of food by weight and over 800 kcal (795–840 kcal) per person per day, about 29% of total daily energy intake.
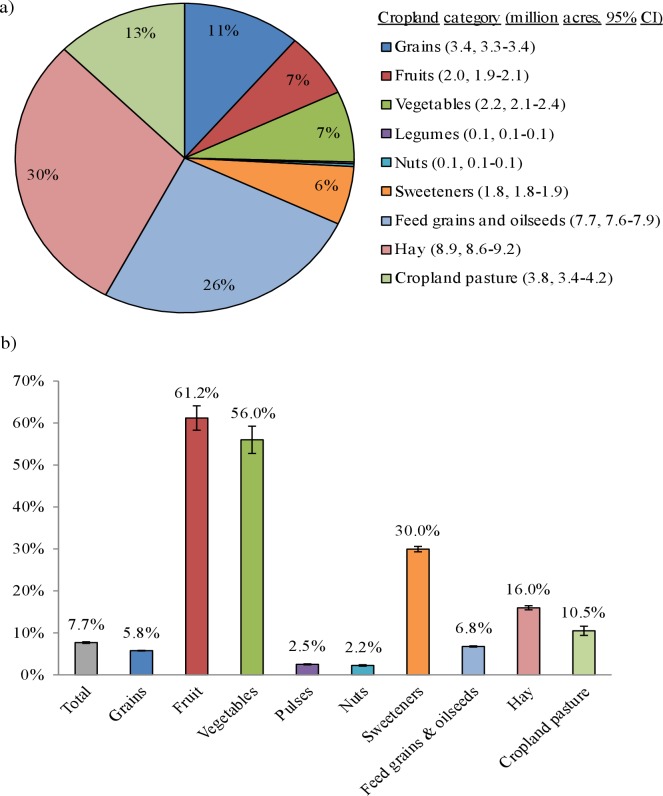
- Wasted food was grown on 30.02 million acres (95% CI: 29.29–30.76 million acres), or 7.7% of harvested US cropland, and embodied 4.2 trillion gallons of irrigation water, 780 million pounds of pesticides, 1.8 billion pounds of nitrogen fertilizer, 1.5 billion pounds of phosphorus (P2O5) fertilizer, and 2.3 billion pounds of potash (K2O) fertilizer.
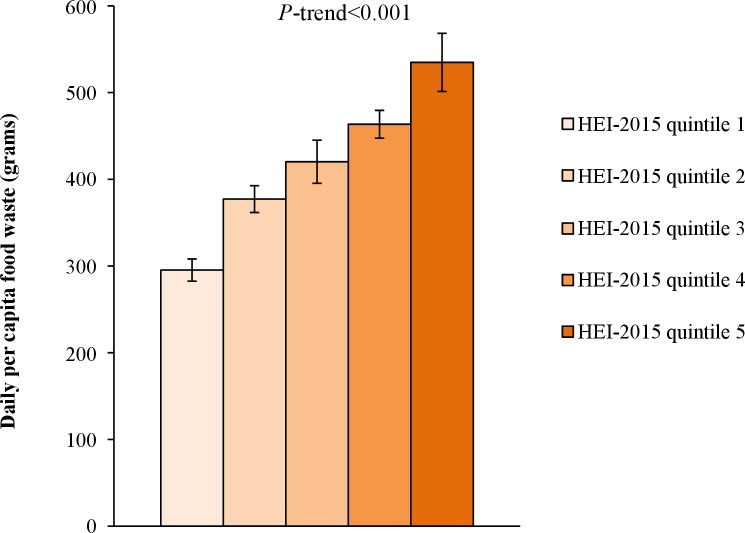
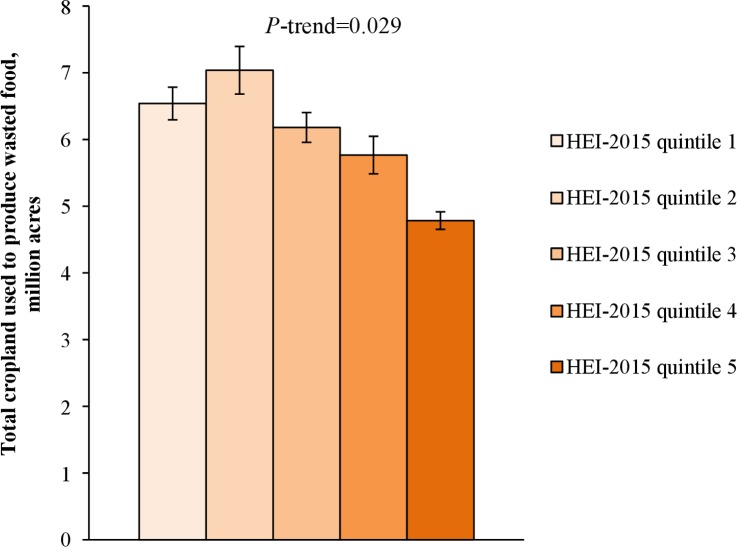
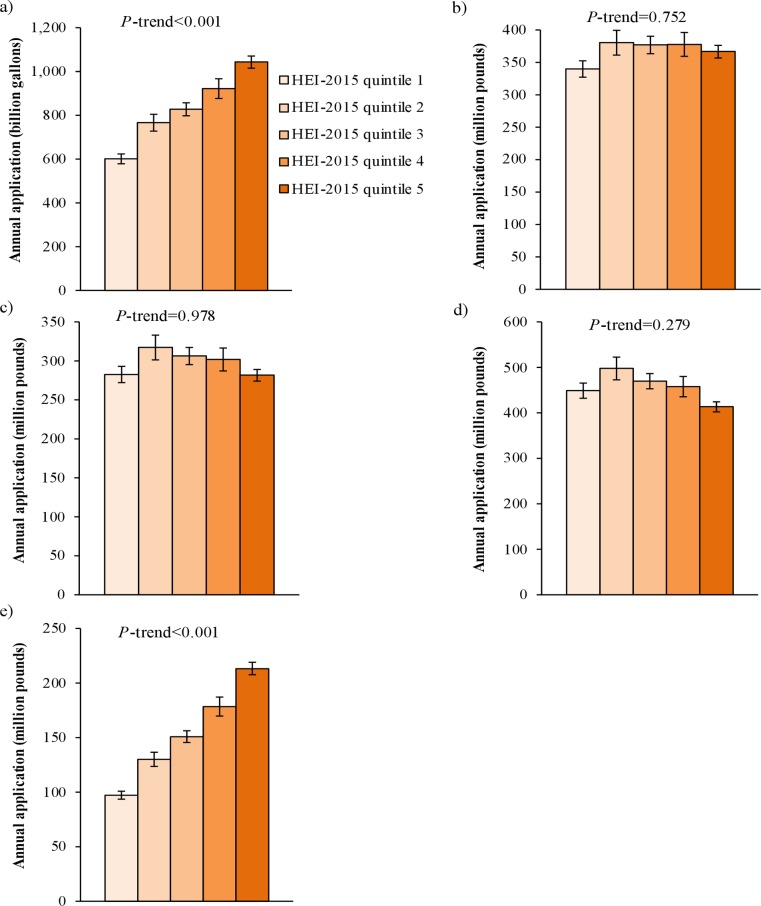
- Higher diet quality was associated with greater food waste: mean waste rose from 295 g/day in HEI-2015 quintile 1 to 535 g/day in quintile 5 (P<0.001). Higher diet quality was also associated with less cropland waste (P=0.029) but greater wasted irrigation water and pesticides (P<0.001).
- Fruits and vegetables and mixed fruit/vegetable dishes accounted for 39% of food waste; over 60% of land used to grow fruit and 56% of land used to grow vegetables was wasted.
Methods
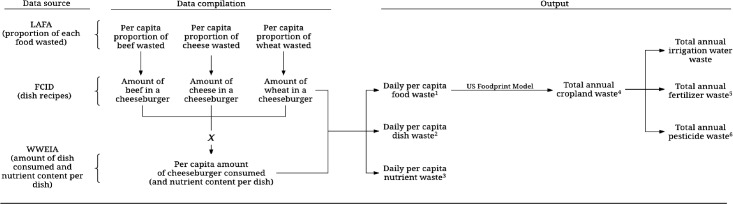
- Linked US government datasets: NHANES/WWEIA 2007–2014 dietary data from 35,507 individuals aged 2+ years, FCID for ingredient disaggregation, FPED for HEI-2015 components, and USDA LAFA for consumer-level food waste.
- Diet quality was assessed with HEI-2015 and grouped into quintiles; food waste and agricultural resource use were estimated using the US Foodprint Model, a biophysical simulation model with a Monte Carlo simulation of 1,000 random non-replacement draws.
- Relationships between food waste or sustainability measures and HEI-2015 quintiles were tested with simple linear regression for trend, adjusted for WWEIA’s complex sampling design; significance set at P<0.05.
Limitations
- The paper states that food waste estimates included cooking losses, that LAFA waste rates may vary in ways not captured, that the model assumed all food consumed in the US was domestically grown, and that self-reported dietary data are subject to measurement error that may overestimate total food waste.
- The paper also notes that the US agricultural sector is highly productive, so the approach may have underestimated cropland used to produce wasted food.
- Evident from the design: the analysis is observational and cross-sectional, so the reported associations between diet quality and food waste or resource use cannot establish causality.
Model-written summary. Check it against the paper before relying on it.
Integrity signals
Registry
Cites
Statistics
Figures
Verification
Claims the paper makes
38 Not checked yet · 28 Own result · 11 Own method · 11 Own interpretation · 3 No basis given
A result the paper reports from its own data — it cites no other source for it, so there is none to check. The quote shows it is in the paper.
In the paper
“Fruits and vegetables and mixed fruit and vegetable dishes accounted for 39% of food waste, followed by dairy (17%), meat and mixed meat dishes (14%), and grains and grain mixed dishes (12%).”
§ Relationship between food waste, diet quality, and environmental sustainability > Results > Daily per capita food and nutrient waste
plain- Asserted: passes — The authors put it forward as true.
- Checkable: passes — It can be checked against evidence.
- Load-bearing: unclear — It is unclear whether the paper’s conclusions depend on it.
- Based: passes — The paper gives a reason why it holds.
A result the paper reports from its own data — it cites no other source for it, so there is none to check. The quote shows it is in the paper.
In the paper
“Over 800 kcal (795–840 kcal) were wasted per person per day, representing about 29% of total daily energy intake (S4 Table).”
§ Relationship between food waste, diet quality, and environmental sustainability > Results > Daily per capita food and nutrient waste
plain- Asserted: passes — The authors put it forward as true.
- Checkable: passes — It can be checked against evidence.
- Load-bearing: unclear — It is unclear whether the paper’s conclusions depend on it.
- Based: passes — The paper gives a reason why it holds.
A result the paper reports from its own data — it cites no other source for it, so there is none to check. The quote shows it is in the paper.
In the paper
“Nearly 26% (95% CI: 25–26%) of food was wasted by US consumers every day from 2007–2014 (S3 Table).”
§ Relationship between food waste, diet quality, and environmental sustainability > Results > Daily per capita food and nutrient waste
plain- Asserted: passes — The authors put it forward as true.
- Checkable: passes — It can be checked against evidence.
- Load-bearing: unclear — It is unclear whether the paper’s conclusions depend on it.
- Based: passes — The paper gives a reason why it holds.
A result the paper reports from its own data — it cites no other source for it, so there is none to check. The quote shows it is in the paper.
In the paper
“Approximately 1.8 billion pounds (1.8–1.9 billion pounds) of nitrogen fertilizer (S7 Table), 1.5 billion pounds (1.4–1.5 billion pounds) of phosphorus (P2O5) fertilizer (S8 Table), and 2.3 billion pounds (2.2–2.3 billion pounds) of potash (K2O) fertilizer (S9 Table) were applied to wasted cropland, largely attributable to cropland used to produce feed grains and oilseeds and hay.”
§ Relationship between food waste, diet quality, and environmental sustainability > Results > Annual cropland and agricultural amendments used to produce wasted food
plain- Asserted: passes — The authors put it forward as true.
- Checkable: passes — It can be checked against evidence.
- Load-bearing: unclear — It is unclear whether the paper’s conclusions depend on it.
- Based: passes — The paper gives a reason why it holds.
A result the paper reports from its own data — it cites no other source for it, so there is none to check. The quote shows it is in the paper.
In the paper
“Importantly, higher quality diets were associated with greater food waste but less waste of cropland; as well as greater waste of irrigation water and pesticides, but not fertilizers.”
§ Relationship between food waste, diet quality, and environmental sustainability > Discussion
plain- Asserted: passes — The authors put it forward as true.
- Checkable: passes — It can be checked against evidence.
- Load-bearing: passes — The paper’s conclusions depend on it.
- Based: passes — The paper gives a reason why it holds.
A result the paper reports from its own data — it cites no other source for it, so there is none to check. The quote shows it is in the paper.
In the paper
“Over 800 kcal (795–840 kcal) were wasted per person per day, representing about 29% of total daily energy intake (S4 Table).”
§ Relationship between food waste, diet quality, and environmental sustainability > Results > Daily per capita food and nutrient waste
plain- Asserted: passes — The authors put it forward as true.
- Checkable: passes — It can be checked against evidence.
- Load-bearing: passes — The paper’s conclusions depend on it.
- Based: passes — The paper gives a reason why it holds.
A result the paper reports from its own data — it cites no other source for it, so there is none to check. The quote shows it is in the paper.
In the paper
“Higher quality diets were associated with greater amounts of food waste and greater amounts of wasted irrigation water and pesticides, but less cropland waste.”
- Also stated in: § Daily per capita food waste and diet quality · plain
“Higher diet quality was also associated with greater waste of irrigation water (P<0.001) and pesticides (P<0.001; Fig 5).”
- Also stated in: § Discussion · plain
“as well as greater waste of irrigation water and pesticides, but not fertilizers.”
§ Relationship between food waste, diet quality, and environmental sustainability > Abstract
plaincorrelational- Asserted: passes — The authors put it forward as true.
- Checkable: passes — It can be checked against evidence.
- Load-bearing: passes — The paper’s conclusions depend on it.
- Based: passes — The paper gives a reason why it holds.
- Also stated in: § Daily per capita food waste and diet quality · plain
A result the paper reports from its own data — it cites no other source for it, so there is none to check. The quote shows it is in the paper.
In the paper
“This accounts for 30% of daily calories available for consumption, one-quarter of daily food (by weight) available for consumption, and 7% of annual cropland acreage.”
- Also stated in: § Discussion · hedged
“This accounts for about 30% of daily calories available for consumption, one-quarter of daily food (by weight) available for consumption, and 7% of annual cropland acreage.”
§ Relationship between food waste, diet quality, and environmental sustainability > Abstract
plain- Asserted: passes — The authors put it forward as true.
- Checkable: passes — It can be checked against evidence.
- Load-bearing: passes — The paper’s conclusions depend on it.
- Based: passes — The paper gives a reason why it holds.
- Also stated in: § Discussion · hedged
A result the paper reports from its own data — it cites no other source for it, so there is none to check. The quote shows it is in the paper.
In the paper
“but less cropland waste.”
- Also stated in: § Daily per capita food waste and diet quality · plain
“Higher diet quality was associated (P = 0.029) with less cropland used to produce wasted food (Fig 4).”
- Also stated in: § Discussion · plain
“but less waste of cropland”
§ Relationship between food waste, diet quality, and environmental sustainability > Abstract
plaincorrelational- Asserted: passes — The authors put it forward as true.
- Checkable: passes — It can be checked against evidence.
- Load-bearing: passes — The paper’s conclusions depend on it.
- Based: passes — The paper gives a reason why it holds.
- Also stated in: § Daily per capita food waste and diet quality · plain
A result the paper reports from its own data — it cites no other source for it, so there is none to check. The quote shows it is in the paper.
In the paper
“Nearly 4.2 trillion gallons (95% CI: 4.1–4.3 trillion gallons) of irrigation water were applied to cropland that was used to produce uneaten food (S5 Table).”
§ Relationship between food waste, diet quality, and environmental sustainability > Results > Annual cropland and agricultural amendments used to produce wasted food
plain- Asserted: passes — The authors put it forward as true.
- Checkable: passes — It can be checked against evidence.
- Load-bearing: passes — The paper’s conclusions depend on it.
- Based: passes — The paper gives a reason why it holds.
- It may state two separate claims as one. 12
- Probably not a substantial claim. 27
A result the paper reports from its own data — it cites no other source for it, so there is none to check. The quote shows it is in the paper.
In the paper
“Annually, wasted food was grown on the equivalent of over 30 million acres (95% CI: 29.3–30.8 million acres) of cropland, representing 7.7% (7.5–7.9%) of all harvested cropland in the US (Fig 2A).”
§ Relationship between food waste, diet quality, and environmental sustainability > Results > Annual cropland and agricultural amendments used to produce wasted food
plain- Asserted: passes — The authors put it forward as true.
- Checkable: passes — It can be checked against evidence.
- Load-bearing: passes — The paper’s conclusions depend on it.
- Based: passes — The paper gives a reason why it holds.
It may state two separate claims as one.
The paper states this without a source or data behind it here, so there is nothing to check it against. The quote shows it is in the paper.
In the paper
“Furthermore, we find that higher diet quality is associated with greater food waste but less cropland waste, and greater waste of agricultural irrigation water and pesticides.”
§ Relationship between food waste, diet quality, and environmental sustainability > Conclusion
plaincorrelational- Asserted: passes — The authors put it forward as true.
- Checkable: passes — It can be checked against evidence.
- Load-bearing: passes — The paper’s conclusions depend on it.
- Based: passes — The paper gives a reason why it holds.
It may state two separate claims as one.
What the paper did — it cites no source for this, so there is none to check. The quote shows it is in the paper.
In the paper
“Two investigators matched data independently, and consensus was used to resolve infrequent differences.”
§ Relationship between food waste, diet quality, and environmental sustainability > Methods > Data compilation
plain- Asserted: passes — The authors put it forward as true.
- Checkable: passes — It can be checked against evidence.
- Load-bearing: fails — The paper’s conclusions may not depend on it.
- Based: passes — The paper gives a reason why it holds.
Probably not a substantial claim. The paper’s conclusions may not depend on it. It may state two separate claims as one.
In the paper
“All analyses were adjusted for the complex, multistage, probability sampling design of WWEIA using standardized procedures and variables provided by the National Center for Health Statistics.[42]”
§ Relationship between food waste, diet quality, and environmental sustainability > Methods > Analysis
What the sources say
- Not checked yetcites [42] US Department of Health and Human Services, National Center for Health Statistics. National Health and Nutrition Examination Survey: Analytic Guidelines, 2011–2012. Available at: https://wwwn.cdc.gov/nchs/nhanes/analyticguidelines.aspx (verified 07 March 2018).
plain- Asserted: passes — The authors put it forward as true.
- Checkable: passes — It can be checked against evidence.
- Load-bearing: passes — The paper’s conclusions depend on it.
- Based: passes — The paper gives a reason why it holds.
Probably not a substantial claim.
In the paper
“HEI-2015 provides a measure of compliance with the 2015–2020 Dietary Guidelines for Americans,[33] and includes 13 components, nine of which assess adequacy”
§ Relationship between food waste, diet quality, and environmental sustainability > Methods > Diet quality assessment
What the sources say
- Not checked yetcites [33] US Department of Health and Human Services and US Department of Agriculture. Dietary Guidelines for Americans 2015–2020. Washington, DC; 2015–2020. Available at: http://health.gov/dietaryguidelines/ (verified 07 March 2018).
plain- Asserted: passes — The authors put it forward as true.
- Checkable: passes — It can be checked against evidence.
- Load-bearing: passes — The paper’s conclusions depend on it.
- Based: passes — The paper gives a reason why it holds.
Probably not a substantial claim.
In the paper
“which has been demonstrated to generate scores that more closely reflect the true population mean than the arithmetic mean of individual-level scores.[35]”
§ Relationship between food waste, diet quality, and environmental sustainability > Methods > Diet quality assessment
What the sources say
- Not checked yetcites [35] LS Freedman, 2008, A population's mean Healthy Eating Index-2005 scores are best estimated by the score of the population ratio when one 24-hour recall is available, J Nutr source
boosted- Asserted: passes — The authors put it forward as true.
- Checkable: passes — It can be checked against evidence.
- Load-bearing: fails — The paper’s conclusions may not depend on it.
- Based: passes — The paper gives a reason why it holds.
Probably not a substantial claim. The paper’s conclusions may not depend on it.
What the paper did — it cites no source for this, so there is none to check. The quote shows it is in the paper.
In the paper
“These results are robust and novel given this interdisciplinary context, the large size of our dataset, and the timely nature of the topic and data sources.”
§ Relationship between food waste, diet quality, and environmental sustainability > Discussion
boosted- Asserted: passes — The authors put it forward as true.
- Checkable: fails — It may be too vague to check against evidence.
- Load-bearing: fails — The paper’s conclusions may not depend on it.
- Based: passes — The paper gives a reason why it holds.
Probably not a substantial claim. It may be too vague to check against evidence. The paper’s conclusions may not depend on it. It may state two separate claims as one.
In the paper
“FCID is the only source of data on the amount of individual ingredients in each WWEIA dish and, therefore, represents the most comprehensive and reliable data available on dish recipes.”
§ Relationship between food waste, diet quality, and environmental sustainability > Methods > Composition of mixed dishes
What the sources say
- Not checked yetcites [31] US Environmental Protection Agency. Food Commodity Intake Database (FCID). 2005–2010. Available at: http://fcid.foodrisk.org/# (verified 07 March 2018).
plain- Asserted: passes — The authors put it forward as true.
- Checkable: passes — It can be checked against evidence.
- Load-bearing: passes — The paper’s conclusions depend on it.
- Based: passes — The paper gives a reason why it holds.
It may state two separate claims as one.
A conclusion the paper draws from its own results — it cites no other source for it, so there is none to check. The quote shows it is in the paper.
In the paper
“These results suggest that simultaneous efforts to improve diet quality and reduce food waste are necessary.”
§ Relationship between food waste, diet quality, and environmental sustainability > Abstract
hedged- Asserted: passes — The authors put it forward as true.
- Checkable: fails — It may be too vague to check against evidence.
- Load-bearing: passes — The paper’s conclusions depend on it.
- Based: passes — The paper gives a reason why it holds.
Probably not a substantial claim. It may be too vague to check against evidence.
None of the sources cited for this claim have been checked yet.
In the paper
“Analyses linking diet quality and environmental sustainability have typically focused on a limited suite of sustainability indicators, and have not typically included food waste, despite a growing focus on understanding where and how food is wasted in the food system.[14–16]”
§ Relationship between food waste, diet quality, and environmental sustainability > Introduction
What the sources say
- Not checked yetcites [14] M Kummu, 2012, Lost food, wasted resources: global food supply chain losses and their impacts on freshwater, cropland, and fertiliser use, Sci Total Environ source
- Not checked yetcites [15] KL Thyberg, 2016, Drivers of food waste and their implications for sustainable policy development, Res, Cons, & Recyc source
- Not checked yetcites [16] KL Thyberg, 2015, Quantification of Food Waste Disposal in the United States: A Meta-Analysis, Environ Sci Technol source
plain- Asserted: passes — The authors put it forward as true.
- Checkable: passes — It can be checked against evidence.
- Load-bearing: passes — The paper’s conclusions depend on it.
- Based: passes — The paper gives a reason why it holds.
It may state two separate claims as one.
None of the sources cited for this claim have been checked yet.
In the paper
“over 20% of food is lost or wasted at the consumer level each year,[24] accounting for 225–290 pounds per person per year[16, 24, 25] and 760–790 kcal per person per day.[16, 24–26]”
§ Relationship between food waste, diet quality, and environmental sustainability > Introduction
What the sources say
- Not checked yetcites [16] KL Thyberg, 2015, Quantification of Food Waste Disposal in the United States: A Meta-Analysis, Environ Sci Technol source
- Not checked yetcites [24] J Buzby, 2014
- Not checked yetcites [25] US Environmental Protection Agency. Advancing sustainable materials management: 2014 tables and figures. 2016. Available at: https://www.epa.gov/smm/advancing-sustainable-materials-management-facts-and-figures-report (verified 07 March 2018).
- Not checked yetcites [26] ML Spiker, 2017, Wasted Food, Wasted Nutrients: Nutrient Loss from Wasted Food in the United States and Comparison to Gaps in Dietary Intake, J Acad Nutr Diet source
plain- Asserted: passes — The authors put it forward as true.
- Checkable: passes — It can be checked against evidence.
- Load-bearing: fails — The paper’s conclusions may not depend on it.
- Based: passes — The paper gives a reason why it holds.
Probably not a substantial claim. The paper’s conclusions may not depend on it.
In the paper
“The US Foodprint Model estimates cropland use associated with user-inputted data on food intake.”
§ Relationship between food waste, diet quality, and environmental sustainability > Methods > Agricultural resource data
What the sources say
- Not checked yetcites [37] C Peters, 2016, Carrying capacity of U.S. agricultural land: Ten diet scenarios, Elementa
plaincorrelational- Asserted: passes — The authors put it forward as true.
- Checkable: passes — It can be checked against evidence.
- Load-bearing: passes — The paper’s conclusions depend on it.
- Based: passes — The paper gives a reason why it holds.
Probably not a substantial claim.
In the paper
“Furthermore, the US Dietary Guidelines Advisory Committee identified a need for additional investigation of the relationship between consumer behaviors, waste disposal, and the sustainability of individual food groups in order to improve long-term food security.[12]”
§ Relationship between food waste, diet quality, and environmental sustainability > Introduction
What the sources say
- Not checked yetcites [12] Dietary Guidelines Advisory Committee. Scientific Report of the 2015 Dietary Guidelines Advisory Committee: Advisory Report to the Secretary of Health and Human Services and the Secretary of Agriculture. Part D, Chapter 5. Washington, DC; 2015. Available at: www.health.gov/dietaryguidelines/2015-scientific-report/ (verified 03 March 2018).
plain- Asserted: passes — The authors put it forward as true.
- Checkable: passes — It can be checked against evidence.
- Load-bearing: passes — The paper’s conclusions depend on it.
- Based: passes — The paper gives a reason why it holds.
Probably not a substantial claim.
None of the sources cited for this claim have been checked yet.
In the paper
“over 20% of food is lost or wasted at the consumer level each year,[24] accounting for 225–290 pounds per person per year[16, 24, 25] and 760–790 kcal per person per day.[16, 24–26]”
§ Relationship between food waste, diet quality, and environmental sustainability > Introduction
What the sources say
- Not checked yetcites [16] KL Thyberg, 2015, Quantification of Food Waste Disposal in the United States: A Meta-Analysis, Environ Sci Technol source
- Not checked yetcites [24] J Buzby, 2014
- Not checked yetcites [25] US Environmental Protection Agency. Advancing sustainable materials management: 2014 tables and figures. 2016. Available at: https://www.epa.gov/smm/advancing-sustainable-materials-management-facts-and-figures-report (verified 07 March 2018).
plain- Asserted: passes — The authors put it forward as true.
- Checkable: passes — It can be checked against evidence.
- Load-bearing: fails — The paper’s conclusions may not depend on it.
- Based: passes — The paper gives a reason why it holds.
Probably not a substantial claim. The paper’s conclusions may not depend on it.
What the paper did — it cites no source for this, so there is none to check. The quote shows it is in the paper.
In the paper
“Successful matches were achieved for 92% of the FCID foods; the remainder typically represented foods consumed infrequently and in minute amounts by the general population (such as passionfruit, arrowroot, and seaweed), and were not included in the analyses (S1 Table).”
§ Relationship between food waste, diet quality, and environmental sustainability > Methods > Data compilation
plain- Asserted: passes — The authors put it forward as true.
- Checkable: passes — It can be checked against evidence.
- Load-bearing: passes — The paper’s conclusions depend on it.
- Based: passes — The paper gives a reason why it holds.
Probably not a substantial claim.
None of the sources cited for this claim have been checked yet.
In the paper
“For example, higher quality diets have been associated with lower greenhouse gas emissions, eutrophication, water use, and cropland use.[8–11]”
§ Relationship between food waste, diet quality, and environmental sustainability > Introduction
What the sources say
- Not checked yetcites [8] CG Fischer, 2016
- Not checked yetcites [9] LF Ruini, 2015, Working toward healthy and sustainable diets: The “Double Pyramid Model” developed by the Barilla Center for Food and Nutrition to raise awareness about the environmental and nutritional impact of foods, Front Nutr source
- Not checked yetcites [10] ME Nelson, 2016, Alignment of Healthy Dietary Patterns and Environmental Sustainability: A Systematic Review, Adv Nutr source
- Not checked yetcites [11] P Behrens, 2017, Evaluating the environmental impacts of dietary recommendations, P Natl Acad Sci USA
plaincorrelational- Asserted: passes — The authors put it forward as true.
- Checkable: passes — It can be checked against evidence.
- Load-bearing: fails — The paper’s conclusions may not depend on it.
- Based: passes — The paper gives a reason why it holds.
Probably not a substantial claim. The paper’s conclusions may not depend on it. It may state two separate claims as one.
What the paper did — it cites no source for this, so there is none to check. The quote shows it is in the paper.
In the paper
“A Monte Carlo simulation with 1,000 random, non-replacement draws was embedded into the US Foodprint model to provide measures of variation, based on inter-individual variation in reported food intake from WWEIA.”
§ Relationship between food waste, diet quality, and environmental sustainability > Methods > Analysis
plain- Asserted: passes — The authors put it forward as true.
- Checkable: passes — It can be checked against evidence.
- Load-bearing: passes — The paper’s conclusions depend on it.
- Based: passes — The paper gives a reason why it holds.
Probably not a substantial claim.
None of the sources cited for this claim have been checked yet.
In the paper
“Past investigators have highlighted the land, irrigation water, greenhouse gas, and reactive nitrogen burdens of producing animal-sourced foods, especially beef.[44, 45]”
§ Relationship between food waste, diet quality, and environmental sustainability > Discussion
What the sources say
- Not checked yetcites [44] G Eshel, 2014, Land, irrigation water, greenhouse gas, and reactive nitrogen burdens of meat, eggs, and dairy production in the United States, Proc Natl Acad Sci U S A source
- Not checked yetcites [45] MC Heller, 2015, Greenhouse Gas Emission Estimates of U.S. Dietary Choices and Food Loss, J Ind Ecol source
plaindirect- Asserted: passes — The authors put it forward as true.
- Checkable: passes — It can be checked against evidence.
- Load-bearing: fails — The paper’s conclusions may not depend on it.
- Based: passes — The paper gives a reason why it holds.
Probably not a substantial claim. The paper’s conclusions may not depend on it.
In the paper
“The US agriculture sector is also among the most productive in the world,[64]”
§ Relationship between food waste, diet quality, and environmental sustainability > Discussion
What the sources say
- Not checked yetcites [64] US Department of Agriculture, Economic Research Service. Agricultural total factor productivity growth indices for individual countries, 1961–2013. 2017. Available at: https://www.ers.usda.gov/data-products/international-agricultural-productivity/ (verified 04 January 2018).
plain- Asserted: passes — The authors put it forward as true.
- Checkable: passes — It can be checked against evidence.
- Load-bearing: fails — The paper’s conclusions may not depend on it.
- Based: passes — The paper gives a reason why it holds.
Probably not a substantial claim. The paper’s conclusions may not depend on it.
In the paper
“This divergence can likely be explained, in large part, by differences in scope: Kummu et al. did not focus exclusively on the US (data on North America and New Zealand were aggregated) and did not restrict their findings to consumer level waste (all post-harvest losses were aggregated).”
§ Relationship between food waste, diet quality, and environmental sustainability > Discussion
What the sources say
- Not checked yetcites [14] M Kummu, 2012, Lost food, wasted resources: global food supply chain losses and their impacts on freshwater, cropland, and fertiliser use, Sci Total Environ source
hedgedconditional- Asserted: passes — The authors put it forward as true.
- Checkable: passes — It can be checked against evidence.
- Load-bearing: unclear — It is unclear whether the paper’s conclusions depend on it.
- Based: passes — The paper gives a reason why it holds.
It may state two separate claims as one.
What the paper did — it cites no source for this, so there is none to check. The quote shows it is in the paper.
In the paper
“these results should therefore be interpreted as the best available evidence rather than perfect estimates.”
§ Relationship between food waste, diet quality, and environmental sustainability > Discussion
plain- Asserted: passes — The authors put it forward as true.
- Checkable: fails — It may be too vague to check against evidence.
- Load-bearing: fails — The paper’s conclusions may not depend on it.
- Based: passes — The paper gives a reason why it holds.
Probably not a substantial claim. It may be too vague to check against evidence. The paper’s conclusions may not depend on it.
A conclusion the paper draws from its own results — it cites no other source for it, so there is none to check. The quote shows it is in the paper.
In the paper
“But practically, not all consumer waste can be prevented.”
§ Relationship between food waste, diet quality, and environmental sustainability > Discussion
plain- Asserted: passes — The authors put it forward as true.
- Checkable: fails — It may be too vague to check against evidence.
- Load-bearing: fails — The paper’s conclusions may not depend on it.
- Based: passes — The paper gives a reason why it holds.
Probably not a substantial claim. It may be too vague to check against evidence. The paper’s conclusions may not depend on it.
What the paper did — it cites no source for this, so there is none to check. The quote shows it is in the paper.
In the paper
“This is important because WWEIA includes more foods than LAFA and, therefore, likely better represents total dietary intake; and also provides data on foods as they were reported consumed (i.e., mixed dishes rather than individual ingredients), thereby making our estimates relevant to actual food consumption patterns.”
§ Relationship between food waste, diet quality, and environmental sustainability > Discussion
hedgedcorrelational- Asserted: passes — The authors put it forward as true.
- Checkable: passes — It can be checked against evidence.
- Load-bearing: passes — The paper’s conclusions depend on it.
- Based: passes — The paper gives a reason why it holds.
It may state two separate claims as one.
None of the sources cited for this claim have been checked yet.
In the paper
“Several novel technologies have recently been developed to help consumers identify whether foods are safe to eat, such as sensors on food packages that detect spoilage;[57] and apps have been developed to remind consumers of date labels and help plan meals to avoid food waste.[58, 59]”
§ Relationship between food waste, diet quality, and environmental sustainability > Discussion
What the sources say
- Not checked yetcites [57] VTT Group. VTT sensor detects spoilage of food. Available at website: http://www.vttresearch.com/media/news/vtt-sensor-detects-spoilage-of-food (verified 07 March 2018).
- Not checked yetcites [58]
- Not checked yetcites [59]
plain- Asserted: passes — The authors put it forward as true.
- Checkable: passes — It can be checked against evidence.
- Load-bearing: fails — The paper’s conclusions may not depend on it.
- Based: passes — The paper gives a reason why it holds.
Probably not a substantial claim. The paper’s conclusions may not depend on it. It may state two separate claims as one.
In the paper
“In contrast to our analysis, Birney et al. included retail food loss and waste in their analysis and did not account for multi-use crops (i.e., crops that are used to produce multiple products from equivalent mass) and multi-use cropland (cropland used to produce multiple crops during different parts of the year), both of which could explain the observed differences in results.”
§ Relationship between food waste, diet quality, and environmental sustainability > Discussion
What the sources say
- Not checked yetcites [51] CI Birney, 2017, An assessment of individual foodprints attributed to diets and food waste in the United States, Environ Res Lett source
hedgedconditional- Asserted: passes — The authors put it forward as true.
- Checkable: passes — It can be checked against evidence.
- Load-bearing: fails — The paper’s conclusions may not depend on it.
- Based: passes — The paper gives a reason why it holds.
Probably not a substantial claim. The paper’s conclusions may not depend on it.
In the paper
“At the same time, voluntary industry standards for date labels have been adopted by some of the largest US trade groups for the grocery industry.[61]”
§ Relationship between food waste, diet quality, and environmental sustainability > Discussion
What the sources say
- Not checked yetcites [61] Grocery Manufacturers Association. Grocery industry launches new initiative to reduce consumer confusion on product date labels. Available at: https://www.gmaonline.org/news-events/newsroom/grocery-industry-launches-new-initiative-to-reduce-consumer-confusion-on-pr/ (verified 21 February 2018).
plain- Asserted: passes — The authors put it forward as true.
- Checkable: passes — It can be checked against evidence.
- Load-bearing: fails — The paper’s conclusions may not depend on it.
- Based: passes — The paper gives a reason why it holds.
Probably not a substantial claim. The paper’s conclusions may not depend on it.
None of the sources cited for this claim have been checked yet.
In the paper
“increasing consumers’ knowledge about how to tell when fruits and vegetables are ripe, how to store and prepare them, and how to tell the difference between bruises/abrasions and spoilage will be critically important to reducing food waste.[15, 24]”
§ Relationship between food waste, diet quality, and environmental sustainability > Discussion
What the sources say
- Not checked yetcites [15] KL Thyberg, 2016, Drivers of food waste and their implications for sustainable policy development, Res, Cons, & Recyc source
- Not checked yetcites [24] J Buzby, 2014
boosteddirect- Asserted: passes — The authors put it forward as true.
- Checkable: fails — It may be too vague to check against evidence.
- Load-bearing: fails — The paper’s conclusions may not depend on it.
- Based: passes — The paper gives a reason why it holds.
Probably not a substantial claim. It may be too vague to check against evidence. The paper’s conclusions may not depend on it.
A conclusion the paper draws from its own results — it cites no other source for it, so there is none to check. The quote shows it is in the paper.
In the paper
“In some circumstances, consistent clinical recommendations to increase diet quality may lead individuals to purchase more healthful goods, like fruits and vegetables, which may go ultimately uneaten without tandem efforts to support healthy diets and reduce waste at the institutional, programmatic, and legislative levels, like those mentioned above.”
§ Relationship between food waste, diet quality, and environmental sustainability > Discussion
hedgedconditional- Asserted: passes — The authors put it forward as true.
- Checkable: fails — It may be too vague to check against evidence.
- Load-bearing: passes — The paper’s conclusions depend on it.
- Based: passes — The paper gives a reason why it holds.
Probably not a substantial claim. It may be too vague to check against evidence.
None of the sources cited for this claim have been checked yet.
In the paper
“Increased efforts to plan food purchases based on household food stocks is one way that consumers can reduce food waste due to over-purchasing;[53, 54]”
§ Relationship between food waste, diet quality, and environmental sustainability > Discussion
What the sources say
- Not checked yetcites [53] S Romani, 2018, Domestic food practices: A study of food management behaviors and the role of food preparation planning in reducing waste, Appetite source
- Not checked yetcites [54] M Hebrok, 2017, Household food waste: Drivers and potential intervention points for design–An extensive review, J Clean Prod source
plaindirect- Asserted: passes — The authors put it forward as true.
- Checkable: passes — It can be checked against evidence.
- Load-bearing: fails — The paper’s conclusions may not depend on it.
- Based: passes — The paper gives a reason why it holds.
Probably not a substantial claim. The paper’s conclusions may not depend on it.
A conclusion the paper draws from its own results — it cites no other source for it, so there is none to check. The quote shows it is in the paper.
In the paper
“Realistically, it may not be possible to prioritize food waste avoidance in households with other competing priorities.”
§ Relationship between food waste, diet quality, and environmental sustainability > Discussion
hedged- Asserted: passes — The authors put it forward as true.
- Checkable: fails — It may be too vague to check against evidence.
- Load-bearing: fails — The paper’s conclusions may not depend on it.
- Based: passes — The paper gives a reason why it holds.
Probably not a substantial claim. It may be too vague to check against evidence. The paper’s conclusions may not depend on it.
In the paper
“Legislative efforts, such as the proposed Food Date Labeling Act of 2016, aim to standardize date labels on foods to reduce consumer confusion and food waste,[60]”
§ Relationship between food waste, diet quality, and environmental sustainability > Discussion
What the sources say
- Not checked yetcites [60] Food Date Labeling Act of 2016, House of Representatives, 114 Congress Sess. (2016).
plaindirect- Asserted: passes — The authors put it forward as true.
- Checkable: passes — It can be checked against evidence.
- Load-bearing: fails — The paper’s conclusions may not depend on it.
- Based: passes — The paper gives a reason why it holds.
Probably not a substantial claim. The paper’s conclusions may not depend on it.
In the paper
“While self-reported dietary intake data are subject to measurement error (for example, some participants may not accurately report their food intake in order to simplify the survey process or to impress the interviewer) [48, 49], they are particularly useful for comparing dietary patterns between groups.[50]”
§ Relationship between food waste, diet quality, and environmental sustainability > Discussion
What the sources say
- Not checked yetcites [50] AF Subar, 2015, Addressing Current Criticism Regarding the Value of Self-Report Dietary Data, J Nutr source
plain- Asserted: passes — The authors put it forward as true.
- Checkable: passes — It can be checked against evidence.
- Load-bearing: fails — The paper’s conclusions may not depend on it.
- Based: passes — The paper gives a reason why it holds.
Probably not a substantial claim. The paper’s conclusions may not depend on it. It may state two separate claims as one.
A conclusion the paper draws from its own results — it cites no other source for it, so there is none to check. The quote shows it is in the paper.
In the paper
“Consumers face a delicate balance between following dietary recommendations to increase their consumption of fruits and vegetables (which requires purchasing more of them) while also wasting less of them.”
§ Relationship between food waste, diet quality, and environmental sustainability > Discussion
plain- Asserted: passes — The authors put it forward as true.
- Checkable: fails — It may be too vague to check against evidence.
- Load-bearing: passes — The paper’s conclusions depend on it.
- Based: passes — The paper gives a reason why it holds.
Probably not a substantial claim. It may be too vague to check against evidence.
A conclusion the paper draws from its own results — it cites no other source for it, so there is none to check. The quote shows it is in the paper.
In the paper
“This is largely due to the greater amount of fruits and vegetables included in higher quality diets, which have higher rates of waste, lower cropland needs, and higher application rates of agricultural inputs compared to other crops.”
§ Relationship between food waste, diet quality, and environmental sustainability > Conclusion
plaindirect- Asserted: passes — The authors put it forward as true.
- Checkable: passes — It can be checked against evidence.
- Load-bearing: passes — The paper’s conclusions depend on it.
- Based: passes — The paper gives a reason why it holds.
It may state two separate claims as one.
The authors state this as an assumption.
Uneaten portions/cooking loss represents waste for the purpose of this study.
“We assumed that uneaten portions/cooking loss represents waste for the purpose of this study.”
The paper relies on this without support.
Fruits and vegetables require small amounts of cropland but substantial amounts of agricultural inputs.
“This is largely due to fruits and vegetables, which are health-promoting and require small amounts of cropland, but require substantial amounts of agricultural inputs.”
The paper relies on this without support.
Until now, there has been limited research on the relationship between diet quality and food waste, representing a critical research gap in the field of food system sustainability.
“Until now, there has been limited research on the relationship between diet quality and food waste, representing a critical research gap in the field of food system sustainability.”
The paper relies on this without support.
Fruits and vegetables are more likely to be purchased raw than other foods, transferring more of the processing activity and waste to the consumer phase of the food system rather than to the processor (pre-consumer) phase.
“Fruits and vegetables are also more likely to be purchased raw than other foods, transferring more of the processing activity and waste to the consumer phase of the food system rather than to the processor (pre-consumer) phase.”
The paper relies on this without support.
For many Americans with adequate financial resources, when food was discarded, other food was purchased and consumed in its place to prevent hunger.
“More to the point, for many Americans with adequate financial resources it is likely that, when food was discarded, other food was purchased and consumed in its place in order to prevent hunger.”
The paper relies on this without support.
For individuals with limited food budgets, wasted food may not be replaced with other foods and may contribute to hunger.
“By contrast, for individuals with limited food budgets, wasted food may not be replaced with other foods and may indeed contribute to hunger.”
The authors state this as an assumption.
The modeling approach assumed that all food used to feed US consumers was domestically grown.
“The modeling approach we used assumed that all food used to feed US consumers was domestically grown, which does not reflect the globalized nature of the current food system.”
The paper relies on this without support.
Food waste is a critical component of environmental sustainability that, until now, has not been rigorously analyzed alongside diet quality.
“Food waste is a critical component of environmental sustainability that, until now, has not been rigorously analyzed alongside diet quality.”
Claims other papers make about this one
Each is checked against this paper’s own text: does it say what the citing paper says it does?
In the citing paper
“US consumer food waste, estimated to be roughly 422 g per person per day, represents an annual allocation of 30 million acres of cropland along with considerable commitments of fresh water and other agricultural inputs (Conrad, et al., 2018).”
From Waste watchers: A food waste reduction intervention among households in Arizona (2021) · cites this paper as Conrad, et al., 2018
In the citing paper
“Based on national data, Americans on average waste roughly 104 oz of food per week (Conrad et al., 2018).Our participants wasted far less with a baseline median of 28.22 oz.”
From Waste watchers: A food waste reduction intervention among households in Arizona (2021) · cites this paper as Conrad et al., 2018
Citations
Cites
Sontrop, J. M., Dixon, S. N., Garg, A. X., Jiménez, I. B., Dohein, O., Huang, S. S., & Clark, W. F. (2013) · American Journal of Nephrology · doi:10.1159/000350377 · Cited by 5,903
US Environmental Protection Agency
Liu, X. (1998) · Choice Reviews Online · doi:10.5860/choice.35-4455 · Cited by 5,887
Global nutrition transition and the pandemic of obesity in developing countries
Popkin, B. M., Adair, L. S., & Ng, S. W. (2012) · Nutrition Reviews · doi:10.1111/j.1753-4887.2011.00456.x · Cited by 4,313
Global diets link environmental sustainability and human health
Tilman, D., & Clark, M. (2014) · Nature · doi:10.1038/nature13959 · Cited by 3,026
GALLOWAY, J. N., ABER, J. D., ERISMAN, J. W., SEITZINGER, S. P., HOWARTH, R. W., COWLING, E. B., & COSBY, B. J. (2003) · BioScience · doi:10.1641/0006-3568(2003)053[0341:tnc]2.0.co;2 · Cited by 2,973
Moshfegh, A. J., Rhodes, D. G., Baer, D. J., Murayi, T., Clemens, J. C., Rumpler, W. V., Paul, D. R., Sebastian, R. S., Kuczynski, K. J., Ingwersen, L. A., et al. (2008) · American Journal of Clinical Nutrition · doi:10.1093/ajcn/88.2.324 · Cited by 1,988
National health and nutrition examination survey: analytic guidelines, 1999-2010.
Cl, J., Paulose‐Ram, R., Ogden, C. L., Carroll, Kruszon‐Moran, D., Dohrmann, S. M., & Curtin, L. R. (2013) · PubMed · Cited by 1,522
The Nutrition Transition and Obesity in the Developing World
Popkin, B. M. (2001) · Journal of Nutrition · doi:10.1093/jn/131.3.871s · Cited by 1,462
Kummu, M., de Moel, H., Porkka, M., Siebert, S., Varis, O., & Ward, P. J. (2012) · Science of The Total Environment · doi:10.1016/j.scitotenv.2012.08.092 · Cited by 1,300
Reducing Phosphorus to Curb Lake Eutrophication is a Success
Schindler, D. W., Carpenter, S. R., Chapra, S. C., Hecky, R. E., & Orihel, D. M. (2016) · Environmental Science & Technology · doi:10.1021/acs.est.6b02204 · Cited by 1,258
Addressing Current Criticism Regarding the Value of Self-Report Dietary Data
Subar, A. F., Freedman, L. S., Tooze, J. A., Kirkpatrick, S. I., Boushey, C., Neuhouser, M. L., Thompson, F. E., Potischman, N., Guenther, P. M., Tarasuk, V., et al. (2015) · The Journal of Nutrition · doi:10.3945/jn.115.219634 · Cited by 1,047
Crim, S. R., Iwamoto, M., Huang, J. Y., Griffin, P. M., Gilliss, D., Cronquist, A., Ml, C., Tobin‐D’Angelo, M., Blythe, D., Smith, K., et al. (2014) · PubMed Central · doi:10.15585/mmwr.mm6917a1 · Cited by 1,011
Drivers of food waste and their implications for sustainable policy development
Thyberg, K. L., & Tonjes, D. J. (2016) · Resources, Conservation and Recycling · doi:10.1016/j.resconrec.2015.11.016 · Cited by 928
Environmental and Economic Costs of the Application of Pesticides Primarily in the United States
Pimentel, D. M. D. S. (2009) · Springer eBooks · doi:10.1007/978-1-4020-8992-3_4 · Cited by 736
Buzby, J. C., Farah-Wells, H., & Hyman, J. (2014) · SSRN Electronic Journal · doi:10.2139/ssrn.2501659 · Cited by 575
Micha, R., Khatibzadeh, S., Shi, P., Fahimi, S., Lim, S., Andrews, K. G., Engell, R. E., Powles, J., Ezzati, M., Mozaffarian, D., et al. (2014) · BMJ · doi:10.1136/bmj.g2272 · Cited by 573
Micha, R., Shulkin, M., Peñalvo, J. L., Khatibzadeh, S., Singh, G. M., Rao, M., Fahimi, S., Powles, J. W., & Mozaffarian, D. (2017) · PLoS ONE · doi:10.1371/journal.pone.0175149 · Cited by 507
Household food waste: drivers and potential intervention points for design – an extensive review
Hebrok, M., & Boks, C. (2017) · Journal of Cleaner Production · doi:10.1016/j.jclepro.2017.03.069 · Cited by 501
Eshel, G., Shepon, A., Makov, T., & Milo, R. (2014) · Proceedings of the National Academy of Sciences · doi:10.1073/pnas.1402183111 · Cited by 466
Alignment of Healthy Dietary Patterns and Environmental Sustainability: A Systematic Review
Nelson, M. E., Hamm, M. W., Hu, F. B., Abrams, S. A., & Griffin, T. S. (2016) · Advances in Nutrition · doi:10.3945/an.116.012567 · Cited by 405
Greenhouse Gas Emission Estimates of U.S. Dietary Choices and Food Loss
Heller, M. C., & Keoleian, G. A. (2015) · Journal of Industrial Ecology · doi:10.1111/jiec.12174 · Cited by 329
Chen, M., & Graedel, T. E. (2016) · Global Environmental Change · doi:10.1016/j.gloenvcha.2015.12.005 · Cited by 315
Evaluating the environmental impacts of dietary recommendations
Behrens, P., Jong, J. C. K., Bosker, T., Rodrigues, J. F. D., de Koning, A., & Tukker, A. (2017) · Proceedings of the National Academy of Sciences · doi:10.1073/pnas.1711889114 · Cited by 284
Romani, S., Grappi, S., Bagozzi, R. P., & Barone, A. M. (2018) · Appetite · doi:10.1016/j.appet.2017.11.093 · Cited by 276
Food waste: The role of date labels, package size, and product category
Wilson, N. L. W., Rickard, B. J., Saputo, R., & Ho, S.-T. (2017) · Food Quality and Preference · doi:10.1016/j.foodqual.2016.08.004 · Cited by 238
Energy use and greenhouse gas emissions from crop production using the farm energy analysis tool
Camargo, G. G. T., Ryan, M. R., & Richard, T. L. (2013) · BioScience · doi:10.1525/bio.2013.63.4.6 · Cited by 180
Wichelns, D., & Oster, J. D. (2006) · Agricultural Water Management · doi:10.1016/j.agwat.2006.07.014 · Cited by 171
Peters, C. J., Wilkins, J. L., & Fick, G. W. (2007) · Renewable Agriculture and Food Systems · doi:10.1017/s1742170507001767 · Cited by 165
Spiker, M. L., Hiza, H. A. B., Siddiqi, S. M., & Neff, R. A. (2017) · Journal of the Academy of Nutrition and Dietetics · doi:10.1016/j.jand.2017.03.015 · Cited by 157
Dietary Strategies to Reduce Environmental Impact: A Critical Review of the Evidence Base
Ridoutt, B. G., Hendrie, G. A., & Noakes, M. (2017) · Advances in Nutrition · doi:10.3945/an.117.016691 · Cited by 151
McGuire, V. L. (2017) · Scientific investigations report · doi:10.3133/sir20175040 · Cited by 149
Foodborne Illness in the Elderly
Smith, J. L. (1998) · Journal of Food Protection · doi:10.4315/0362-028x-61.9.1229 · Cited by 145 · cited 1×
“[62, 63] In some circumstances, consistent clinical recommendations to increase diet quality may lead individuals to purchase more healthful goods, like fruits and vegetables, which may go ultimately uneaten without tandem efforts to support healthy diets and reduce waste at the institutional, programmatic, and legisl…”
BackgroundCarrying capacity of U.S. agricultural land: Ten diet scenarios
Peters, C. J., Picardy, J., Finaret, A. B., Wilkins, J. L., Griffin, T. S., & Fick, G. W. (2016) · Elementa Science of the Anthropocene · doi:10.12952/journal.elementa.000116 · Cited by 145
Ruini, L. F., Ciati, R., Pratesi, C. A., Marino, M., Principato, L., & Vannuzzi, E. (2015) · Frontiers in Nutrition · doi:10.3389/fnut.2015.00009 · Cited by 130
Quantification of food waste disposal in the United States: a meta-analysis
Thyberg, K. L., Tonjes, D. J., & Gurevitch, J. (2015) · Environmental Science & Technology · doi:10.1021/acs.est.5b03880 · Cited by 125
Freedman, L. S., Guenther, P. M., Krebs-Smith, S. M., & Kott, P. S. (2008) · The Journal of Nutrition · doi:10.1093/jn/138.9.1725 · Cited by 122
An assessment of individual foodprints attributed to diets and food waste in the United States
Birney, C. I., Franklin, K. F., Davidson, F. T., & Webber, M. E. (2017) · Environmental Research Letters · doi:10.1088/1748-9326/aa8494 · Cited by 106
Ehi-Eromosele, C. O., Nwinyi, O. C., & Ajani, O. O. (2013) · InTech eBooks · doi:10.5772/54476 · Cited by 94
Pimentel, D., & Peshin, R. (2014) · Springer eBooks · doi:10.1007/978-94-007-7796-5 · Cited by 92
Fruits and vegetables: measuring intake and encouraging increased consumption
Woodside, J. V., Young, I. S., & McKinley, M. C. (2013) · Proceedings of The Nutrition Society · doi:10.1017/s0029665112003059 · Cited by 90
The environmental impact of nutrition transition in three case study countries
Gill, M., Feliciano, D., Macdiarmid, J. I., & Smith, P. (2015) · Food Security · doi:10.1007/s12571-015-0453-x · Cited by 82
McGuire, V. L. (2014) · Scientific investigations report · doi:10.3133/sir20145218 · Cited by 78
Fruit and vegetable intake: Issues with definition and measurement
Roark, R. A., & Niederhauser, V. P. (2013) · Public Health Nutrition · doi:10.1017/s1368980012000985 · Cited by 77
Acting in the Anthropocene: the EAT–Lancet Commission
Rockström, J., Stordalen, G. A., & Horton, R. C. (2016) · The Lancet · doi:10.1016/s0140-6736(16)30681-x · Cited by 59
Possible Implications for U.S. Agriculture From Adoption of Select Dietary GuidelinesPreprint
Buzby, J. C., Wells, H. F., & Vocke, G. F. (2006) · RePEc: Research Papers in Economics · doi:10.22004/ag.econ.7230 · Cited by 51
Plate waste of adults in the United States measured in free-living conditions
Roe, B. E., Apolzan, J. W., Qi, D., Allen, H. R., & Martin, C. K. (2018) · PLoS ONE · doi:10.1371/journal.pone.0191813 · Cited by 43
Evaluating the environmental impacts of dietary recommendations
Behrens, P., Jong, J. C. K., Bosker, T., Rodrigues, J. F. D., de Koning, A., & Tukker, A. (2018) · Yearbook of pediatric endocrinology · doi:10.1530/ey.15.14.7 · Cited by 8
Cited by
Sorted by citations
Machine Learning in Agriculture: A Comprehensive Updated Review
Benos, L. T., Tagarakis, A. C., Dolias, G., Berruto, R., Katerıs, D., & Bochtis, D. (2021) · Sensors · doi:10.3390/s21113758 · Cited by 1,048
Novel Approaches in the Valorization of Agricultural Wastes and Their Applications
Çapanoğlu, E., Nemli, E., & Tomás-Barberán, F. A. (2022) · Journal of Agricultural and Food Chemistry · doi:10.1021/acs.jafc.1c07104 · Cited by 414
Removal of contaminants of emerging concern by metal-organic framework nanoadsorbents: A review
Joseph, L., Jun, B.-M., Jang, M., Park, C. M., Muñoz-Senmache, J. C., Hernández‐Maldonado, A. J., Heyden, A., Yu, M., & Yoon, Y. (2019) · Chemical Engineering Journal · doi:10.1016/j.cej.2019.03.173 · Cited by 405
Losses in the Grain Supply Chain: Causes and Solutions
Mesterházy, Á., Oláh, J., & Popp, J. (2020) · Sustainability · doi:10.3390/su12062342 · Cited by 319
Challenges and potential pathways towards sustainable agriculture within the European Green Deal
Boix‐Fayos, C., & de Vente, J. (2023) · Agricultural Systems · doi:10.1016/j.agsy.2023.103634 · Cited by 304
Metadata
- Authors
- Conrad, Z., Niles, M. T., Neher, D. A., Roy, E. D., Tichenor, N. E., & Jahns, L.
- Affiliations
- Agricultural Research Service (US)
- University of Vermont (US)
- Corresponding author
- Conrad, Zach
- Venue
- PLOS ONE
- Publisher
- Public Library of Science (PLoS)
- Published
- 2018-04-18
- Volume
- 13
- Issue
- 4
- Pages
- e0195405
- ISSN
- 1932-6203 (ISSN-L)
- PMC
- PMC5905889
- OpenAlex
- W2800430407
- Cited by
- 360
- References
- 49
- Citations by year
- 2026: 29 · 2025: 46 · 2024: 67 · 2023: 45 · 2022: 51 · 2021: 38 · 2020: 59 · 2019: 17 · 2018: 8
- FWCI
- 28.63
- Type
- journal article
- Language
- en
- Open access
- gold
- doi.org
- Licence
- public-domain
- creativecommons.org/publicdomain/zero/1.0/ (vor)
- Locations
- PLoS ONE (publishedVersion, public-domain)
- Europe PMC (PubMed Central) (publishedVersion, public-domain)
- PubMed Central (publishedVersion, public-domain)
- PubMed (publishedVersion)
- Issue Lab (Candid) (submittedVersion, cc-by)
- ScholarWorks -A service of University of Vermont Libraries (University of Vermont) (submittedVersion, cc-by)
- DOAJ (DOAJ: Directory of Open Access Journals) (submittedVersion, cc-by-sa)
- Figshare (submittedVersion, cc-by)
- Funders
- Agricultural Research Service (3062-51000-051-00D)
- Topics
- Life Sciences › Agricultural and Biological Sciences › Food Science › Food Waste Reduction and Sustainability
- Physical Sciences › Environmental Science › Ecology › Agriculture Sustainability and Environmental Impact
- Physical Sciences › Environmental Science › Environmental Engineering › Environmental Impact and Sustainability
- Keywords
- food waste, diet quality, environmental sustainability, cropland use, irrigation water, pesticides, fertilizers, Healthy Eating Index-2015, fruits and vegetables, biophysical simulation, agricultural inputs
- MeSH terms
- Agriculture, Conservation of Natural Resources, Dairy Products, Diet, Food, Fruit, Humans, Meat Products, Nutrition Surveys, United States, Vegetables, Waste Products
About these checks
Registry, retraction, Cites and statistics results are computed, not judged, with one exception: a printed reference that no index lists is read once by a model before it counts as a citation error. Claims are extracted by a model and kept only when their quote appears verbatim in the text; each cited source is then checked, with a model’s help, for whether it says what the claim relies on. Those verdicts can be wrong — read the claim’s quote and the cited source before relying on one.
A language model drew the claims from the paper on 2026-10-10, under version 3 of the claim definition (model deepseek-v4.1-flash, prompt extract-v3).
A second model labelled each claim on 2026-10-10 (model jev-1.13-20260917, definition revision gold-guideline-v0.2).
Statistics and arithmetic are recomputed, not judged.
Confidence bands are shown only for fields calibrated on our annotated test set. None is calibrated yet, so no band is shown.
What counts as a claim ›How we measure confidence ›How we check this ›
Are you an author, or do you see a problem with this page? Request a review
