

The DOI matches its Crossref record; 87 of the 87 references it cites were found in a registry or an index; 45 of the 67 sources its claims cite were checked for support.
Molecular basis of accessible plasma membrane cholesterol recognition by the GRAM domain of GRAMD1b
Open accessAbstract
Cholesterol is essential for cell physiology. Transport of the “accessible” pool of cholesterol from the plasma membrane (PM) to the endoplasmic reticulum (ER) by ER‐localized GRAMD1 proteins (GRAMD1a/1b/1c) contributes to cholesterol homeostasis. However, how cells detect accessible cholesterol within the PM remains unclear. We show that the GRAM domain of GRAMD1b, a coincidence detector for anionic lipids, including phosphatidylserine (PS), and cholesterol, possesses distinct but synergistic sites for sensing accessible cholesterol and anionic lipids. We find that a mutation within the GRAM domain of GRAMD1b that is associated with intellectual disability in humans specifically impairs cholesterol sensing. In addition, we identified another point mutation within this domain that enhances cholesterol sensitivity without altering its PS sensitivity. Cell‐free reconstitution and cell‐based assays revealed that the ability of the GRAM domain to sense accessible cholesterol regulates membrane tethering and determines the rate of cholesterol transport by GRAMD1b. Thus, cells detect the codistribution of accessible cholesterol and anionic lipids in the PM and fine‐tune the non‐vesicular transport of PM cholesterol to the ER via GRAMD1s.
Overview
AI snapshot
Written from the paper’s full text.
TL;DR
The GRAM domain of GRAMD1b senses accessible plasma membrane cholesterol through distinct but synergistic sites for cholesterol and anionic lipids, enabling cholesterol-dependent ER–PM tethering and transport. An intellectual-disability-associated R189W mutation specifically abolishes cholesterol sensing, whereas G187L hypersensitizes the domain to cholesterol and enhances transport.
Key findings
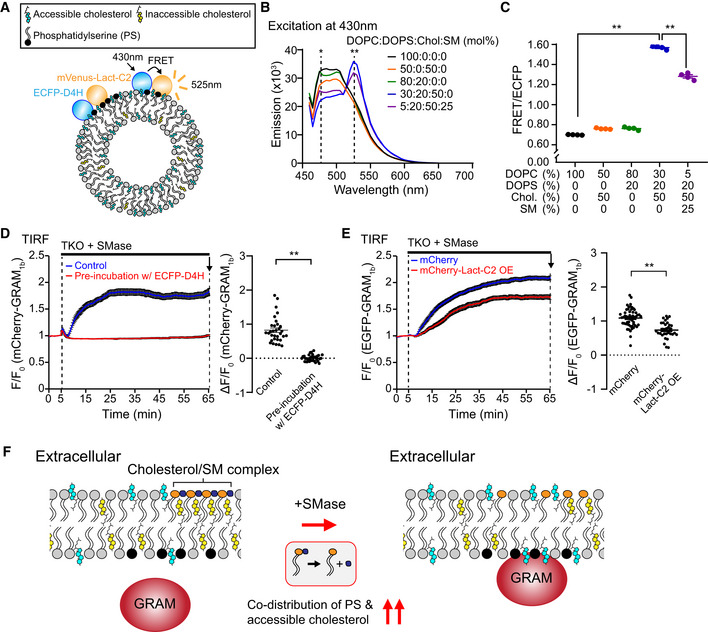
- GRAM1b detects codistribution of accessible cholesterol and phosphatidylserine (PS): FRET was strong with liposomes containing 50% cholesterol and 20% PS, and was reduced by adding 25% sphingomyelin.
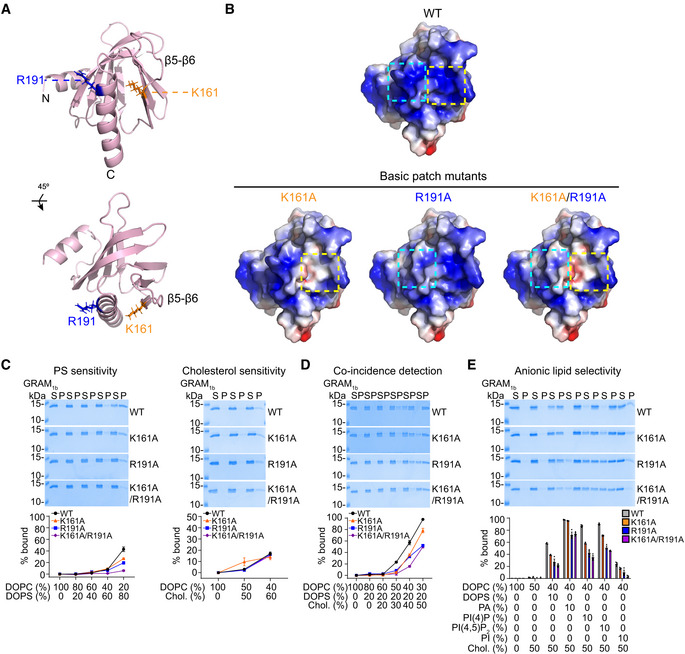
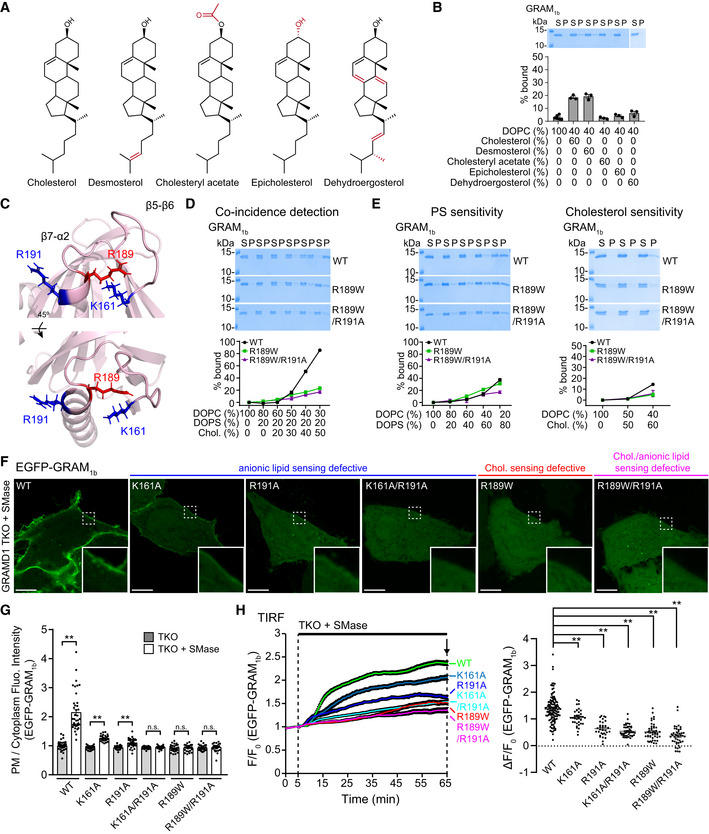
- Cholesterol and anionic lipid recognition use separate sites: basic-patch mutants K161A/R191A bound ~5% to 80% PS liposomes versus ~45% for WT, while R189W bound ~4% to 60% cholesterol liposomes versus ~15% for WT and retained PS binding.
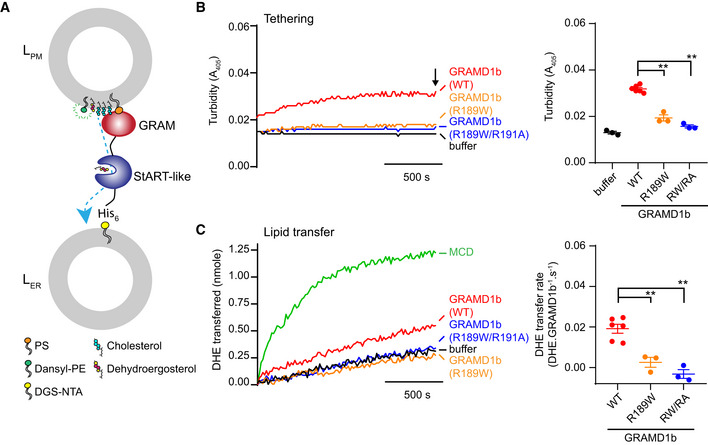
- R189W impaired membrane tethering and cholesterol transport in vitro; WT GRAMD1b transferred ~1.2 DHE molecules/min, whereas R189W/R191A transferred ~0.
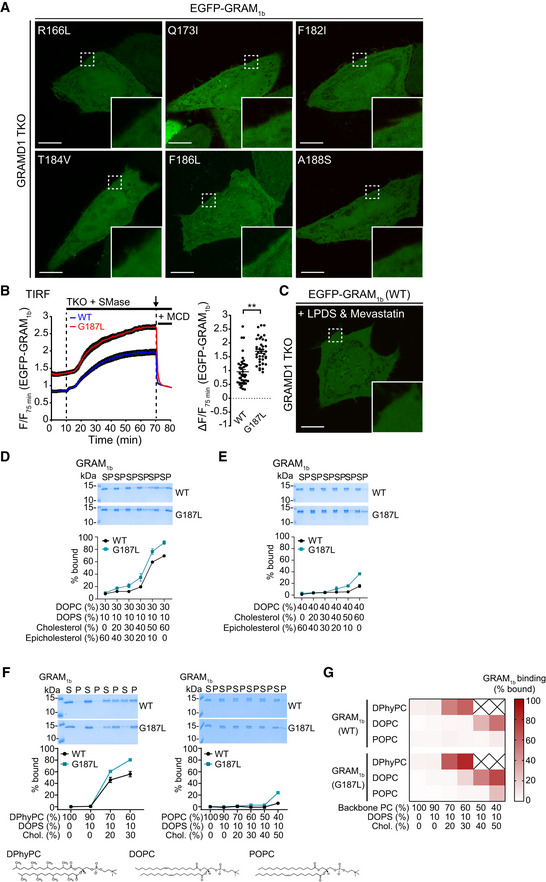
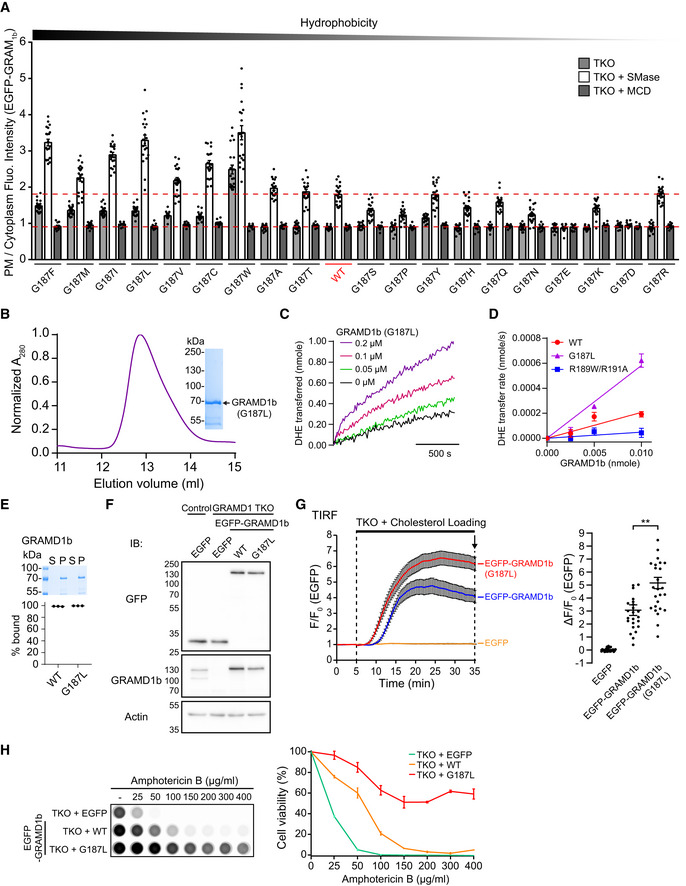
- G187L increased cholesterol sensitivity without altering PS affinity: at 60% cholesterol, ~30% of GRAM1b–G187L bound versus ~15% of WT; GRAMD1b–G187L transferred ~3.6 DHE molecules/min versus ~1.2 for WT.
Methods
- In vitro FRET and liposome sedimentation assays with purified GRAM1b variants and synthetic liposomes of defined lipid composition.
- Cell-free reconstitution using purified near full-length GRAMD1b proteins, PM-like donor liposomes, and ER-like acceptor liposomes to measure membrane tethering by turbidity and DHE transfer by FRET.
- Cell-based assays in wild-type and GRAMD1 triple-knockout HeLa cells using spinning disk confocal and TIRF microscopy, SREBP-2 cleavage immunoblotting, Amphotericin B resistance, and site-directed mutagenesis.
Limitations
- The paper states that the exact cholesterol-binding site remains unclear and that how R189 contributes to cholesterol recognition is unknown; it also states that the role of GRAMD1b in mammalian brain development and neuronal function remains unknown.
- The paper notes that near full-length GRAMD1b with anionic lipid-sensing defective GRAM domain mutations still tethered membranes and transported cholesterol like WT in vitro, suggesting other amino acids outside the GRAM domain may contribute to anionic lipid sensing.
- The paper reports that SREBP-2 cleavage suppression was reliably detected only after ~90 min, making it difficult to assess enhanced cholesterol transport by G187L on shorter timescales; it also states that sample size was not predetermined and live-cell imaging experiments were not randomized.
Model-written summary. Check it against the paper before relying on it.
Integrity signals
Registry
Cites
Statistics
Figures
Verification
Claims the paper makes
119 Own result · 73 Own interpretation · 17 Supported · 14 Partly supported · 8 Own method · 7 No basis given · 6 No full text of the sources · 5 Not checked yet · 2 Supported so far · 1 Sources not found · accuracy not yet measured
The cited sources support only part of this claim — read each source’s verdict below.
In the paper
“Recent human genetic studies identified several mutations in GRAMD1b that are associated with intellectual disability (Reuter et al, 2017; Santos‐Cortez et al, 2018).”
§ Molecular basis of accessible plasma membrane cholesterol recognition by the GRAM domain of GRAMD1b > Results > A GRAMD1b mutation (R189W) associated with intellectual disability specifically impairs binding of the GRAM domain to cholesterol
What the sources say
- Not checked — no full text of the sourcecites Reuter et al, 2017 source
- Partly supportedcites Santos‐Cortez et al, 2018 sourceExperimental — accuracy not yet measured
The Discussion reports a GRAMD1B nonsense variant co-segregating with severe intellectual disability in family MR60 and describes a previously reported GRAMD1B missense variant in another family. It identifies only these two variants, rather than several, and notes that the role of the MR60 variant is uncertain because a TBRG1 variant also co-segregates in that family. Page numbers were not available in our copy. (LLM, conf=0.82)
plaincorrelational- Asserted: passes — The authors put it forward as true.
- Checkable: passes — It can be checked against evidence.
- Load-bearing: passes — The paper’s conclusions depend on it.
- Based: passes — The paper gives a reason why it holds.
The cited sources support only part of this claim — read each source’s verdict below.
In the paper
“WT control GRAM1b bound strongly to liposomes that contained 40% or 50% cholesterol, consistent with our previous results (Naito et al, 2019) (Fig 2D).”
§ Molecular basis of accessible plasma membrane cholesterol recognition by the GRAM domain of GRAMD1b > Results > A basic patch within the GRAM domain of GRAMD1b is critical for anionic lipid recognition
What the sources say
- Partly supportedcites Naito et al, 2019 sourceExperimental — accuracy not yet measured
The Results section (page unavailable) reports strong binding of the GRAMD1b GRAM domain to liposomes containing 50% cholesterol and 20% phosphatidylserine. It does not explicitly report strong binding at 40% cholesterol, and the strong binding at 50% depended on the presence of phosphatidylserine. (LLM, conf=0.85)
boostedcorrelational- Asserted: passes — The authors put it forward as true.
- Checkable: passes — It can be checked against evidence.
- Load-bearing: passes — The paper’s conclusions depend on it.
- Based: passes — The paper gives a reason why it holds.
- Partly supported
The cited sources support only part of this claim — read each source’s verdict below.
In the paper
“GRAM1b binds weakly to liposomes that contain only cholesterol (~15–20% binding when liposomes contained 60% cholesterol) (Naito et al, 2019) (Fig 2C) (see also Fig 3A and B).”
§ Molecular basis of accessible plasma membrane cholesterol recognition by the GRAM domain of GRAMD1b > Results > A basic patch within the GRAM domain of GRAMD1b is critical for anionic lipid recognition
What the sources say
- Partly supportedcites Naito et al, 2019 sourceExperimental — accuracy not yet measured
The Results section reports weak binding of the GRAMD1b GRAM domain to liposomes containing 60% cholesterol, but gives the bound fraction as approximately 25%, not 15–20%. The qualitative finding and cholesterol concentration are supported; the quoted binding percentage is not. (LLM, conf=0.88)
plaincorrelational- Asserted: passes — The authors put it forward as true.
- Checkable: passes — It can be checked against evidence.
- Load-bearing: passes — The paper’s conclusions depend on it.
- Based: passes — The paper gives a reason why it holds.
- Partly supported
Every source the paper cites for this claim was checked and supports it.
In the paper
“Further, the GRAM domain facilitates the cholesterol‐dependent recruitment of GRAMD1s to ER‐PM contact sites when the accessible pool of PM cholesterol transiently expands beyond a certain threshold (Naito et al, 2019).”
§ Molecular basis of accessible plasma membrane cholesterol recognition by the GRAM domain of GRAMD1b > Introduction
What the sources say
- Supportedcites Naito et al, 2019 source
The Results section states that GRAMD1 recruitment to the PM follows an acute expansion of accessible cholesterol beyond a threshold and depends on the GRAM domain. The Discussion further states that this switch-like sensing moves GRAMD1s to ER–PM contact sites when the accessible pool transiently expands. (LLM, conf=0.95)
plaindirect- Asserted: passes — The authors put it forward as true.
- Checkable: passes — It can be checked against evidence.
- Load-bearing: passes — The paper’s conclusions depend on it.
- Based: passes — The paper gives a reason why it holds.
- Supported
The sources with a verdict support this claim; the rest weren’t checked yet, have no full text we could read, or their verdicts aren’t rated yet.
In the paper
“Unsequestered cholesterol can spontaneously flip‐flop between the outer and inner leaflets of the PM bilayers (Leventis & Silvius, 2001; Steck & Lange, 2018).”
§ Molecular basis of accessible plasma membrane cholesterol recognition by the GRAM domain of GRAMD1b > Results > The GRAM domain of GRAMD1b detects the codistribution of accessible cholesterol and PS, which is regulated by sphingomyelin
What the sources say
- Not checked — no full text of the sourcecites Leventis & Silvius, 2001 source
- Supportedcites Steck & Lange, 2018 source
Section 1.3 describes passive backflow of cholesterol across plasma-membrane leaflets. Section 3.6 reports rapid transbilayer diffusion at 37 °C and notes evidence that cholesterol rapidly traverses the red-cell membrane bilayer, supporting the claim that it can flip-flop between leaflets. (LLM, conf=0.88)
plaindirect- Asserted: passes — The authors put it forward as true.
- Checkable: passes — It can be checked against evidence.
- Load-bearing: passes — The paper’s conclusions depend on it.
- Based: passes — The paper gives a reason why it holds.
The cited sources support only part of this claim — read each source’s verdict below.
In the paper
“Increases in the level of PM cholesterol beyond a certain threshold (or liberation of PM cholesterol from sequestration) result in transient expansions in the accessible pool of PM cholesterol.”
§ Molecular basis of accessible plasma membrane cholesterol recognition by the GRAM domain of GRAMD1b > Introduction
What the sources say
- Partly supportedcites Slotte & Bierman, 1988 sourceExperimental — accuracy not yet measured
The Discussion (page unavailable) reports that depleting sphingomyelin reduces the plasma membrane’s capacity to retain cholesterol and rapidly moves cholesterol to intracellular pools. It also describes fibroblast plasma membranes as saturated with respect to cholesterol solubilization. The paper does not show that adding cholesterol beyond a threshold, or releasing sequestered cholesterol, transiently expands an accessible plasma-membrane pool. (LLM, conf=0.84)
- Partly supportedcites Lange & Steck, 1997 sourceExperimental — accuracy not yet measured
The passage labeled Abstract (page unavailable) says that large changes in the ER-associated run-off pool with little change in total cell cholesterol support a threshold mechanism; it also reports that sphingomyelinase treatment increased cholesterol esterification. The paper does not establish that either treatment transiently expands an accessible pool in the plasma membrane: the measured pool is associated with the ER, not identified as a plasma-membrane pool. (LLM, conf=0.85)
- Partly supportedcites Scheek et al, 1997 sourceExperimental — accuracy not yet measured
The Results and Discussion suggest that sphingomyelin can sequester cholesterol, and the Abstract reports that sphingomyelinase treatment moves cholesterol from the plasma membrane to the ER. Neither passage establishes a plasma-membrane cholesterol threshold or a transient expansion of an accessible plasma-membrane pool; the expanded pool described is in the ER. No page numbers are available in our copy. (LLM, conf=0.80)
plaindirect- Asserted: passes — The authors put it forward as true.
- Checkable: passes — It can be checked against evidence.
- Load-bearing: passes — The paper’s conclusions depend on it.
- Based: passes — The paper gives a reason why it holds.
- Partly supported
The cited sources support only part of this claim — read each source’s verdict below.
In the paper
“In the absence of GRAMD1s, accessible cholesterol is inefficiently transported from the PM to the ER, resulting in a chronic expansion of accessible PM cholesterol (Naito et al, 2019; Ferrari et al, 2020).”
§ Molecular basis of accessible plasma membrane cholesterol recognition by the GRAM domain of GRAMD1b > Introduction
What the sources say
- Supportedcites Naito et al, 2019 source
The Discussion reports that GRAMD1 triple-knockout cells had chronically expanded accessible plasma-membrane cholesterol and identifies defective efficient transport from the plasma membrane to the ER as consistent with that phenotype. The Results likewise report sustained accumulation of accessible cholesterol after loss of GRAMD1 function. (LLM, conf=0.94)
- Partly supportedcites Ferrari et al, 2020 sourceExperimental — accuracy not yet measured
The Abstract reports that cells lacking Aster expression had an expanded accessible plasma-membrane cholesterol pool accompanied by reduced movement of cholesterol to the ER. The Discussion also reports expansion after Aster knockdown or gene deletion. These passages support the transport defect and expansion, but do not establish that the expansion is chronic. (LLM, conf=0.82)
plaindirect- Asserted: passes — The authors put it forward as true.
- Checkable: passes — It can be checked against evidence.
- Load-bearing: passes — The paper’s conclusions depend on it.
- Based: passes — The paper gives a reason why it holds.
- Supported
Every source the paper cites for this claim was checked and supports it.
In the paper
“We previously showed that GRAM1b is recruited to the PM when cholesterol is liberated from sphingomyelin‐sequestered pools of PM cholesterol via the hydrolysis of sphingomyelin by sphingomyelinase treatment (Naito et al, 2019).”
§ Molecular basis of accessible plasma membrane cholesterol recognition by the GRAM domain of GRAMD1b > Results > The GRAM domain of GRAMD1b detects the codistribution of accessible cholesterol and PS, which is regulated by sphingomyelin
What the sources say
- Supportedcites Naito et al, 2019 source
The Results section, “Liberation of sphingomyelin-sequestered pool of cholesterol induces acute recruitment of GRAMD1b to the PM,” reports that sphingomyelinase hydrolyzes PM sphingomyelin and that EGFP–GRAM1b is recruited to the PM after treatment. The Figure 3I description in the Results explains that this treatment liberates sphingomyelin-sequestered cholesterol, increasing accessible PM cholesterol and inducing recruitment. (LLM, conf=0.94)
plaindirect- Asserted: passes — The authors put it forward as true.
- Checkable: passes — It can be checked against evidence.
- Load-bearing: passes — The paper’s conclusions depend on it.
- Based: passes — The paper gives a reason why it holds.
- Supported
Every source the paper cites for this claim was checked and supports it.
In the paper
“However, the ability of the GRAM domain of GRAMD1b (GRAM1b) to detect the presence of both anionic lipids, including PS (a major acidic phospholipid enriched in the inner leaflet of the PM), and accessible cholesterol as a coincidence detector (Naito et al, 2019) suggests that at least some cholesterol codistributes with PS without being sequestered in the membrane.”
§ Molecular basis of accessible plasma membrane cholesterol recognition by the GRAM domain of GRAMD1b > Results > The GRAM domain of GRAMD1b detects the codistribution of accessible cholesterol and PS, which is regulated by sphingomyelin
What the sources say
- Supportedcites Naito et al, 2019 source
The Results section (‘The GRAM domain of GRAMD1s acts as a coincidence detector…,’ Figure 3C) reports strong GRAMD1b GRAM-domain binding when cholesterol and phosphatidylserine are both present, but little binding with either alone. The same section says anionic lipids are enriched in the plasma membrane’s inner leaflet and that accessible, unsequestered cholesterol enhances GRAM-domain binding. The codistribution inference is the citing authors’ own conclusion, not a separate finding attributed to Naito et al. (LLM, conf=0.93)
hedgedcorrelational- Asserted: passes — The authors put it forward as true.
- Checkable: passes — It can be checked against evidence.
- Load-bearing: passes — The paper’s conclusions depend on it.
- Based: passes — The paper gives a reason why it holds.
- Supported
Every source the paper cites for this claim was checked and supports it.
In the paper
“The recruitment of GRAM1b to the PM following sphingomyelinase treatment was significantly enhanced in HeLa cells that lacked all three GRAMD1s (GRAMD1 TKO cells) compared to WT HeLa cells due to exaggerated accumulation of accessible PM cholesterol in these cells (Naito et al, 2019).”
§ Molecular basis of accessible plasma membrane cholesterol recognition by the GRAM domain of GRAMD1b > Results > The GRAM domain of GRAMD1b detects the codistribution of accessible cholesterol and PS, which is regulated by sphingomyelin
What the sources say
- Supportedcites Naito et al, 2019 source
The Results section on deletion of GRAMD1s reports that sphingomyelinase significantly enhanced PM recruitment of the EGFP–GRAM1b probe in GRAMD1 TKO HeLa cells compared with wild-type cells (Figure 4E). The same section concludes that this reflects exaggerated accumulation of accessible PM cholesterol in the TKO cells. (LLM, conf=0.95)
plaindirect- Asserted: passes — The authors put it forward as true.
- Checkable: passes — It can be checked against evidence.
- Load-bearing: passes — The paper’s conclusions depend on it.
- Based: passes — The paper gives a reason why it holds.
- Supported
Every source the paper cites for this claim was checked and supports it.
In the paper
“WT control GRAM1b bound to liposomes that contained PS alone (0‐80%) in a concentration‐dependent manner, as we previously reported (Naito et al, 2019) (Fig 2C).”
§ Molecular basis of accessible plasma membrane cholesterol recognition by the GRAM domain of GRAMD1b > Results > A basic patch within the GRAM domain of GRAMD1b is critical for anionic lipid recognition
What the sources say
- Supportedcites Naito et al, 2019 source
The Results section (page unavailable) reports that purified GRAMD1b GRAM domain did not bind liposomes containing only phosphatidylcholine and bound PS-containing liposomes only at high PS levels (50% or 80%). It also reports little binding at 20% PS, supporting the claimed dependence on PS concentration; binding was not observed across the entire 0–80% range. (LLM, conf=0.90)
plaincorrelational- Asserted: passes — The authors put it forward as true.
- Checkable: passes — It can be checked against evidence.
- Load-bearing: passes — The paper’s conclusions depend on it.
- Based: passes — The paper gives a reason why it holds.
- Supported
The sources with a verdict support this claim; the rest weren’t checked yet, have no full text we could read, or their verdicts aren’t rated yet.
In the paper
“In addition to sphingomyelin, phospholipid acyl chain saturation has profound effects on the accessibility of cholesterol in membranes (Radhakrishnan & McConnell, 2000; Sokolov & Radhakrishnan, 2010; Lange et al, 2013; Gay et al, 2015; Chakrabarti et al, 2017).”
§ Molecular basis of accessible plasma membrane cholesterol recognition by the GRAM domain of GRAMD1b > Results > The G187L mutation increases sensitivity of the GRAM domain to cholesterol without altering its affinity for PS
What the sources say
- Not checked — no full text of the sourcecites Radhakrishnan & McConnell, 2000 source
- Supportedcites Sokolov & Radhakrishnan, 2010 source
In the section “Specificity of His6-PFO(C459A) Interaction with,” the paper reports that changing phospholipid acyl-chain structure shifts the cholesterol concentration at which PFO binds to liposomes. It concludes that cholesterol is less accessible when the acyl chains are more ordered, supporting the claim about acyl-chain saturation and cholesterol accessibility in membranes. (LLM, conf=0.92)
- Supportedcites Lange et al, 2013 source
In Discussion §1 (“Relative accessibilities”), the paper reports that cholesterol oxidase accessibility differed greatly across phospholipid environments. Above the cholesterol threshold, relative-accessibility values were orders of magnitude greater for unsaturated than for saturated acyl chains. (LLM, conf=0.93)
boosteddirect- Asserted: passes — The authors put it forward as true.
- Checkable: passes — It can be checked against evidence.
- Load-bearing: passes — The paper’s conclusions depend on it.
- Based: passes — The paper gives a reason why it holds.
Every source the paper cites for this claim was checked and supports it.
In the paper
“Stably expressed EGFP‐GRAMD1b proteins localized to the ER as discrete patches, similar to previously reported localization of transiently transfected and functional EGFP‐GRAMD1b (Naito et al, 2019)”
§ Molecular basis of accessible plasma membrane cholesterol recognition by the GRAM domain of GRAMD1b > Results > Cholesterol‐sensing property of the GRAM domain is critical for GRAMD1b function
What the sources say
- Supportedcites Naito et al, 2019 source
The Results section on GRAMD protein complexes (Figure 1B; page unavailable) reports EGFP-GRAMD1b in discrete patches along ER tubules. The Results section on cholesterol transport (Figure 6D–E; page unavailable) reports that transfected EGFP-GRAMD1b rescued a defect in GRAMD1-knockout cells, supporting the description of the previously studied construct as functional. Stable expression is the citing authors’ observation, not a finding attributed to Naito et al. (LLM, conf=0.91)
plaincorrelational- Asserted: passes — The authors put it forward as true.
- Checkable: passes — It can be checked against evidence.
- Load-bearing: passes — The paper’s conclusions depend on it.
- Based: passes — The paper gives a reason why it holds.
- Supported
Every source the paper cites for this claim was checked and supports it.
In the paper
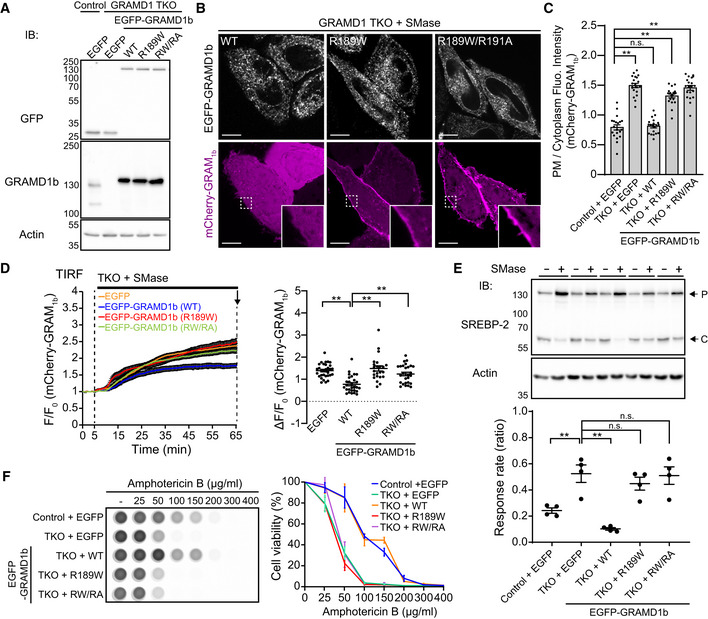
“Using SREBP‐2 cleavage to estimate the efficiency of accessible cholesterol transport from the PM to the ER, we previously showed that levels of SREBP‐2 cleavage are higher in GRAMD1 TKO cells than control cells following sphingomyelinase treatment (Naito et al, 2019).”
§ Molecular basis of accessible plasma membrane cholesterol recognition by the GRAM domain of GRAMD1b > Results > Cholesterol‐sensing property of the GRAM domain is critical for GRAMD1b function
What the sources say
- Supportedcites Naito et al, 2019 source
The Results (Figure 6B,C) report that sphingomyelinase suppressed SREBP-2 cleavage in control cells, but suppression was delayed and reduced in GRAMD1 TKO cells. At 180 minutes, cleavage in TKO cells remained above control levels; the paper notes no detectable difference before treatment. (LLM, conf=0.93)
plaincorrelational- Asserted: passes — The authors put it forward as true.
- Checkable: passes — It can be checked against evidence.
- Load-bearing: passes — The paper’s conclusions depend on it.
- Based: passes — The paper gives a reason why it holds.
- Supported
The cited sources support only part of this claim — read each source’s verdict below.
In the paper
“mCherry‐D4H strongly bound to the PM of control GRAMD1 TKO cells that stably expressed EGFP, consistent with accumulation of accessible cholesterol in the PM in these cells (Naito et al, 2019) (Fig 7D and E).”
§ Molecular basis of accessible plasma membrane cholesterol recognition by the GRAM domain of GRAMD1b > Results > G187 is critical for determining the sensitivity of the GRAM domain to accessible PM cholesterol and regulating GRAMD1b‐dependent cholesterol transport
What the sources say
- Partly supportedcites Naito et al, 2019 sourceExperimental — accuracy not yet measured
The Results section (“Chronic expansion of the accessible pool of PM cholesterol,” Figure 7A–B) reports stronger D4H binding at the plasma membrane of GRAMD1 TKO cells and interprets it as an expanded accessible cholesterol pool. It used recombinant EGFP–D4H, however, and does not report the stated mCherry–D4H observation in TKO cells stably expressing EGFP. (LLM, conf=0.87)
boostedcorrelational- Asserted: passes — The authors put it forward as true.
- Checkable: passes — It can be checked against evidence.
- Load-bearing: passes — The paper’s conclusions depend on it.
- Based: passes — The paper gives a reason why it holds.
- Partly supported
Every source the paper cites for this claim was checked and supports it.
In the paper
“Sphingomyelinase treatment greatly expands the accessible pool of PM cholesterol in GRAMD1 TKO cells due to inefficient transport of newly liberated accessible cholesterol from the PM to the ER (Naito et al, 2019).”
§ Molecular basis of accessible plasma membrane cholesterol recognition by the GRAM domain of GRAMD1b > Results > Cholesterol‐sensing property of the GRAM domain is critical for GRAMD1b function
What the sources say
- Supportedcites Naito et al, 2019 source
The Results section reports exaggerated accumulation of accessible PM cholesterol in GRAMD1 TKO cells after sphingomyelinase treatment. It also attributes the sustained accumulation to less efficient transport of accessible cholesterol from the PM to the ER. Page numbers were not provided in our copy. (LLM, conf=0.94)
plaindirect- Asserted: passes — The authors put it forward as true.
- Checkable: passes — It can be checked against evidence.
- Load-bearing: passes — The paper’s conclusions depend on it.
- Based: passes — The paper gives a reason why it holds.
- Supported
The cited sources support only part of this claim — read each source’s verdict below.
In the paper
“Yeast mutants that lack GRAMD1 homologs (Lam/Ltc proteins) are highly susceptible to treatment with the polyene antibiotic, Amphotericin B, compared to WT cells (Gatta et al, 2015; Marek et al, 2020).”
§ Molecular basis of accessible plasma membrane cholesterol recognition by the GRAM domain of GRAMD1b > Results > Cholesterol‐sensing property of the GRAM domain is critical for GRAMD1b function
What the sources say
- Partly supportedcites Gatta et al, 2015 sourceExperimental — accuracy not yet measured
The Results section (‘Ysp2p function correlates with sterol binding to its StART-like domain’; Figure 4A) reports that Δysp1 and Δsip3 were highly sensitive to amphotericin B compared with wild type. But Δysp2 was only moderately sensitive, while Δlam4, Δlam5 and Δlam6 behaved like wild type, so the claim is too broad for mutants lacking Lam/Ltc proteins generally. (LLM, conf=0.91)
- Supportedcites Marek et al, 2020 source
The Results section, “Sterol flow contributes to plasma membrane homeostasis,” reports enhanced Amphotericin B sensitivity in S. pombe ltc1Δ cells under steady-state conditions. Figure 6D compares WT and mutant growth on medium containing Amphotericin B. This supports the claim for the Ltc1-deficient yeast mutant studied by Marek et al. (LLM, conf=0.91)
plaincorrelational- Asserted: passes — The authors put it forward as true.
- Checkable: passes — It can be checked against evidence.
- Load-bearing: passes — The paper’s conclusions depend on it.
- Based: passes — The paper gives a reason why it holds.
- Partly supported
Every source the paper cites for this claim was checked and supports it.
In the paper
“consistent with the direct role of GRAMD1b in extracting and transporting accessible cholesterol from the PM to the ER (Naito et al, 2019; Ferrari et al, 2020)”
§ Molecular basis of accessible plasma membrane cholesterol recognition by the GRAM domain of GRAMD1b > Results > G187 is critical for determining the sensitivity of the GRAM domain to accessible PM cholesterol and regulating GRAMD1b‐dependent cholesterol transport
What the sources say
- Supportedcites Naito et al, 2019 source
The Results section on the StART-like domain reports that purified GRAMD1b transfers a cholesterol analog between membranes. The Discussion states that GRAMD1 proteins directly facilitate transport of accessible PM cholesterol to the ER, particularly when the accessible pool expands. Together, these passages support the attributed role of GRAMD1b; our copy provides no page numbers. (LLM, conf=0.90)
- Supportedcites Ferrari et al, 2020 source
The Abstract identifies Aster-B as the protein encoded by Gramd1b and says Asters remove excess plasma-membrane cholesterol and transport it to the ER. The Discussion specifically says Aster-B moves surplus cholesterol from the PM to the ER; the paper also reports that loss of Aster expression expands the accessible PM cholesterol pool. (LLM, conf=0.91)
plaindirect- Asserted: passes — The authors put it forward as true.
- Checkable: passes — It can be checked against evidence.
- Load-bearing: passes — The paper’s conclusions depend on it.
- Based: passes — The paper gives a reason why it holds.
- Supported
Every source the paper cites for this claim was checked and supports it.
In the paper
“consistent with the ability of sphingomyelin to effectively sequester cholesterol (Endapally et al, 2019).”
§ Molecular basis of accessible plasma membrane cholesterol recognition by the GRAM domain of GRAMD1b > Discussion
What the sources say
- Supportedcites Endapally et al, 2019 source
The Introduction states that about half of the inaccessible plasma-membrane cholesterol is sequestered by sphingomyelin. The Discussion reports sphingomyelin–cholesterol complexes in six cultured cell lines and describes a fixed pool of cholesterol sequestered in those complexes. This supports the attributed ability to sequester cholesterol. (LLM, conf=0.94)
plaindirect- Asserted: passes — The authors put it forward as true.
- Checkable: passes — It can be checked against evidence.
- Load-bearing: passes — The paper’s conclusions depend on it.
- Based: passes — The paper gives a reason why it holds.
- Supported
The cited sources support only part of this claim — read each source’s verdict below.
In the paper
“Non‐vesicular lipid transport between cellular membranes is most efficient when donor and target membranes are closely apposed (Lev, 2012; Wong et al, 2019).”
§ Molecular basis of accessible plasma membrane cholesterol recognition by the GRAM domain of GRAMD1b > Discussion
What the sources say
- Supportedcites Lev, 2012 source
The Principles of Lipid Transport by LTPs section says close apposition at membrane contact sites greatly reduces the time a lipid-transfer protein spends diffusing between donor and acceptor membranes. The Nonvesicular Lipid Transport section also says spontaneous transfer is markedly accelerated at those sites. Together, these support the citing sentence’s general point; page numbers were not supplied in our copy. (LLM, conf=0.90)
- Partly supportedcites Wong et al, 2019 sourceExperimental — accuracy not yet measured
The Introduction (p. 4) says many lipid transfer proteins operate at membrane contact sites with narrow gaps, typically ≤30 nm, where they transfer lipids between organelles. This supports the role of close apposition, but the passage does not establish that transport is *most efficient* there compared with more widely separated membranes. (LLM, conf=0.82)
plaincorrelational- Asserted: passes — The authors put it forward as true.
- Checkable: passes — It can be checked against evidence.
- Load-bearing: passes — The paper’s conclusions depend on it.
- Based: passes — The paper gives a reason why it holds.
- Supported
A result the paper reports from its own data — it cites no other source for it, so there is none to check. The quote shows it is in the paper.
In the paper
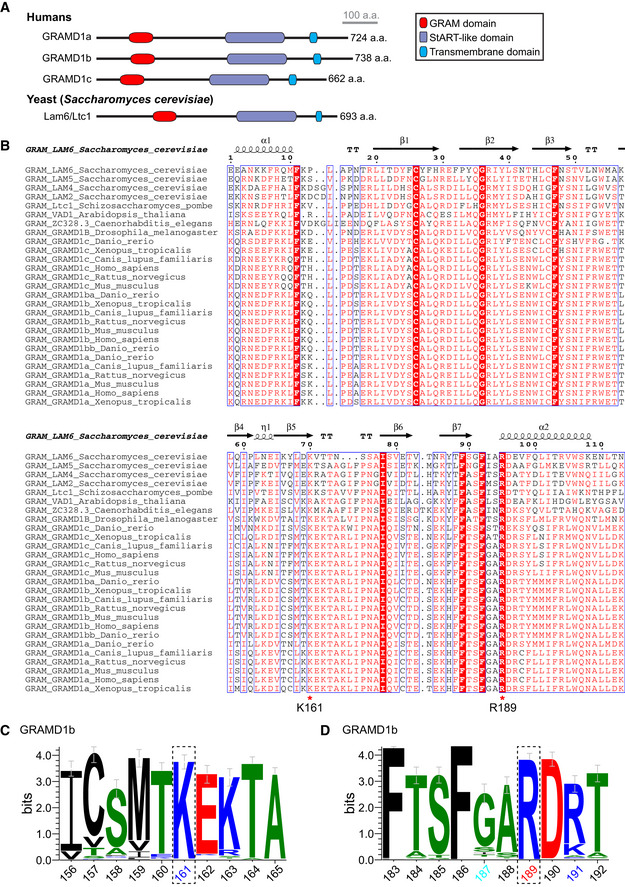
“Structural modeling revealed that residue R189 is located in the β7‐α2 loop of GRAM1b, near amino acid residues that contribute to PS/anionic lipid‐sensing (K161, R191) (Fig 3C).”
§ Molecular basis of accessible plasma membrane cholesterol recognition by the GRAM domain of GRAMD1b > Results > A GRAMD1b mutation (R189W) associated with intellectual disability specifically impairs binding of the GRAM domain to cholesterol
plain- Asserted: passes — The authors put it forward as true.
- Checkable: passes — It can be checked against evidence.
- Load-bearing: unclear — It is unclear whether the paper’s conclusions depend on it.
- Based: passes — The paper gives a reason why it holds.
- Rests on an assumption: The structural model of GRAM1b based on the Lam6/Ltc1 GRAM domain accurately represents the structure of GRAM1b.
A result the paper reports from its own data — it cites no other source for it, so there is none to check. The quote shows it is in the paper.
In the paper
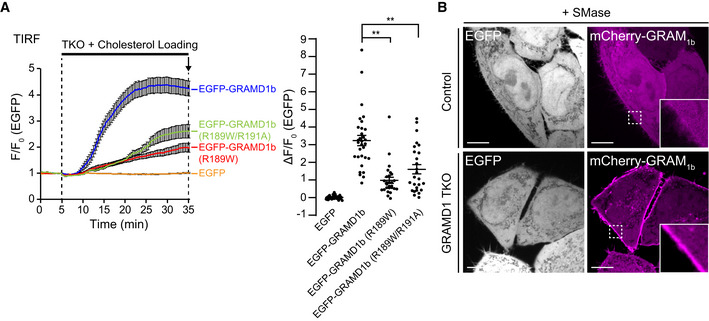
“Anionic lipid‐sensing defective EGFP‐GRAM1b mutants that exhibit some anionic lipid binding (K161A and R191A) were partially recruited to the PM following sphingomyelinase treatment.”
§ Molecular basis of accessible plasma membrane cholesterol recognition by the GRAM domain of GRAMD1b > Results > Both cholesterol‐ and anionic lipid‐sensing properties are required for the GRAM domain of GRAMD1b to sense expansions of the accessible pool of PM cholesterol
plaindirect- Asserted: passes — The authors put it forward as true.
- Checkable: passes — It can be checked against evidence.
- Load-bearing: passes — The paper’s conclusions depend on it.
- Based: passes — The paper gives a reason why it holds.
A result the paper reports from its own data — it cites no other source for it, so there is none to check. The quote shows it is in the paper.
In the paper
“At steady state, all EGFP‐GRAM1b variants were distributed throughout the cytosol (Appendix Fig S1B).”
§ Molecular basis of accessible plasma membrane cholesterol recognition by the GRAM domain of GRAMD1b > Results > Both cholesterol‐ and anionic lipid‐sensing properties are required for the GRAM domain of GRAMD1b to sense expansions of the accessible pool of PM cholesterol
plain- Asserted: passes — The authors put it forward as true.
- Checkable: passes — It can be checked against evidence.
- Load-bearing: passes — The paper’s conclusions depend on it.
- Based: passes — The paper gives a reason why it holds.
A result the paper reports from its own data — it cites no other source for it, so there is none to check. The quote shows it is in the paper.
In the paper
“Importantly, these results also demonstrate that such codistribution can be modulated by the additional presence of sphingomyelin, which normally sequesters cholesterol into inaccessible pools in the PM.”
§ Molecular basis of accessible plasma membrane cholesterol recognition by the GRAM domain of GRAMD1b > Results > The GRAM domain of GRAMD1b detects the codistribution of accessible cholesterol and PS, which is regulated by sphingomyelin
boosteddirect- Asserted: passes — The authors put it forward as true.
- Checkable: passes — It can be checked against evidence.
- Load-bearing: passes — The paper’s conclusions depend on it.
- Based: passes — The paper gives a reason why it holds.
A result the paper reports from its own data — it cites no other source for it, so there is none to check. The quote shows it is in the paper.
In the paper
“Note the absence of PM recruitment.”
§ Molecular basis of accessible plasma membrane cholesterol recognition by the GRAM domain of GRAMD1b > Results > The GRAM domain of GRAMD1b detects the codistribution of accessible cholesterol and PS, which is regulated by sphingomyelin
plain- Asserted: passes — The authors put it forward as true.
- Checkable: passes — It can be checked against evidence.
- Load-bearing: passes — The paper’s conclusions depend on it.
- Based: passes — The paper gives a reason why it holds.
A result the paper reports from its own data — it cites no other source for it, so there is none to check. The quote shows it is in the paper.
In the paper
“Note that the presence of PS does not affect the binding of ECFP‐D4H to cholesterol‐containing liposomes”
§ Molecular basis of accessible plasma membrane cholesterol recognition by the GRAM domain of GRAMD1b > Results > The GRAM domain of GRAMD1b detects the codistribution of accessible cholesterol and PS, which is regulated by sphingomyelin
plainn = 3- Asserted: passes — The authors put it forward as true.
- Checkable: passes — It can be checked against evidence.
- Load-bearing: passes — The paper’s conclusions depend on it.
- Based: passes — The paper gives a reason why it holds.
A result the paper reports from its own data — it cites no other source for it, so there is none to check. The quote shows it is in the paper.
In the paper
“Finally, we performed a mini‐mutagenesis screen and found that a single glycine residue at the position 187 (G187) is critical for the sensitivity of the GRAM domain to accessible PM cholesterol.”
§ Molecular basis of accessible plasma membrane cholesterol recognition by the GRAM domain of GRAMD1b > Introduction
plaindirect- Asserted: passes — The authors put it forward as true.
- Checkable: passes — It can be checked against evidence.
- Load-bearing: passes — The paper’s conclusions depend on it.
- Based: passes — The paper gives a reason why it holds.
A result the paper reports from its own data — it cites no other source for it, so there is none to check. The quote shows it is in the paper.
In the paper
“We show that the GRAM domain of GRAMD1b, a coincidence detector for anionic lipids, including phosphatidylserine (PS), and cholesterol, possesses distinct but synergistic sites for sensing accessible cholesterol and anionic lipids.”
- Also stated in: § Introduction · boosted
“Our results show that the GRAM domain of GRAMD1b possesses distinct but physically proximal lipid‐sensing sites and that one is dedicated to cholesterol and one is dedicated to anionic lipids.”
§ Molecular basis of accessible plasma membrane cholesterol recognition by the GRAM domain of GRAMD1b > Abstract
boostedcorrelational- Asserted: passes — The authors put it forward as true.
- Checkable: passes — It can be checked against evidence.
- Load-bearing: passes — The paper’s conclusions depend on it.
- Based: passes — The paper gives a reason why it holds.
- Also stated in: § Introduction · boosted
A result the paper reports from its own data — it cites no other source for it, so there is none to check. The quote shows it is in the paper.
In the paper
“Purified GRAM1b carrying the R189W/R191A double mutation (GRAM1b–R189W/R191A) bound slightly less efficiently to liposomes containing cholesterol and PS than GRAM1b–R189W (~17% binding when liposomes contained 20% PS and 50% cholesterol)”
§ Molecular basis of accessible plasma membrane cholesterol recognition by the GRAM domain of GRAMD1b > Results > A GRAMD1b mutation (R189W) associated with intellectual disability specifically impairs binding of the GRAM domain to cholesterol
plaindirect- Asserted: passes — The authors put it forward as true.
- Checkable: passes — It can be checked against evidence.
- Load-bearing: passes — The paper’s conclusions depend on it.
- Based: passes — The paper gives a reason why it holds.
A result the paper reports from its own data — it cites no other source for it, so there is none to check. The quote shows it is in the paper.
In the paper
“Note the concentration‐dependent DHE transfer mediated by GRAMD1b–WT and GRAMD1b–G187L proteins.”
§ Molecular basis of accessible plasma membrane cholesterol recognition by the GRAM domain of GRAMD1b > Results > The GRAM domain of GRAMD1b detects the codistribution of accessible cholesterol and PS, which is regulated by sphingomyelin
plaindirectn = 3- Asserted: passes — The authors put it forward as true.
- Checkable: passes — It can be checked against evidence.
- Load-bearing: passes — The paper’s conclusions depend on it.
- Based: passes — The paper gives a reason why it holds.
The paper states this without a source or data behind it here, so there is nothing to check it against. The quote shows it is in the paper.
In the paper
“dramatically impairing the ability of GRAMD1b to sense transient expansions in the accessible pool of PM cholesterol.”
§ Molecular basis of accessible plasma membrane cholesterol recognition by the GRAM domain of GRAMD1b > Introduction
plaindirect- Asserted: passes — The authors put it forward as true.
- Checkable: passes — It can be checked against evidence.
- Load-bearing: passes — The paper’s conclusions depend on it.
- Based: passes — The paper gives a reason why it holds.
The paper states this without a source or data behind it here, so there is nothing to check it against. The quote shows it is in the paper.
In the paper
“Binding of GRAM1b–R189W/R191A to liposomes containing only PS was significantly reduced compared to GRAM1b–R189W or GRAM1b, as predicted based on the importance of R191 in anionic lipid recognition.”
§ Molecular basis of accessible plasma membrane cholesterol recognition by the GRAM domain of GRAMD1b > Results > A GRAMD1b mutation (R189W) associated with intellectual disability specifically impairs binding of the GRAM domain to cholesterol
plaindirect- Asserted: passes — The authors put it forward as true.
- Checkable: passes — It can be checked against evidence.
- Load-bearing: passes — The paper’s conclusions depend on it.
- Based: passes — The paper gives a reason why it holds.
A result the paper reports from its own data — it cites no other source for it, so there is none to check. The quote shows it is in the paper.
In the paper
“Control and mutant GRAM1b bound similarly to liposomes containing PS (Fig 3E).”
§ Molecular basis of accessible plasma membrane cholesterol recognition by the GRAM domain of GRAMD1b > Results > A GRAMD1b mutation (R189W) associated with intellectual disability specifically impairs binding of the GRAM domain to cholesterol
plain- Asserted: passes — The authors put it forward as true.
- Checkable: passes — It can be checked against evidence.
- Load-bearing: passes — The paper’s conclusions depend on it.
- Based: passes — The paper gives a reason why it holds.
A result the paper reports from its own data — it cites no other source for it, so there is none to check. The quote shows it is in the paper.
In the paper
“GRAM1b bound equally robustly to liposomes containing 20% PS and either 60% desmosterol or 60% cholesterol (~95% binding) (Appendix Fig S1A).”
§ Molecular basis of accessible plasma membrane cholesterol recognition by the GRAM domain of GRAMD1b > Results > A GRAMD1b mutation (R189W) associated with intellectual disability specifically impairs binding of the GRAM domain to cholesterol
plain- Asserted: passes — The authors put it forward as true.
- Checkable: passes — It can be checked against evidence.
- Load-bearing: passes — The paper’s conclusions depend on it.
- Based: passes — The paper gives a reason why it holds.
A result the paper reports from its own data — it cites no other source for it, so there is none to check. The quote shows it is in the paper.
In the paper
“Treating GRAMD1 TKO cells with sphingomyelinase for 1 h led to the recruitment of EGFP‐GRAM1b to the PM due to the expansion of the accessible pool of PM cholesterol (Fig 3F and G).”
§ Molecular basis of accessible plasma membrane cholesterol recognition by the GRAM domain of GRAMD1b > Results > Both cholesterol‐ and anionic lipid‐sensing properties are required for the GRAM domain of GRAMD1b to sense expansions of the accessible pool of PM cholesterol
plaindirect- Asserted: passes — The authors put it forward as true.
- Checkable: passes — It can be checked against evidence.
- Load-bearing: passes — The paper’s conclusions depend on it.
- Based: passes — The paper gives a reason why it holds.
A result the paper reports from its own data — it cites no other source for it, so there is none to check. The quote shows it is in the paper.
In the paper
“However, PM recruitment of GRAM1b (mCherry‐GRAM1b or EGFP‐GRAM1b) was completely abolished by pre‐incubation with purified ECFP‐D4H proteins (Fig 1D)”
§ Molecular basis of accessible plasma membrane cholesterol recognition by the GRAM domain of GRAMD1b > Results > The GRAM domain of GRAMD1b detects the codistribution of accessible cholesterol and PS, which is regulated by sphingomyelin
plaindirect- Asserted: passes — The authors put it forward as true.
- Checkable: passes — It can be checked against evidence.
- Load-bearing: passes — The paper’s conclusions depend on it.
- Based: passes — The paper gives a reason why it holds.
A result the paper reports from its own data — it cites no other source for it, so there is none to check. The quote shows it is in the paper.
In the paper
“However, the K161A/R191A, R189W, and R189W/R191A mutants failed to localize to the PM, even after 60 min (Fig 3H, Appendix Fig S1C, Movie EV1).”
§ Molecular basis of accessible plasma membrane cholesterol recognition by the GRAM domain of GRAMD1b > Results > Both cholesterol‐ and anionic lipid‐sensing properties are required for the GRAM domain of GRAMD1b to sense expansions of the accessible pool of PM cholesterol
plain- Asserted: passes — The authors put it forward as true.
- Checkable: passes — It can be checked against evidence.
- Load-bearing: passes — The paper’s conclusions depend on it.
- Based: passes — The paper gives a reason why it holds.
A result the paper reports from its own data — it cites no other source for it, so there is none to check. The quote shows it is in the paper.
In the paper
“and significantly attenuated by mCherry‐Lact‐C2 overexpression (Fig 1E)”
§ Molecular basis of accessible plasma membrane cholesterol recognition by the GRAM domain of GRAMD1b > Results > The GRAM domain of GRAMD1b detects the codistribution of accessible cholesterol and PS, which is regulated by sphingomyelin
plaindirect- Asserted: passes — The authors put it forward as true.
- Checkable: passes — It can be checked against evidence.
- Load-bearing: passes — The paper’s conclusions depend on it.
- Based: passes — The paper gives a reason why it holds.
A result the paper reports from its own data — it cites no other source for it, so there is none to check. The quote shows it is in the paper.
In the paper
“Note the very weak PM recruitment of mCherry‐GRAM1b in HeLa cells compared to the strong PM recruitment of mCherry‐GRAM1b in GRAMD1 TKO cells.”
§ Molecular basis of accessible plasma membrane cholesterol recognition by the GRAM domain of GRAMD1b > Results > The GRAM domain of GRAMD1b detects the codistribution of accessible cholesterol and PS, which is regulated by sphingomyelin
plaincorrelational- Asserted: passes — The authors put it forward as true.
- Checkable: passes — It can be checked against evidence.
- Load-bearing: passes — The paper’s conclusions depend on it.
- Based: passes — The paper gives a reason why it holds.
A result the paper reports from its own data — it cites no other source for it, so there is none to check. The quote shows it is in the paper.
In the paper
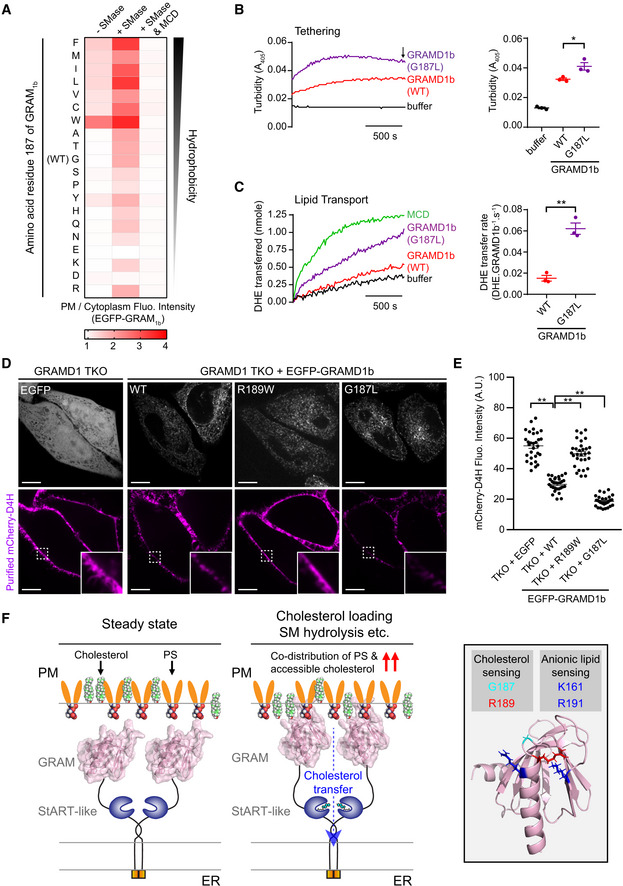
“Note the strong resistance against Amphotericin B of GRAMD1 TKO HeLa cells that stably expressed EGFP‐GRAMD1b–G187L.”
§ Molecular basis of accessible plasma membrane cholesterol recognition by the GRAM domain of GRAMD1b > Results > The GRAM domain of GRAMD1b detects the codistribution of accessible cholesterol and PS, which is regulated by sphingomyelin
boostedn = 3- Asserted: passes — The authors put it forward as true.
- Checkable: passes — It can be checked against evidence.
- Load-bearing: passes — The paper’s conclusions depend on it.
- Based: passes — The paper gives a reason why it holds.
A result the paper reports from its own data — it cites no other source for it, so there is none to check. The quote shows it is in the paper.
In the paper
“In contrast to PS detection, WT and mutant GRAM1b bound to liposomes that contained only cholesterol (60%) to the same extent (~15% binding) (Fig 2C).”
§ Molecular basis of accessible plasma membrane cholesterol recognition by the GRAM domain of GRAMD1b > Results > A basic patch within the GRAM domain of GRAMD1b is critical for anionic lipid recognition
plain- Asserted: passes — The authors put it forward as true.
- Checkable: passes — It can be checked against evidence.
- Load-bearing: passes — The paper’s conclusions depend on it.
- Based: passes — The paper gives a reason why it holds.
A result the paper reports from its own data — it cites no other source for it, so there is none to check. The quote shows it is in the paper.
In the paper
“Note also the absence of DHE transfer by GRAMD1b‐R189W/R191A proteins at any concentration tested”
§ Molecular basis of accessible plasma membrane cholesterol recognition by the GRAM domain of GRAMD1b > Results > The GRAM domain of GRAMD1b detects the codistribution of accessible cholesterol and PS, which is regulated by sphingomyelin
plainn = 3- Asserted: passes — The authors put it forward as true.
- Checkable: passes — It can be checked against evidence.
- Load-bearing: passes — The paper’s conclusions depend on it.
- Based: passes — The paper gives a reason why it holds.
A result the paper reports from its own data — it cites no other source for it, so there is none to check. The quote shows it is in the paper.
In the paper
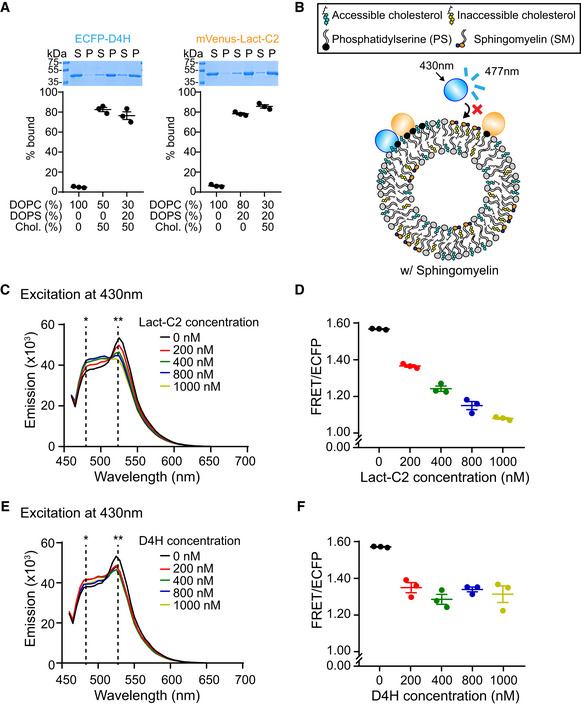
“and that the presence of cholesterol does not affect the binding of mVenus‐Lact‐C2 to PS containing liposomes.”
§ Molecular basis of accessible plasma membrane cholesterol recognition by the GRAM domain of GRAMD1b > Results > The GRAM domain of GRAMD1b detects the codistribution of accessible cholesterol and PS, which is regulated by sphingomyelin
plainn = 3- Asserted: passes — The authors put it forward as true.
- Checkable: passes — It can be checked against evidence.
- Load-bearing: passes — The paper’s conclusions depend on it.
- Based: passes — The paper gives a reason why it holds.
A result the paper reports from its own data — it cites no other source for it, so there is none to check. The quote shows it is in the paper.
In the paper
“FRET was decreased by addition of either untagged Lact‐C2 or untagged D4H in a concentration‐dependent manner (Fig EV1, EV2, EV3, EV4, EV5).”
§ Molecular basis of accessible plasma membrane cholesterol recognition by the GRAM domain of GRAMD1b > Results > The GRAM domain of GRAMD1b detects the codistribution of accessible cholesterol and PS, which is regulated by sphingomyelin
plaindirect- Asserted: passes — The authors put it forward as true.
- Checkable: passes — It can be checked against evidence.
- Load-bearing: passes — The paper’s conclusions depend on it.
- Based: passes — The paper gives a reason why it holds.
A result the paper reports from its own data — it cites no other source for it, so there is none to check. The quote shows it is in the paper.
In the paper
“Note the resistance of GRAMD1 TKO cells that stably expressed EGFP‐GRAMD1b–G187L compared to GRAMD1 TKO cells that stably expressed either EGFP or EGFP‐GRAMD1b–WT”
§ Molecular basis of accessible plasma membrane cholesterol recognition by the GRAM domain of GRAMD1b > Results > The GRAM domain of GRAMD1b detects the codistribution of accessible cholesterol and PS, which is regulated by sphingomyelin
plaincorrelationaln = 3- Asserted: passes — The authors put it forward as true.
- Checkable: passes — It can be checked against evidence.
- Load-bearing: passes — The paper’s conclusions depend on it.
- Based: passes — The paper gives a reason why it holds.
A result the paper reports from its own data — it cites no other source for it, so there is none to check. The quote shows it is in the paper.
In the paper
“Strikingly, GRAM1b–R189W bound much less efficiently to liposomes compared to control GRAM1b (~22% binding compared to ~90% binding for the WT control when liposomes contained 20% PS and 50% cholesterol).”
§ Molecular basis of accessible plasma membrane cholesterol recognition by the GRAM domain of GRAMD1b > Results > A GRAMD1b mutation (R189W) associated with intellectual disability specifically impairs binding of the GRAM domain to cholesterol
plaindirect- Asserted: passes — The authors put it forward as true.
- Checkable: passes — It can be checked against evidence.
- Load-bearing: passes — The paper’s conclusions depend on it.
- Based: passes — The paper gives a reason why it holds.
A result the paper reports from its own data — it cites no other source for it, so there is none to check. The quote shows it is in the paper.
In the paper
“Interestingly, R189 is a residue that is evolutionarily conserved from yeast to humans (Fig EV2, EV3, EV4, EV5).”
§ Molecular basis of accessible plasma membrane cholesterol recognition by the GRAM domain of GRAMD1b > Results > A GRAMD1b mutation (R189W) associated with intellectual disability specifically impairs binding of the GRAM domain to cholesterol
plain- Asserted: passes — The authors put it forward as true.
- Checkable: passes — It can be checked against evidence.
- Load-bearing: unclear — It is unclear whether the paper’s conclusions depend on it.
- Based: passes — The paper gives a reason why it holds.
A result the paper reports from its own data — it cites no other source for it, so there is none to check. The quote shows it is in the paper.
In the paper
“Strikingly, strong FRET was observed when both cholesterol (50%) and PS (20%) were simultaneously incorporated into liposomes”
- Also stated in: § The GRAM domain of GRAMD1b detects the codistribution of accessible cholesterol and PS, which is regulated by sphingomyelin · plain
“Note that FRET signal was increased in the presence of both cholesterol (50%) and phosphatidylserine (DOPS) (20%)”
§ Molecular basis of accessible plasma membrane cholesterol recognition by the GRAM domain of GRAMD1b > Results > The GRAM domain of GRAMD1b detects the codistribution of accessible cholesterol and PS, which is regulated by sphingomyelin
boostedcorrelationaln = 4- Asserted: passes — The authors put it forward as true.
- Checkable: passes — It can be checked against evidence.
- Load-bearing: passes — The paper’s conclusions depend on it.
- Based: passes — The paper gives a reason why it holds.
- Also stated in: § The GRAM domain of GRAMD1b detects the codistribution of accessible cholesterol and PS, which is regulated by sphingomyelin · plain
A result the paper reports from its own data — it cites no other source for it, so there is none to check. The quote shows it is in the paper.
In the paper
“However, GRAM1b–R189W bound less efficiently to liposomes containing 60% cholesterol and no PS (~4% binding compared to ~15% for WT controls) (Fig 3E).”
§ Molecular basis of accessible plasma membrane cholesterol recognition by the GRAM domain of GRAMD1b > Results > A GRAMD1b mutation (R189W) associated with intellectual disability specifically impairs binding of the GRAM domain to cholesterol
plaindirect- Asserted: passes — The authors put it forward as true.
- Checkable: passes — It can be checked against evidence.
- Load-bearing: passes — The paper’s conclusions depend on it.
- Based: passes — The paper gives a reason why it holds.
A result the paper reports from its own data — it cites no other source for it, so there is none to check. The quote shows it is in the paper.
In the paper
“However, mutant versions of GRAM1b that carried the K161A, R191A, or K161A/R191A mutation bound to liposomes less efficiently than WT controls.”
§ Molecular basis of accessible plasma membrane cholesterol recognition by the GRAM domain of GRAMD1b > Results > A basic patch within the GRAM domain of GRAMD1b is critical for anionic lipid recognition
plaindirect- Asserted: passes — The authors put it forward as true.
- Checkable: passes — It can be checked against evidence.
- Load-bearing: passes — The paper’s conclusions depend on it.
- Based: passes — The paper gives a reason why it holds.
A result the paper reports from its own data — it cites no other source for it, so there is none to check. The quote shows it is in the paper.
In the paper
“Within 30 min of sphingomyelinase treatment, robust PM recruitment of EGFP‐GRAM1b was observed.”
§ Molecular basis of accessible plasma membrane cholesterol recognition by the GRAM domain of GRAMD1b > Results > Both cholesterol‐ and anionic lipid‐sensing properties are required for the GRAM domain of GRAMD1b to sense expansions of the accessible pool of PM cholesterol
plaindirect- Asserted: passes — The authors put it forward as true.
- Checkable: passes — It can be checked against evidence.
- Load-bearing: passes — The paper’s conclusions depend on it.
- Based: passes — The paper gives a reason why it holds.
A result the paper reports from its own data — it cites no other source for it, so there is none to check. The quote shows it is in the paper.
In the paper
“No further reduction in binding to liposomes containing only cholesterol was observed when the R191A mutation was added (Fig 3E).”
§ Molecular basis of accessible plasma membrane cholesterol recognition by the GRAM domain of GRAMD1b > Results > A GRAMD1b mutation (R189W) associated with intellectual disability specifically impairs binding of the GRAM domain to cholesterol
plain- Asserted: passes — The authors put it forward as true.
- Checkable: passes — It can be checked against evidence.
- Load-bearing: passes — The paper’s conclusions depend on it.
- Based: passes — The paper gives a reason why it holds.
A result the paper reports from its own data — it cites no other source for it, so there is none to check. The quote shows it is in the paper.
In the paper
“The K161A and R191A mutants were still recruited to the PM, albeit less efficiently compared to control EGFP‐GRAM1b (Fig 3H, Appendix Fig S1C).”
§ Molecular basis of accessible plasma membrane cholesterol recognition by the GRAM domain of GRAMD1b > Results > Both cholesterol‐ and anionic lipid‐sensing properties are required for the GRAM domain of GRAMD1b to sense expansions of the accessible pool of PM cholesterol
plaincorrelational- Asserted: passes — The authors put it forward as true.
- Checkable: passes — It can be checked against evidence.
- Load-bearing: passes — The paper’s conclusions depend on it.
- Based: passes — The paper gives a reason why it holds.
A result the paper reports from its own data — it cites no other source for it, so there is none to check. The quote shows it is in the paper.
In the paper
“In both cases, sphingomyelinase treatment resulted in strong recruitment of GRAM1b (mCherry‐GRAM1b or EGFP‐GRAM1b) to the PM in GRAMD1 TKO cells in control conditions (Fig 1D and E).”
§ Molecular basis of accessible plasma membrane cholesterol recognition by the GRAM domain of GRAMD1b > Results > The GRAM domain of GRAMD1b detects the codistribution of accessible cholesterol and PS, which is regulated by sphingomyelin
boosteddirect- Asserted: passes — The authors put it forward as true.
- Checkable: passes — It can be checked against evidence.
- Load-bearing: passes — The paper’s conclusions depend on it.
- Based: passes — The paper gives a reason why it holds.
A result the paper reports from its own data — it cites no other source for it, so there is none to check. The quote shows it is in the paper.
In the paper
“Mutant GRAM1b (K161A, R191A, or K161A/R191A) bound significantly less to liposomes compared to WT GRAM1b.”
§ Molecular basis of accessible plasma membrane cholesterol recognition by the GRAM domain of GRAMD1b > Results > A basic patch within the GRAM domain of GRAMD1b is critical for anionic lipid recognition
plaindirect- Asserted: passes — The authors put it forward as true.
- Checkable: passes — It can be checked against evidence.
- Load-bearing: passes — The paper’s conclusions depend on it.
- Based: passes — The paper gives a reason why it holds.
A result the paper reports from its own data — it cites no other source for it, so there is none to check. The quote shows it is in the paper.
In the paper
“GRAMD1 TKO cells pre‐treated with sphingomyelinase for 3 h were more efficiently killed by Amphotericin B compared to WT cells subjected to the same treatment”
§ Molecular basis of accessible plasma membrane cholesterol recognition by the GRAM domain of GRAMD1b > Results > G187 is critical for determining the sensitivity of the GRAM domain to accessible PM cholesterol and regulating GRAMD1b‐dependent cholesterol transport
plaincorrelational- Asserted: passes — The authors put it forward as true.
- Checkable: passes — It can be checked against evidence.
- Load-bearing: passes — The paper’s conclusions depend on it.
- Based: passes — The paper gives a reason why it holds.
A result the paper reports from its own data — it cites no other source for it, so there is none to check. The quote shows it is in the paper.
In the paper
“Remarkably, the binding of mCherry‐D4H to the PM was further reduced by expressing EGFP‐GRAMD1b–G187L compared to EGFP‐GRAMD1b–WT (Fig 7D and E).”
§ Molecular basis of accessible plasma membrane cholesterol recognition by the GRAM domain of GRAMD1b > Results > G187 is critical for determining the sensitivity of the GRAM domain to accessible PM cholesterol and regulating GRAMD1b‐dependent cholesterol transport
plaindirect- Asserted: passes — The authors put it forward as true.
- Checkable: passes — It can be checked against evidence.
- Load-bearing: passes — The paper’s conclusions depend on it.
- Based: passes — The paper gives a reason why it holds.
A result the paper reports from its own data — it cites no other source for it, so there is none to check. The quote shows it is in the paper.
In the paper
“mCherry‐GRAM1b was more strongly recruited to the PM in GRAMD1 TKO cells compared to control HeLa cells (Fig EV3B).”
§ Molecular basis of accessible plasma membrane cholesterol recognition by the GRAM domain of GRAMD1b > Results > Cholesterol‐sensing property of the GRAM domain is critical for GRAMD1b function
plaincorrelational- Asserted: passes — The authors put it forward as true.
- Checkable: passes — It can be checked against evidence.
- Load-bearing: passes — The paper’s conclusions depend on it.
- Based: passes — The paper gives a reason why it holds.
A result the paper reports from its own data — it cites no other source for it, so there is none to check. The quote shows it is in the paper.
In the paper
“The addition of near full‐length GRAMD1b protein (GRAMD1b–WT) resulted in an increase in optical turbidity over time, consistent with the progressive tethering of PM‐like and ER‐like liposomes (Fig 4B).”
§ Molecular basis of accessible plasma membrane cholesterol recognition by the GRAM domain of GRAMD1b > Results > Mutant versions of GRAMD1b that cannot sense cholesterol exhibit impairment in membrane tethering and cholesterol transport
plaindirect- Asserted: passes — The authors put it forward as true.
- Checkable: passes — It can be checked against evidence.
- Load-bearing: passes — The paper’s conclusions depend on it.
- Based: passes — The paper gives a reason why it holds.
- Rests on an assumption: The PM-like and ER-like liposomes used in the in vitro transport assay mimic the lipid composition and properties of the plasma membrane and endoplasmic reticulum.
A result the paper reports from its own data — it cites no other source for it, so there is none to check. The quote shows it is in the paper.
In the paper
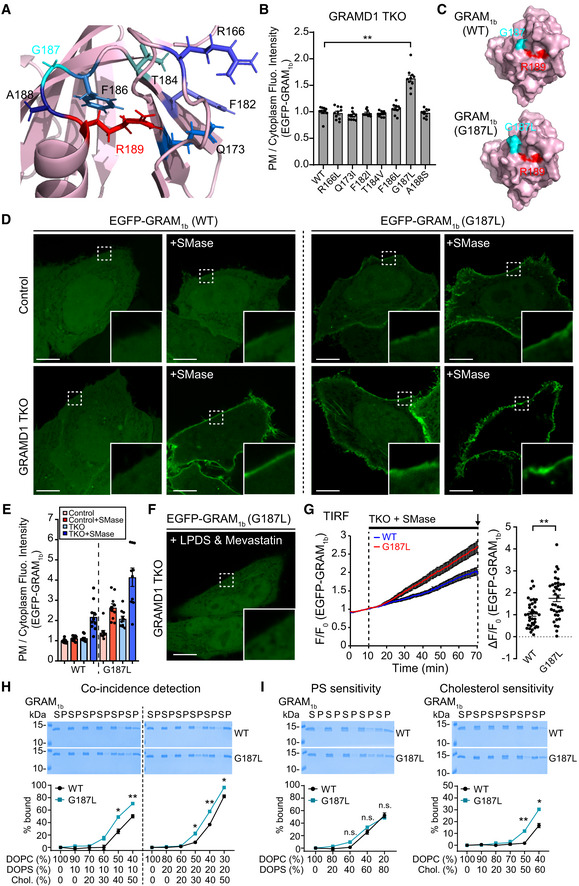
“However, GRAM1b–G187L bound to liposomes containing only cholesterol more strongly than GRAM1b (Fig 6I).”
§ Molecular basis of accessible plasma membrane cholesterol recognition by the GRAM domain of GRAMD1b > Results > The G187L mutation increases sensitivity of the GRAM domain to cholesterol without altering its affinity for PS
plaincorrelational- Asserted: passes — The authors put it forward as true.
- Checkable: passes — It can be checked against evidence.
- Load-bearing: passes — The paper’s conclusions depend on it.
- Based: passes — The paper gives a reason why it holds.
A result the paper reports from its own data — it cites no other source for it, so there is none to check. The quote shows it is in the paper.
In the paper
“Suppression of SREBP‐2 cleavage could be reliably detected by immunoblotting only after ~90 min”
§ Molecular basis of accessible plasma membrane cholesterol recognition by the GRAM domain of GRAMD1b > Results > G187 is critical for determining the sensitivity of the GRAM domain to accessible PM cholesterol and regulating GRAMD1b‐dependent cholesterol transport
hedged- Asserted: passes — The authors put it forward as true.
- Checkable: passes — It can be checked against evidence.
- Load-bearing: passes — The paper’s conclusions depend on it.
- Based: passes — The paper gives a reason why it holds.
A result the paper reports from its own data — it cites no other source for it, so there is none to check. The quote shows it is in the paper.
In the paper
“In cells, masking/trapping accessible PM cholesterol via purified accessible cholesterol‐binding proteins (D4H) or masking the head group of PS within the inner leaflet of the PM via overexpressed PS‐selective C2 domain (Lact‐C2) led to reduced PM recruitment of GRAM1b even when the accessible pool of PM cholesterol was expanded by hydrolysis of sphingomyelin.”
§ Molecular basis of accessible plasma membrane cholesterol recognition by the GRAM domain of GRAMD1b > Discussion
plaindirect- Asserted: passes — The authors put it forward as true.
- Checkable: passes — It can be checked against evidence.
- Load-bearing: passes — The paper’s conclusions depend on it.
- Based: passes — The paper gives a reason why it holds.
A result the paper reports from its own data — it cites no other source for it, so there is none to check. The quote shows it is in the paper.
In the paper
“GRAM1b–G187L was recruited to the PM even at steady state.”
§ Molecular basis of accessible plasma membrane cholesterol recognition by the GRAM domain of GRAMD1b > Discussion
plain- Asserted: passes — The authors put it forward as true.
- Checkable: passes — It can be checked against evidence.
- Load-bearing: passes — The paper’s conclusions depend on it.
- Based: passes — The paper gives a reason why it holds.
A result the paper reports from its own data — it cites no other source for it, so there is none to check. The quote shows it is in the paper.
In the paper
“Both proteins bound to liposomes containing only PS at similar levels (Fig 6I).”
§ Molecular basis of accessible plasma membrane cholesterol recognition by the GRAM domain of GRAMD1b > Results > The G187L mutation increases sensitivity of the GRAM domain to cholesterol without altering its affinity for PS
plain- Asserted: passes — The authors put it forward as true.
- Checkable: passes — It can be checked against evidence.
- Load-bearing: passes — The paper’s conclusions depend on it.
- Based: passes — The paper gives a reason why it holds.
A result the paper reports from its own data — it cites no other source for it, so there is none to check. The quote shows it is in the paper.
In the paper
“Notably, EGFP‐GRAM1b–G187L was recruited to the PM even in control HeLa cells, despite limited PM cholesterol accessibility at rest.”
§ Molecular basis of accessible plasma membrane cholesterol recognition by the GRAM domain of GRAMD1b > Results > Identification of a novel GRAM domain mutation in GRAMD1b (G187L) that enhances its ability to sense accessible PM cholesterol
plain- Asserted: passes — The authors put it forward as true.
- Checkable: passes — It can be checked against evidence.
- Load-bearing: passes — The paper’s conclusions depend on it.
- Based: passes — The paper gives a reason why it holds.
- Rests on an assumption: The modeled structure of the GRAM domain of GRAMD1b accurately represents the three-dimensional arrangement of the residues.
A result the paper reports from its own data — it cites no other source for it, so there is none to check. The quote shows it is in the paper.
In the paper
“Sphingomyelinase treatment after pre‐depletion resulted in a more rapid PM recruitment of EGFP‐GRAM1b–G187L compared to EGFP‐GRAM1b, further indicating that the G187L mutation increases the sensitivity of EGFP‐GRAM1b to accessible PM cholesterol (Fig 6G, Movie EV3).”
§ Molecular basis of accessible plasma membrane cholesterol recognition by the GRAM domain of GRAMD1b > Results > Identification of a novel GRAM domain mutation in GRAMD1b (G187L) that enhances its ability to sense accessible PM cholesterol
hedgeddirect- Asserted: passes — The authors put it forward as true.
- Checkable: passes — It can be checked against evidence.
- Load-bearing: passes — The paper’s conclusions depend on it.
- Based: passes — The paper gives a reason why it holds.
A result the paper reports from its own data — it cites no other source for it, so there is none to check. The quote shows it is in the paper.
In the paper
“We found that a fraction of accessible cholesterol codistributes with PS in artificial membranes.”
§ Molecular basis of accessible plasma membrane cholesterol recognition by the GRAM domain of GRAMD1b > Discussion
plaincorrelational- Asserted: passes — The authors put it forward as true.
- Checkable: passes — It can be checked against evidence.
- Load-bearing: passes — The paper’s conclusions depend on it.
- Based: passes — The paper gives a reason why it holds.
A result the paper reports from its own data — it cites no other source for it, so there is none to check. The quote shows it is in the paper.
In the paper
“For liposomes that contained 60% cholesterol, ~30% of GRAM1b–G187L bound to liposomes, whereas only ~15% of GRAM1b were bound (Fig 6I).”
§ Molecular basis of accessible plasma membrane cholesterol recognition by the GRAM domain of GRAMD1b > Results > The G187L mutation increases sensitivity of the GRAM domain to cholesterol without altering its affinity for PS
plaincorrelational- Asserted: passes — The authors put it forward as true.
- Checkable: passes — It can be checked against evidence.
- Load-bearing: passes — The paper’s conclusions depend on it.
- Based: passes — The paper gives a reason why it holds.
A result the paper reports from its own data — it cites no other source for it, so there is none to check. The quote shows it is in the paper.
In the paper
“However, the expression of EGFP‐GRAMD1b–R189W or EGFP‐GRAMD1b–R189W/R191A in TKO cells failed to rescue the phenotype (Fig 5E).”
§ Molecular basis of accessible plasma membrane cholesterol recognition by the GRAM domain of GRAMD1b > Results > Cholesterol‐sensing property of the GRAM domain is critical for GRAMD1b function
plain- Asserted: passes — The authors put it forward as true.
- Checkable: passes — It can be checked against evidence.
- Load-bearing: passes — The paper’s conclusions depend on it.
- Based: passes — The paper gives a reason why it holds.
A result the paper reports from its own data — it cites no other source for it, so there is none to check. The quote shows it is in the paper.
In the paper
“In contrast, the addition of GRAMD1b–R189W (defective in sensing cholesterol) or GRAMD1b–R189W/R191A (defective in sensing both cholesterol and anionic lipids) failed to increase optical turbidity despite their equally robust interaction with ER‐like liposomes compared to GRAMD1b–WT (Appendix Fig S3E)”
§ Molecular basis of accessible plasma membrane cholesterol recognition by the GRAM domain of GRAMD1b > Results > Mutant versions of GRAMD1b that cannot sense cholesterol exhibit impairment in membrane tethering and cholesterol transport
plain- Asserted: passes — The authors put it forward as true.
- Checkable: passes — It can be checked against evidence.
- Load-bearing: passes — The paper’s conclusions depend on it.
- Based: passes — The paper gives a reason why it holds.
- Rests on an assumption: The PM-like and ER-like liposomes used in the in vitro transport assay mimic the lipid composition and properties of the plasma membrane and endoplasmic reticulum.
A result the paper reports from its own data — it cites no other source for it, so there is none to check. The quote shows it is in the paper.
In the paper
“Further reduction in mCherry‐D4H binding to the PM was observed in GRAMD1 TKO HeLa cells that stably expressed EGFP‐GRAMD1b–G187L compared to GRAMD1 TKO HeLa cells that stably expressed EGFP‐GRAMD1b–WT.”
§ Molecular basis of accessible plasma membrane cholesterol recognition by the GRAM domain of GRAMD1b > Results > G187 is critical for determining the sensitivity of the GRAM domain to accessible PM cholesterol and regulating GRAMD1b‐dependent cholesterol transport
plaindirectn = 30- Asserted: passes — The authors put it forward as true.
- Checkable: passes — It can be checked against evidence.
- Load-bearing: passes — The paper’s conclusions depend on it.
- Based: passes — The paper gives a reason why it holds.
- Rests on an assumption: The mCherry-D4H protein specifically binds accessible PM cholesterol.
A result the paper reports from its own data — it cites no other source for it, so there is none to check. The quote shows it is in the paper.
In the paper
“Re‐expression of EGFP‐GRAMD1b in TKO cells robustly suppressed SREBP‐2 cleavage, thereby rescuing the phenotype (Fig 5E).”
§ Molecular basis of accessible plasma membrane cholesterol recognition by the GRAM domain of GRAMD1b > Results > Cholesterol‐sensing property of the GRAM domain is critical for GRAMD1b function
boosteddirect- Asserted: passes — The authors put it forward as true.
- Checkable: passes — It can be checked against evidence.
- Load-bearing: passes — The paper’s conclusions depend on it.
- Based: passes — The paper gives a reason why it holds.
A result the paper reports from its own data — it cites no other source for it, so there is none to check. The quote shows it is in the paper.
In the paper
“Importantly, the additional treatment of GRAMD1 TKO cells with methyl‐β‐cyclodextrin, which extracts cholesterol from cellular membranes, resulted in acute loss of EGFP‐GRAM1b–G187L from the PM within 2 min (Fig EV4B)”
§ Molecular basis of accessible plasma membrane cholesterol recognition by the GRAM domain of GRAMD1b > Results > Identification of a novel GRAM domain mutation in GRAMD1b (G187L) that enhances its ability to sense accessible PM cholesterol
boosteddirect- Asserted: passes — The authors put it forward as true.
- Checkable: passes — It can be checked against evidence.
- Load-bearing: passes — The paper’s conclusions depend on it.
- Based: passes — The paper gives a reason why it holds.
A result the paper reports from its own data — it cites no other source for it, so there is none to check. The quote shows it is in the paper.
In the paper
“Importantly, the G187L mutant retained its selectivity for accessible cholesterol.”
§ Molecular basis of accessible plasma membrane cholesterol recognition by the GRAM domain of GRAMD1b > Discussion
plain- Asserted: passes — The authors put it forward as true.
- Checkable: passes — It can be checked against evidence.
- Load-bearing: passes — The paper’s conclusions depend on it.
- Based: passes — The paper gives a reason why it holds.
A result the paper reports from its own data — it cites no other source for it, so there is none to check. The quote shows it is in the paper.
In the paper
“Suppression of SREBP‐2 cleavage was observed in control cell lysates; however, this suppression was significantly attenuated (but not completely eliminated) in GRAMD1 TKO cells.”
§ Molecular basis of accessible plasma membrane cholesterol recognition by the GRAM domain of GRAMD1b > Results > Cholesterol‐sensing property of the GRAM domain is critical for GRAMD1b function
plaindirect- Asserted: passes — The authors put it forward as true.
- Checkable: passes — It can be checked against evidence.
- Load-bearing: passes — The paper’s conclusions depend on it.
- Based: passes — The paper gives a reason why it holds.
A result the paper reports from its own data — it cites no other source for it, so there is none to check. The quote shows it is in the paper.
In the paper
“PM recruitment of EGFP‐GRAM1b–G187L was further enhanced in both control and GRAMD1 TKO HeLa cells after sphingomyelinase treatment (Fig 6D and E).”
§ Molecular basis of accessible plasma membrane cholesterol recognition by the GRAM domain of GRAMD1b > Results > Identification of a novel GRAM domain mutation in GRAMD1b (G187L) that enhances its ability to sense accessible PM cholesterol
plaindirect- Asserted: passes — The authors put it forward as true.
- Checkable: passes — It can be checked against evidence.
- Load-bearing: passes — The paper’s conclusions depend on it.
- Based: passes — The paper gives a reason why it holds.
- Rests on an assumption: The modeled structure of the GRAM domain of GRAMD1b accurately represents the three-dimensional arrangement of the residues.
A result the paper reports from its own data — it cites no other source for it, so there is none to check. The quote shows it is in the paper.
In the paper
“In contrast, mutant versions of EGFP‐GRAMD1b (R189W and R189W/R191A) were recruited less efficiently to the PM”
§ Molecular basis of accessible plasma membrane cholesterol recognition by the GRAM domain of GRAMD1b > Results > Cholesterol‐sensing property of the GRAM domain is critical for GRAMD1b function
plaindirect- Asserted: passes — The authors put it forward as true.
- Checkable: passes — It can be checked against evidence.
- Load-bearing: passes — The paper’s conclusions depend on it.
- Based: passes — The paper gives a reason why it holds.
A result the paper reports from its own data — it cites no other source for it, so there is none to check. The quote shows it is in the paper.
In the paper
“EGFP‐GRAMD1b–G187L was more strongly recruited to ER‐PM contacts compared to EGFP‐GRAMD1b–WT following cholesterol loading, consistent with the critical role of G187 in determining sensitivity of the GRAM domain to accessible PM cholesterol and in promoting tethering of the ER to the PM (Fig EV5G, Movie EV4).”
§ Molecular basis of accessible plasma membrane cholesterol recognition by the GRAM domain of GRAMD1b > Results > G187 is critical for determining the sensitivity of the GRAM domain to accessible PM cholesterol and regulating GRAMD1b‐dependent cholesterol transport
plaincorrelational- Asserted: passes — The authors put it forward as true.
- Checkable: passes — It can be checked against evidence.
- Load-bearing: passes — The paper’s conclusions depend on it.
- Based: passes — The paper gives a reason why it holds.
A result the paper reports from its own data — it cites no other source for it, so there is none to check. The quote shows it is in the paper.
In the paper
“Strikingly, EGFP‐GRAM1b–G187L exhibited enhanced PM recruitment compared to EGFP‐GRAM1b in GRAMD1 TKO cells (Fig 6B–D).”
§ Molecular basis of accessible plasma membrane cholesterol recognition by the GRAM domain of GRAMD1b > Results > Identification of a novel GRAM domain mutation in GRAMD1b (G187L) that enhances its ability to sense accessible PM cholesterol
plaindirect- Asserted: passes — The authors put it forward as true.
- Checkable: passes — It can be checked against evidence.
- Load-bearing: passes — The paper’s conclusions depend on it.
- Based: passes — The paper gives a reason why it holds.
- Rests on an assumption: The modeled structure of the GRAM domain of GRAMD1b accurately represents the three-dimensional arrangement of the residues.
A result the paper reports from its own data — it cites no other source for it, so there is none to check. The quote shows it is in the paper.
In the paper
“Strikingly, the binding curve of GRAM1b–G187L was shifted toward lower cholesterol concentrations compared to that of GRAM1b in both conditions (Fig 6H).”
§ Molecular basis of accessible plasma membrane cholesterol recognition by the GRAM domain of GRAMD1b > Results > Identification of a novel GRAM domain mutation in GRAMD1b (G187L) that enhances its ability to sense accessible PM cholesterol
plaincorrelational- Asserted: passes — The authors put it forward as true.
- Checkable: passes — It can be checked against evidence.
- Load-bearing: passes — The paper’s conclusions depend on it.
- Based: passes — The paper gives a reason why it holds.
A result the paper reports from its own data — it cites no other source for it, so there is none to check. The quote shows it is in the paper.
In the paper
“The binding of both GRAM1b–G187L and GRAM1b was significantly increased as the ordering tendency of PC was lowered (i.e., as the cholesterol sequestration effect was reduced) (Figs 6H and EV4F and G).”
§ Molecular basis of accessible plasma membrane cholesterol recognition by the GRAM domain of GRAMD1b > Results > The G187L mutation increases sensitivity of the GRAM domain to cholesterol without altering its affinity for PS
plaindirect- Asserted: passes — The authors put it forward as true.
- Checkable: passes — It can be checked against evidence.
- Load-bearing: passes — The paper’s conclusions depend on it.
- Based: passes — The paper gives a reason why it holds.
A result the paper reports from its own data — it cites no other source for it, so there is none to check. The quote shows it is in the paper.
In the paper
“Both of them interacted equally robustly to ER‐like liposomes compared to GRAMD1b–WT (Appendix Fig S3E).”
§ Molecular basis of accessible plasma membrane cholesterol recognition by the GRAM domain of GRAMD1b > Results > Mutant versions of GRAMD1b that cannot sense cholesterol exhibit impairment in membrane tethering and cholesterol transport
plain- Asserted: passes — The authors put it forward as true.
- Checkable: passes — It can be checked against evidence.
- Load-bearing: passes — The paper’s conclusions depend on it.
- Based: passes — The paper gives a reason why it holds.
- Rests on an assumption: The PM-like and ER-like liposomes used in the in vitro transport assay mimic the lipid composition and properties of the plasma membrane and endoplasmic reticulum.
A result the paper reports from its own data — it cites no other source for it, so there is none to check. The quote shows it is in the paper.
In the paper
“We found that GRAMD1 TKO cells pre‐treated with sphingomyelinase for 3 h were more efficiently killed by Amphotericin B compared to WT cells subjected to the same treatment (Fig 5F).”
§ Molecular basis of accessible plasma membrane cholesterol recognition by the GRAM domain of GRAMD1b > Results > Cholesterol‐sensing property of the GRAM domain is critical for GRAMD1b function
plaincorrelational- Asserted: passes — The authors put it forward as true.
- Checkable: passes — It can be checked against evidence.
- Load-bearing: passes — The paper’s conclusions depend on it.
- Based: passes — The paper gives a reason why it holds.
A result the paper reports from its own data — it cites no other source for it, so there is none to check. The quote shows it is in the paper.
In the paper
“In contrast, expression of EGFP‐GRAMD1b–R189W failed to reduce the binding of mCherry‐D4H to the PM (Fig 7D and E).”
§ Molecular basis of accessible plasma membrane cholesterol recognition by the GRAM domain of GRAMD1b > Results > G187 is critical for determining the sensitivity of the GRAM domain to accessible PM cholesterol and regulating GRAMD1b‐dependent cholesterol transport
plain- Asserted: passes — The authors put it forward as true.
- Checkable: passes — It can be checked against evidence.
- Load-bearing: passes — The paper’s conclusions depend on it.
- Based: passes — The paper gives a reason why it holds.
A result the paper reports from its own data — it cites no other source for it, so there is none to check. The quote shows it is in the paper.
In the paper
“This resulted in an almost complete loss of EGFP‐GRAM1b–G187L from the PM, confirming the specificity of GRAM1b–G187L to accessible cholesterol (Figs 6F and EV4C).”
§ Molecular basis of accessible plasma membrane cholesterol recognition by the GRAM domain of GRAMD1b > Results > Identification of a novel GRAM domain mutation in GRAMD1b (G187L) that enhances its ability to sense accessible PM cholesterol
boosteddirect- Asserted: passes — The authors put it forward as true.
- Checkable: passes — It can be checked against evidence.
- Load-bearing: passes — The paper’s conclusions depend on it.
- Based: passes — The paper gives a reason why it holds.
The paper states this without a source or data behind it here, so there is nothing to check it against. The quote shows it is in the paper.
In the paper
“Importantly, this codistribution is less pronounced in the presence of sphingomyelin”
§ Molecular basis of accessible plasma membrane cholesterol recognition by the GRAM domain of GRAMD1b > Discussion
plaindirect- Asserted: passes — The authors put it forward as true.
- Checkable: passes — It can be checked against evidence.
- Load-bearing: passes — The paper’s conclusions depend on it.
- Based: passes — The paper gives a reason why it holds.
A result the paper reports from its own data — it cites no other source for it, so there is none to check. The quote shows it is in the paper.
In the paper
“Consistent with the progressive tethering of PM‐like and ER‐like liposomes, the addition of GRAMD1b–WT, but not GRAMD1b–R189W or GRAMD1b–R189W/R191A, resulted in robust DHE transfer from PM‐like to ER‐like liposomes over time in a concentration‐dependent manner (~1.2 DHE molecules per min) (Fig 4C and Appendix Fig S2E and F).”
§ Molecular basis of accessible plasma membrane cholesterol recognition by the GRAM domain of GRAMD1b > Results > Mutant versions of GRAMD1b that cannot sense cholesterol exhibit impairment in membrane tethering and cholesterol transport
plaindirect- Asserted: passes — The authors put it forward as true.
- Checkable: passes — It can be checked against evidence.
- Load-bearing: passes — The paper’s conclusions depend on it.
- Based: passes — The paper gives a reason why it holds.
- Rests on an assumption: The PM-like and ER-like liposomes used in the in vitro transport assay mimic the lipid composition and properties of the plasma membrane and endoplasmic reticulum.
A result the paper reports from its own data — it cites no other source for it, so there is none to check. The quote shows it is in the paper.
In the paper
“Addition of GRAMD1b–G187L resulted in much stronger tethering, as judged by optical turbidity, compared to the addition of near full‐length GRAMD1b–WT (Fig 7B).”
§ Molecular basis of accessible plasma membrane cholesterol recognition by the GRAM domain of GRAMD1b > Results > G187 is critical for determining the sensitivity of the GRAM domain to accessible PM cholesterol and regulating GRAMD1b‐dependent cholesterol transport
boosteddirect- Asserted: passes — The authors put it forward as true.
- Checkable: passes — It can be checked against evidence.
- Load-bearing: passes — The paper’s conclusions depend on it.
- Based: passes — The paper gives a reason why it holds.
A result the paper reports from its own data — it cites no other source for it, so there is none to check. The quote shows it is in the paper.
In the paper
“Efficient PM recruitment of GRAM1b requires the presence of both PS and accessible cholesterol”
§ Molecular basis of accessible plasma membrane cholesterol recognition by the GRAM domain of GRAMD1b > Discussion
plaindirect- Asserted: passes — The authors put it forward as true.
- Checkable: passes — It can be checked against evidence.
- Load-bearing: passes — The paper’s conclusions depend on it.
- Based: passes — The paper gives a reason why it holds.
A result the paper reports from its own data — it cites no other source for it, so there is none to check. The quote shows it is in the paper.
In the paper
“While wild‐type GRAM domains are recruited to the PM only after transient expansion of the accessible pool of PM cholesterol (induced by sphingomyelin hydrolysis)”
§ Molecular basis of accessible plasma membrane cholesterol recognition by the GRAM domain of GRAMD1b > Discussion
plaindirect- Asserted: passes — The authors put it forward as true.
- Checkable: passes — It can be checked against evidence.
- Load-bearing: passes — The paper’s conclusions depend on it.
- Based: passes — The paper gives a reason why it holds.
The paper states this without a source or data behind it here, so there is nothing to check it against. The quote shows it is in the paper.
In the paper
“Further, GRAM1b–R189W interacts much less with the PM, even after expansion of the accessible pool of cholesterol in this bilayer.”
§ Molecular basis of accessible plasma membrane cholesterol recognition by the GRAM domain of GRAMD1b > Discussion
plain- Asserted: passes — The authors put it forward as true.
- Checkable: passes — It can be checked against evidence.
- Load-bearing: passes — The paper’s conclusions depend on it.
- Based: passes — The paper gives a reason why it holds.
A result the paper reports from its own data — it cites no other source for it, so there is none to check. The quote shows it is in the paper.
In the paper
“Consistent with the enhanced tethering, addition of GRAMD1b–G187L resulted in more efficient DHE transfer from PM‐like to ER‐like liposomes over time in a concentration‐dependent manner (~3.6 DHE molecules per min by GRAMD1b–G187L versus ~1.2 DHE molecules per min by GRAMD1b versus ~0 DHE molecules per min by GRAMD1b–R189W/R191A) (Figs 7C and EV5C and D).”
§ Molecular basis of accessible plasma membrane cholesterol recognition by the GRAM domain of GRAMD1b > Results > G187 is critical for determining the sensitivity of the GRAM domain to accessible PM cholesterol and regulating GRAMD1b‐dependent cholesterol transport
plaindirect- Asserted: passes — The authors put it forward as true.
- Checkable: passes — It can be checked against evidence.
- Load-bearing: passes — The paper’s conclusions depend on it.
- Based: passes — The paper gives a reason why it holds.
- Rests on an assumption: The rate of DHE transfer between liposomes reflects the rate of cholesterol transfer by GRAMD1b.
A result the paper reports from its own data — it cites no other source for it, so there is none to check. The quote shows it is in the paper.
In the paper
“mCherry‐GRAM1b was less recruited to the PM in GRAMD1 TKO cells that stably expressed EGFP‐GRAMD1b–G187L compared to GRAMD1 TKO cells that stably expressed EGFP‐GRAMD1b–WT (Appendix Fig S5B)”
§ Molecular basis of accessible plasma membrane cholesterol recognition by the GRAM domain of GRAMD1b > Results > G187 is critical for determining the sensitivity of the GRAM domain to accessible PM cholesterol and regulating GRAMD1b‐dependent cholesterol transport
plaincorrelational- Asserted: passes — The authors put it forward as true.
- Checkable: passes — It can be checked against evidence.
- Load-bearing: passes — The paper’s conclusions depend on it.
- Based: passes — The paper gives a reason why it holds.
A result the paper reports from its own data — it cites no other source for it, so there is none to check. The quote shows it is in the paper.
In the paper
“Robust PM recruitment of EGFP‐GRAMD1b was observed within 20 min of cholesterol loading (Fig EV3A, Movie EV2).”
§ Molecular basis of accessible plasma membrane cholesterol recognition by the GRAM domain of GRAMD1b > Results > Cholesterol‐sensing property of the GRAM domain is critical for GRAMD1b function
plaindirect- Asserted: passes — The authors put it forward as true.
- Checkable: passes — It can be checked against evidence.
- Load-bearing: passes — The paper’s conclusions depend on it.
- Based: passes — The paper gives a reason why it holds.
A result the paper reports from its own data — it cites no other source for it, so there is none to check. The quote shows it is in the paper.
In the paper
“Using a mutagenesis approach, we found that GRAM1b possesses distinct, but closely apposed sites that synergistically sense anionic lipids, including PS, and accessible cholesterol.”
§ Molecular basis of accessible plasma membrane cholesterol recognition by the GRAM domain of GRAMD1b > Discussion
plaindirect- Asserted: passes — The authors put it forward as true.
- Checkable: passes — It can be checked against evidence.
- Load-bearing: passes — The paper’s conclusions depend on it.
- Based: passes — The paper gives a reason why it holds.
A result the paper reports from its own data — it cites no other source for it, so there is none to check. The quote shows it is in the paper.
In the paper
“Consistent with the results from SDC microscopy, more EGFP‐GRAM1b–G187L was bound to the PM at rest compared to EGFP‐GRAM1b (Fig EV4B; compare with Fig 6D and E).”
§ Molecular basis of accessible plasma membrane cholesterol recognition by the GRAM domain of GRAMD1b > Results > Identification of a novel GRAM domain mutation in GRAMD1b (G187L) that enhances its ability to sense accessible PM cholesterol
plaincorrelational- Asserted: passes — The authors put it forward as true.
- Checkable: passes — It can be checked against evidence.
- Load-bearing: passes — The paper’s conclusions depend on it.
- Based: passes — The paper gives a reason why it holds.
A result the paper reports from its own data — it cites no other source for it, so there is none to check. The quote shows it is in the paper.
In the paper
“PM recruitment was mostly enhanced when G187 was replaced by more hydrophobic residues.”
§ Molecular basis of accessible plasma membrane cholesterol recognition by the GRAM domain of GRAMD1b > Results > G187 is critical for determining the sensitivity of the GRAM domain to accessible PM cholesterol and regulating GRAMD1b‐dependent cholesterol transport
plaindirect- Asserted: passes — The authors put it forward as true.
- Checkable: passes — It can be checked against evidence.
- Load-bearing: passes — The paper’s conclusions depend on it.
- Based: passes — The paper gives a reason why it holds.
- Rests on an assumption: The modeled structure of the GRAM domain of GRAMD1b accurately represents the three-dimensional arrangement of the residues.
A result the paper reports from its own data — it cites no other source for it, so there is none to check. The quote shows it is in the paper.
In the paper
“Sphingomyelinase treatment induced even stronger recruitment of EGFP‐GRAM1b–G187L to the PM over the entire 1‐h imaging session compared to EGFP‐GRAM1b (Fig EV4B).”
§ Molecular basis of accessible plasma membrane cholesterol recognition by the GRAM domain of GRAMD1b > Results > Identification of a novel GRAM domain mutation in GRAMD1b (G187L) that enhances its ability to sense accessible PM cholesterol
boosteddirect- Asserted: passes — The authors put it forward as true.
- Checkable: passes — It can be checked against evidence.
- Load-bearing: passes — The paper’s conclusions depend on it.
- Based: passes — The paper gives a reason why it holds.
None of the sources cited for this claim have been checked yet.
In the paper
“Addition of sphingomyelin into the membranes downregulated the codistribution of accessible cholesterol and PS”
§ Molecular basis of accessible plasma membrane cholesterol recognition by the GRAM domain of GRAMD1b > Discussion
plaindirect- Asserted: passes — The authors put it forward as true.
- Checkable: passes — It can be checked against evidence.
- Load-bearing: passes — The paper’s conclusions depend on it.
- Based: passes — The paper gives a reason why it holds.
A result the paper reports from its own data — it cites no other source for it, so there is none to check. The quote shows it is in the paper.
In the paper
“Converting a single amino acid within GRAM1b (G187) to another amino acid either increased or decreased its sensitivity for accessible PM cholesterol, depending on its hydrophobicity (Fig 7A).”
§ Molecular basis of accessible plasma membrane cholesterol recognition by the GRAM domain of GRAMD1b > Discussion
plaindirect- Asserted: passes — The authors put it forward as true.
- Checkable: passes — It can be checked against evidence.
- Load-bearing: passes — The paper’s conclusions depend on it.
- Based: passes — The paper gives a reason why it holds.
A result the paper reports from its own data — it cites no other source for it, so there is none to check. The quote shows it is in the paper.
In the paper
“mCherry‐D4H bound significantly less to the PM by expressing EGFP‐GRAMD1b–WT”
§ Molecular basis of accessible plasma membrane cholesterol recognition by the GRAM domain of GRAMD1b > Results > G187 is critical for determining the sensitivity of the GRAM domain to accessible PM cholesterol and regulating GRAMD1b‐dependent cholesterol transport
plaindirect- Asserted: passes — The authors put it forward as true.
- Checkable: passes — It can be checked against evidence.
- Load-bearing: passes — The paper’s conclusions depend on it.
- Based: passes — The paper gives a reason why it holds.
A result the paper reports from its own data — it cites no other source for it, so there is none to check. The quote shows it is in the paper.
In the paper
“Note that expression of EGFP‐GRAMD1b–WT, but not EGFP‐GRAMD1b–R189W, reduced binding of mCherry‐D4H to the PM, in GRAMD1 TKO HeLa cells.”
§ Molecular basis of accessible plasma membrane cholesterol recognition by the GRAM domain of GRAMD1b > Results > G187 is critical for determining the sensitivity of the GRAM domain to accessible PM cholesterol and regulating GRAMD1b‐dependent cholesterol transport
plaindirect- Asserted: passes — The authors put it forward as true.
- Checkable: passes — It can be checked against evidence.
- Load-bearing: passes — The paper’s conclusions depend on it.
- Based: passes — The paper gives a reason why it holds.
- Rests on an assumption: The mCherry-D4H protein specifically binds accessible PM cholesterol.
A result the paper reports from its own data — it cites no other source for it, so there is none to check. The quote shows it is in the paper.
In the paper
“Robust suppression of SREBP‐2 cleavage over time was observed in both conditions (Appendix Fig S5A).”
§ Molecular basis of accessible plasma membrane cholesterol recognition by the GRAM domain of GRAMD1b > Results > G187 is critical for determining the sensitivity of the GRAM domain to accessible PM cholesterol and regulating GRAMD1b‐dependent cholesterol transport
boosteddirect- Asserted: passes — The authors put it forward as true.
- Checkable: passes — It can be checked against evidence.
- Load-bearing: passes — The paper’s conclusions depend on it.
- Based: passes — The paper gives a reason why it holds.
A result the paper reports from its own data — it cites no other source for it, so there is none to check. The quote shows it is in the paper.
In the paper
“GRAM1b bound 0, 0, and ~60% to POPC‐containing, DOPC‐containing, and DPhyPC‐containing liposomes, respectively, when they contained 30% cholesterol.”
§ Molecular basis of accessible plasma membrane cholesterol recognition by the GRAM domain of GRAMD1b > Results > The G187L mutation increases sensitivity of the GRAM domain to cholesterol without altering its affinity for PS
plain- Asserted: passes — The authors put it forward as true.
- Checkable: passes — It can be checked against evidence.
- Load-bearing: passes — The paper’s conclusions depend on it.
- Based: passes — The paper gives a reason why it holds.
A result the paper reports from its own data — it cites no other source for it, so there is none to check. The quote shows it is in the paper.
In the paper
“Both GRAMD1b‐WT and GRAMD1b‐G187L bound equally robustly to ER‐like liposomes (Fig EV5E).”
§ Molecular basis of accessible plasma membrane cholesterol recognition by the GRAM domain of GRAMD1b > Results > G187 is critical for determining the sensitivity of the GRAM domain to accessible PM cholesterol and regulating GRAMD1b‐dependent cholesterol transport
plain- Asserted: passes — The authors put it forward as true.
- Checkable: passes — It can be checked against evidence.
- Load-bearing: passes — The paper’s conclusions depend on it.
- Based: passes — The paper gives a reason why it holds.
The paper states this without a source or data behind it here, so there is nothing to check it against. The quote shows it is in the paper.
In the paper
“Accordingly, a version of GRAMD1b with this mutation was unable to rescue cholesterol transport defects in cells lacking GRAMD1s.”
§ Molecular basis of accessible plasma membrane cholesterol recognition by the GRAM domain of GRAMD1b > Discussion
plain- Asserted: passes — The authors put it forward as true.
- Checkable: passes — It can be checked against evidence.
- Load-bearing: passes — The paper’s conclusions depend on it.
- Based: passes — The paper gives a reason why it holds.
A result the paper reports from its own data — it cites no other source for it, so there is none to check. The quote shows it is in the paper.
In the paper
“Using a cell‐free reconstitution approach, we showed that the ability of GRAM1b to bind accessible cholesterol fine‐tuned both membrane tethering and cholesterol transport functions of GRAMD1b.”
§ Molecular basis of accessible plasma membrane cholesterol recognition by the GRAM domain of GRAMD1b > Discussion
boosteddirect- Asserted: passes — The authors put it forward as true.
- Checkable: passes — It can be checked against evidence.
- Load-bearing: passes — The paper’s conclusions depend on it.
- Based: passes — The paper gives a reason why it holds.
A conclusion the paper draws from its own results — it cites no other source for it, so there is none to check. The quote shows it is in the paper.
In the paper
“Taken together, our results reveal the presence of distinct recognition sites for anionic lipids and cholesterol within GRAM1b.”
§ Molecular basis of accessible plasma membrane cholesterol recognition by the GRAM domain of GRAMD1b > Results > A GRAMD1b mutation (R189W) associated with intellectual disability specifically impairs binding of the GRAM domain to cholesterol
plain- Asserted: passes — The authors put it forward as true.
- Checkable: passes — It can be checked against evidence.
- Load-bearing: passes — The paper’s conclusions depend on it.
- Based: passes — The paper gives a reason why it holds.
A conclusion the paper draws from its own results — it cites no other source for it, so there is none to check. The quote shows it is in the paper.
In the paper
“Thus, cells detect the codistribution of accessible cholesterol and anionic lipids in the PM and fine‐tune the non‐vesicular transport of PM cholesterol to the ER via GRAMD1s.”
- Also stated in: § Introduction · boosted
“Collectively, our results demonstrate that cells monitor the extent to which accessible cholesterol and anionic lipids are codistributed within the inner leaflet of the PM via the GRAM domain of GRAMD1s and use this information to fine‐tune the extraction and transport of accessible PM cholesterol to the ER via GRAMD1s.”
§ Molecular basis of accessible plasma membrane cholesterol recognition by the GRAM domain of GRAMD1b > Abstract
boosteddirect- Asserted: passes — The authors put it forward as true.
- Checkable: passes — It can be checked against evidence.
- Load-bearing: passes — The paper’s conclusions depend on it.
- Based: passes — The paper gives a reason why it holds.
- Also stated in: § Introduction · boosted
In the paper
“Importantly, the GRAM domain of GRAMD1s acts as a unique coincidence detector, detecting the presence of both accessible cholesterol and anionic lipids (Naito et al, 2019)”
§ Molecular basis of accessible plasma membrane cholesterol recognition by the GRAM domain of GRAMD1b > Introduction
What the sources say
- Not checked yetcites Naito et al, 2019 source
boosteddirect- Asserted: passes — The authors put it forward as true.
- Checkable: passes — It can be checked against evidence.
- Load-bearing: passes — The paper’s conclusions depend on it.
- Based: passes — The paper gives a reason why it holds.
A conclusion the paper draws from its own results — it cites no other source for it, so there is none to check. The quote shows it is in the paper.
In the paper
“These results are consistent with the codistribution of accessible cholesterol and PS in membranes.”
§ Molecular basis of accessible plasma membrane cholesterol recognition by the GRAM domain of GRAMD1b > Results > The GRAM domain of GRAMD1b detects the codistribution of accessible cholesterol and PS, which is regulated by sphingomyelin
plaincorrelational- Asserted: passes — The authors put it forward as true.
- Checkable: passes — It can be checked against evidence.
- Load-bearing: passes — The paper’s conclusions depend on it.
- Based: passes — The paper gives a reason why it holds.
A conclusion the paper draws from its own results — it cites no other source for it, so there is none to check. The quote shows it is in the paper.
In the paper
“This indicates a critical role of the R189 residue in the coincidence detection of cholesterol and anionic lipids, including PS, in membranes (Fig 3D).”
§ Molecular basis of accessible plasma membrane cholesterol recognition by the GRAM domain of GRAMD1b > Results > A GRAMD1b mutation (R189W) associated with intellectual disability specifically impairs binding of the GRAM domain to cholesterol
hedgeddirect- Asserted: passes — The authors put it forward as true.
- Checkable: passes — It can be checked against evidence.
- Load-bearing: passes — The paper’s conclusions depend on it.
- Based: passes — The paper gives a reason why it holds.
A conclusion the paper draws from its own results — it cites no other source for it, so there is none to check. The quote shows it is in the paper.
In the paper
“These results support a general role for the basic patch in anionic lipid sensing primarily through electrostatic interaction (Fig 2E).”
§ Molecular basis of accessible plasma membrane cholesterol recognition by the GRAM domain of GRAMD1b > Results > A basic patch within the GRAM domain of GRAMD1b is critical for anionic lipid recognition
plaindirect- Asserted: passes — The authors put it forward as true.
- Checkable: passes — It can be checked against evidence.
- Load-bearing: passes — The paper’s conclusions depend on it.
- Based: passes — The paper gives a reason why it holds.
In the paper
“Notably, a missense mutation in the GRAM domain of GRAMD1b (R189W) was identified in a consanguineous family with moderate intellectual disability, indicating the importance of the GRAM domain in GRAMD1b function (Reuter et al, 2017).”
- Also stated in: § Abstract · plain
“a mutation within the GRAM domain of GRAMD1b that is associated with intellectual disability in humans”
§ Molecular basis of accessible plasma membrane cholesterol recognition by the GRAM domain of GRAMD1b > Introduction
What the sources say
- Not checked — no full text of the sourcecites Reuter et al, 2017 source
plaincorrelationalSingle case- Asserted: passes — The authors put it forward as true.
- Checkable: passes — It can be checked against evidence.
- Load-bearing: passes — The paper’s conclusions depend on it.
- Based: passes — The paper gives a reason why it holds.
- Also stated in: § Abstract · plain
A conclusion the paper draws from its own results — it cites no other source for it, so there is none to check. The quote shows it is in the paper.
In the paper
“This demonstrates the important role of the basic patch of GRAM1b in detecting the codistribution of PS and cholesterol within membranes.”
§ Molecular basis of accessible plasma membrane cholesterol recognition by the GRAM domain of GRAMD1b > Results > A basic patch within the GRAM domain of GRAMD1b is critical for anionic lipid recognition
boosteddirect- Asserted: passes — The authors put it forward as true.
- Checkable: passes — It can be checked against evidence.
- Load-bearing: passes — The paper’s conclusions depend on it.
- Based: passes — The paper gives a reason why it holds.
In the paper
“One of these mutations is R189W, which was identified in a consanguineous family with intellectual disability (Reuter et al, 2017).”
§ Molecular basis of accessible plasma membrane cholesterol recognition by the GRAM domain of GRAMD1b > Results > A GRAMD1b mutation (R189W) associated with intellectual disability specifically impairs binding of the GRAM domain to cholesterol
What the sources say
- Not checked — no full text of the sourcecites Reuter et al, 2017 source
plaincorrelationalSingle case- Asserted: passes — The authors put it forward as true.
- Checkable: passes — It can be checked against evidence.
- Load-bearing: passes — The paper’s conclusions depend on it.
- Based: passes — The paper gives a reason why it holds.
In the paper
“However, a small fraction of PM cholesterol (~15% of PM lipids) remains unsequestered and accessible for extraction and transport (also known as “chemically active”) (Das et al, 2014).”
§ Molecular basis of accessible plasma membrane cholesterol recognition by the GRAM domain of GRAMD1b > Introduction
What the sources say
- Not matchedcites Das et al, 2014
Couldn’t be matched to a paper in Crossref, so it can’t be checked.
plain- Asserted: passes — The authors put it forward as true.
- Checkable: passes — It can be checked against evidence.
- Load-bearing: passes — The paper’s conclusions depend on it.
- Based: passes — The paper gives a reason why it holds.
- Not matched
A conclusion the paper draws from its own results — it cites no other source for it, so there is none to check. The quote shows it is in the paper.
In the paper
“Thus, despite being enriched in the outer leaflet of the PM, sphingomyelin contributes significantly to suppressing the accessibility of cholesterol in the inner leaflet of the PM at steady state.”
§ Molecular basis of accessible plasma membrane cholesterol recognition by the GRAM domain of GRAMD1b > Results > The GRAM domain of GRAMD1b detects the codistribution of accessible cholesterol and PS, which is regulated by sphingomyelin
plaindirect- Asserted: passes — The authors put it forward as true.
- Checkable: passes — It can be checked against evidence.
- Load-bearing: passes — The paper’s conclusions depend on it.
- Based: passes — The paper gives a reason why it holds.
A conclusion the paper draws from its own results — it cites no other source for it, so there is none to check. The quote shows it is in the paper.
In the paper
“indicating that the efficient binding of GRAM1b to the PM requires both accessible PM cholesterol and PS as coligands.”
§ Molecular basis of accessible plasma membrane cholesterol recognition by the GRAM domain of GRAMD1b > Results > The GRAM domain of GRAMD1b detects the codistribution of accessible cholesterol and PS, which is regulated by sphingomyelin
hedgeddirect- Asserted: passes — The authors put it forward as true.
- Checkable: passes — It can be checked against evidence.
- Load-bearing: passes — The paper’s conclusions depend on it.
- Based: passes — The paper gives a reason why it holds.
A conclusion the paper draws from its own results — it cites no other source for it, so there is none to check. The quote shows it is in the paper.
In the paper
“The moderate effect of mCherry‐Lact‐C2 overexpression suggests that the binding of GRAM1b to the PM may additionally depend on other anionic lipids within this bilayer.”
§ Molecular basis of accessible plasma membrane cholesterol recognition by the GRAM domain of GRAMD1b > Results > The GRAM domain of GRAMD1b detects the codistribution of accessible cholesterol and PS, which is regulated by sphingomyelin
hedgedconditional- Asserted: passes — The authors put it forward as true.
- Checkable: passes — It can be checked against evidence.
- Load-bearing: unclear — It is unclear whether the paper’s conclusions depend on it.
- Based: passes — The paper gives a reason why it holds.
A conclusion the paper draws from its own results — it cites no other source for it, so there is none to check. The quote shows it is in the paper.
In the paper
“Thus, these results indicate the presence of another dedicated site for detecting accessible cholesterol that may act independently from the basic patch.”
§ Molecular basis of accessible plasma membrane cholesterol recognition by the GRAM domain of GRAMD1b > Results > A basic patch within the GRAM domain of GRAMD1b is critical for anionic lipid recognition
hedgedconditional- Asserted: passes — The authors put it forward as true.
- Checkable: passes — It can be checked against evidence.
- Load-bearing: passes — The paper’s conclusions depend on it.
- Based: passes — The paper gives a reason why it holds.
A conclusion the paper draws from its own results — it cites no other source for it, so there is none to check. The quote shows it is in the paper.
In the paper
“As major defects in the ability of mutant GRAM1b (e.g. basic patch mutants) to sense anionic lipids did not alter their ability to sense cholesterol, GRAM1b likely possesses distinct sites for recognizing anionic lipids and cholesterol.”
§ Molecular basis of accessible plasma membrane cholesterol recognition by the GRAM domain of GRAMD1b > Results > A basic patch within the GRAM domain of GRAMD1b is critical for anionic lipid recognition
hedgedcorrelational- Asserted: passes — The authors put it forward as true.
- Checkable: passes — It can be checked against evidence.
- Load-bearing: passes — The paper’s conclusions depend on it.
- Based: passes — The paper gives a reason why it holds.
A conclusion the paper draws from its own results — it cites no other source for it, so there is none to check. The quote shows it is in the paper.
In the paper
“and suggest that the GRAM domain plays a critical role in regulating GRAMD1‐mediated transport of accessible cholesterol.”
§ Molecular basis of accessible plasma membrane cholesterol recognition by the GRAM domain of GRAMD1b > Results > Both cholesterol‐ and anionic lipid‐sensing properties are required for the GRAM domain of GRAMD1b to sense expansions of the accessible pool of PM cholesterol
hedgeddirect- Asserted: passes — The authors put it forward as true.
- Checkable: passes — It can be checked against evidence.
- Load-bearing: passes — The paper’s conclusions depend on it.
- Based: passes — The paper gives a reason why it holds.
A conclusion the paper draws from its own results — it cites no other source for it, so there is none to check. The quote shows it is in the paper.
In the paper
“These results demonstrate the importance of both cholesterol‐sensing and anionic lipid‐sensing properties in the ability of GRAM1b to detect expansions of the accessible pool of PM cholesterol”
§ Molecular basis of accessible plasma membrane cholesterol recognition by the GRAM domain of GRAMD1b > Results > Both cholesterol‐ and anionic lipid‐sensing properties are required for the GRAM domain of GRAMD1b to sense expansions of the accessible pool of PM cholesterol
boosteddirect- Asserted: passes — The authors put it forward as true.
- Checkable: passes — It can be checked against evidence.
- Load-bearing: passes — The paper’s conclusions depend on it.
- Based: passes — The paper gives a reason why it holds.
A conclusion the paper draws from its own results — it cites no other source for it, so there is none to check. The quote shows it is in the paper.
In the paper
“thereby suggesting that cholesterol‐sensing and anionic lipid‐sensing properties of the GRAM domain act independently (Fig 3D and E).”
§ Molecular basis of accessible plasma membrane cholesterol recognition by the GRAM domain of GRAMD1b > Results > A GRAMD1b mutation (R189W) associated with intellectual disability specifically impairs binding of the GRAM domain to cholesterol
hedged- Asserted: passes — The authors put it forward as true.
- Checkable: passes — It can be checked against evidence.
- Load-bearing: passes — The paper’s conclusions depend on it.
- Based: passes — The paper gives a reason why it holds.
A conclusion the paper draws from its own results — it cites no other source for it, so there is none to check. The quote shows it is in the paper.
In the paper
“These data further indicate that GRAM1b possesses motifs for sensing anionic lipids and/or accessible cholesterol to detect their codistribution.”
§ Molecular basis of accessible plasma membrane cholesterol recognition by the GRAM domain of GRAMD1b > Results > The GRAM domain of GRAMD1b detects the codistribution of accessible cholesterol and PS, which is regulated by sphingomyelin
hedgedcorrelational- Asserted: passes — The authors put it forward as true.
- Checkable: passes — It can be checked against evidence.
- Load-bearing: passes — The paper’s conclusions depend on it.
- Based: passes — The paper gives a reason why it holds.
A conclusion the paper draws from its own results — it cites no other source for it, so there is none to check. The quote shows it is in the paper.
In the paper
“Further, these sites act synergistically to detect the codistribution of cholesterol and anionic lipids in membranes.”
§ Molecular basis of accessible plasma membrane cholesterol recognition by the GRAM domain of GRAMD1b > Results > A GRAMD1b mutation (R189W) associated with intellectual disability specifically impairs binding of the GRAM domain to cholesterol
plaindirect- Asserted: passes — The authors put it forward as true.
- Checkable: passes — It can be checked against evidence.
- Load-bearing: passes — The paper’s conclusions depend on it.
- Based: passes — The paper gives a reason why it holds.
A conclusion the paper draws from its own results — it cites no other source for it, so there is none to check. The quote shows it is in the paper.
In the paper
“These results are consistent with the notion that anionic lipid and cholesterol recognition are mediated by independent sites.”
§ Molecular basis of accessible plasma membrane cholesterol recognition by the GRAM domain of GRAMD1b > Results > A GRAMD1b mutation (R189W) associated with intellectual disability specifically impairs binding of the GRAM domain to cholesterol
hedgeddirect- Asserted: passes — The authors put it forward as true.
- Checkable: passes — It can be checked against evidence.
- Load-bearing: passes — The paper’s conclusions depend on it.
- Based: passes — The paper gives a reason why it holds.
A conclusion the paper draws from its own results — it cites no other source for it, so there is none to check. The quote shows it is in the paper.
In the paper
“These results are consistent with an increased sensitivity of GRAM1b–G187L to membranes that contain both PS and cholesterol.”
§ Molecular basis of accessible plasma membrane cholesterol recognition by the GRAM domain of GRAMD1b > Results > Identification of a novel GRAM domain mutation in GRAMD1b (G187L) that enhances its ability to sense accessible PM cholesterol
hedgeddirect- Asserted: passes — The authors put it forward as true.
- Checkable: passes — It can be checked against evidence.
- Load-bearing: passes — The paper’s conclusions depend on it.
- Based: passes — The paper gives a reason why it holds.
A conclusion the paper draws from its own results — it cites no other source for it, so there is none to check. The quote shows it is in the paper.
In the paper
“Taken together, these data confirm the importance of GRAMD1 in the transport of accessible cholesterol from the PM to the ER in response to acute expansion of the accessible pool of PM cholesterol, thereby preventing the overaccumulation of cholesterol in the PM.”
§ Molecular basis of accessible plasma membrane cholesterol recognition by the GRAM domain of GRAMD1b > Results > Cholesterol‐sensing property of the GRAM domain is critical for GRAMD1b function
boosteddirect- Asserted: passes — The authors put it forward as true.
- Checkable: passes — It can be checked against evidence.
- Load-bearing: passes — The paper’s conclusions depend on it.
- Based: passes — The paper gives a reason why it holds.
A conclusion the paper draws from its own results — it cites no other source for it, so there is none to check. The quote shows it is in the paper.
In the paper
“Thus, the R189W mutation, which specifically impairs the cholesterol‐sensing property of the GRAM domain and has been associated with intellectual disability in humans, affects the ability of GRAMD1b to transfer cholesterol.”
§ Molecular basis of accessible plasma membrane cholesterol recognition by the GRAM domain of GRAMD1b > Results > Mutant versions of GRAMD1b that cannot sense cholesterol exhibit impairment in membrane tethering and cholesterol transport
plaindirect- Asserted: passes — The authors put it forward as true.
- Checkable: passes — It can be checked against evidence.
- Load-bearing: passes — The paper’s conclusions depend on it.
- Based: passes — The paper gives a reason why it holds.
A conclusion the paper draws from its own results — it cites no other source for it, so there is none to check. The quote shows it is in the paper.
In the paper
“further supporting exaggerated expansions in the accessible pool of PM cholesterol in GRAMD1 TKO cells following sphingomyelinase treatment.”
§ Molecular basis of accessible plasma membrane cholesterol recognition by the GRAM domain of GRAMD1b > Results > Cholesterol‐sensing property of the GRAM domain is critical for GRAMD1b function
hedgeddirect- Asserted: passes — The authors put it forward as true.
- Checkable: passes — It can be checked against evidence.
- Load-bearing: passes — The paper’s conclusions depend on it.
- Based: passes — The paper gives a reason why it holds.
A conclusion the paper draws from its own results — it cites no other source for it, so there is none to check. The quote shows it is in the paper.
In the paper
“Our results demonstrate that the GRAM domain is essential for GRAMD1‐dependent cholesterol transport at ER‐PM contact sites.”
§ Molecular basis of accessible plasma membrane cholesterol recognition by the GRAM domain of GRAMD1b > Discussion
boosteddirect- Asserted: passes — The authors put it forward as true.
- Checkable: passes — It can be checked against evidence.
- Load-bearing: passes — The paper’s conclusions depend on it.
- Based: passes — The paper gives a reason why it holds.
A conclusion the paper draws from its own results — it cites no other source for it, so there is none to check. The quote shows it is in the paper.
In the paper
“These results support the critical importance of the G187 position in modulating the sensitivity of GRAM1b to accessible PM cholesterol.”
§ Molecular basis of accessible plasma membrane cholesterol recognition by the GRAM domain of GRAMD1b > Results > G187 is critical for determining the sensitivity of the GRAM domain to accessible PM cholesterol and regulating GRAMD1b‐dependent cholesterol transport
boosteddirect- Asserted: passes — The authors put it forward as true.
- Checkable: passes — It can be checked against evidence.
- Load-bearing: passes — The paper’s conclusions depend on it.
- Based: passes — The paper gives a reason why it holds.
- Rests on an assumption: The modeled structure of the GRAM domain of GRAMD1b accurately represents the three-dimensional arrangement of the residues.
A conclusion the paper draws from its own results — it cites no other source for it, so there is none to check. The quote shows it is in the paper.
In the paper
“Further, a hydrophobic amino acid is preferred in this position for the effective recognition of accessible cholesterol.”
§ Molecular basis of accessible plasma membrane cholesterol recognition by the GRAM domain of GRAMD1b > Results > G187 is critical for determining the sensitivity of the GRAM domain to accessible PM cholesterol and regulating GRAMD1b‐dependent cholesterol transport
plaindirect- Asserted: passes — The authors put it forward as true.
- Checkable: passes — It can be checked against evidence.
- Load-bearing: passes — The paper’s conclusions depend on it.
- Based: passes — The paper gives a reason why it holds.
- Rests on an assumption: The modeled structure of the GRAM domain of GRAMD1b accurately represents the three-dimensional arrangement of the residues.
A conclusion the paper draws from its own results — it cites no other source for it, so there is none to check. The quote shows it is in the paper.
In the paper
“This suggests that some fraction of cholesterol can remain closely associated with PS (and possibly other anionic lipids) without being sequestered by this lipid.”
§ Molecular basis of accessible plasma membrane cholesterol recognition by the GRAM domain of GRAMD1b > Discussion
hedgedcorrelational- Asserted: passes — The authors put it forward as true.
- Checkable: passes — It can be checked against evidence.
- Load-bearing: passes — The paper’s conclusions depend on it.
- Based: passes — The paper gives a reason why it holds.
What the paper did — it cites no source for this, so there is none to check. The quote shows it is in the paper.
In the paper
“allowing us to compare the activities of various versions of EGFP‐GRAMD1b proteins at similar levels of expression in GRAMD1 TKO cells (Fig 5B).”
§ Molecular basis of accessible plasma membrane cholesterol recognition by the GRAM domain of GRAMD1b > Results > Cholesterol‐sensing property of the GRAM domain is critical for GRAMD1b function
plaindirect- Asserted: passes — The authors put it forward as true.
- Checkable: passes — It can be checked against evidence.
- Load-bearing: passes — The paper’s conclusions depend on it.
- Based: passes — The paper gives a reason why it holds.
What the paper did — it cites no source for this, so there is none to check. The quote shows it is in the paper.
In the paper
“Immunoblot analysis of total cell lysates confirmed that EGFP‐GRAMD1b–G187L was expressed at levels similar to EGFP‐GRAMD1b in another stable cell line (Fig EV5F; compare with Fig 5A).”
§ Molecular basis of accessible plasma membrane cholesterol recognition by the GRAM domain of GRAMD1b > Results > G187 is critical for determining the sensitivity of the GRAM domain to accessible PM cholesterol and regulating GRAMD1b‐dependent cholesterol transport
plain- Asserted: passes — The authors put it forward as true.
- Checkable: passes — It can be checked against evidence.
- Load-bearing: passes — The paper’s conclusions depend on it.
- Based: passes — The paper gives a reason why it holds.
A conclusion the paper draws from its own results — it cites no other source for it, so there is none to check. The quote shows it is in the paper.
In the paper
“We have also demonstrated that GRAM1b contributes to the regulation of GRAMD1‐mediated PM to ER cholesterol transport at ER‐PM contact sites.”
§ Molecular basis of accessible plasma membrane cholesterol recognition by the GRAM domain of GRAMD1b > Discussion
boosteddirect- Asserted: passes — The authors put it forward as true.
- Checkable: passes — It can be checked against evidence.
- Load-bearing: passes — The paper’s conclusions depend on it.
- Based: passes — The paper gives a reason why it holds.
A conclusion the paper draws from its own results — it cites no other source for it, so there is none to check. The quote shows it is in the paper.
In the paper
“These results suggest that the newly identified GRAM1b mutation, G187L, enhances the ability of GRAM1b to sense accessible PM cholesterol.”
§ Molecular basis of accessible plasma membrane cholesterol recognition by the GRAM domain of GRAMD1b > Results > Identification of a novel GRAM domain mutation in GRAMD1b (G187L) that enhances its ability to sense accessible PM cholesterol
hedgeddirect- Asserted: passes — The authors put it forward as true.
- Checkable: passes — It can be checked against evidence.
- Load-bearing: passes — The paper’s conclusions depend on it.
- Based: passes — The paper gives a reason why it holds.
- Rests on an assumption: The modeled structure of the GRAM domain of GRAMD1b accurately represents the three-dimensional arrangement of the residues.
A conclusion the paper draws from its own results — it cites no other source for it, so there is none to check. The quote shows it is in the paper.
In the paper
“strongly indicating that the GRAM domain detects the codistribution of anionic lipids, including PS, and accessible cholesterol in the inner leaflet of the PM when it becomes prominent.”
§ Molecular basis of accessible plasma membrane cholesterol recognition by the GRAM domain of GRAMD1b > Discussion
boostedcorrelational- Asserted: passes — The authors put it forward as true.
- Checkable: passes — It can be checked against evidence.
- Load-bearing: passes — The paper’s conclusions depend on it.
- Based: passes — The paper gives a reason why it holds.
A conclusion the paper draws from its own results — it cites no other source for it, so there is none to check. The quote shows it is in the paper.
In the paper
“These results demonstrate that the cholesterol‐sensing property of the GRAM domain plays a critical role in StART‐like domain‐dependent cholesterol transport via facilitation of membrane tethering.”
§ Molecular basis of accessible plasma membrane cholesterol recognition by the GRAM domain of GRAMD1b > Results > Mutant versions of GRAMD1b that cannot sense cholesterol exhibit impairment in membrane tethering and cholesterol transport
boosteddirect- Asserted: passes — The authors put it forward as true.
- Checkable: passes — It can be checked against evidence.
- Load-bearing: passes — The paper’s conclusions depend on it.
- Based: passes — The paper gives a reason why it holds.
- Rests on an assumption: The PM-like and ER-like liposomes used in the in vitro transport assay mimic the lipid composition and properties of the plasma membrane and endoplasmic reticulum.
A conclusion the paper draws from its own results — it cites no other source for it, so there is none to check. The quote shows it is in the paper.
In the paper
“These results reveal the critical role of the proper sensitivity of the GRAM domain to accessible PM cholesterol in the regulation of GRAMD1‐dependent cholesterol extraction and transport to the ER, thereby maintaining the size of the accessible pool of cholesterol in the PM.”
§ Molecular basis of accessible plasma membrane cholesterol recognition by the GRAM domain of GRAMD1b > Results > G187 is critical for determining the sensitivity of the GRAM domain to accessible PM cholesterol and regulating GRAMD1b‐dependent cholesterol transport
boosteddirect- Asserted: passes — The authors put it forward as true.
- Checkable: passes — It can be checked against evidence.
- Load-bearing: passes — The paper’s conclusions depend on it.
- Based: passes — The paper gives a reason why it holds.
A conclusion the paper draws from its own results — it cites no other source for it, so there is none to check. The quote shows it is in the paper.
In the paper
“which forms a complex with cholesterol, thereby reducing its accessibility.”
§ Molecular basis of accessible plasma membrane cholesterol recognition by the GRAM domain of GRAMD1b > Discussion
plaindirect- Asserted: passes — The authors put it forward as true.
- Checkable: passes — It can be checked against evidence.
- Load-bearing: passes — The paper’s conclusions depend on it.
- Based: passes — The paper gives a reason why it holds.
A conclusion the paper draws from its own results — it cites no other source for it, so there is none to check. The quote shows it is in the paper.
In the paper
“indicating that accessible PM cholesterol was more efficiently extracted by EGFP‐GRAMD1b–G187L compared to EGFP‐GRAMD1b–WT.”
§ Molecular basis of accessible plasma membrane cholesterol recognition by the GRAM domain of GRAMD1b > Results > G187 is critical for determining the sensitivity of the GRAM domain to accessible PM cholesterol and regulating GRAMD1b‐dependent cholesterol transport
hedgeddirect- Asserted: passes — The authors put it forward as true.
- Checkable: passes — It can be checked against evidence.
- Load-bearing: passes — The paper’s conclusions depend on it.
- Based: passes — The paper gives a reason why it holds.
What the paper did — it cites no source for this, so there is none to check. The quote shows it is in the paper.
In the paper
“Immunoblot analysis of total cell lysates from these newly established cell lines confirmed similar levels of the transduced proteins.”
§ Molecular basis of accessible plasma membrane cholesterol recognition by the GRAM domain of GRAMD1b > Results > Cholesterol‐sensing property of the GRAM domain is critical for GRAMD1b function
plain- Asserted: passes — The authors put it forward as true.
- Checkable: passes — It can be checked against evidence.
- Load-bearing: passes — The paper’s conclusions depend on it.
- Based: passes — The paper gives a reason why it holds.
A conclusion the paper draws from its own results — it cites no other source for it, so there is none to check. The quote shows it is in the paper.
In the paper
“We have identified the molecular basis by which the GRAM domain of GRAMD1b (GRAM1b) detects accessible cholesterol in the presence of anionic lipids in the PM.”
§ Molecular basis of accessible plasma membrane cholesterol recognition by the GRAM domain of GRAMD1b > Discussion
boosteddirect- Asserted: passes — The authors put it forward as true.
- Checkable: passes — It can be checked against evidence.
- Load-bearing: passes — The paper’s conclusions depend on it.
- Based: passes — The paper gives a reason why it holds.
- Rests on an assumption: The molecular basis for the synergistic binding of GRAM domains to membranes containing both cholesterol and anionic lipids was unclear before this study.
A conclusion the paper draws from its own results — it cites no other source for it, so there is none to check. The quote shows it is in the paper.
In the paper
“demonstrating that recruitment of EGFP‐GRAM1b–G187L to the PM is cholesterol‐dependent.”
§ Molecular basis of accessible plasma membrane cholesterol recognition by the GRAM domain of GRAMD1b > Results > Identification of a novel GRAM domain mutation in GRAMD1b (G187L) that enhances its ability to sense accessible PM cholesterol
boosteddirect- Asserted: passes — The authors put it forward as true.
- Checkable: passes — It can be checked against evidence.
- Load-bearing: passes — The paper’s conclusions depend on it.
- Based: passes — The paper gives a reason why it holds.
A conclusion the paper draws from its own results — it cites no other source for it, so there is none to check. The quote shows it is in the paper.
In the paper
“Thus, enhanced tethering observed with GRAMD1b‐G187L was due to stronger binding of GRAMD1b‐G187L to PM‐like liposomes compared to GRAMD1b‐WT.”
§ Molecular basis of accessible plasma membrane cholesterol recognition by the GRAM domain of GRAMD1b > Results > G187 is critical for determining the sensitivity of the GRAM domain to accessible PM cholesterol and regulating GRAMD1b‐dependent cholesterol transport
plaindirect- Asserted: passes — The authors put it forward as true.
- Checkable: passes — It can be checked against evidence.
- Load-bearing: passes — The paper’s conclusions depend on it.
- Based: passes — The paper gives a reason why it holds.
A conclusion the paper draws from its own results — it cites no other source for it, so there is none to check. The quote shows it is in the paper.
In the paper
“indicating the failure of liposome tethering (Fig 4B).”
§ Molecular basis of accessible plasma membrane cholesterol recognition by the GRAM domain of GRAMD1b > Results > Mutant versions of GRAMD1b that cannot sense cholesterol exhibit impairment in membrane tethering and cholesterol transport
hedgeddirect- Asserted: passes — The authors put it forward as true.
- Checkable: passes — It can be checked against evidence.
- Load-bearing: passes — The paper’s conclusions depend on it.
- Based: passes — The paper gives a reason why it holds.
A conclusion the paper draws from its own results — it cites no other source for it, so there is none to check. The quote shows it is in the paper.
In the paper
“These results further support the notion that the G187L mutation enhances GRAMD1b‐mediated accessible PM cholesterol extraction.”
§ Molecular basis of accessible plasma membrane cholesterol recognition by the GRAM domain of GRAMD1b > Results > G187 is critical for determining the sensitivity of the GRAM domain to accessible PM cholesterol and regulating GRAMD1b‐dependent cholesterol transport
hedgeddirect- Asserted: passes — The authors put it forward as true.
- Checkable: passes — It can be checked against evidence.
- Load-bearing: passes — The paper’s conclusions depend on it.
- Based: passes — The paper gives a reason why it holds.
A conclusion the paper draws from its own results — it cites no other source for it, so there is none to check. The quote shows it is in the paper.
In the paper
“further indicating that the G187L mutation increases the sensitivity of EGFP‐GRAM1b to accessible PM cholesterol”
§ Molecular basis of accessible plasma membrane cholesterol recognition by the GRAM domain of GRAMD1b > Results > Identification of a novel GRAM domain mutation in GRAMD1b (G187L) that enhances its ability to sense accessible PM cholesterol
hedgeddirect- Asserted: passes — The authors put it forward as true.
- Checkable: passes — It can be checked against evidence.
- Load-bearing: passes — The paper’s conclusions depend on it.
- Based: passes — The paper gives a reason why it holds.
A conclusion the paper draws from its own results — it cites no other source for it, so there is none to check. The quote shows it is in the paper.
In the paper
“consistent with the essential role of cholesterol‐sensing properties of the GRAM domain in mediating cholesterol‐dependent PM recruitment of GRAMD1b (Fig EV3A, Movie EV2).”
§ Molecular basis of accessible plasma membrane cholesterol recognition by the GRAM domain of GRAMD1b > Results > Cholesterol‐sensing property of the GRAM domain is critical for GRAMD1b function
boosteddirect- Asserted: passes — The authors put it forward as true.
- Checkable: passes — It can be checked against evidence.
- Load-bearing: passes — The paper’s conclusions depend on it.
- Based: passes — The paper gives a reason why it holds.
A conclusion the paper draws from its own results — it cites no other source for it, so there is none to check. The quote shows it is in the paper.
In the paper
“Thus, these results suggest important roles of the cholesterol‐sensing properties of GRAM1b in regulating GRAMD1b‐mediated transport of accessible cholesterol in cells.”
§ Molecular basis of accessible plasma membrane cholesterol recognition by the GRAM domain of GRAMD1b > Results > Cholesterol‐sensing property of the GRAM domain is critical for GRAMD1b function
hedgedconditional- Asserted: passes — The authors put it forward as true.
- Checkable: passes — It can be checked against evidence.
- Load-bearing: passes — The paper’s conclusions depend on it.
- Based: passes — The paper gives a reason why it holds.
A conclusion the paper draws from its own results — it cites no other source for it, so there is none to check. The quote shows it is in the paper.
In the paper
“These results suggest that Amphotericin B preferentially targets accessible cholesterol in the PM of mammalian cells, further supporting exaggerated expansions in the accessible pool of PM cholesterol in GRAMD1 TKO cells following sphingomyelinase treatment.”
§ Molecular basis of accessible plasma membrane cholesterol recognition by the GRAM domain of GRAMD1b > Results > Cholesterol‐sensing property of the GRAM domain is critical for GRAMD1b function
hedgeddirect- Asserted: passes — The authors put it forward as true.
- Checkable: passes — It can be checked against evidence.
- Load-bearing: passes — The paper’s conclusions depend on it.
- Based: passes — The paper gives a reason why it holds.
A conclusion the paper draws from its own results — it cites no other source for it, so there is none to check. The quote shows it is in the paper.
In the paper
“Thus, the results from the in vitro lipid transport assay suggest that there are other amino acids outside of the GRAM domain that may contribute to the anionic lipid‐sensing property of full‐length GRAMD1b proteins (see Discussion).”
§ Molecular basis of accessible plasma membrane cholesterol recognition by the GRAM domain of GRAMD1b > Results > Mutant versions of GRAMD1b that cannot sense cholesterol exhibit impairment in membrane tethering and cholesterol transport
hedgedconditional- Asserted: passes — The authors put it forward as true.
- Checkable: passes — It can be checked against evidence.
- Load-bearing: passes — The paper’s conclusions depend on it.
- Based: passes — The paper gives a reason why it holds.
- Rests on an assumption: The PM-like and ER-like liposomes used in the in vitro transport assay mimic the lipid composition and properties of the plasma membrane and endoplasmic reticulum.
A conclusion the paper draws from its own results — it cites no other source for it, so there is none to check. The quote shows it is in the paper.
In the paper
“confirming the specificity of GRAM1b–G187L to accessible cholesterol”
§ Molecular basis of accessible plasma membrane cholesterol recognition by the GRAM domain of GRAMD1b > Results > Identification of a novel GRAM domain mutation in GRAMD1b (G187L) that enhances its ability to sense accessible PM cholesterol
boostedcorrelational- Asserted: passes — The authors put it forward as true.
- Checkable: passes — It can be checked against evidence.
- Load-bearing: passes — The paper’s conclusions depend on it.
- Based: passes — The paper gives a reason why it holds.
A conclusion the paper draws from its own results — it cites no other source for it, so there is none to check. The quote shows it is in the paper.
In the paper
“and that 2) both accessible cholesterol and anionic lipids are required for the binding of the GRAM domain to the PM as coligands (Fig 7F).”
§ Molecular basis of accessible plasma membrane cholesterol recognition by the GRAM domain of GRAMD1b > Discussion
plaindirect- Asserted: passes — The authors put it forward as true.
- Checkable: passes — It can be checked against evidence.
- Load-bearing: passes — The paper’s conclusions depend on it.
- Based: passes — The paper gives a reason why it holds.
A conclusion the paper draws from its own results — it cites no other source for it, so there is none to check. The quote shows it is in the paper.
In the paper
“Thus, there may be other amino acids outside of the GRAM1b that contribute to anionic lipid‐sensing property of full‐length GRAMD1b proteins.”
§ Molecular basis of accessible plasma membrane cholesterol recognition by the GRAM domain of GRAMD1b > Discussion
hedgedconditional- Asserted: passes — The authors put it forward as true.
- Checkable: passes — It can be checked against evidence.
- Load-bearing: passes — The paper’s conclusions depend on it.
- Based: passes — The paper gives a reason why it holds.
A conclusion the paper draws from its own results — it cites no other source for it, so there is none to check. The quote shows it is in the paper.
In the paper
“Thus, they are not suitable for long‐term, live cell imaging of mammalian cells.”
§ Molecular basis of accessible plasma membrane cholesterol recognition by the GRAM domain of GRAMD1b > Discussion
plain- Asserted: passes — The authors put it forward as true.
- Checkable: passes — It can be checked against evidence.
- Load-bearing: passes — The paper’s conclusions depend on it.
- Based: passes — The paper gives a reason why it holds.
A conclusion the paper draws from its own results — it cites no other source for it, so there is none to check. The quote shows it is in the paper.
In the paper
“The switch‐like property of the GRAM domain in binding the PM only when necessary prevents GRAMD1s from extracting too much cholesterol.”
§ Molecular basis of accessible plasma membrane cholesterol recognition by the GRAM domain of GRAMD1b > Discussion
plaindirect- Asserted: passes — The authors put it forward as true.
- Checkable: passes — It can be checked against evidence.
- Load-bearing: passes — The paper’s conclusions depend on it.
- Based: passes — The paper gives a reason why it holds.
A conclusion the paper draws from its own results — it cites no other source for it, so there is none to check. The quote shows it is in the paper.
In the paper
“This is in good agreement with our data, which revealed a critical role of anionic lipids, including PS, as coligands for PM recruitment of GRAMD1b for the PM to ER cholesterol transport.”
§ Molecular basis of accessible plasma membrane cholesterol recognition by the GRAM domain of GRAMD1b > Discussion
boosteddirect- Asserted: passes — The authors put it forward as true.
- Checkable: passes — It can be checked against evidence.
- Load-bearing: passes — The paper’s conclusions depend on it.
- Based: passes — The paper gives a reason why it holds.
A conclusion the paper draws from its own results — it cites no other source for it, so there is none to check. The quote shows it is in the paper.
In the paper
“The GRAMD1 GRAM domain is the first example of an intracellular membrane‐binding domain in eukaryotes that is specifically tuned to sense levels of accessible PM cholesterol.”
§ Molecular basis of accessible plasma membrane cholesterol recognition by the GRAM domain of GRAMD1b > Discussion
plain- Asserted: passes — The authors put it forward as true.
- Checkable: passes — It can be checked against evidence.
- Load-bearing: passes — The paper’s conclusions depend on it.
- Based: passes — The paper gives a reason why it holds.
A conclusion the paper draws from its own results — it cites no other source for it, so there is none to check. The quote shows it is in the paper.
In the paper
“Coincidence detection of accessible cholesterol and anionic lipids via distinct ligand binding sites would ensure robust recruitment of the GRAM domain to the PM, whose inner leaflet is enriched with PS and other anionic lipids, only when levels of accessible PM cholesterol exceed a certain threshold.”
§ Molecular basis of accessible plasma membrane cholesterol recognition by the GRAM domain of GRAMD1b > Discussion
hedgeddirect- Asserted: passes — The authors put it forward as true.
- Checkable: passes — It can be checked against evidence.
- Load-bearing: passes — The paper’s conclusions depend on it.
- Based: passes — The paper gives a reason why it holds.
A conclusion the paper draws from its own results — it cites no other source for it, so there is none to check. The quote shows it is in the paper.
In the paper
“In summary, we have shown that cells monitor the codistribution of accessible cholesterol and anionic lipids within the inner leaflet of the PM and fine‐tune the rate at which accessible PM cholesterol is extracted and transported to the ER via GRAMD1s.”
§ Molecular basis of accessible plasma membrane cholesterol recognition by the GRAM domain of GRAMD1b > Discussion
boosteddirect- Asserted: passes — The authors put it forward as true.
- Checkable: passes — It can be checked against evidence.
- Load-bearing: passes — The paper’s conclusions depend on it.
- Based: passes — The paper gives a reason why it holds.
A conclusion the paper draws from its own results — it cites no other source for it, so there is none to check. The quote shows it is in the paper.
In the paper
“These results demonstrate that the R189W mutation in the GRAM domain results in severe GRAMD1b loss of function in humans.”
§ Molecular basis of accessible plasma membrane cholesterol recognition by the GRAM domain of GRAMD1b > Discussion
boosteddirect- Asserted: passes — The authors put it forward as true.
- Checkable: passes — It can be checked against evidence.
- Load-bearing: passes — The paper’s conclusions depend on it.
- Based: passes — The paper gives a reason why it holds.
- Rests on an assumption: The R189W mutation in GRAM1b is linked to intellectual disability in humans.
A conclusion the paper draws from its own results — it cites no other source for it, so there is none to check. The quote shows it is in the paper.
In the paper
“Because GRAMD1s are conserved from yeast to humans, our findings provide important insights into conserved mechanisms by which levels of intracellular sterols are sensed and monitored in all eukaryotes.”
§ Molecular basis of accessible plasma membrane cholesterol recognition by the GRAM domain of GRAMD1b > Discussion
plaindirect- Asserted: passes — The authors put it forward as true.
- Checkable: passes — It can be checked against evidence.
- Load-bearing: passes — The paper’s conclusions depend on it.
- Based: passes — The paper gives a reason why it holds.
- Rests on an assumption: GRAMD1s are conserved from yeast to humans.
- It may state two separate claims as one. 72
- Probably not a substantial claim. 14
- The quote only partly states this claim. 1
The cited sources support only part of this claim — read each source’s verdict below.
In the paper
“Artificially trapping accessible cholesterol in the PM results in constitutive activation of SREBPs and dysregulated cholesterol metabolism (Infante & Radhakrishnan, 2017; Johnson et al, 2019).”
§ Molecular basis of accessible plasma membrane cholesterol recognition by the GRAM domain of GRAMD1b > Introduction
What the sources say
- Supportedcites Infante & Radhakrishnan, 2017 source
The Discussion reports that ALOD4 sequesters plasma-membrane cholesterol and prevents its transport to the ER, triggering SREBP activation even in cholesterol-replete cells. The Results report that ALOD4 prevents added cholesterol from suppressing SREBP activation and increases expression of cholesterol-synthesis and uptake genes. Thus, the claim describes disrupted cholesterol feedback during ALOD4 treatment; the paper does not establish permanent activation after ALOD4 is removed. (LLM, conf=0.88)
- Partly supportedcites Johnson et al, 2019 sourceExperimental — accuracy not yet measured
The Abstract reports that trapping accessible PM cholesterol with ALOD4 activates SREBP despite cholesterol being above its normal threshold. The section “Binding of OlyA lowers ER cholesterol levels” also reports increased HMGCR, supporting disrupted cholesterol regulation. “Constitutive” overstates the finding: that section shows 25-hydroxycholesterol could still suppress SREBP2 activation during ALOD4 treatment. No page numbers are available in our copy. (LLM, conf=0.85)
plaindirect- Asserted: passes — The authors put it forward as true.
- Checkable: passes — It can be checked against evidence.
- Load-bearing: passes — The paper’s conclusions depend on it.
- Based: passes — The paper gives a reason why it holds.
It may state two separate claims as one.
- Supported
The cited sources support only part of this claim — read each source’s verdict below.
In the paper
“WT control GRAM1b bound liposomes that contained any one of these anionic lipids with some preference toward PS, PA, PI(4)P, and PI(4,5)P2, consistent with our previous results (Naito et al, 2019).”
§ Molecular basis of accessible plasma membrane cholesterol recognition by the GRAM domain of GRAMD1b > Results > A basic patch within the GRAM domain of GRAMD1b is critical for anionic lipid recognition
What the sources say
- Partly supportedcites Naito et al, 2019 sourceExperimental — accuracy not yet measured
The Results section (Figure 3—figure supplement 1D; page not provided) reports enhanced GRAMD1b GRAM-domain binding to liposomes containing PS, PA, PI(4)P, or PI(4,5)P2 when free cholesterol was added. It reports little or no binding with 5% of those anionic lipids alone. The passage does not test PI or establish the claimed preference among the lipids. (LLM, conf=0.88)
plaincorrelational- Asserted: passes — The authors put it forward as true.
- Checkable: passes — It can be checked against evidence.
- Load-bearing: passes — The paper’s conclusions depend on it.
- Based: passes — The paper gives a reason why it holds.
It may state two separate claims as one.
- Partly supported
Every source the paper cites for this claim was checked and supports it.
In the paper
“GRAMD1s sense transient expansions in the accessible pool of PM cholesterol via the GRAM domain and then transport accessible cholesterol from the PM to the ER at ER‐PM contacts via the StART‐like domain (Naito et al, 2019).”
§ Molecular basis of accessible plasma membrane cholesterol recognition by the GRAM domain of GRAMD1b > Results > Mutant versions of GRAMD1b that cannot sense cholesterol exhibit impairment in membrane tethering and cholesterol transport
What the sources say
- Supportedcites Naito et al, 2019 source
The Discussion states that GRAMD1s sense a transient expansion of accessible PM cholesterol through their GRAM domain and facilitate its transport through their StART-like domain at ER–PM contacts. Its Figure 8 description specifies that the StART-like domain extracts accessible PM cholesterol and facilitates transport to the ER. (LLM, conf=0.95)
plaindirect- Asserted: passes — The authors put it forward as true.
- Checkable: passes — It can be checked against evidence.
- Load-bearing: passes — The paper’s conclusions depend on it.
- Based: passes — The paper gives a reason why it holds.
It may state two separate claims as one.
- Supported
The cited sources support only part of this claim — read each source’s verdict below.
In the paper
“Transport of the “accessible” pool of cholesterol from the plasma membrane (PM) to the endoplasmic reticulum (ER) by ER‐localized GRAMD1 proteins (GRAMD1a/1b/1c) contributes to cholesterol homeostasis.”
- Also stated in: § Introduction · plain
“We and others recently found that a family of evolutionarily conserved and ER‐anchored sterol transfer proteins, the GRAMD1s/Asters (GRAMD1a/Aster‐A, GRAMD1b/Aster‐B, and GRAMD1c/Aster‐C) (the Lam/Ltc proteins in yeast), mediate non‐vesicular sterol transport from the PM to the ER at ER‐PM contact sites, thereby contributing to sterol homeostasis”
§ Molecular basis of accessible plasma membrane cholesterol recognition by the GRAM domain of GRAMD1b > Abstract
What the sources say
- Partly supportedcites Gatta et al, 2015 sourceExperimental — accuracy not yet measured
The Results section on sterol transport reports that yeast Ysp1p, Ysp2p and Sip3p appear to act in non-vesicular PM-to-ER sterol transport. The Discussion identifies GramD1a–c as related human proteins but says little is known about them. The paper therefore does not establish that GRAMD1a/1b/1c transport the accessible cholesterol pool or contribute to cholesterol homeostasis. (LLM, conf=0.90)
- Supportedcites Sandhu et al, 2018 source
The Results identify GRAMD1a, GRAMD1b, and GRAMD1c as Aster-A, -B, and -C. The Discussion states that these ER-anchored transporters form bridges to the PM when cholesterol rises and help maintain the equilibrium between accessible PM cholesterol and the ER pool through nonvesicular transport. Page numbers are not available in our copy. (LLM, conf=0.94)
- Supportedcites Naito et al, 2019 source
The Discussion states that ER-localized GRAMD1s transport accessible cholesterol from the PM to the ER at ER–PM contact sites through non-vesicular transport, helping maintain PM cholesterol homeostasis. The Results identify GRAMD1a, GRAMD1b, and GRAMD1c as proteins recruited to those contacts upon cholesterol loading. (LLM, conf=0.95)
plaindirect- Asserted: passes — The authors put it forward as true.
- Checkable: passes — It can be checked against evidence.
- Load-bearing: passes — The paper’s conclusions depend on it.
- Based: passes — The paper gives a reason why it holds.
It may state two separate claims as one.
- Also stated in: § Introduction · plain
Every source the paper cites for this claim was checked and supports it.
In the paper
“Branched (DPhyPC) and more unsaturated (DOPC) acyl chains lower the tendency to form ordered conformations in the membrane, and thus, POPC has the strongest cholesterol sequestration effect, followed by DOPC and DPhyPC (Sokolov & Radhakrishnan, 2010).”
§ Molecular basis of accessible plasma membrane cholesterol recognition by the GRAM domain of GRAMD1b > Results > The G187L mutation increases sensitivity of the GRAM domain to cholesterol without altering its affinity for PS
What the sources say
- Supportedcites Sokolov & Radhakrishnan, 2010 source
In “Specificity of His₆-PFO(C459A) Interaction with” (Fig. 2B; page not provided), the paper says unsaturated DOPC and branched DPhyPC chains have lower ordering tendencies. It reports cholesterol-accessibility switch-points of 45 mol% for POPC, 35 mol% for DOPC, and 25 mol% for DPhyPC, and explains that more ordered chains make cholesterol less accessible. This supports the stated ordering of cholesterol sequestration. (LLM, conf=0.91)
plaindirect- Asserted: passes — The authors put it forward as true.
- Checkable: passes — It can be checked against evidence.
- Load-bearing: passes — The paper’s conclusions depend on it.
- Based: passes — The paper gives a reason why it holds.
It may state two separate claims as one.
- Supported
The cited sources support only part of this claim — read each source’s verdict below.
In the paper
“Amphotericin B binds PM sterols and eventually causes cell death by various mechanisms, including sequestration of PM sterols and the formation of non‐selective ion pores (Kinsky, 1970; Wang et al, 2018).”
§ Molecular basis of accessible plasma membrane cholesterol recognition by the GRAM domain of GRAMD1b > Results > Cholesterol‐sensing property of the GRAM domain is critical for GRAMD1b function
What the sources say
- Not checked — no full text of the sourcecites Kinsky, 1970 source
- Partly supportedcites Wang et al, 2018 sourceExperimental — accuracy not yet measured
The Results (page unavailable) report that ORP2-null cells are more resistant to amphotericin B, which the authors interpret as suggesting reduced plasma-membrane cholesterol. The amphotericin B resistance assay (page unavailable) measures surviving cells after exposure. Our copy does not describe sterol sequestration or non-selective ion pores as mechanisms of cell death. (LLM, conf=0.86)
plaindirect- Asserted: passes — The authors put it forward as true.
- Checkable: passes — It can be checked against evidence.
- Load-bearing: passes — The paper’s conclusions depend on it.
- Based: passes — The paper gives a reason why it holds.
Probably not a substantial claim. It may state two separate claims as one.
Every source the paper cites for this claim was checked and supports it.
In the paper
“Notably, a recent study by Trinh et al showed that PM PS is essential for the PM to ER transport of LDL‐derived cholesterol (Trinh et al, 2020).”
§ Molecular basis of accessible plasma membrane cholesterol recognition by the GRAM domain of GRAMD1b > Discussion
What the sources say
- Supportedcites Trinh et al, 2020 source
The Discussion states that PS is concentrated in the PM inner leaflet and is essential for cholesterol movement to the ER. The Results (Fig. 4) show that LDL-derived cholesterol accumulates at the PM when PS is deficient and that PS restores its transport to the ER. Page numbers are not provided in our copy. (LLM, conf=0.94)
plaindirect- Asserted: passes — The authors put it forward as true.
- Checkable: passes — It can be checked against evidence.
- Load-bearing: passes — The paper’s conclusions depend on it.
- Based: passes — The paper gives a reason why it holds.
Probably not a substantial claim.
- Supported
The cited sources support only part of this claim — read each source’s verdict below.
In the paper
“Mounting evidence suggests a link between GRAMD1b and various neurodevelopmental disorders, including schizophrenia and intellectual disability (Schizophrenia Working Group of the Psychiatric Genomics C, 2014; Reuter et al, 2017; Santos‐Cortez et al, 2018; Thyme et al, 2019).”
§ Molecular basis of accessible plasma membrane cholesterol recognition by the GRAM domain of GRAMD1b > Discussion
What the sources say
- Partly supportedcites Schizophrenia Working Group of the Psychiatric Genomics C, 2014 sourceExperimental — accuracy not yet measured
The “Overlap with rare mutations” section reports overlap between schizophrenia-associated genomic regions and genes with mutations in intellectual disability, supporting a broad link between the disorders. Our copy does not identify GRAMD1B in that finding or otherwise establish its link to either disorder (searched: GRAMD1B and the disorder names). (LLM, conf=0.78)
- Not checked — no full text of the sourcecites Reuter et al, 2017 source
- Partly supportedcites Santos‐Cortez et al, 2018 sourceExperimental — accuracy not yet measured
The Discussion reports a GRAMD1B variant co-segregating with severe autosomal recessive intellectual disability in family MR60, while noting that a TBRG1 variant also co-segregates and either could underlie the condition. This supports a possible link with intellectual disability, but the paper does not address a GRAMD1B link with schizophrenia. (LLM, conf=0.86)
hedgedcorrelational- Asserted: passes — The authors put it forward as true.
- Checkable: passes — It can be checked against evidence.
- Load-bearing: fails — The paper’s conclusions may not depend on it.
- Based: passes — The paper gives a reason why it holds.
Probably not a substantial claim. The paper’s conclusions may not depend on it.
- Partly supported
Every source the paper cites for this claim was checked and supports it.
In the paper
“The PX domain of p47phox also possesses synergistic lipid‐binding sites, one for PI(3,4)P2 and the other for anionic lipids such as phosphatidic acid and PS (Karathanassis et al, 2002).”
§ Molecular basis of accessible plasma membrane cholesterol recognition by the GRAM domain of GRAMD1b > Discussion
What the sources say
- Supportedcites Karathanassis et al, 2002 source
The Discussion (page not provided) states that the p47phox PX domain has two distinct lipid-binding sites. It reports synergistic membrane binding when one binds PtdIns(3,4)P2 and the other binds phosphatidic acid (PtdOH), or less preferentially phosphatidylserine (PtdSer). (LLM, conf=0.95)
plaincorrelational- Asserted: passes — The authors put it forward as true.
- Checkable: passes — It can be checked against evidence.
- Load-bearing: fails — The paper’s conclusions may not depend on it.
- Based: passes — The paper gives a reason why it holds.
Probably not a substantial claim. The paper’s conclusions may not depend on it.
- Supported
The cited sources support only part of this claim — read each source’s verdict below.
In the paper
“Other widely used toxin‐based biosensors for accessible cholesterol, including D4 of ALO and PFO, are useful for measuring levels of accessible cholesterol in the PM, but they trap accessible cholesterol in the PM and induce dysregulation of cholesterol homeostasis (Infante & Radhakrishnan, 2017; Johnson et al, 2019).”
§ Molecular basis of accessible plasma membrane cholesterol recognition by the GRAM domain of GRAMD1b > Discussion
What the sources say
- Partly supportedcites Infante & Radhakrishnan, 2017 sourceExperimental — accuracy not yet measured
Split into 2 atoms — 1 confirmed, 1 partially supported, 0 disputed, 0 misattributed, 0 unverifiable. Expand the claim to see per-atom verdicts.
- Partly supportedcites Johnson et al, 2019 sourceExperimental — accuracy not yet measured
Split into 2 atoms — 1 confirmed, 1 partially supported, 0 disputed, 0 misattributed, 0 unverifiable. Expand the claim to see per-atom verdicts.
plaindirect- Asserted: passes — The authors put it forward as true.
- Checkable: passes — It can be checked against evidence.
- Load-bearing: passes — The paper’s conclusions depend on it.
- Based: passes — The paper gives a reason why it holds.
It may state two separate claims as one.
- Partly supported
Every source the paper cites for this claim was checked and supports it.
In the paper
“For example, the PH domain of Arf GAP ASAP1 possesses two synergistic lipid‐binding sites and binds most efficiently to PI(4,5)P2‐containing membranes in the presence of other anionic lipids, such as PS (Jian et al, 2015).”
§ Molecular basis of accessible plasma membrane cholesterol recognition by the GRAM domain of GRAMD1b > Discussion
What the sources say
- Supportedcites Jian et al, 2015 source
The Results section (page unavailable) describes two cooperative lipid-binding sites in the ASAP1 PH domain: one specific for PI(4,5)P2 and another that can accommodate anionic lipids including phosphatidylserine (PS). It reports that adding PS changes PI(4,5)P2-dependent membrane binding from a sigmoidal to a hyperbolic response, supporting the claimed enhancement of binding in its presence. (LLM, conf=0.91)
plaindirect- Asserted: passes — The authors put it forward as true.
- Checkable: passes — It can be checked against evidence.
- Load-bearing: fails — The paper’s conclusions may not depend on it.
- Based: passes — The paper gives a reason why it holds.
Probably not a substantial claim. The paper’s conclusions may not depend on it. It may state two separate claims as one.
- Supported
Every source the paper cites for this claim was checked and supports it.
In the paper
“Our results confirm this notion and further demonstrate that the cholesterol‐dependent binding of GRAMD1 GRAM domains to the PM in trans promotes tethering of ER membranes [where GRAMD1s, which form homo‐ and hetero‐meric complexes (Naito et al, 2019), are located] to the PM and facilitates the non‐vesicular cholesterol transport between these membranes by the StART‐like domain (Fig 7F).”
§ Molecular basis of accessible plasma membrane cholesterol recognition by the GRAM domain of GRAMD1b > Discussion
What the sources say
- Supportedcites Naito et al, 2019 source
The citation is attached to the parenthetical claim that GRAMD1s form homo- and heteromeric complexes. The Discussion states that GRAMD1s and GRAMD3 form these complexes and localize to patches on tubular ER at rest. No page number is provided in our copy. (LLM, conf=0.94)
boosteddirect- Asserted: passes — The authors put it forward as true.
- Checkable: passes — It can be checked against evidence.
- Load-bearing: passes — The paper’s conclusions depend on it.
- Based: passes — The paper gives a reason why it holds.
It may state two separate claims as one.
- Supported
Every source the paper cites for this claim was checked and supports it.
In the paper
“In mice, GRAMD1b plays an important role in steroidogenesis within the adrenal glands (Sandhu et al, 2018).”
§ Molecular basis of accessible plasma membrane cholesterol recognition by the GRAM domain of GRAMD1b > Discussion
What the sources say
- Supportedcites Sandhu et al, 2018 source
The Results identify Aster-B as the protein encoded by Gramd1b and report that it is highly expressed in mouse adrenal glands. In “Aster-B Promotes PM to ER Cholesterol Transport,” Aster-B-deficient mice had lower basal corticosterone levels than controls, supporting an important role in adrenal steroidogenesis. (LLM, conf=0.92)
plaindirect- Asserted: passes — The authors put it forward as true.
- Checkable: passes — It can be checked against evidence.
- Load-bearing: fails — The paper’s conclusions may not depend on it.
- Based: passes — The paper gives a reason why it holds.
Probably not a substantial claim. The paper’s conclusions may not depend on it.
- Supported
A result the paper reports from its own data — it cites no other source for it, so there is none to check. The quote shows it is in the paper.
In the paper
“Replacing cholesterol with desmosterol had no effect, but replacing cholesterol with cholesteryl acetate, epicholesterol, or DHE eliminated the binding of GRAM1b to liposomes (Fig 3B).”
§ Molecular basis of accessible plasma membrane cholesterol recognition by the GRAM domain of GRAMD1b > Results > A GRAMD1b mutation (R189W) associated with intellectual disability specifically impairs binding of the GRAM domain to cholesterol
plaindirect- Asserted: passes — The authors put it forward as true.
- Checkable: passes — It can be checked against evidence.
- Load-bearing: passes — The paper’s conclusions depend on it.
- Based: passes — The paper gives a reason why it holds.
It may state two separate claims as one.
A result the paper reports from its own data — it cites no other source for it, so there is none to check. The quote shows it is in the paper.
In the paper
“For liposomes with 80% PS we measured ~20% binding for K161A and R191A, ~5% binding for K161A/R191A, and ~45% binding for WT GRAM1b (Fig 2C).”
§ Molecular basis of accessible plasma membrane cholesterol recognition by the GRAM domain of GRAMD1b > Results > A basic patch within the GRAM domain of GRAMD1b is critical for anionic lipid recognition
plain- Asserted: passes — The authors put it forward as true.
- Checkable: passes — It can be checked against evidence.
- Load-bearing: passes — The paper’s conclusions depend on it.
- Based: passes — The paper gives a reason why it holds.
It may state two separate claims as one.
A result the paper reports from its own data — it cites no other source for it, so there is none to check. The quote shows it is in the paper.
In the paper
“and enhanced GRAMD1b‐dependent membrane tethering and cholesterol transport.”
§ Molecular basis of accessible plasma membrane cholesterol recognition by the GRAM domain of GRAMD1b > Introduction
plaindirect- Asserted: passes — The authors put it forward as true.
- Checkable: passes — It can be checked against evidence.
- Load-bearing: passes — The paper’s conclusions depend on it.
- Based: passes — The paper gives a reason why it holds.
It may state two separate claims as one.
A result the paper reports from its own data — it cites no other source for it, so there is none to check. The quote shows it is in the paper.
In the paper
“As a control, liposomes containing only phosphatidylcholine (PC), only cholesterol (50%), or only PS (20%) were also examined; no FRET was observed in any of these conditions”
§ Molecular basis of accessible plasma membrane cholesterol recognition by the GRAM domain of GRAMD1b > Results > The GRAM domain of GRAMD1b detects the codistribution of accessible cholesterol and PS, which is regulated by sphingomyelin
plain- Asserted: passes — The authors put it forward as true.
- Checkable: passes — It can be checked against evidence.
- Load-bearing: passes — The paper’s conclusions depend on it.
- Based: passes — The paper gives a reason why it holds.
It may state two separate claims as one.
A result the paper reports from its own data — it cites no other source for it, so there is none to check. The quote shows it is in the paper.
In the paper
“In addition, we identified another point mutation within this domain that enhances cholesterol sensitivity without altering its PS sensitivity.”
- Also stated in: § Introduction · plain
“Converting this residue to the more hydrophobic leucine (G187L) made the GRAM domain hypersensitive to cholesterol without altering its affinity toward PS”
§ Molecular basis of accessible plasma membrane cholesterol recognition by the GRAM domain of GRAMD1b > Abstract
plaindirect- Asserted: passes — The authors put it forward as true.
- Checkable: passes — It can be checked against evidence.
- Load-bearing: passes — The paper’s conclusions depend on it.
- Based: passes — The paper gives a reason why it holds.
It may state two separate claims as one.
- Also stated in: § Introduction · plain
A result the paper reports from its own data — it cites no other source for it, so there is none to check. The quote shows it is in the paper.
In the paper
“Mutant GRAM1b (K161A, R191A, or K161A/R191A) bound significantly less to these liposomes compared to WT GRAM1b, with K161A/R191A showing the strongest impact.”
§ Molecular basis of accessible plasma membrane cholesterol recognition by the GRAM domain of GRAMD1b > Results > A basic patch within the GRAM domain of GRAMD1b is critical for anionic lipid recognition
plaindirect- Asserted: passes — The authors put it forward as true.
- Checkable: passes — It can be checked against evidence.
- Load-bearing: passes — The paper’s conclusions depend on it.
- Based: passes — The paper gives a reason why it holds.
It may state two separate claims as one.
A result the paper reports from its own data — it cites no other source for it, so there is none to check. The quote shows it is in the paper.
In the paper
“Amino acid sequence analysis indicated that a highly conserved lysine (K) in the 161st amino acid position in the β5‐β6 loop and a conserved arginine (R) in the 191st amino acid position in the C‐terminal α‐helix (α2) of GRAM1b may contribute to the charge distribution of the basic patch (Figs 2A and EV2B–D).”
§ Molecular basis of accessible plasma membrane cholesterol recognition by the GRAM domain of GRAMD1b > Results > A basic patch within the GRAM domain of GRAMD1b is critical for anionic lipid recognition
hedgedconditional- Asserted: passes — The authors put it forward as true.
- Checkable: passes — It can be checked against evidence.
- Load-bearing: passes — The paper’s conclusions depend on it.
- Based: passes — The paper gives a reason why it holds.
It may state two separate claims as one.
A result the paper reports from its own data — it cites no other source for it, so there is none to check. The quote shows it is in the paper.
In the paper
“We established a cell‐free reconstitution assay using purified near full‐length GRAMD1b proteins and artificial membranes and used this assay to demonstrate that GRAMD1b proteins with the R189W mutation failed to tether membranes and transported cholesterol less efficiently compared to wild‐type (WT) GRAMD1b proteins.”
§ Molecular basis of accessible plasma membrane cholesterol recognition by the GRAM domain of GRAMD1b > Introduction
boosteddirect- Asserted: passes — The authors put it forward as true.
- Checkable: passes — It can be checked against evidence.
- Load-bearing: passes — The paper’s conclusions depend on it.
- Based: passes — The paper gives a reason why it holds.
It may state two separate claims as one.
A result the paper reports from its own data — it cites no other source for it, so there is none to check. The quote shows it is in the paper.
In the paper
“In contrast, the same treatment failed to recruit anionic lipid‐sensing defective (K161A/R191A), cholesterol‐sensing defective (R189W) or cholesterol‐ and anionic lipid‐sensing defective (R189W/R191A) EGFP‐GRAM1b mutants (Fig 3F and G).”
§ Molecular basis of accessible plasma membrane cholesterol recognition by the GRAM domain of GRAMD1b > Results > Both cholesterol‐ and anionic lipid‐sensing properties are required for the GRAM domain of GRAMD1b to sense expansions of the accessible pool of PM cholesterol
plain- Asserted: passes — The authors put it forward as true.
- Checkable: passes — It can be checked against evidence.
- Load-bearing: passes — The paper’s conclusions depend on it.
- Based: passes — The paper gives a reason why it holds.
It may state two separate claims as one.
A result the paper reports from its own data — it cites no other source for it, so there is none to check. The quote shows it is in the paper.
In the paper
“For liposomes that contained 20% PS and 40% cholesterol, we measured ~40% binding for K161A and R191A, ~20% binding for K161A/R191A, and ~60% binding for WT (Fig 2D).”
§ Molecular basis of accessible plasma membrane cholesterol recognition by the GRAM domain of GRAMD1b > Results > A basic patch within the GRAM domain of GRAMD1b is critical for anionic lipid recognition
plain- Asserted: passes — The authors put it forward as true.
- Checkable: passes — It can be checked against evidence.
- Load-bearing: passes — The paper’s conclusions depend on it.
- Based: passes — The paper gives a reason why it holds.
It may state two separate claims as one.
In the paper
“We find that a mutation within the GRAM domain of GRAMD1b that is associated with intellectual disability in humans specifically impairs cholesterol sensing.”
- Also stated in: § Introduction · plain
“Remarkably, a GRAMD1b mutation (R189W), which has been associated with intellectual disability in humans, specifically reduces the ability of the GRAM domain to bind cholesterol without affecting its affinity toward PS”
§ Molecular basis of accessible plasma membrane cholesterol recognition by the GRAM domain of GRAMD1b > Abstract
What the sources say
- Not checked — no full text of the sourcecites Reuter et al, 2017 source
plaindirect- Asserted: passes — The authors put it forward as true.
- Checkable: passes — It can be checked against evidence.
- Load-bearing: passes — The paper’s conclusions depend on it.
- Based: passes — The paper gives a reason why it holds.
It may state two separate claims as one.
- Also stated in: § Introduction · plain
A result the paper reports from its own data — it cites no other source for it, so there is none to check. The quote shows it is in the paper.
In the paper
“Our results show that the GRAM domain of GRAMD1b possesses distinct but physically proximal lipid‐sensing sites and that one is dedicated to cholesterol and one is dedicated to anionic lipids.”
§ Molecular basis of accessible plasma membrane cholesterol recognition by the GRAM domain of GRAMD1b > Introduction
plain- Asserted: passes — The authors put it forward as true.
- Checkable: passes — It can be checked against evidence.
- Load-bearing: passes — The paper’s conclusions depend on it.
- Based: passes — The paper gives a reason why it holds.
It may state two separate claims as one.
A result the paper reports from its own data — it cites no other source for it, so there is none to check. The quote shows it is in the paper.
In the paper
“The GRAM domain of GRAMD1b detects the codistribution of accessible cholesterol and PS, which is regulated by sphingomyelin”
- Also stated in: § The GRAM domain of GRAMD1b detects the codistribution of accessible cholesterol and PS, which is regulated by sphingomyelin · plain
“Figure 1 The GRAM domain of GRAMD1b detects the codistribution of accessible cholesterol and PS, which is regulated by sphingomyelin”
§ Molecular basis of accessible plasma membrane cholesterol recognition by the GRAM domain of GRAMD1b > Results > The GRAM domain of GRAMD1b detects the codistribution of accessible cholesterol and PS, which is regulated by sphingomyelin
plaindirectn = 4- Asserted: passes — The authors put it forward as true.
- Checkable: passes — It can be checked against evidence.
- Load-bearing: passes — The paper’s conclusions depend on it.
- Based: passes — The paper gives a reason why it holds.
It may state two separate claims as one.
- Also stated in: § The GRAM domain of GRAMD1b detects the codistribution of accessible cholesterol and PS, which is regulated by sphingomyelin · plain
A result the paper reports from its own data — it cites no other source for it, so there is none to check. The quote shows it is in the paper.
In the paper
“The GRAM1b binds to liposomes that contain only cholesterol, but this binding requires high levels of cholesterol (Fig 2C).”
§ Molecular basis of accessible plasma membrane cholesterol recognition by the GRAM domain of GRAMD1b > Results > A GRAMD1b mutation (R189W) associated with intellectual disability specifically impairs binding of the GRAM domain to cholesterol
plaindirect- Asserted: passes — The authors put it forward as true.
- Checkable: passes — It can be checked against evidence.
- Load-bearing: passes — The paper’s conclusions depend on it.
- Based: passes — The paper gives a reason why it holds.
It may state two separate claims as one.
A result the paper reports from its own data — it cites no other source for it, so there is none to check. The quote shows it is in the paper.
In the paper
“Both GRAM1b (WT) and GRAM1b (G187L) proteins sense cholesterol accessibility.”
§ Molecular basis of accessible plasma membrane cholesterol recognition by the GRAM domain of GRAMD1b > Results > The GRAM domain of GRAMD1b detects the codistribution of accessible cholesterol and PS, which is regulated by sphingomyelin
plaindirectn = 3- Asserted: passes — The authors put it forward as true.
- Checkable: passes — It can be checked against evidence.
- Load-bearing: passes — The paper’s conclusions depend on it.
- Based: passes — The paper gives a reason why it holds.
It may state two separate claims as one.
A result the paper reports from its own data — it cites no other source for it, so there is none to check. The quote shows it is in the paper.
In the paper
“Additional incorporation of sphingomyelin (25%) into the liposomes reduced the FRET signals and increased ECFP fluorescence”
- Also stated in: § The GRAM domain of GRAMD1b detects the codistribution of accessible cholesterol and PS, which is regulated by sphingomyelin · plain
“FRET signal was decreased when sphingomyelin (SM) (25%) was additionally incorporated into the liposomes”
§ Molecular basis of accessible plasma membrane cholesterol recognition by the GRAM domain of GRAMD1b > Results > The GRAM domain of GRAMD1b detects the codistribution of accessible cholesterol and PS, which is regulated by sphingomyelin
plaindirectn = 4- Asserted: passes — The authors put it forward as true.
- Checkable: passes — It can be checked against evidence.
- Load-bearing: passes — The paper’s conclusions depend on it.
- Based: passes — The paper gives a reason why it holds.
It may state two separate claims as one.
- Also stated in: § The GRAM domain of GRAMD1b detects the codistribution of accessible cholesterol and PS, which is regulated by sphingomyelin · plain
A result the paper reports from its own data — it cites no other source for it, so there is none to check. The quote shows it is in the paper.
In the paper
“Cell‐free reconstitution and cell‐based assays revealed that the ability of the GRAM domain to sense accessible cholesterol regulates membrane tethering and determines the rate of cholesterol transport by GRAMD1b.”
- Also stated in: § Introduction · plain
“Thus, the cholesterol‐sensing property of the GRAM domain is critical for determining the rate of GRAMD1‐dependent cholesterol transport.”
§ Molecular basis of accessible plasma membrane cholesterol recognition by the GRAM domain of GRAMD1b > Abstract
plaindirect- Asserted: passes — The authors put it forward as true.
- Checkable: passes — It can be checked against evidence.
- Load-bearing: passes — The paper’s conclusions depend on it.
- Based: passes — The paper gives a reason why it holds.
It may state two separate claims as one.
- Also stated in: § Introduction · plain
A result the paper reports from its own data — it cites no other source for it, so there is none to check. The quote shows it is in the paper.
In the paper
“Mutant GRAMD1b proteins, carrying a GRAM domain that is defective in cholesterol sensing, failed to tether membranes and transported cholesterol much less efficiently in vitro compared to wild‐type GRAMD1b proteins.”
§ Molecular basis of accessible plasma membrane cholesterol recognition by the GRAM domain of GRAMD1b > Discussion
plaindirect- Asserted: passes — The authors put it forward as true.
- Checkable: passes — It can be checked against evidence.
- Load-bearing: passes — The paper’s conclusions depend on it.
- Based: passes — The paper gives a reason why it holds.
It may state two separate claims as one.
A result the paper reports from its own data — it cites no other source for it, so there is none to check. The quote shows it is in the paper.
In the paper
“For GRAM1b–G187L, results for these same liposomes were 0%, ~20%, and ~80% binding.”
§ Molecular basis of accessible plasma membrane cholesterol recognition by the GRAM domain of GRAMD1b > Results > The G187L mutation increases sensitivity of the GRAM domain to cholesterol without altering its affinity for PS
plain- Asserted: passes — The authors put it forward as true.
- Checkable: passes — It can be checked against evidence.
- Load-bearing: passes — The paper’s conclusions depend on it.
- Based: passes — The paper gives a reason why it holds.
It may state two separate claims as one.
A result the paper reports from its own data — it cites no other source for it, so there is none to check. The quote shows it is in the paper.
In the paper
“The GRAMD1b–R189W and GRAMD1b–R189W/R191A mutants were unable to tether membranes and could not transfer cholesterol between membranes in vitro (Fig 4).”
§ Molecular basis of accessible plasma membrane cholesterol recognition by the GRAM domain of GRAMD1b > Results > Cholesterol‐sensing property of the GRAM domain is critical for GRAMD1b function
plain- Asserted: passes — The authors put it forward as true.
- Checkable: passes — It can be checked against evidence.
- Load-bearing: passes — The paper’s conclusions depend on it.
- Based: passes — The paper gives a reason why it holds.
It may state two separate claims as one.
- Rests on an assumption: The PM-like and ER-like liposomes used in the in vitro transport assay mimic the lipid composition and properties of the plasma membrane and endoplasmic reticulum.
A result the paper reports from its own data — it cites no other source for it, so there is none to check. The quote shows it is in the paper.
In the paper
“Remarkably, the sensitivity of GRAMD1 TKO cells to Amphotericin B was much more reduced by expressing EGFP‐GRAMD1b–G187L compared to EGFP‐GRAMD1b–WT, making these cells highly resistant to this drug (Fig EV5H).”
§ Molecular basis of accessible plasma membrane cholesterol recognition by the GRAM domain of GRAMD1b > Results > G187 is critical for determining the sensitivity of the GRAM domain to accessible PM cholesterol and regulating GRAMD1b‐dependent cholesterol transport
plaindirect- Asserted: passes — The authors put it forward as true.
- Checkable: passes — It can be checked against evidence.
- Load-bearing: passes — The paper’s conclusions depend on it.
- Based: passes — The paper gives a reason why it holds.
It may state two separate claims as one.
A result the paper reports from its own data — it cites no other source for it, so there is none to check. The quote shows it is in the paper.
In the paper
“Our FRET‐based analysis of artificial membranes containing PC, PS, and cholesterol revealed the presence of cholesterol/PS codistribution, where cholesterol remained accessible.”
§ Molecular basis of accessible plasma membrane cholesterol recognition by the GRAM domain of GRAMD1b > Discussion
plaincorrelational- Asserted: passes — The authors put it forward as true.
- Checkable: passes — It can be checked against evidence.
- Load-bearing: passes — The paper’s conclusions depend on it.
- Based: passes — The paper gives a reason why it holds.
It may state two separate claims as one.
A result the paper reports from its own data — it cites no other source for it, so there is none to check. The quote shows it is in the paper.
In the paper
“Remarkably, sphingomyelinase treatment induced robust recruitment of EGFP‐GRAM1b–G187L/R191A to the PM at similar levels to EGFP‐GRAM1b, thereby restoring impaired PM binding of EGFP‐GRAM1b–R191A (Appendix Fig S4A–C).”
§ Molecular basis of accessible plasma membrane cholesterol recognition by the GRAM domain of GRAMD1b > Results > Identification of a novel GRAM domain mutation in GRAMD1b (G187L) that enhances its ability to sense accessible PM cholesterol
boosteddirect- Asserted: passes — The authors put it forward as true.
- Checkable: passes — It can be checked against evidence.
- Load-bearing: passes — The paper’s conclusions depend on it.
- Based: passes — The paper gives a reason why it holds.
It may state two separate claims as one.
A result the paper reports from its own data — it cites no other source for it, so there is none to check. The quote shows it is in the paper.
In the paper
“PM recruitment of mCherry‐GRAM1b following the treatment of GRAMD1 TKO cells with sphingomyelinase was suppressed by the re‐expression of EGFP‐GRAMD1b, but not by the re‐expression of EGFP‐GRAMD1b–R189W or EGFP‐GRAMD1b–R189W/R191A, as assessed by SDC microscopy (Fig 5B and C) or TIRF microscopy over time (Fig 5D).”
§ Molecular basis of accessible plasma membrane cholesterol recognition by the GRAM domain of GRAMD1b > Results > Cholesterol‐sensing property of the GRAM domain is critical for GRAMD1b function
plaindirect- Asserted: passes — The authors put it forward as true.
- Checkable: passes — It can be checked against evidence.
- Load-bearing: passes — The paper’s conclusions depend on it.
- Based: passes — The paper gives a reason why it holds.
It may state two separate claims as one.
A result the paper reports from its own data — it cites no other source for it, so there is none to check. The quote shows it is in the paper.
In the paper
“In contrast, binding of the GRAM domain to cholesterol‐containing membranes depends on R189 near the basic patch and the presence and stereospecificity of the hydroxyl head group and tetracyclic ring structure of cholesterol.”
§ Molecular basis of accessible plasma membrane cholesterol recognition by the GRAM domain of GRAMD1b > Discussion
plaindirect- Asserted: passes — The authors put it forward as true.
- Checkable: passes — It can be checked against evidence.
- Load-bearing: passes — The paper’s conclusions depend on it.
- Based: passes — The paper gives a reason why it holds.
It may state two separate claims as one.
A result the paper reports from its own data — it cites no other source for it, so there is none to check. The quote shows it is in the paper.
In the paper
“For liposomes that contained 60% of cholesterol (or 0% epicholesterol), ~35% of GRAM1b–G187L bound to liposomes, whereas ~15% of GRAM1b were bound (Fig EV4E).”
§ Molecular basis of accessible plasma membrane cholesterol recognition by the GRAM domain of GRAMD1b > Results > The G187L mutation increases sensitivity of the GRAM domain to cholesterol without altering its affinity for PS
plain- Asserted: passes — The authors put it forward as true.
- Checkable: passes — It can be checked against evidence.
- Load-bearing: passes — The paper’s conclusions depend on it.
- Based: passes — The paper gives a reason why it holds.
It may state two separate claims as one.
A result the paper reports from its own data — it cites no other source for it, so there is none to check. The quote shows it is in the paper.
In the paper
“The sensitivity of GRAMD1 TKO cells to Amphotericin B was dramatically reduced by re‐expressing EGFP‐GRAMD1b, but not by re‐expressing EGFP or EGFP‐GRAMD1b mutants (Fig 5F)”
§ Molecular basis of accessible plasma membrane cholesterol recognition by the GRAM domain of GRAMD1b > Results > Cholesterol‐sensing property of the GRAM domain is critical for GRAMD1b function
plaindirect- Asserted: passes — The authors put it forward as true.
- Checkable: passes — It can be checked against evidence.
- Load-bearing: passes — The paper’s conclusions depend on it.
- Based: passes — The paper gives a reason why it holds.
It may state two separate claims as one.
A result the paper reports from its own data — it cites no other source for it, so there is none to check. The quote shows it is in the paper.
In the paper
“Strikingly, GRAM domains carrying this intellectual disability‐associated missense mutation (R189W) are not able to sense cholesterol, but retain affinity for PS.”
§ Molecular basis of accessible plasma membrane cholesterol recognition by the GRAM domain of GRAMD1b > Discussion
plaindirect- Asserted: passes — The authors put it forward as true.
- Checkable: passes — It can be checked against evidence.
- Load-bearing: passes — The paper’s conclusions depend on it.
- Based: passes — The paper gives a reason why it holds.
It may state two separate claims as one.
A result the paper reports from its own data — it cites no other source for it, so there is none to check. The quote shows it is in the paper.
In the paper
“Surprisingly, the addition of GRAMD1b–R191A or GRAMD1b–K161A/R191A resulted in an increase in optical turbidity and robust DHE transfer from PM‐like to ER‐like liposomes over time, similar to GRAMD1b–WT (Appendix Fig S3C and D)”
§ Molecular basis of accessible plasma membrane cholesterol recognition by the GRAM domain of GRAMD1b > Results > Mutant versions of GRAMD1b that cannot sense cholesterol exhibit impairment in membrane tethering and cholesterol transport
plaindirect- Asserted: passes — The authors put it forward as true.
- Checkable: passes — It can be checked against evidence.
- Load-bearing: passes — The paper’s conclusions depend on it.
- Based: passes — The paper gives a reason why it holds.
It may state two separate claims as one.
- Rests on an assumption: The PM-like and ER-like liposomes used in the in vitro transport assay mimic the lipid composition and properties of the plasma membrane and endoplasmic reticulum.
A result the paper reports from its own data — it cites no other source for it, so there is none to check. The quote shows it is in the paper.
In the paper
“GRAM1b bound strongly to liposomes that contained 40–60% of cholesterol (or 20–0% epicholesterol), and the binding curve of GRAM1b–G187L was shifted again toward lower cholesterol concentrations (Fig EV4D).”
§ Molecular basis of accessible plasma membrane cholesterol recognition by the GRAM domain of GRAMD1b > Results > Identification of a novel GRAM domain mutation in GRAMD1b (G187L) that enhances its ability to sense accessible PM cholesterol
boostedcorrelational- Asserted: passes — The authors put it forward as true.
- Checkable: passes — It can be checked against evidence.
- Load-bearing: passes — The paper’s conclusions depend on it.
- Based: passes — The paper gives a reason why it holds.
It may state two separate claims as one.
A result the paper reports from its own data — it cites no other source for it, so there is none to check. The quote shows it is in the paper.
In the paper
“Replacing glycine with phenylalanine, methionine, isoleucine, leucine, valine, cysteine, or tryptophan all enhanced PM recruitment, whereas replacement with alanine or threonine had no effect.”
§ Molecular basis of accessible plasma membrane cholesterol recognition by the GRAM domain of GRAMD1b > Results > G187 is critical for determining the sensitivity of the GRAM domain to accessible PM cholesterol and regulating GRAMD1b‐dependent cholesterol transport
plaindirect- Asserted: passes — The authors put it forward as true.
- Checkable: passes — It can be checked against evidence.
- Load-bearing: passes — The paper’s conclusions depend on it.
- Based: passes — The paper gives a reason why it holds.
It may state two separate claims as one.
- Rests on an assumption: The modeled structure of the GRAM domain of GRAMD1b accurately represents the three-dimensional arrangement of the residues.
A result the paper reports from its own data — it cites no other source for it, so there is none to check. The quote shows it is in the paper.
In the paper
“and such phenotype was rescued by expressing EGFP‐GRAMD1b, but not by expressing EGFP (see above, Fig 5F).”
§ Molecular basis of accessible plasma membrane cholesterol recognition by the GRAM domain of GRAMD1b > Results > G187 is critical for determining the sensitivity of the GRAM domain to accessible PM cholesterol and regulating GRAMD1b‐dependent cholesterol transport
plaindirect- Asserted: passes — The authors put it forward as true.
- Checkable: passes — It can be checked against evidence.
- Load-bearing: passes — The paper’s conclusions depend on it.
- Based: passes — The paper gives a reason why it holds.
It may state two separate claims as one.
The paper states this without a source or data behind it here, so there is nothing to check it against. The quote shows it is in the paper.
In the paper
“Accordingly, mutant GRAMD1b proteins failed to rescue the accumulation of accessible PM cholesterol, as well as the dysregulation of SREBP2 activity, in cells lacking GRAMD1s.”
§ Molecular basis of accessible plasma membrane cholesterol recognition by the GRAM domain of GRAMD1b > Discussion
plain- Asserted: passes — The authors put it forward as true.
- Checkable: passes — It can be checked against evidence.
- Load-bearing: passes — The paper’s conclusions depend on it.
- Based: passes — The paper gives a reason why it holds.
It may state two separate claims as one.
A result the paper reports from its own data — it cites no other source for it, so there is none to check. The quote shows it is in the paper.
In the paper
“Interestingly, replacing glycine with less hydrophobic residues (serine, proline, or asparagine) reduced PM recruitment, whereas replacement with acidic amino acids (glutamic acid and aspartic acid) completely eliminated PM recruitment.”
§ Molecular basis of accessible plasma membrane cholesterol recognition by the GRAM domain of GRAMD1b > Results > G187 is critical for determining the sensitivity of the GRAM domain to accessible PM cholesterol and regulating GRAMD1b‐dependent cholesterol transport
plaindirect- Asserted: passes — The authors put it forward as true.
- Checkable: passes — It can be checked against evidence.
- Load-bearing: passes — The paper’s conclusions depend on it.
- Based: passes — The paper gives a reason why it holds.
It may state two separate claims as one.
- Rests on an assumption: The modeled structure of the GRAM domain of GRAMD1b accurately represents the three-dimensional arrangement of the residues.
A result the paper reports from its own data — it cites no other source for it, so there is none to check. The quote shows it is in the paper.
In the paper
“Importantly, treatment with methyl‐β‐cyclodextrin resulted in acute loss of PM binding in all versions, consistent with their specific interaction with PM cholesterol (Figs 7A and EV5A).”
§ Molecular basis of accessible plasma membrane cholesterol recognition by the GRAM domain of GRAMD1b > Results > G187 is critical for determining the sensitivity of the GRAM domain to accessible PM cholesterol and regulating GRAMD1b‐dependent cholesterol transport
plaindirect- Asserted: passes — The authors put it forward as true.
- Checkable: passes — It can be checked against evidence.
- Load-bearing: passes — The paper’s conclusions depend on it.
- Based: passes — The paper gives a reason why it holds.
It may state two separate claims as one.
A result the paper reports from its own data — it cites no other source for it, so there is none to check. The quote shows it is in the paper.
In the paper
“Converting key amino acid residues within the GRAM1b basic patch (K161, R191) to alanine drastically reduced the ability of the GRAM domain to sense anionic lipids, without altering its affinity for cholesterol.”
§ Molecular basis of accessible plasma membrane cholesterol recognition by the GRAM domain of GRAMD1b > Discussion
plaindirect- Asserted: passes — The authors put it forward as true.
- Checkable: passes — It can be checked against evidence.
- Load-bearing: passes — The paper’s conclusions depend on it.
- Based: passes — The paper gives a reason why it holds.
It may state two separate claims as one.
A result the paper reports from its own data — it cites no other source for it, so there is none to check. The quote shows it is in the paper.
In the paper
“Through a mini‐mutagenesis screen, we found that a single amino acid substitution (G187L) made GRAM1b hypersensitive to cholesterol without altering its sensitivity to PS.”
§ Molecular basis of accessible plasma membrane cholesterol recognition by the GRAM domain of GRAMD1b > Discussion
plaindirect- Asserted: passes — The authors put it forward as true.
- Checkable: passes — It can be checked against evidence.
- Load-bearing: passes — The paper’s conclusions depend on it.
- Based: passes — The paper gives a reason why it holds.
It may state two separate claims as one.
A result the paper reports from its own data — it cites no other source for it, so there is none to check. The quote shows it is in the paper.
In the paper
“In contrast, GRAMD1b proteins that were hypersensitive to cholesterol (G187L) exhibited increased membrane tethering and cholesterol transport.”
§ Molecular basis of accessible plasma membrane cholesterol recognition by the GRAM domain of GRAMD1b > Discussion
plaindirect- Asserted: passes — The authors put it forward as true.
- Checkable: passes — It can be checked against evidence.
- Load-bearing: passes — The paper’s conclusions depend on it.
- Based: passes — The paper gives a reason why it holds.
It may state two separate claims as one.
The paper states this without a source or data behind it here, so there is nothing to check it against. The quote shows it is in the paper.
In the paper
“Accordingly, GRAMD1b mutants that could not sense cholesterol (R189W or R189W/R191A) failed to tether membranes and transported cholesterol less efficiently.”
§ Molecular basis of accessible plasma membrane cholesterol recognition by the GRAM domain of GRAMD1b > Discussion
plaindirect- Asserted: passes — The authors put it forward as true.
- Checkable: passes — It can be checked against evidence.
- Load-bearing: passes — The paper’s conclusions depend on it.
- Based: passes — The paper gives a reason why it holds.
It may state two separate claims as one.
A result the paper reports from its own data — it cites no other source for it, so there is none to check. The quote shows it is in the paper.
In the paper
“We found that GRAM domains with the R189W mutation specifically impaired its binding to cholesterol without affecting its binding to PS and failed to bind to the PM even when levels of accessible cholesterol were elevated.”
§ Molecular basis of accessible plasma membrane cholesterol recognition by the GRAM domain of GRAMD1b > Discussion
plaindirect- Asserted: passes — The authors put it forward as true.
- Checkable: passes — It can be checked against evidence.
- Load-bearing: passes — The paper’s conclusions depend on it.
- Based: passes — The paper gives a reason why it holds.
It may state two separate claims as one.
A result the paper reports from its own data — it cites no other source for it, so there is none to check. The quote shows it is in the paper.
In the paper
“Finally, using various in vitro and in vivo assays, we showed that G187L mutation results in GRAM domains that are hypersensitive to accessible cholesterol, while maintaining affinity for PS.”
§ Molecular basis of accessible plasma membrane cholesterol recognition by the GRAM domain of GRAMD1b > Discussion
boosteddirect- Asserted: passes — The authors put it forward as true.
- Checkable: passes — It can be checked against evidence.
- Load-bearing: passes — The paper’s conclusions depend on it.
- Based: passes — The paper gives a reason why it holds.
It may state two separate claims as one.
A conclusion the paper draws from its own results — it cites no other source for it, so there is none to check. The quote shows it is in the paper.
In the paper
“This suggests a critical role for the basic patch in detecting PS and possibly other anionic lipids in membranes.”
§ Molecular basis of accessible plasma membrane cholesterol recognition by the GRAM domain of GRAMD1b > Results > A basic patch within the GRAM domain of GRAMD1b is critical for anionic lipid recognition
hedgeddirect- Asserted: passes — The authors put it forward as true.
- Checkable: passes — It can be checked against evidence.
- Load-bearing: passes — The paper’s conclusions depend on it.
- Based: passes — The paper gives a reason why it holds.
It may state two separate claims as one.
A conclusion the paper draws from its own results — it cites no other source for it, so there is none to check. The quote shows it is in the paper.
In the paper
“Taken together, these results strongly imply that GRAM1b detects the codistribution of accessible cholesterol and anionic lipids, including PS, within the inner leaflet of the PM, which occurs most prominently when the accessible pool of cholesterol in this bilayer expands (Fig 1F).”
§ Molecular basis of accessible plasma membrane cholesterol recognition by the GRAM domain of GRAMD1b > Results > The GRAM domain of GRAMD1b detects the codistribution of accessible cholesterol and PS, which is regulated by sphingomyelin
boostedcorrelational- Asserted: passes — The authors put it forward as true.
- Checkable: passes — It can be checked against evidence.
- Load-bearing: passes — The paper’s conclusions depend on it.
- Based: passes — The paper gives a reason why it holds.
It may state two separate claims as one.
A conclusion the paper draws from its own results — it cites no other source for it, so there is none to check. The quote shows it is in the paper.
In the paper
“Thus, the R189W mutation specifically impaired the ability of GRAM1b to sense cholesterol without affecting its affinity for PS.”
§ Molecular basis of accessible plasma membrane cholesterol recognition by the GRAM domain of GRAMD1b > Results > A GRAMD1b mutation (R189W) associated with intellectual disability specifically impairs binding of the GRAM domain to cholesterol
plaindirect- Asserted: passes — The authors put it forward as true.
- Checkable: passes — It can be checked against evidence.
- Load-bearing: passes — The paper’s conclusions depend on it.
- Based: passes — The paper gives a reason why it holds.
It may state two separate claims as one.
None of the sources cited for this claim have been checked yet.
In the paper
“GRAMD1s then extract accessible PM cholesterol for transport to the ER via the StART‐like domain, which can directly capture and transport sterol across the cytoplasm (Gatta et al, 2018; Horenkamp et al, 2018; Jentsch et al, 2018; Sandhu et al, 2018; Tong et al, 2018; Khelashvili et al, 2019; Naito et al, 2019).”
§ Molecular basis of accessible plasma membrane cholesterol recognition by the GRAM domain of GRAMD1b > Introduction
What the sources say
- Not checked yetcites Gatta et al, 2018 source
Checked before — its earlier verdict is held back until a new check runs.
- Not checked — no full text of the sourcecites Horenkamp et al, 2018 source
- Not checked yetcites Jentsch et al, 2018 source
Checked before — its earlier verdict is held back until a new check runs.
plaindirect- Asserted: passes — The authors put it forward as true.
- Checkable: passes — It can be checked against evidence.
- Load-bearing: passes — The paper’s conclusions depend on it.
- Based: passes — The paper gives a reason why it holds.
It may state two separate claims as one.
- Not checked yet
A conclusion the paper draws from its own results — it cites no other source for it, so there is none to check. The quote shows it is in the paper.
In the paper
“Mutations within the GRAM1b basic patch (K161A and R191A) specifically impaired anionic lipid binding (Fig 2C–E), whereas the R189W mutation specifically impaired cholesterol binding (Fig 3D and E).”
§ Molecular basis of accessible plasma membrane cholesterol recognition by the GRAM domain of GRAMD1b > Results > A GRAMD1b mutation (R189W) associated with intellectual disability specifically impairs binding of the GRAM domain to cholesterol
plaindirect- Asserted: passes — The authors put it forward as true.
- Checkable: passes — It can be checked against evidence.
- Load-bearing: passes — The paper’s conclusions depend on it.
- Based: passes — The paper gives a reason why it holds.
It may state two separate claims as one.
A conclusion the paper draws from its own results — it cites no other source for it, so there is none to check. The quote shows it is in the paper.
In the paper
“These results demonstrate that the binding of GRAM1b to cholesterol‐containing membranes is specific and depends on the stereospecificity of the hydroxyl head group and the tetracyclic ring structure.”
§ Molecular basis of accessible plasma membrane cholesterol recognition by the GRAM domain of GRAMD1b > Results > A GRAMD1b mutation (R189W) associated with intellectual disability specifically impairs binding of the GRAM domain to cholesterol
boosteddirect- Asserted: passes — The authors put it forward as true.
- Checkable: passes — It can be checked against evidence.
- Load-bearing: passes — The paper’s conclusions depend on it.
- Based: passes — The paper gives a reason why it holds.
It may state two separate claims as one.
None of the sources cited for this claim have been checked yet.
In the paper
“Cells respond by rapidly transporting the newly expanded pool of accessible cholesterol to the ER to suppress the activities of SREBPs, shutting down cholesterol biosynthesis and uptake, thereby avoiding cholesterol overaccumulation and maintaining PM cholesterol levels”
§ Molecular basis of accessible plasma membrane cholesterol recognition by the GRAM domain of GRAMD1b > Introduction
What the sources say
- Not checked yetcites Slotte & Bierman, 1988 source
Checked before — its earlier verdict is held back until a new check runs.
- Not checked yetcites Lange & Steck, 1997 source
Checked before — its earlier verdict is held back until a new check runs.
- Not checked yetcites Scheek et al, 1997 source
Checked before — its earlier verdict is held back until a new check runs.
plaindirect- Asserted: passes — The authors put it forward as true.
- Checkable: passes — It can be checked against evidence.
- Load-bearing: passes — The paper’s conclusions depend on it.
- Based: passes — The paper gives a reason why it holds.
It may state two separate claims as one.
- Not checked yet
A claim is checked only against the cited paper’s full text, never its abstract, and none is available for its sources.
In the paper
“Normally, the majority of PM cholesterol forms complexes with other membrane lipids, including sphingomyelin and phospholipids, and is therefore sequestered and inaccessible for intracellular transport (also known as “chemically inactive”)”
- Also stated in: § The GRAM domain of GRAMD1b detects the codistribution of accessible cholesterol and PS, which is regulated by sphingomyelin · plain
“Cholesterol forms complexes with other lipids, including phospholipids and sphingomyelin. The formation of these complexes contributes to the sequestration of cholesterol, making it inaccessible in membranes.”
§ Molecular basis of accessible plasma membrane cholesterol recognition by the GRAM domain of GRAMD1b > Introduction
What the sources say
plaindirect- Asserted: passes — The authors put it forward as true.
- Checkable: passes — It can be checked against evidence.
- Load-bearing: passes — The paper’s conclusions depend on it.
- Based: passes — The paper gives a reason why it holds.
It may state two separate claims as one.
- Also stated in: § The GRAM domain of GRAMD1b detects the codistribution of accessible cholesterol and PS, which is regulated by sphingomyelin · plain
A conclusion the paper draws from its own results — it cites no other source for it, so there is none to check. The quote shows it is in the paper.
In the paper
“Our mutagenesis study suggested that GRAM1b binds the acidic head group of anionic lipids, including PS, via its positively charged surface present at the β5‐β6 and β7‐α2 loops (i.e., the basic patch) and binds cholesterol through other amino acid(s) that are close to the basic patch (Fig 7F).”
§ Molecular basis of accessible plasma membrane cholesterol recognition by the GRAM domain of GRAMD1b > Discussion
hedgeddirect- Asserted: passes — The authors put it forward as true.
- Checkable: passes — It can be checked against evidence.
- Load-bearing: passes — The paper’s conclusions depend on it.
- Based: passes — The paper gives a reason why it holds.
It may state two separate claims as one.
A conclusion the paper draws from its own results — it cites no other source for it, so there is none to check. The quote shows it is in the paper.
In the paper
“Further, our data show that this function requires a GRAM domain that can sense accessible cholesterol, which is essential for the recruitment of GRAMD1 to ER‐PM contact sites.”
§ Molecular basis of accessible plasma membrane cholesterol recognition by the GRAM domain of GRAMD1b > Results > Cholesterol‐sensing property of the GRAM domain is critical for GRAMD1b function
plaindirect- Asserted: passes — The authors put it forward as true.
- Checkable: passes — It can be checked against evidence.
- Load-bearing: passes — The paper’s conclusions depend on it.
- Based: passes — The paper gives a reason why it holds.
It may state two separate claims as one.
A conclusion the paper draws from its own results — it cites no other source for it, so there is none to check. The quote shows it is in the paper.
In the paper
“G187 is critical for determining the sensitivity of the GRAM domain to accessible PM cholesterol, while K161 and R191 contribute to a basic patch of the GRAM domain that is required for sensing anionic lipids, including PS.”
§ Molecular basis of accessible plasma membrane cholesterol recognition by the GRAM domain of GRAMD1b > Results > G187 is critical for determining the sensitivity of the GRAM domain to accessible PM cholesterol and regulating GRAMD1b‐dependent cholesterol transport
plaindirect- Asserted: passes — The authors put it forward as true.
- Checkable: passes — It can be checked against evidence.
- Load-bearing: passes — The paper’s conclusions depend on it.
- Based: passes — The paper gives a reason why it holds.
It may state two separate claims as one.
- Rests on an assumption: The modeled structure of the GRAM domain of GRAMD1b accurately represents the three-dimensional arrangement of the residues.
A conclusion the paper draws from its own results — it cites no other source for it, so there is none to check. The quote shows it is in the paper.
In the paper
“Our results are consistent with the presence of two distinct ligand binding sites within GRAM1b, one for binding anionic lipids and the other for binding cholesterol.”
§ Molecular basis of accessible plasma membrane cholesterol recognition by the GRAM domain of GRAMD1b > Discussion
hedgedcorrelational- Asserted: passes — The authors put it forward as true.
- Checkable: passes — It can be checked against evidence.
- Load-bearing: passes — The paper’s conclusions depend on it.
- Based: passes — The paper gives a reason why it holds.
It may state two separate claims as one.
In the paper
“The simultaneous binding of two lipids to an individual domain occurs synergistically when both lipids are present in the target membrane (Lemmon, 2008).”
§ Molecular basis of accessible plasma membrane cholesterol recognition by the GRAM domain of GRAMD1b > Discussion
What the sources say
- Not checked — no full text of the sourcecites Lemmon, 2008 source
plaindirect- Asserted: passes — The authors put it forward as true.
- Checkable: passes — It can be checked against evidence.
- Load-bearing: passes — The paper’s conclusions depend on it.
- Based: passes — The paper gives a reason why it holds.
Probably not a substantial claim.
A conclusion the paper draws from its own results — it cites no other source for it, so there is none to check. The quote shows it is in the paper.
In the paper
“Thus, the G187L mutation resulted in both increased membrane tethering and enhanced cholesterol transfer by GRAMD1b.”
§ Molecular basis of accessible plasma membrane cholesterol recognition by the GRAM domain of GRAMD1b > Results > G187 is critical for determining the sensitivity of the GRAM domain to accessible PM cholesterol and regulating GRAMD1b‐dependent cholesterol transport
plaindirect- Asserted: passes — The authors put it forward as true.
- Checkable: passes — It can be checked against evidence.
- Load-bearing: passes — The paper’s conclusions depend on it.
- Based: passes — The paper gives a reason why it holds.
It may state two separate claims as one.
- Rests on an assumption: The rate of DHE transfer between liposomes reflects the rate of cholesterol transfer by GRAMD1b.
A conclusion the paper draws from its own results — it cites no other source for it, so there is none to check. The quote shows it is in the paper.
In the paper
“Thus, the G187L mutation made the GRAM domain more sensitive to cholesterol without increasing its sensitivity to PS.”
§ Molecular basis of accessible plasma membrane cholesterol recognition by the GRAM domain of GRAMD1b > Results > The G187L mutation increases sensitivity of the GRAM domain to cholesterol without altering its affinity for PS
plaindirect- Asserted: passes — The authors put it forward as true.
- Checkable: passes — It can be checked against evidence.
- Load-bearing: passes — The paper’s conclusions depend on it.
- Based: passes — The paper gives a reason why it holds.
It may state two separate claims as one.
A conclusion the paper draws from its own results — it cites no other source for it, so there is none to check. The quote shows it is in the paper.
In the paper
“Our study identified amino acid residues that are important for cholesterol sensing (G187, R189) and anionic lipid sensing (K161, R191) of the GRAM domain.”
§ Molecular basis of accessible plasma membrane cholesterol recognition by the GRAM domain of GRAMD1b > Results > G187 is critical for determining the sensitivity of the GRAM domain to accessible PM cholesterol and regulating GRAMD1b‐dependent cholesterol transport
plaincorrelational- Asserted: passes — The authors put it forward as true.
- Checkable: passes — It can be checked against evidence.
- Load-bearing: passes — The paper’s conclusions depend on it.
- Based: passes — The paper gives a reason why it holds.
It may state two separate claims as one.
- Rests on an assumption: The modeled structure of the GRAM domain of GRAMD1b accurately represents the three-dimensional arrangement of the residues.
A conclusion the paper draws from its own results — it cites no other source for it, so there is none to check. The quote shows it is in the paper.
In the paper
“consistent with the critical role of G187 in determining sensitivity of the GRAM domain to accessible PM cholesterol and in promoting tethering of the ER to the PM”
§ Molecular basis of accessible plasma membrane cholesterol recognition by the GRAM domain of GRAMD1b > Results > G187 is critical for determining the sensitivity of the GRAM domain to accessible PM cholesterol and regulating GRAMD1b‐dependent cholesterol transport
plaindirect- Asserted: passes — The authors put it forward as true.
- Checkable: passes — It can be checked against evidence.
- Load-bearing: passes — The paper’s conclusions depend on it.
- Based: passes — The paper gives a reason why it holds.
It may state two separate claims as one.
A conclusion the paper draws from its own results — it cites no other source for it, so there is none to check. The quote shows it is in the paper.
In the paper
“R191A and K161A/R191A mutations strongly impair the property of the isolated GRAM domain to sense anionic lipids in vitro; these mutations also impair the ability of the GRAM domain to interact with the PM in vivo (Figs 2C and D, and 3F–H, Appendix Fig S1C).”
§ Molecular basis of accessible plasma membrane cholesterol recognition by the GRAM domain of GRAMD1b > Results > Mutant versions of GRAMD1b that cannot sense cholesterol exhibit impairment in membrane tethering and cholesterol transport
boosteddirect- Asserted: passes — The authors put it forward as true.
- Checkable: passes — It can be checked against evidence.
- Load-bearing: passes — The paper’s conclusions depend on it.
- Based: passes — The paper gives a reason why it holds.
It may state two separate claims as one.
A conclusion the paper draws from its own results — it cites no other source for it, so there is none to check. The quote shows it is in the paper.
In the paper
“An intellectual disability‐associated R189W mutation, which specifically results in cholesterol‐sensing defect, impairs the GRAM domain’s ability to sense transient expansions of the accessible pool of PM cholesterol and abolishes GRAMD1b‐mediated PM to ER cholesterol transport.”
§ Molecular basis of accessible plasma membrane cholesterol recognition by the GRAM domain of GRAMD1b > Results > G187 is critical for determining the sensitivity of the GRAM domain to accessible PM cholesterol and regulating GRAMD1b‐dependent cholesterol transport
plaindirect- Asserted: passes — The authors put it forward as true.
- Checkable: passes — It can be checked against evidence.
- Load-bearing: passes — The paper’s conclusions depend on it.
- Based: passes — The paper gives a reason why it holds.
It may state two separate claims as one.
A conclusion the paper draws from its own results — it cites no other source for it, so there is none to check. The quote shows it is in the paper.
In the paper
“suggesting efficient membrane tethering and cholesterol transport mediated by these mutant near full‐length GRAMD1b proteins in vitro.”
§ Molecular basis of accessible plasma membrane cholesterol recognition by the GRAM domain of GRAMD1b > Results > Mutant versions of GRAMD1b that cannot sense cholesterol exhibit impairment in membrane tethering and cholesterol transport
hedgeddirect- Asserted: passes — The authors put it forward as true.
- Checkable: passes — It can be checked against evidence.
- Load-bearing: passes — The paper’s conclusions depend on it.
- Based: passes — The paper gives a reason why it holds.
It may state two separate claims as one.
- Rests on an assumption: The PM-like and ER-like liposomes used in the in vitro transport assay mimic the lipid composition and properties of the plasma membrane and endoplasmic reticulum.
A conclusion the paper draws from its own results — it cites no other source for it, so there is none to check. The quote shows it is in the paper.
In the paper
“Collectively, our results demonstrate an essential role for the cholesterol‐sensing property of the GRAM domain in facilitating membrane tethering and in determining the rate of GRAMD1‐mediated cholesterol transfer.”
§ Molecular basis of accessible plasma membrane cholesterol recognition by the GRAM domain of GRAMD1b > Results > G187 is critical for determining the sensitivity of the GRAM domain to accessible PM cholesterol and regulating GRAMD1b‐dependent cholesterol transport
boosteddirect- Asserted: passes — The authors put it forward as true.
- Checkable: passes — It can be checked against evidence.
- Load-bearing: passes — The paper’s conclusions depend on it.
- Based: passes — The paper gives a reason why it holds.
It may state two separate claims as one.
A conclusion the paper draws from its own results — it cites no other source for it, so there is none to check. The quote shows it is in the paper.
In the paper
“These results demonstrate that GRAM1b–G187L retains the ability to sense accessible cholesterol in membranes, and that it does so more efficiently than GRAM1b.”
§ Molecular basis of accessible plasma membrane cholesterol recognition by the GRAM domain of GRAMD1b > Results > The G187L mutation increases sensitivity of the GRAM domain to cholesterol without altering its affinity for PS
boosteddirect- Asserted: passes — The authors put it forward as true.
- Checkable: passes — It can be checked against evidence.
- Load-bearing: passes — The paper’s conclusions depend on it.
- Based: passes — The paper gives a reason why it holds.
It may state two separate claims as one.
A conclusion the paper draws from its own results — it cites no other source for it, so there is none to check. The quote shows it is in the paper.
In the paper
“demonstrating that GRAMD1b plays a direct role in modulating sensitivity of the PM to Amphotericin B, and that this function requires a GRAM domain that can sense accessible PM cholesterol.”
§ Molecular basis of accessible plasma membrane cholesterol recognition by the GRAM domain of GRAMD1b > Results > Cholesterol‐sensing property of the GRAM domain is critical for GRAMD1b function
boosteddirect- Asserted: passes — The authors put it forward as true.
- Checkable: passes — It can be checked against evidence.
- Load-bearing: passes — The paper’s conclusions depend on it.
- Based: passes — The paper gives a reason why it holds.
It may state two separate claims as one.
A conclusion the paper draws from its own results — it cites no other source for it, so there is none to check. The quote shows it is in the paper.
In the paper
“thus making it difficult to effectively assess enhanced accessible cholesterol transport of EGFP‐GRAMD1b–G187L (compared to EGFP‐GRAMD1b–WT) that may occur on a shorter time scale, by this approach.”
§ Molecular basis of accessible plasma membrane cholesterol recognition by the GRAM domain of GRAMD1b > Results > G187 is critical for determining the sensitivity of the GRAM domain to accessible PM cholesterol and regulating GRAMD1b‐dependent cholesterol transport
hedgedconditional- Asserted: passes — The authors put it forward as true.
- Checkable: passes — It can be checked against evidence.
- Load-bearing: passes — The paper’s conclusions depend on it.
- Based: passes — The paper gives a reason why it holds.
The quote only partly states this claim.
What the paper did — it cites no source for this, so there is none to check. The quote shows it is in the paper.
In the paper
“No statistical method was used to predetermine sample size, and the experiments were not randomized for live cell imaging.”
§ Molecular basis of accessible plasma membrane cholesterol recognition by the GRAM domain of GRAMD1b > Materials and Methods > Statistical analysis
plain- Asserted: passes — The authors put it forward as true.
- Checkable: passes — It can be checked against evidence.
- Load-bearing: fails — The paper’s conclusions may not depend on it.
- Based: passes — The paper gives a reason why it holds.
Probably not a substantial claim. The paper’s conclusions may not depend on it.
What the paper did — it cites no source for this, so there is none to check. The quote shows it is in the paper.
In the paper
“The initial increase in turbidity could not be captured due to the time lag (~30 s) between the time when the mixture of liposomes and purified proteins were aliquoted into individual wells of a 96‐well plate and the time when the plate reader started to read the optical turbidity of individual wells.”
§ Molecular basis of accessible plasma membrane cholesterol recognition by the GRAM domain of GRAMD1b > Materials and Methods > Biochemical analyses
plaindirect- Asserted: passes — The authors put it forward as true.
- Checkable: passes — It can be checked against evidence.
- Load-bearing: fails — The paper’s conclusions may not depend on it.
- Based: passes — The paper gives a reason why it holds.
Probably not a substantial claim. The paper’s conclusions may not depend on it.
What the paper did — it cites no source for this, so there is none to check. The quote shows it is in the paper.
In the paper
“Wild‐type and genome‐edited HeLa cell lines were routinely verified as free of mycoplasma contamination at least every 2 months, using MycoGuard Mycoplasma PCR Detection Kit (Genecopoeia).”
§ Molecular basis of accessible plasma membrane cholesterol recognition by the GRAM domain of GRAMD1b > Materials and Methods > Cell culture and transfection
plain- Asserted: passes — The authors put it forward as true.
- Checkable: passes — It can be checked against evidence.
- Load-bearing: fails — The paper’s conclusions may not depend on it.
- Based: passes — The paper gives a reason why it holds.
Probably not a substantial claim. The paper’s conclusions may not depend on it.
What the paper did — it cites no source for this, so there is none to check. The quote shows it is in the paper.
In the paper
“No cell lines used in this study were found in the database of commonly misidentified cell lines that is maintained by ICLAC and NCBI Biosample.”
§ Molecular basis of accessible plasma membrane cholesterol recognition by the GRAM domain of GRAMD1b > Materials and Methods > Cell culture and transfection
plain- Asserted: passes — The authors put it forward as true.
- Checkable: passes — It can be checked against evidence.
- Load-bearing: fails — The paper’s conclusions may not depend on it.
- Based: passes — The paper gives a reason why it holds.
Probably not a substantial claim. The paper’s conclusions may not depend on it.
None of the sources cited for this claim have been checked yet.
In the paper
“Interestingly, knocking out GRAMD1b in zebrafish results in reduced brain activity (Thyme et al, 2019).”
§ Molecular basis of accessible plasma membrane cholesterol recognition by the GRAM domain of GRAMD1b > Discussion
What the sources say
- Not checked yetcites Thyme et al, 2019 source
Checked before — its earlier verdict is held back until a new check runs.
plaindirect- Asserted: passes — The authors put it forward as true.
- Checkable: passes — It can be checked against evidence.
- Load-bearing: fails — The paper’s conclusions may not depend on it.
- Based: passes — The paper gives a reason why it holds.
Probably not a substantial claim. The paper’s conclusions may not depend on it.
- Not checked yet
What the paper did — it cites no source for this, so there is none to check. The quote shows it is in the paper.
In the paper
“No statistical method was used to predetermine sample size, and the experiments were not randomized for live cell imaging.”
§ Molecular basis of accessible plasma membrane cholesterol recognition by the GRAM domain of GRAMD1b > Materials and Methods > Statistical analysis
plain- Asserted: passes — The authors put it forward as true.
- Checkable: passes — It can be checked against evidence.
- Load-bearing: fails — The paper’s conclusions may not depend on it.
- Based: passes — The paper gives a reason why it holds.
Probably not a substantial claim. The paper’s conclusions may not depend on it.
In the paper
“Similarly, the C2 domain of PKCα binds synergistically to PI(4,5)P2 and PS (Guerrero‐Valero et al, 2009).”
§ Molecular basis of accessible plasma membrane cholesterol recognition by the GRAM domain of GRAMD1b > Discussion
What the sources say
- Not checked — no full text of the sourcecites Guerrero‐Valero et al, 2009 source
plaincorrelational- Asserted: passes — The authors put it forward as true.
- Checkable: passes — It can be checked against evidence.
- Load-bearing: fails — The paper’s conclusions may not depend on it.
- Based: passes — The paper gives a reason why it holds.
Probably not a substantial claim. The paper’s conclusions may not depend on it.
The paper relies on this without support.
How cells sense the accessibility of plasma membrane cholesterol and regulate cholesterol transport from the plasma membrane to the endoplasmic reticulum is poorly understood.
“Despite its critical importance, how cells sense the accessibility of PM cholesterol and regulate cholesterol transport from the PM to the ER is still poorly understood.”
The paper relies on this without support.
The precise mechanism by which GRAM domains sense transient expansions in the accessible pool of plasma membrane cholesterol and the impact of the intellectual disability-associated missense mutation on GRAMD1b function remain unknown.
“However, the precise mechanism by which GRAM domains sense transient expansions in the accessible pool of PM cholesterol and the impact that the intellectual disability‐associated missense mutation has on GRAMD1b function both remain unknown.”
The paper relies on this without support.
Sites within the GRAM domain that bind anionic lipids are currently unknown.
“However, sites within the GRAM domain that bind these anionic lipids are currently unknown.”
The paper relies on this without support.
It remains unclear how GRAMD1 GRAM domains bind most efficiently to membranes that contain both cholesterol and anionic lipids.
“It also remains unclear how GRAMD1 GRAM domains bind most efficiently to membranes that contain both cholesterol and anionic lipids.”
The paper relies on this without support.
The structural model of GRAM1b based on the Lam6/Ltc1 GRAM domain accurately represents the structure of GRAM1b.
“We constructed a structural model of GRAM1b using the crystal structure for the GRAM domain of Lam6/Ltc1, a homolog of GRAMD1s in yeast (Fig EV2A and B), as a template (Tong et al, 2018).”
The paper relies on this without support.
The PM-like and ER-like liposomes used in the in vitro transport assay mimic the lipid composition and properties of the plasma membrane and endoplasmic reticulum.
“We prepared: (i) PM‐like donor liposomes (LPM) that contained PS, cholesterol, Dansyl‐PE (DNS‐PE), and DHE (a fluorescent analog of cholesterol), and (ii) ER‐like acceptor liposomes (LER) that contained Nickel‐labeled lipids (DGS‐NTA) (see Materials and Methods) (Fig 4A).”
The paper relies on this without support.
The mCherry-D4H protein specifically binds accessible PM cholesterol.
“Cells were stained with recombinant mCherry–D4H proteins (10 mg/ml) (accessible PM cholesterol biosensor) for 15 min at room temperature before imaging.”
The paper relies on this without support.
The rate of DHE transfer between liposomes reflects the rate of cholesterol transfer by GRAMD1b.
“DHE transfer between liposomes by purified GRAMD1b proteins.”
The paper relies on this without support.
The modeled structure of the GRAM domain of GRAMD1b accurately represents the three-dimensional arrangement of the residues.
“Close‐up view of the ribbon diagram of the modeled GRAM domain of GRAMD1b (GRAM1b) showing amino acid side chains of R189 and other amino acids, lying in the ~4–14 Å vicinity of R189, that were mutated in mini‐mutagenesis screen as shown in (B).”
The paper relies on this without support.
The molecular basis for the synergistic binding of GRAM domains to membranes containing both cholesterol and anionic lipids was unclear before this study.
“However, the molecular basis for the synergistic binding of GRAM domains to membranes that contain both cholesterol and anionic lipids remained unclear.”
The paper relies on this without support.
The R189W mutation in GRAM1b is linked to intellectual disability in humans.
“Recent human genetic studies identified a missense mutation in GRAM1b that is linked to intellectual disability.”
“Importantly, the R189W mutation is associated with intellectual disability in humans.”
The paper relies on this without support.
GRAMD1s are conserved from yeast to humans.
“Because GRAMD1s are conserved from yeast to humans”
Claims other papers make about this one
Each is checked against this paper’s own text: does it say what the citing paper says it does?
The source backs part of the claim, not all of it — or backs it for a different population, condition or comparison.
In the citing paper
“the known ability of Asters to bind to other anionic lipids suggests that one or more of these lipids may be able to maintain some Aster function when PS is severely deficient.”
From Interplay between Asters/GRAMD1s and phosphatidylserine in intermembrane transport of LDL cholesterol (2022) · cites this paper as [11]
Experimental — accuracy not yet measuredThe source backs part of the claim, not all of it — or backs it for a different population, condition or comparison.
In the citing paper
“Previous studies from the laboratories of Tontonoz and coworkers (8, 9) and Saheki and coworkers (10, 11) demonstrated that Aster proteins are required for the transport of cholesterol from the PM to the ER when cholesterol is delivered directly to the PM by incubation with cholesterol/MCD complexes or when it is liberated within the membrane by sphingomyelinase treatment.”
From Interplay between Asters/GRAMD1s and phosphatidylserine in intermembrane transport of LDL cholesterol (2022) · cites this paper as [11]
Experimental — accuracy not yet measuredThe cited source says what the claim attributes to it.
In the citing paper
“GRAM Domain Containing 1B (GRAMD1B), a nonvesicular cholesterol transporter”
From GRAMD1B is a regulator of lipid homeostasis, autophagic flux and phosphorylated tau (2025) · cites this paper as [39]
The cited source says what the claim attributes to it.
In the citing paper
“Importantly, an evolutionarily conserved family of lipid transfer proteins (e.g., Aster proteins encoded by GRAMD1A, GRAMD1B, and GRAMD1C) play a role in the rapid and selective delivery of lipids via nonvesicular transport in response to high cell membrane cholesterol39.”
From GRAMD1B is a regulator of lipid homeostasis, autophagic flux and phosphorylated tau (2025) · cites this paper as [39]
Self-check
Percentages, sums and reported differences re-computed from the paper’s own numbers.
Each contradiction between two passages listed here was confirmed by an independent check.
Rated minor: it would not touch a result — a value no result rests on, a p-value that stays on the same side of the significance level, or a conflict that is clerical, resolved elsewhere in the paper, or outside its own findings.
In the paper
§ Molecular basis of accessible plasma membrane cholesterol recognition by the GRAM domain of GRAMD1b > Results > G187 is critical for determining the sensitivity of the GRAM domain to accessible PM cholesterol and regulating GRAMD1b‐dependent cholesterol transport
“Cells were stained with recombinant mCherry–D4H proteins (10 mg/ml) (accessible PM cholesterol biosensor) for 15 min at room temperature before imaging.”
§ Molecular basis of accessible plasma membrane cholesterol recognition by the GRAM domain of GRAMD1b > Materials and Methods > Plasma membrane binding of the recombinant mCherry‐D4H proteins
“incubated with the same imaging buffer that contained purified mCherry‐D4H proteins (10 μg/ml) for 15 min at room temperature.”
Citations
Cites
WebLogo: A Sequence Logo Generator: Figure 1Preprint
Crooks, G. E., Hon, G. C., Chandonia, J., & Brenner, S. E. (2004) · Genome Research · doi:10.1101/gr.849004 · Cited by 12,480
Biological insights from 108 schizophrenia-associated genetic loci
Schizophrenia Working Group of the Psychiatric Genomics Consortium (2014) · Nature · doi:10.1038/nature13595 · Cited by 7,577
Membrane lipids: where they are and how they behave
van Meer, G., Voelker, D. R., & Feigenson, G. W. (2008) · Nature Reviews Molecular Cell Biology · doi:10.1038/nrm2330 · Cited by 7,157
Deciphering key features in protein structures with the new ENDscript server
Robert, X., & Gouet, P. (2014) · Nucleic Acids Research · doi:10.1093/nar/gku316 · Cited by 7,053
Regulation of the mevalonate pathway
Goldstein, J. L., & Brown, M. S. (1990) · Nature · doi:10.1038/343425a0 · Cited by 5,394
Cellular cholesterol trafficking and compartmentalization
Ikonen, E. (2008) · Nature Reviews Molecular Cell Biology · doi:10.1038/nrm2336 · Cited by 1,506
Membrane recognition by phospholipid-binding domains
Lemmon, M. A. (2008) · Nature Reviews Molecular Cell Biology · doi:10.1038/nrm2328 · Cited by 1,419
A Century of Cholesterol and Coronaries: From Plaques to Genes to Statins
Goldstein, J. L., & Brown, M. S. (2015) · Cell · doi:10.1016/j.cell.2015.01.036 · Cited by 1,233
Membrane Phosphatidylserine Regulates Surface Charge and Protein Localization
Yeung, T., Gilbert, G. E., Shi, J., Silvius, J. R., Kapùs, A., & Grinstein, S. (2008) · Science · doi:10.1126/science.1152066 · Cited by 1,109
Cholesterol interactions with phospholipids in membranes
Ohvo-Rekilä, H. (2002) · Progress in Lipid Research · doi:10.1016/s0163-7827(01)00020-0 · Cited by 1,003
Cited by
Sorted by citations
TMEM41B and VMP1 are scramblases and regulate the distribution of cholesterol and phosphatidylserine
Li, Y. E., Wang, Y.-C., Du, X., Zhang, T., Mak, H. Y., Hancock, S. E., McEwen, H. P., Pandžić, E., Whan, R. M., Aw, Y. C., et al. (2021) · The Journal of Cell Biology · doi:10.1083/jcb.202103105 · Cited by 163
The Smc5/6 complex is a DNA loop-extruding motor
Pradhan, B., Kanno, T., Igarashi, M. U., Loke, M. S., Baaske, M. D., Wong, J. S. K., Jeppsson, K. E., Björkegren, C., & Kim, E. (2023) · Nature · doi:10.1038/s41586-023-05963-3 · Cited by 147
Ikonen, E., & Zhou, X. (2021) · Developmental Cell · doi:10.1016/j.devcel.2021.04.025 · Cited by 103
Ng, M. Y. W., Charsou, C., Lapao, A., Singh, S., Trachsel-Moncho, L., Schultz, S. W., Nakken, S., Munson, M. J., & Simonsen, A. (2022) · Nature Communications · doi:10.1038/s41467-022-33933-2 · Cited by 59
Intracellular Cholesterol Synthesis and Transport
Shi, Q., Chen, J., Zou, X., & Tang, X. (2022) · Frontiers in Cell and Developmental Biology · doi:10.3389/fcell.2022.819281 · Cited by 73
Metadata
- Authors
- Ercan, B., Naito, T., Koh, D. H. Z., Dharmawan, D., & Saheki, Y.
- Affiliations
- Nanyang Technological University (SG)
- Corresponding author
- Saheki, Yasunori
- Venue
- The EMBO Journal
- Published
- 2021-02-19
- Volume
- 40
- Issue
- 6
- Pages
- e106524-e106524
- ISSN
- 0261-4189 (ISSN-L)
- 1460-2075
- PMC
- PMC7957428
- OpenAlex
- W3130489784
- Semantic Scholar
- 0ad43bb734e039971af930354c14741f35924fd1
- Cited by
- 132
- References
- 87
- Citations by year
- 2026: 14 · 2025: 32 · 2024: 24 · 2023: 25 · 2022: 26 · 2021: 10
- FWCI
- 8.58
- Type
- journal article
- Language
- en
- Open access
- hybrid
- doi.org
- Locations
- The EMBO Journal (publishedVersion, other-oa)
- PubMed Central (publishedVersion, cc-by)
- PubMed (publishedVersion)
- DR-NTU (Nanyang Technological University) (submittedVersion, cc-by)
- Funders
- Ministry of Education ‐ Singapore (MOE2017‐T2‐2‐001)
- Nanyang Technological University (NAP)
- NTU|Lee Kong Chian School of Medicine, Nanyang Technological University (LKCMedicine‐SUG)
- MEXT|Japan Society for the Promotion of Science (Overseas Research Fellowship)
- Topics
- Life Sciences › Biochemistry, Genetics and Molecular Biology › Biochemistry › Cholesterol and Lipid Metabolism
- Life Sciences › Biochemistry, Genetics and Molecular Biology › Molecular Biology › Lipid Membrane Structure and Behavior
- Life Sciences › Biochemistry, Genetics and Molecular Biology › Cell Biology › Cellular transport and secretion
- Keywords
- cholesterol sensing, phosphatidylserine, cholesterol transport, endoplasmic reticulum, cholesterol homeostasis, membrane tethering
- MeSH terms
- Protein Domains, Biological Transport, Cell Membrane, Cholesterol, Endoplasmic Reticulum, HeLa Cells, Humans, Membrane Proteins, Intellectual Disability, Phosphatidylserines, Point Mutation, Amino Acid Substitution, Genetic Predisposition to Disease, Cell Line, Tumor
About these checks
Registry, retraction, Cites and statistics results are computed, not judged, with one exception: a printed reference that no index lists is read once by a model before it counts as a citation error. Claims are extracted by a model and kept only when their quote appears verbatim in the text; each cited source is then checked, with a model’s help, for whether it says what the claim relies on. Those verdicts can be wrong — read the claim’s quote and the cited source before relying on one.
A language model drew the claims from the paper on 2026-11-09, under version 3 of the claim definition (model deepseek-v4.1-flash, prompt extract-v3).
A second model labelled each claim on 2026-11-09 (model jev-1.13-20260917, definition revision gold-guideline-v0.2).
Cited sources are checked with a language model’s help (gpt-6-sol).
Statistics and arithmetic are recomputed, not judged.
Confidence bands are shown only for fields calibrated on our annotated test set. None is calibrated yet, so no band is shown.
What counts as a claim ›How we measure confidence ›How we check this ›
Are you an author, or do you see a problem with this page? Request a review
