

The DOI matches its Crossref record; 67 of the 68 references it cites were found in a registry or an index.
Cx3cr1- deficient microglia exhibit a premature aging transcriptome
Open accessAbstract
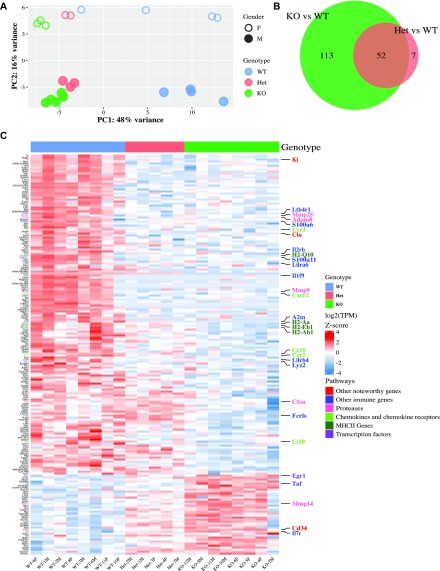
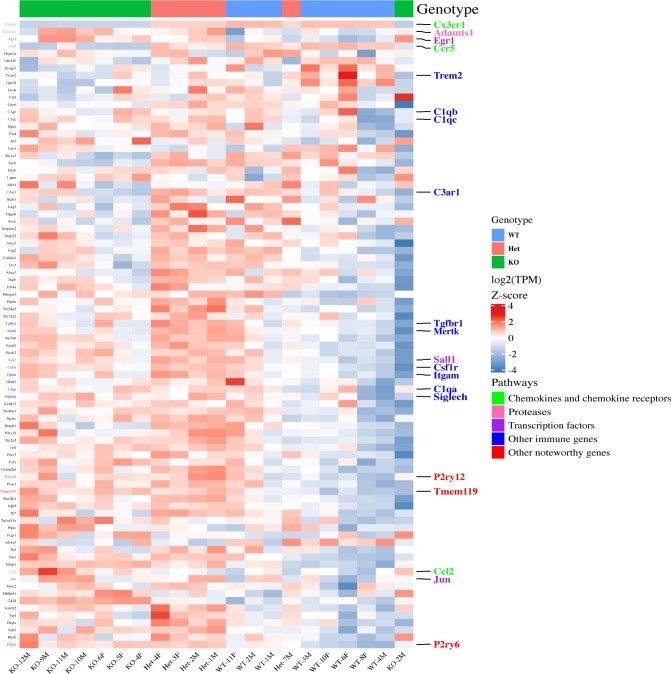
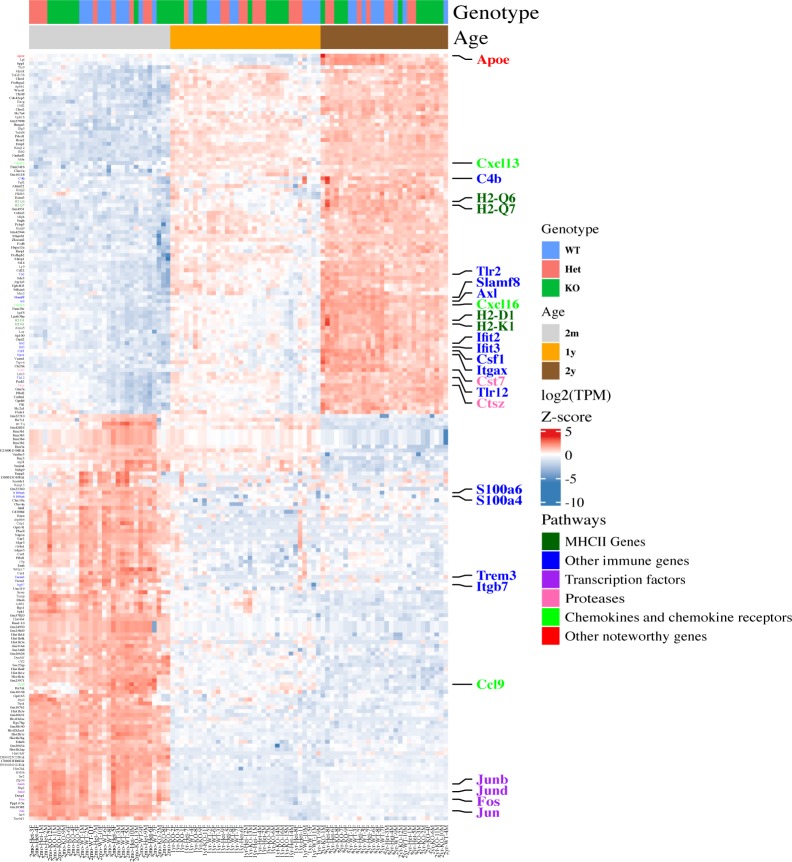
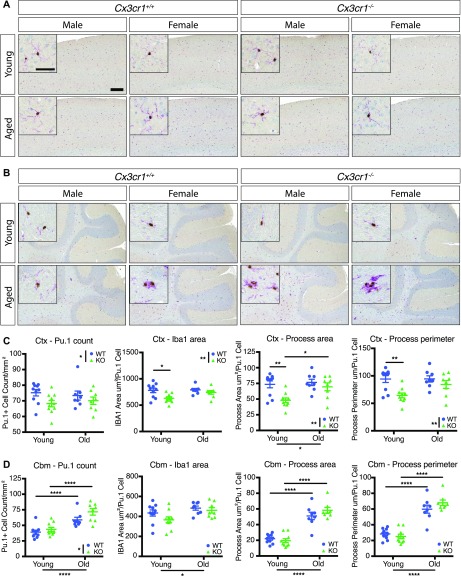
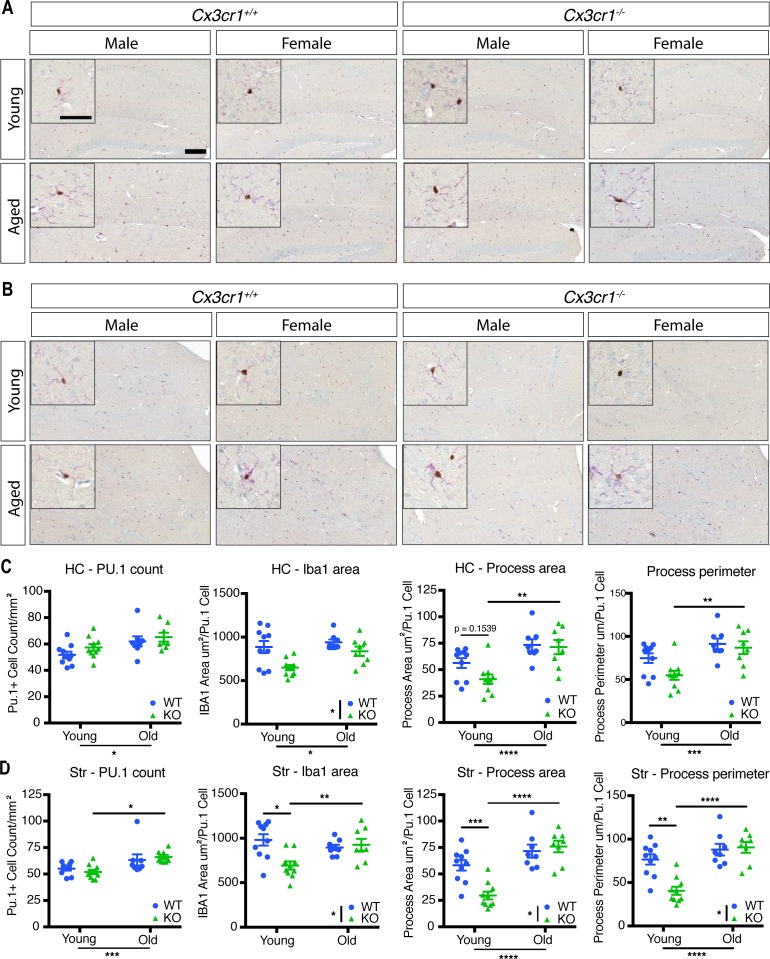
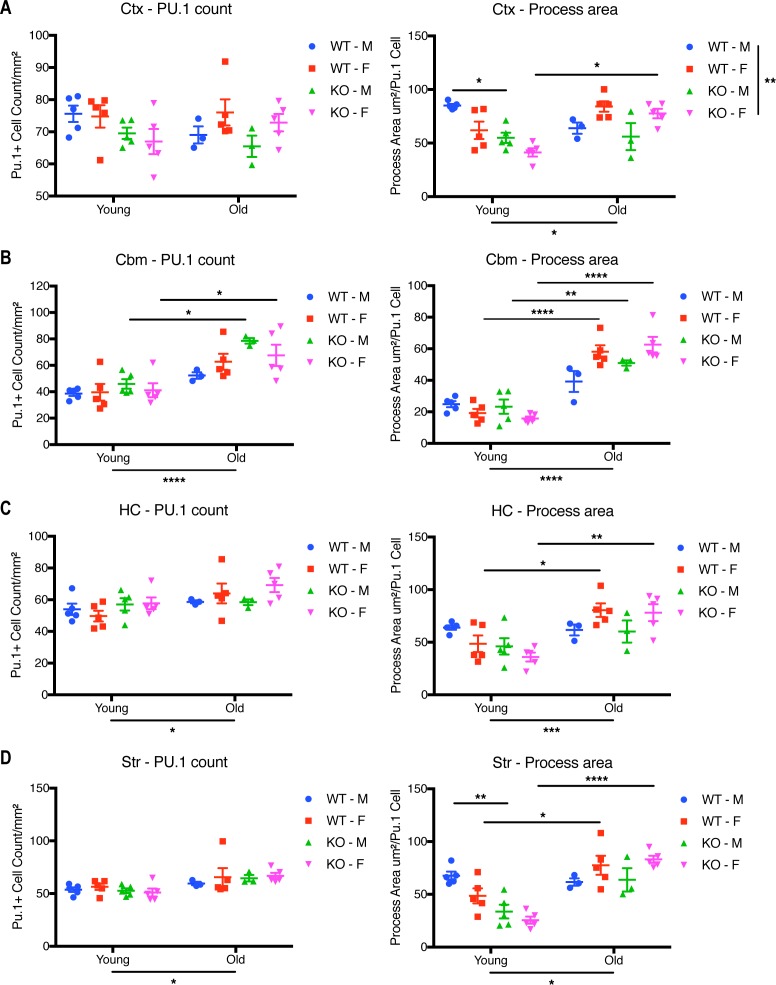
CX3CR1, one of the highest expressed genes in microglia in mice and humans, is implicated in numerous microglial functions. However, the molecular mechanisms underlying Cx3cr1 signaling are not well understood. Here, we analyzed transcriptomes of Cx3cr1- deficient microglia under varying conditions by RNA-sequencing (RNA-seq). In 2-mo-old mice, Cx3cr1 deletion resulted in the down-regulation of a subset of immune-related genes, without substantial epigenetic changes in markers of active chromatin. Surprisingly, Cx3cr1- deficient microglia from young mice exhibited a transcriptome consistent with that of aged Cx3cr1- sufficient animals, suggesting a premature aging transcriptomic signature. Immunohistochemical analysis of microglia in young and aged mice revealed that loss of Cx3cr1 modulates microglial morphology in a comparable fashion. Our results suggest that CX3CR1 may regulate microglial function in part by modulating the expression levels of a subset of inflammatory genes during chronological aging, making Cx3cr1 -deficient mice useful for studying aged microglia.
Overview
The claims and statistics of this paper haven’t been checked yet.
Run the check — free, no account needed. It reads the open-access text and checks the sources it cites.
Integrity signals
Registry
Cites
Statistics
Figures
Verification
Claims the paper makes
The claims and statistics of this paper haven’t been checked yet.
Run the check — free, no account needed. It reads the open-access text and checks the sources it cites.
Claims other papers make about this one
Each is checked against this paper’s own text: does it say what the citing paper says it does?
In the citing paper
“NOX1 expression may be an artefact of the Cx3cr1-EGFP reporter line, since Cx3cr1 is a signature microglial gene and haploinsufficiency has wide-reaching effects on gene expression of microglia, specifically encouraging a prematurely aged transcriptome [78,79,80].”
From ROS Generation in Microglia: Understanding Oxidative Stress and Inflammation in Neurodegenerative Disease (2020) · cites this paper as [78]
In the citing paper
“This expression profile concurs with other studies of DAM [10,37,78,124,194].”
From ROS Generation in Microglia: Understanding Oxidative Stress and Inflammation in Neurodegenerative Disease (2020) · cites this paper as [78]
Self-check
Percentages, sums and reported differences re-computed from the paper’s own numbers.
The self-check needs the paper’s full text.
Citations
Cites
Moderated estimation of fold change and dispersion for RNA-seq data with DESeq2
Love, M. I., Huber, W., & Anders, S. (2014) · Genome Biology · doi:10.1186/s13059-014-0550-8 · Cited by 95,106 · cited 3×
“DESeq2 (Love et al, 2014) was used to identify differential chromatin binding between Cx3cr1 -KO and -WT mice.”
Fast gapped-read alignment with Bowtie 2
Langmead, B., & Salzberg, S. L. (2012) · Nature Methods · doi:10.1038/nmeth.1923 · Cited by 56,400 · cited 1×
“The raw Rbp2 or H3K27Ac ChIP sequences were mapped to mm10 genome by Bowtie 2 (Langmead & Salzberg, 2013).”
STAR: ultrafast universal RNA-seq aligner
Dobin, A., Davis, C. A., Schlesinger, F., Drenkow, J., Zaleski, C., Jha, S., Batut, P., Chaisson, M., & Gingeras, T. R. (2013) · Bioinformatics · doi:10.1093/bioinformatics/bts635 · Cited by 51,709 · cited 2×
“Raw count fi les were aligned to mouse genome build mm10 using STAR and transcripts quanti fi ed with RSEM; in general, the uniquemappingratewas>80%.”
RSEM: accurate transcript quantification from RNA-Seq data with or without a reference genome
Li, B., & Dewey, C. N. (2011) · BMC Bioinformatics · doi:10.1186/1471-2105-12-323 · Cited by 22,179
Heinz, S., Benner, C., Spann, N., Bertolino, E., Lin, Y. C., Laslo, P., Cheng, J. X., Murre, C., Singh, H., & Glass, C. K. (2010) · Molecular Cell · doi:10.1016/j.molcel.2010.05.004 · Cited by 13,382 · cited 2×
“ChIP-seq library preparation, sequencing, and data analysis ChIP-seq libraries were prepared from recovered DNA by blunting, A-tailing, and adapter ligation using barcoded adapters (NextFlex; Bioo Scienti fi c) as previously described (Heinz et al, 2010; Gosselin et al, 2014).”
Self-citationComplex heatmaps reveal patterns and correlations in multidimensional genomic data
Gu, Z., Eils, R., & Schlesner, M. (2016) · Bioinformatics · doi:10.1093/bioinformatics/btw313 · Cited by 10,037 · cited 1×
“Heatmap visualizations of the DEGs were made by using custom R scripts based on ComplexHeatmap (Gu et al, 2016).”
A Unique Microglia Type Associated with Restricting Development of Alzheimer’s Disease
Keren-Shaul, H., Spinrad, A., Weiner, A., Matcovitch-Natan, O., Dvir-Szternfeld, R., Ulland, T. K., David, E., Baruch, K., Lara-Astaiso, D., Toth, B., et al. (2017) · Cell · doi:10.1016/j.cell.2017.05.018 · Cited by 5,493 · cited 1×
“In multiple conditions, mouse microglia demonstrate a core conserved reactive-state transcriptome, which is extensively modi fi ed to yield disease-speci fi c transcriptomes (Chiu et al, 2013; Keren-Shaul et al, 2017; Friedman et al, 2018).”
Zhang, Y., Chen, K., Sloan, S. A., Bennett, M. L., Scholze, A. R., O'Keeffe, S., Phatnani, H. P., Guarnieri, P., Caneda, C., Ruderisch, N., et al. (2014) · The Journal of Neuroscience · doi:10.1523/jneurosci.1860-14.2014 · Cited by 4,875 · cited 1×
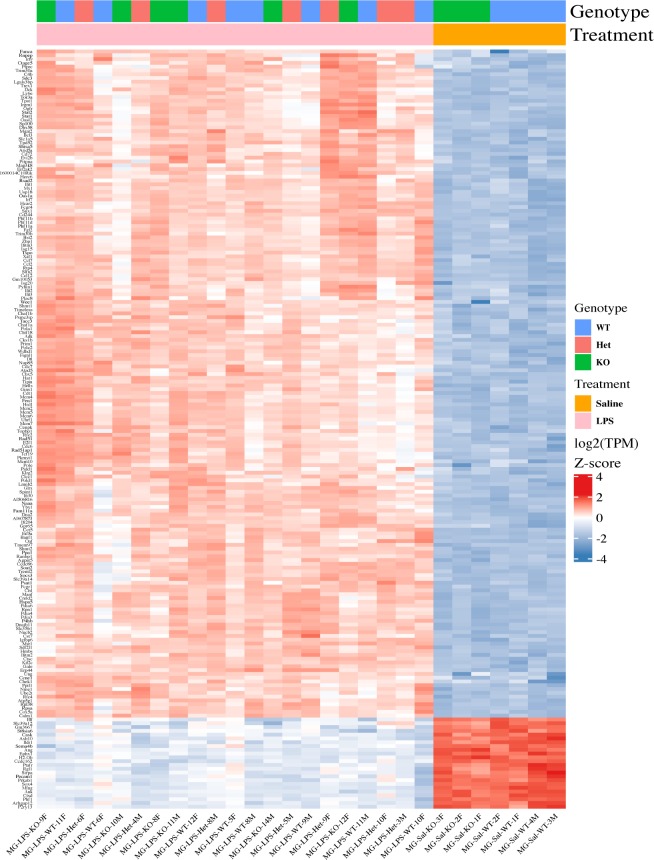
“In WT mice, the microglial expression pro fi le obtained here is consistent with the published microglial transcriptomes (Table S1) (Hickman et al, 2013; Butovsky et al, 2014; Zhang et al, 2014).”
Synaptic Pruning by Microglia Is Necessary for Normal Brain Development
Paolicelli, R. C., Bolasco, G., Pagani, F., Maggi, L., Scianni, M., Panzanelli, P., Giustetto, M., Ferreira, T. A., Guiducci, E., Dumas, L., et al. (2011) · Science · doi:10.1126/science.1202529 · Cited by 4,244 · cited 1×
“…Cx3cr1 expression show altered brain development during embryogenesis, dysregulated neuronal fi ring in the fi rst few weeks after birth, and abnormal results in tests designed to mimic sociopsychological behaviors (Paolicelli et al, 2011; Rogers et al, 2011; Zhan et al, 2014; Bolós et al, 2017).”
Mutation of the mouse klotho gene leads to a syndrome resembling ageing
Kuro-o, M., Matsumura, Y., Aizawa, H., Kawaguchi, H., Suga, T., Utsugi, T., Ohyama, Y., Kurabayashi, M., Kaname, T., Kume, E., et al. (1997) · Nature · doi:10.1038/36285 · Cited by 3,837 · cited 1×
“Indeed, Kl (Klotho) is down-regulated in Cx3cr1 -de fi cient microglia, and Klotho protein has been linked to aging and homeostatic support of brain function (Kuro-o et al, 1997).”
Host microbiota constantly control maturation and function of microglia in the CNS
Erny, D., Hrabě de Angelis, A. L., Jaitin, D., Wieghofer, P., Staszewski, O., David, E., Keren-Shaul, H., Mahlakoiv, T., Jakobshagen, K., Buch, T., et al. (2015) · Nature Neuroscience · doi:10.1038/nn.4030 · Cited by 3,569 · cited 1×
“CX3CR1 is involved in intestinal macrophage sensing of the microbiota (Niess et al, 2005), and gross disruption of the microbiota can affect microglial transcriptomes (Erny et al, 2015; Thion et al, 2018a).”
Jung, S., Aliberti, J., Graemmel, P., Sunshine, M. J., Kreutzberg, G. W., Sher, A., & Littman, D. R. (2000) · Molecular and Cellular Biology · doi:10.1128/mcb.20.11.4106-4114.2000 · Cited by 2,632 · cited 4×
“Cx3cr1 -de fi cient mice, in which both copies of Cx3cr1 are disrupted by the gene for eGFP (Jung et al, 2000), were initially obtained from The Jackson Laboratory and then bred to maintain them on the C57Bl/6J background.”
InfluentialMicroglia promote learning-dependent synapse formation through brain-derived neurotrophic factor
Parkhurst, C. N., Yang, G., Ninan, I., Savas, J. N., Yates, J. R., Lafaille, J. J., Hempstead, B. L., Littman, D. R., & Gan, W.-B. (2013) · Cell · doi:10.1016/j.cell.2013.11.030 · Cited by 2,599 · cited 1×
“Finally, because ofits high andconsistent expression, Cx3cr1 is also often used as a driver in reporter constructs, such as Cx3cr1-eGFP mice, or for Cre-mediated gene deletion (Jung et al, 2000; Goldmann et al, 2013; Parkhurst et al, 2013).”
Identification of a unique TGF-β–dependent molecular and functional signature in microglia
Butovsky, O., Jedrychowski, M. P., Moore, C. S., Cialic, R., Lanser, A. J., Gabriely, G., Koeglsperger, T., Dake, B., Wu, P. M., Doykan, C. E., et al. (2014) · Nature Neuroscience · doi:10.1038/nn.3599 · Cited by 2,543
Self-citationHow neuroinflammation contributes to neurodegeneration
Ransohoff, R. M. (2016) · Science · doi:10.1126/science.aag2590 · Cited by 1,967 · cited 1×
“They support brain development and adult CNS homeostasis, functions which are often dysregulated in acute or chronic neurological conditions (Xavier et al, 2014; Casano & Peri, 2015; Ransohoff, 2016; Hickman et al, 2018; Thion et al, 2018b).”
Self-citationMicroglia in neurodegeneration
Hickman, S., Izzy, S., Sen, P., Morsett, L., & El Khoury, J. (2018) · Nature Neuroscience · doi:10.1038/s41593-018-0242-x · Cited by 1,710 · cited 1×
“They support brain development and adult CNS homeostasis, functions which are often dysregulated in acute or chronic neurological conditions (Xavier et al, 2014; Casano & Peri, 2015; Ransohoff, 2016; Hickman et al, 2018; Thion et al, 2018b).”
CX 3 CR1-Mediated Dendritic Cell Access to the Intestinal Lumen and Bacterial Clearance
Niess, J. H., Brand, S., Gu, X., Landsman, L., Jung, S., McCormick, B. A., Vyas, J. M., Boes, M. L., Ploegh, H. L., Fox, J. G., et al. (2005) · Science · doi:10.1126/science.1102901 · Cited by 1,646 · cited 1×
“CX3CR1 is involved in intestinal macrophage sensing of the microbiota (Niess et al, 2005), and gross disruption of the microbiota can affect microglial transcriptomes (Erny et al, 2015; Thion et al, 2018a).”
Control of microglial neurotoxicity by the fractalkine receptor
Cardona, A. E., Pioro, E. P., Sasse, M. E., Kostenko, V., Cardona, S. M., Dijkstra, I. M., Huang, D., Kidd, G., Dombrowski, S., Dutta, R., et al. (2006) · Nature Neuroscience · doi:10.1038/nn1715 · Cited by 1,531 · cited 4×
“…in the acute 1-methyl-4-phenyl-1,2,3,6-tetrahydropyridine (MPTP) model of Parkinson ’ s disease and in tauopathies such as frontotemporal dementia, but promotes amyloid clearance in models of amyloid β deposition (Cardona et al, 2006; Bhaskar et al, 2010; Lee et al, 2010; Liu et al, 2010).”
InfluentialSelf-citationThe microglial sensome revealed by direct RNA sequencing
Hickman, S. E., Kingery, N. D., Ohsumi, T. K., Borowsky, M. L., Wang, L.-C., Means, T. K., & El Khoury, J. (2013) · Nature Neuroscience · doi:10.1038/nn.3554 · Cited by 1,511 · cited 1×
“In WT mice, the microglial expression pro fi le obtained here is consistent with the published microglial transcriptomes (Table S1) (Hickman et al, 2013; Butovsky et al, 2014; Zhang et al, 2014).”
Different immune cells mediate mechanical pain hypersensitivity in male and female mice
Sorge, R. E., Mapplebeck, J. C. S., Rosen, S., Beggs, S., Taves, S., Alexander, J. K., Martin, L. J., Austin, J.-S., Sotocinal, S. G., Chen, D., et al. (2015) · Nature Neuroscience · doi:10.1038/nn.4053 · Cited by 1,442 · cited 1×
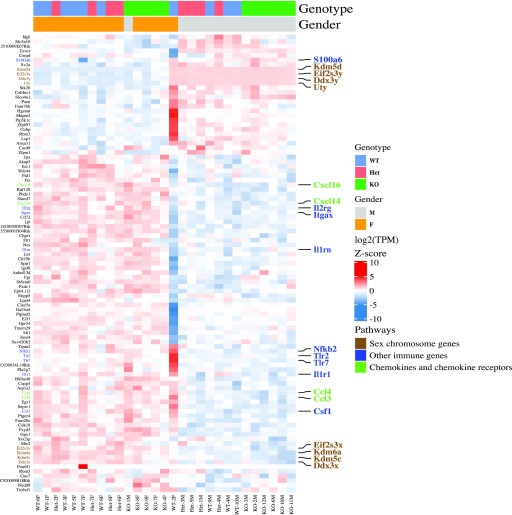
“…and neurodegenerative conditions and the emerging importance of gender differences in the role of microglia in response to multiple perturbations (Sorge et al, 2015; Hanamsagar et al, 2017; Thion et al, 2018a), an in-depth examination of gender differences is warranted, but beyond the scope of…”
Gosselin, D., Link, V. M., Romanoski, C. E., Fonseca, G. J., Eichenfield, D. Z., Spann, N. J., Stender, J. D., Chun, H. B., Garner, H., Geissmann, F., et al. (2014) · Cell · doi:10.1016/j.cell.2014.11.023 · Cited by 1,307 · cited 2×
“ChIP-seq library preparation, sequencing, and data analysis ChIP-seq libraries were prepared from recovered DNA by blunting, A-tailing, and adapter ligation using barcoded adapters (NextFlex; Bioo Scienti fi c) as previously described (Heinz et al, 2010; Gosselin et al, 2014).”
Self-citationZhan, Y., Paolicelli, R. C., Sforazzini, F., Weinhard, L., Bolasco, G., Pagani, F., Vyssotski, A. L., Bifone, A., Gozzi, A., Ragozzino, D., et al. (2014) · Nature Neuroscience · doi:10.1038/nn.3641 · Cited by 1,236 · cited 1×
“…Cx3cr1 expression show altered brain development during embryogenesis, dysregulated neuronal fi ring in the fi rst few weeks after birth, and abnormal results in tests designed to mimic sociopsychological behaviors (Paolicelli et al, 2011; Rogers et al, 2011; Zhan et al, 2014; Bolós et al, 2017).”
Microglial brain region-dependent diversity and selective regional sensitivities to aging
Grabert, K., Michoel, T., Karavolos, M. H., Clohisey, S., Baillie, J. K., Stevens, M. P., Freeman, T. C., Summers, K. M., & McColl, B. W. (2016) · Nature Neuroscience · doi:10.1038/nn.4222 · Cited by 1,151 · cited 4×
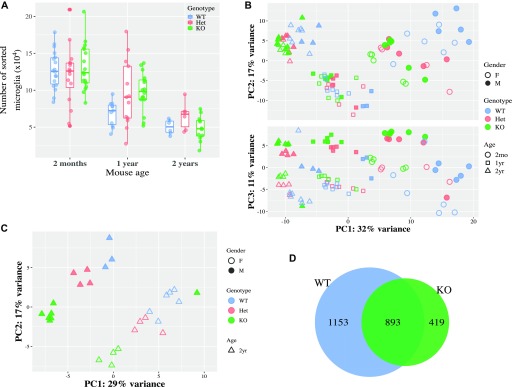
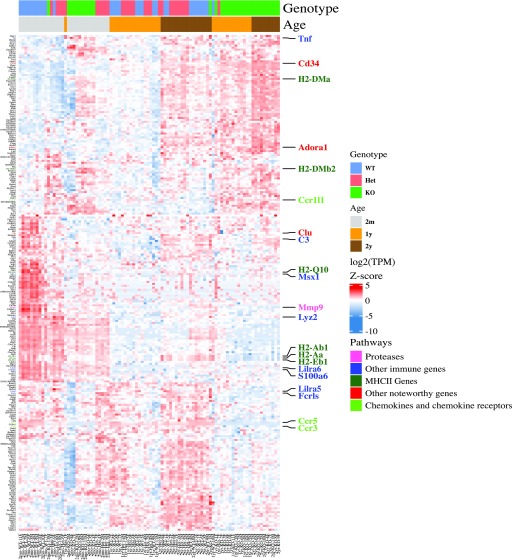
“The transcriptome of young Cx3cr1 -de fi cient mice resembles that of aged WT mice Age is the dominant risk factor for neurodegenerative diseases and also alters the microglial transcriptome both in mice and humans (Grabert et al, 2016; Olah et al, 2018).”
InfluentialMeasuring reproducibility of high-throughput experiments
Li, Q., Brown, J. B., Huang, H., & Bickel, P. J. (2011) · The Annals of Applied Statistics · doi:10.1214/11-aoas466 · Cited by 1,032 · cited 3×
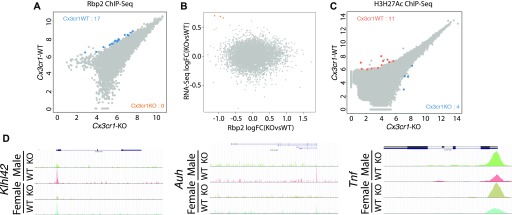
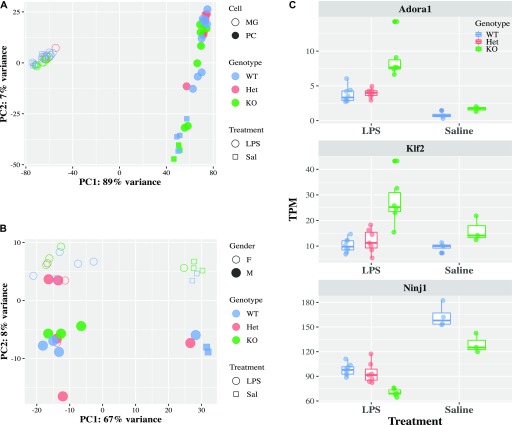
“Moreover, Tnf , a classical in fl ammatory gene, had higher expression in Cx3cr1 - KO microglia by RNA-seq and a trend for differential Rbp2 binding by ChIP-seq (irreproducible discovery rate [IDR] = 0.0553; Fig 2D).”
InfluentialInnate immune memory in the brain shapes neurological disease hallmarks
Wendeln, A.-C., Degenhardt, K., Kaurani, L., Gertig, M., Ulas, T., Jain, G., Wagner, J., Häsler, L. M., Wild, K., Skodras, A., et al. (2018) · Nature · doi:10.1038/s41586-018-0023-4 · Cited by 956 · cited 1×
“This LPS injection paradigm differs from the one we used and generates a different activation status in microglia (Wendeln et al, 2018).”
Measuring reproducibility of high-throughput experiments
Li, Q., Brown, J. B., Huang, H., & Bickel, P. J. (2010) · UC Berkeley · Cited by 915
Microbiome Influences Prenatal and Adult Microglia in a Sex-Specific Manner
Thion, M. S., Low, D., Silvin, A., Chen, J., Grisel, P., Schulte-Schrepping, J., Blecher, R., Ulas, T., Squarzoni, P., Hoeffel, G., et al. (2018) · Cell · doi:10.1016/j.cell.2017.11.042 · Cited by 779 · cited 3×
“…conditions and the emerging importance of gender differences in the role of microglia in response to multiple perturbations (Sorge et al, 2015; Hanamsagar et al, 2017; Thion et al, 2018a), an in-depth examination of gender differences is warranted, but beyond the scope of this study.”
A new type of microglia gene targeting shows TAK1 to be pivotal in CNS autoimmune inflammation
Goldmann, T., Wieghofer, P., Müller, P. F., Wolf, Y., Varol, D., Yona, S., Brendecke, S. M., Kierdorf, K., Staszewski, O., Datta, M., et al. (2013) · Nature Neuroscience · doi:10.1038/nn.3531 · Cited by 688 · cited 1×
“Finally, because ofits high andconsistent expression, Cx3cr1 is also often used as a driver in reporter constructs, such as Cx3cr1-eGFP mice, or for Cre-mediated gene deletion (Jung et al, 2000; Goldmann et al, 2013; Parkhurst et al, 2013).”
Friedman, B. A., Srinivasan, K., Ayalon, G., Meilandt, W. J., Lin, H., Huntley, M. A., Cao, Y., Lee, S.-H., Haddick, P. C. G., Ngu, H., et al. (2018) · Cell Reports · doi:10.1016/j.celrep.2017.12.066 · Cited by 662 · cited 1×
“In multiple conditions, mouse microglia demonstrate a core conserved reactive-state transcriptome, which is extensively modi fi ed to yield disease-speci fi c transcriptomes (Chiu et al, 2013; Keren-Shaul et al, 2017; Friedman et al, 2018).”
Chiu, I. M., Morimoto, E. T. A., Goodarzi, H., Liao, J. T., O’Keeffe, S., Phatnani, H. P., Muratet, M., Carroll, M. C., Levy, S., Tavazoie, S., et al. (2013) · Cell Reports · doi:10.1016/j.celrep.2013.06.018 · Cited by 651 · cited 1×
“In multiple conditions, mouse microglia demonstrate a core conserved reactive-state transcriptome, which is extensively modi fi ed to yield disease-speci fi c transcriptomes (Chiu et al, 2013; Keren-Shaul et al, 2017; Friedman et al, 2018).”
Regulation of Tau Pathology by the Microglial Fractalkine Receptor
Bhaskar, K., Konerth, M., Kokiko-Cochran, O. N., Cardona, A., Ransohoff, R. M., & Lamb, B. T. (2010) · Neuron · doi:10.1016/j.neuron.2010.08.023 · Cited by 639 · cited 2×
“…in the acute 1-methyl-4-phenyl-1,2,3,6-tetrahydropyridine (MPTP) model of Parkinson ’ s disease and in tauopathies such as frontotemporal dementia, but promotes amyloid clearance in models of amyloid β deposition (Cardona et al, 2006; Bhaskar et al, 2010; Lee et al, 2010; Liu et al, 2010).”
Self-citationCX3CR1 deficiency leads to impairment of hippocampal cognitive function and synaptic plasticity
Rogers, J. T., Morganti, J. M., Bachstetter, A. D., Hudson, C. E., Peters, M. M., Grimmig, B. A., Weeber, E. J., Bickford, P. C., & Gemma, C. (2011) · The Journal of Neuroscience · doi:10.1523/jneurosci.3667-11.2011 · Cited by 624 · cited 2×
“In addition, lack of Cx3cr1 expression reduces adult neurogenesis in the HC and olfactory bulb, and impairs the integration of newborn neurons (Bachstetter et al, 2011; Rogers et al, 2011; Xiao et al, 2015; Sellner et al, 2016; Reshef et al, 2017).”
Sall1 is a transcriptional regulator defining microglia identity and function
Buttgereit, A., Lelios, I., Yu, X., Vrohlings, M., Krakoski, N. R., Gautier, E. L., Nishinakamura, R., Becher, B., & Greter, M. (2016) · Nature Immunology · doi:10.1038/ni.3585 · Cited by 570 · cited 1×
“The transcription factor Sall1 is essential for the expression of microglia signature genes, which differentiate microgliafromothertissuemacrophagesandmyeloidcells(Buttgereit et al, 2016).”
Locating rearrangement events in a phylogeny based on highly fragmented assemblies
Zheng, C., & Sankoff, D. (2016) · BMC Genomics · doi:10.1186/s12864-015-2294-6 · Cited by 554
TREM2 sustains microglial expansion during aging and response to demyelination
Poliani, P. L., Wang, Y., Fontana, E., Robinette, M. L., Yamanishi, Y., Gilfillan, S., & Colonna, M. (2015) · Journal of Clinical Investigation · doi:10.1172/jci77983 · Cited by 525 · cited 1×
“Microgliaundergosubstantialchangesin gene expression and morphology with age (Poliani et al, 2015; Grabert et al, 2016; Olah et al, 2018), but it is not known whether the changes in microglia occur as a consequence of aging or help drive the process.”
A combination of ontogeny and CNS environment establishes microglial identity
Bennett, F. C., Bennett, M. L., Yaqoob, F., Mulinyawe, S. B., Grant, G. A., Hayden Gephart, M., Plowey, E. D., & Barres, B. A. (2018) · Neuron · doi:10.1016/j.neuron.2018.05.014 · Cited by 524 · cited 1×
“Microglial identity is conferred by their yolk-sac origin and the brain environment (Bennett et al, 2018).”
Lee, S., Varvel, N. H., Konerth, M. E., Xu, G., Cardona, A. E., Ransohoff, R. M., & Lamb, B. T. (2010) · The American Journal of Pathology · doi:10.2353/ajpath.2010.100265 · Cited by 522 · cited 2×
“…in the acute 1-methyl-4-phenyl-1,2,3,6-tetrahydropyridine (MPTP) model of Parkinson ’ s disease and in tauopathies such as frontotemporal dementia, but promotes amyloid clearance in models of amyloid β deposition (Cardona et al, 2006; Bhaskar et al, 2010; Lee et al, 2010; Liu et al, 2010).”
Self-citationA transcriptomic atlas of aged human microglia
Olah, M., Patrick, E., Villani, A.-C., Xu, J., White, C. C., Ryan, K. J., Piehowski, P., Kapasi, A., Nejad, P., Cimpean, M., et al. (2018) · Nature Communications · doi:10.1038/s41467-018-02926-5 · Cited by 482 · cited 3×
“The transcriptome of young Cx3cr1 -de fi cient mice resembles that of aged WT mice Age is the dominant risk factor for neurodegenerative diseases and also alters the microglial transcriptome both in mice and humans (Grabert et al, 2016; Olah et al, 2018).”
Microglia and early brain development: An intimate journey
Thion, M. S., Ginhoux, F., & Garel, S. (2018) · Science · doi:10.1126/science.aat0474 · Cited by 465 · cited 3×
“…conditions and the emerging importance of gender differences in the role of microglia in response to multiple perturbations (Sorge et al, 2015; Hanamsagar et al, 2017; Thion et al, 2018a), an in-depth examination of gender differences is warranted, but beyond the scope of this study.”
Epigenetic regulation of brain region-specific microglia clearance activity
Ayata, P., Badimon, A., Strasburger, H. J., Duff, M. K., Montgomery, S. E., Loh, Y.-H. E., Ebert, A., Pimenova, A. A., Ramirez, B. R., Chan, A. T., et al. (2018) · Nature Neuroscience · doi:10.1038/s41593-018-0192-3 · Cited by 460 · cited 1×
“Microglial morphologyaccessedbythe totalIba1area andcell body – associated Iba1 dendritic process area and perimeter in the cerebellum was much lower thaninthe cortex, consistentwithless rami fi ed microglia in this brain region (Ayata et al, 2018).”
Hanamsagar, R., Alter, M. D., Block, C. S., Sullivan, H., Bolton, J. L., & Bilbo, S. D. (2017) · Glia · doi:10.1002/glia.23176 · Cited by 384 · cited 3×
“…conditions and the emerging importance of gender differences in the role of microglia in response to multiple perturbations (Sorge et al, 2015; Hanamsagar et al, 2017; Thion et al, 2018a), an in-depth examination of gender differences is warranted, but beyond the scope of this study.”
Fractalkine and CX3CR1 regulate hippocampal neurogenesis in adult and aged rats
Bachstetter, A. D., Morganti, J. M., Jernberg, J., Schlunk, A., Mitchell, S. H., Brewster, K. W., Hudson, C. E., Cole, M. J., Harrison, J. K., Bickford, P. C., et al. (2011) · Neurobiology of Aging · doi:10.1016/j.neurobiolaging.2009.11.022 · Cited by 364 · cited 3×
“In addition, lack of Cx3cr1 expression reduces adult neurogenesis in the HC and olfactory bulb, and impairs the integration of newborn neurons (Bachstetter et al, 2011; Rogers et al, 2011; Xiao et al, 2015; Sellner et al, 2016; Reshef et al, 2017).”
Kruppel-like factor 2 (KLF2) regulates proinflammatory activation of monocytes
Das, H., Kumar, A., Lin, Z., Patino, W. D., Hwang, P. M., Feinberg, M. W., Majumder, P. K., & Jain, M. K. (2006) · Proceedings of the National Academy of Sciences · doi:10.1073/pnas.0508235103 · Cited by 305 · cited 1×
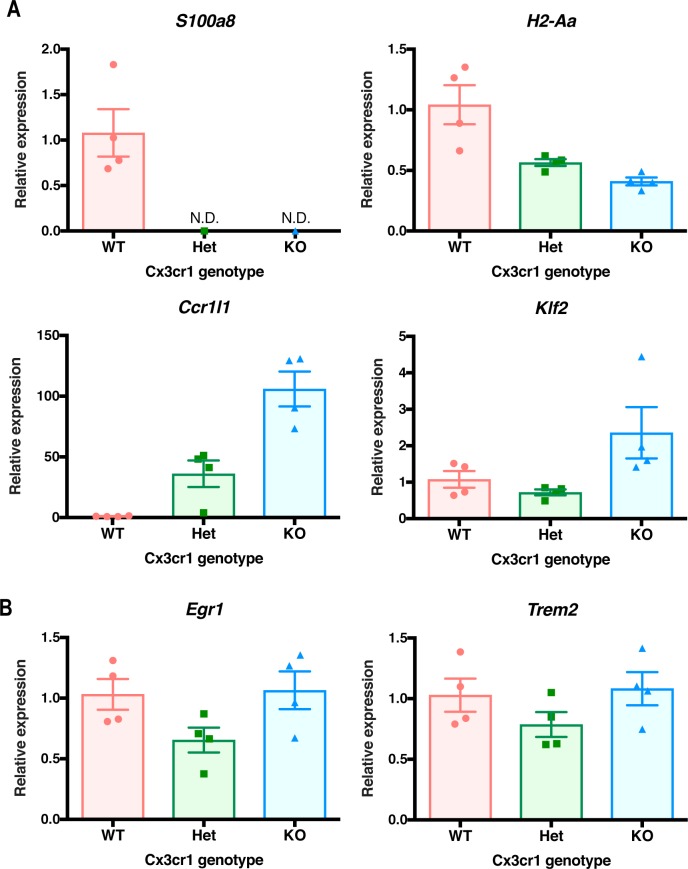
“Only genes with FDR < 0.05, fold change > 30%, and average expression > 4 TPM were included in the enrichment analysis. augmented up-regulation of Klf2 , among other genes, could mediate durable functional responses by microglia (Das et al, 2006; de Bruin et al, 2016; Roberts et al, 2017).”
InfluentialHanamsagar, R., Alter, M. D., Block, C. L., Sullivan, H. K., Bolton, J. L., & Bilbo, S. D. (2017) · Glia · doi:10.1002/glia.23277 · Cited by 297
Liu, Z., Condello, C., Schain, A., Harb, R., & Grutzendler, J. (2010) · The Journal of Neuroscience · doi:10.1523/jneurosci.4403-10.2010 · Cited by 275 · cited 1×
“…in the acute 1-methyl-4-phenyl-1,2,3,6-tetrahydropyridine (MPTP) model of Parkinson ’ s disease and in tauopathies such as frontotemporal dementia, but promotes amyloid clearance in models of amyloid β deposition (Cardona et al, 2006; Bhaskar et al, 2010; Lee et al, 2010; Liu et al, 2010).”
Ninjurin, a Novel Adhesion Molecule, Is Induced by Nerve Injury and Promotes Axonal Growth
Araki, T., & Milbrandt, J. (1996) · Neuron · doi:10.1016/s0896-6273(00)80166-x · Cited by 263 · cited 1×
“In addition, Cx3cr1 -KO microglia failed to up-regulate the adhesion molecule Ninj1 after LPS, which could play a role in the neuronal cell death after recurrent systemic LPS treatment (Araki & Milbrandt, 1996; Cardona et al, 2006).”
Tissue-resident macrophages are locally programmed for silent clearance of apoptotic cells
Roberts, A. W., Lee, B. L., Deguine, J., John, S., Shlomchik, M. J., & Barton, G. M. (2017) · Immunity · doi:10.1016/j.immuni.2017.10.006 · Cited by 261 · cited 1×
“Only genes with FDR < 0.05, fold change > 30%, and average expression > 4 TPM were included in the enrichment analysis. augmented up-regulation of Klf2 , among other genes, could mediate durable functional responses by microglia (Das et al, 2006; de Bruin et al, 2016; Roberts et al, 2017).”
InfluentialZhang, X., Zhang, H., Li, L., Lan, H., Ren, Z., Liu, D., Wu, L., Liu, H., Jaqueth, J. S., Li, B., et al. (2016) · BMC Genomics · doi:10.1186/s12864-016-3041-3 · Cited by 218
Transcriptional control of microglia phenotypes in health and disease
Holtman, I. R., Skola, D., & Glass, C. K. (2017) · Journal of Clinical Investigation · doi:10.1172/jci90604 · Cited by 218 · cited 1×
“Thus, microglia establish and then alter their gene expression and function, based on contextual cues that modulate the activity of an enhancer landscape, primed through the action of lineage-determining transcription factors (Holtman et al, 2017).”
Self-citationMicroglia: Multitasking Specialists of the Brain
Casano, A. M., & Peri, F. (2015) · Developmental Cell · doi:10.1016/j.devcel.2015.01.018 · Cited by 209 · cited 1×
“They support brain development and adult CNS homeostasis, functions which are often dysregulated in acute or chronic neurological conditions (Xavier et al, 2014; Casano & Peri, 2015; Ransohoff, 2016; Hickman et al, 2018; Thion et al, 2018b).”
Lyons, A., Lynch, A. M., Downer, E. J., Hanley, R., O’Sullivan, J. B., Smith, A., & Lynch, M. A. (2009) · Journal of Neurochemistry · doi:10.1111/j.1471-4159.2009.06253.x · Cited by 202 · cited 1×
“It has been reported that CX3CL1 mRNA and protein expression decrease in the aged rodent brain (Lyons et al, 2009; Bachstetter et al, 2011), suggesting that reduced CX3CL1-CX3CR1 signaling may contribute to the transition of microglia to an aged phenotype.”
CX3CR1 deficiency induces an early protective inflammatory environment in ischemic mice
Fumagalli, S., Perego, C., Ortolano, F., & Simoni, M. G. D. (2013) · Glia · doi:10.1002/glia.22474 · Cited by 189 · cited 1×
“In CNS disease models, mice de fi cient for only one copy of Cx3cr1 willunpredictablyeithershowphenotypessimilartoWTmice(Fumagalli et al, 2013) or intermediate between WT and KO (Lee et al, 2010; Rogers etal, 2011).”
CX3CR1+ monocytes modulate learning and learning-dependent dendritic spine remodeling via TNF-α
Garré, J. M., Silva, H. M., Lafaille, J. J., & Yang, G. (2017) · Nature Medicine · doi:10.1038/nm.4340 · Cited by 132 · cited 1×
“Furthermore, peripheral CX3CR1 can affect brain processes, such as cognition and memory (Garr´e et al, 2017).”
Opposing Effects of Membrane-Anchored CX3CL1 on Amyloid and Tau Pathologies via the p38 MAPK Pathway
Lee, S., Xu, G., Jay, T. R., Bhatta, S., Kim, K.-W., Jung, S., Landreth, G. E., Ransohoff, R. M., & Lamb, B. T. (2014) · The Journal of Neuroscience · doi:10.1523/jneurosci.0853-14.2014 · Cited by 123 · cited 1×
“These fi ndings were surprising because deletion of Cx3cr1 consistently enhanced in-fl ammatory responses in CNS disease models (Cardona et al, 2006; Bhaskar et al, 2010; Lee et al, 2014).”
Self-citationBolós, M., Perea, J. R., Terreros‐Roncal, J., Pallas‐Bazarra, N., Jurado‐Arjona, J., Ávila, J., & Llorens-Martı́n, M. (2017) · Brain Behavior and Immunity · doi:10.1016/j.bbi.2017.10.002 · Cited by 113
The role of microglia and their CX3CR1 signaling in adult neurogenesis in the olfactory bulb
Reshef, R., Kudryavitskaya, E., Shani-Narkiss, H., Isaacson, B., Rimmerman, N., Mizrahi, A., & Yirmiya, R. (2017) · eLife · doi:10.7554/elife.30809 · Cited by 112 · cited 1×
“In addition, lack of Cx3cr1 expression reduces adult neurogenesis in the HC and olfactory bulb, and impairs the integration of newborn neurons (Bachstetter et al, 2011; Rogers et al, 2011; Xiao et al, 2015; Sellner et al, 2016; Reshef et al, 2017).”
Time-dependent effects of CX3CR1 in a mouse model of mild traumatic brain injury
Febinger, H. Y., Thomasy, H. E., Pavlova, M. N., Ringgold, K. M., Barf, P. R., George, A. M., Grillo, J. N., Bachstetter, A. D., Garcia, J. A., Cardona, A. E., et al. (2015) · Journal of Neuroinflammation · doi:10.1186/s12974-015-0386-5 · Cited by 110 · cited 1×
“Both protective and detrimental effects have also been reported for Cx3cr1 deletion in varied models of traumatic brain injury, including at different time points in the same model (Febinger et al, 2015; Erturk etal, 2016; Zanier etal, 2016).”
Zanier, E. R., Marchesi, F., Ortolano, F., Perego, C., Arabian, M., Zoerle, T., Sammali, E., Pischiutta, F., & De Simoni, M.-G. (2016) · Journal of Neurotrauma · doi:10.1089/neu.2015.4041 · Cited by 94
Ertürk, A., Mentz, S., Stout, E. E., Hedehus, M., Domínguez, S. L., Neumaier, L., Krammer, F., Llovera, G., Srinivasan, K., Hansen, D. V., et al. (2016) · Journal of Neuroscience · doi:10.1523/jneurosci.1898-15.2016 · Cited by 91
Sellner, S., Paricio-Montesinos, R., Spieß, A., Masuch, A., Erny, D., Harsan, L. A., von Elverfeldt, D., Schwabenland, M., Biber, K. P. H., Staszewski, O., et al. (2016) · Acta Neuropathologica Communications · doi:10.1186/s40478-016-0374-8 · Cited by 82 · cited 1×
“In addition, lack of Cx3cr1 expression reduces adult neurogenesis in the HC and olfactory bulb, and impairs the integration of newborn neurons (Bachstetter et al, 2011; Rogers et al, 2011; Xiao et al, 2015; Sellner et al, 2016; Reshef et al, 2017).”
Fine-tuning the central nervous system: microglial modelling of cells and synapses
Xavier, A. L. R., Menezes, J. R. L., Goldman, S. A., & Nedergaard, M. (2014) · Philosophical Transactions of the Royal Society B Biological Sciences · doi:10.1098/rstb.2013.0593 · Cited by 80 · cited 2×
“DESeq2 (Love et al, 2014) was used to identify differential chromatin binding between Cx3cr1 -KO and -WT mice.”
Rimmerman, N., Schottlender, N., Reshef, R., Dan-Goor, N., & Yirmiya, R. (2016) · Brain Behavior and Immunity · doi:10.1016/j.bbi.2016.11.023 · Cited by 66 · cited 1×
“Reassuringly, our results with isolatedmicrogliawereconsistentwithanalysisofgene expressionin hippocampal lysates from WT or Cx3cr1 -de fi cient mice (Rimmerman et al, 2017).”
de Bruin, R. G., van der Veer, E. P., Prins, J., Lee, D. H., Dane, M. J. C., Zhang, H., Roeten, M. K., Bijkerk, R., de Boer, H. C., Rabelink, T. J., et al. (2016) · Scientific Reports · doi:10.1038/srep21643 · Cited by 46 · cited 1×
“Only genes with FDR < 0.05, fold change > 30%, and average expression > 4 TPM were included in the enrichment analysis. augmented up-regulation of Klf2 , among other genes, could mediate durable functional responses by microglia (Das et al, 2006; de Bruin et al, 2016; Roberts et al, 2017).”
InfluentialZhao, S., Li, X., Quan, J., Xi, H. S., Zhang, Y., von Schack, D., Vincent, M. S., & Zhang, B. (2016) · BMC Genomics · doi:10.1186/s12864-015-2356-9 · Cited by 41
Self-citationBone morphogenetic proteins in multiple sclerosis: Role in neuroinflammation
Eixarch, H., Calvo‐Barreiro, L., Montalbán, X., & Espejo, C. (2017) · Brain Behavior and Immunity · doi:10.1016/j.bbi.2017.02.019 · Cited by 31
Xiao, F., Xu, J., & Jiang, X. (2015) · Neural Regeneration Research · doi:10.4103/1673-5374.156979 · Cited by 26 · cited 1×
“In addition, lack of Cx3cr1 expression reduces adult neurogenesis in the HC and olfactory bulb, and impairs the integration of newborn neurons (Bachstetter et al, 2011; Rogers et al, 2011; Xiao et al, 2015; Sellner et al, 2016; Reshef et al, 2017).”
Perspectives on neuroreparative therapies for treating multiple sclerosis
Xiao, J. (2015) · Neural Regeneration Research · doi:10.4103/1673-5374.169610 · Cited by 2
Cited by
Sorted by citations
Simpson, D. S. A., & Oliver, P. L. (2020) · Antioxidants · doi:10.3390/antiox9080743 · Cited by 1,044
“This expression profile concurs with other studies of DAM [10,37,78,124,194].”
BackgroundResultMicroglia regulation of synaptic plasticity and learning and memory
Zhou, M., Cornell, J., Salinas, S., & Huang, H.-Y. (2022) · Neural Regeneration Research · doi:10.4103/1673-5374.322423 · Cited by 548
“CX3CR1/CX3CL1 signaling contributes to changes in microglia morphology and expression of immune proteins such as chemokines and chemokine receptors (Gyoneva et al., 2019).”
BackgroundMicroglia Phenotypes in Aging and Neurodegenerative Diseases
Wendimu, M. Y., & Hooks, S. B. (2022) · Cells · doi:10.3390/cells11132091 · Cited by 336
Graves, J. S., Krysko, K. M., Hua, L. H., Absinta, M., Franklin, R. J. M., & Segal, B. M. (2023) · The Lancet Neurology · doi:10.1016/s1474-4422(22)00184-3 · Cited by 260
Microglia in Alzheimer’s Disease in the Context of Tau Pathology
Perea, J. R., Bolós, M., & Ávila, J. (2020) · Biomolecules · doi:10.3390/biom10101439 · Cited by 134
“The first one determined that Cx3cr1−/− microglia present a lower phagocytic and migratory capacity per se [242], while the second revealed that Cx3cr1−/− microglia of young animals are very similar to the wild type (WT) microglia of older animals [243].”
Result
Metadata
- Authors
- Gyoneva, S., Hosur, R., Gosselin, D., Zhang, B., Ouyang, Z., Cotleur, A. C., Peterson, M., Allaire, N., Challa, R., Cullen, P., Roberts, C., Miao, K., Reynolds, T. L., Glass, C. K., Burkly, L., & Ransohoff, R. M.
- Affiliations
- Biogen (United States) (US)
- University of California San Diego (US)
- Corresponding author
- Gyoneva, Stefka
- Ransohoff, Richard M
- ORCID
- Venue
- Life Science Alliance
- Publisher
- Life Science Alliance, LLC
- Published
- 2019-12
- Volume
- 2
- Issue
- 6
- Pages
- e201900453
- ISSN
- 2575-1077 (ISSN-L)
- PMC
- PMC6892408
- OpenAlex
- W2994105471
- Cited by
- 103
- References
- 68
- Citations by year
- 2026: 13 · 2025: 12 · 2024: 11 · 2023: 12 · 2022: 23 · 2021: 25 · 2020: 7
- FWCI
- 6.06
- Type
- journal article
- Language
- en
- Open access
- gold
- doi.org
- Licence
- Locations
- Life Science Alliance (publishedVersion, cc-by)
- PubMed Central (publishedVersion, cc-by)
- PubMed (publishedVersion)
- DOAJ (DOAJ: Directory of Open Access Journals) (submittedVersion, cc-by-sa)
- eScholarship (California Digital Library) (submittedVersion)
- eScholarship (California Digital Library) (submittedVersion, cc-by)
- Funders
- National Institute of Neurological Disorders and Stroke (R01NS096170)
- Topics
- Life Sciences › Neuroscience › Neurology › Neuroinflammation and Neurodegeneration Mechanisms
- Life Sciences › Biochemistry, Genetics and Molecular Biology › Aging › Genetics, Aging, and Longevity in Model Organisms
- Life Sciences › Neuroscience › Developmental Neuroscience › Neurogenesis and neuroplasticity mechanisms
- Keywords
- CX3CR1, microglia, premature aging, transcriptome, microglial aging, microglial morphology, inflammatory gene expression, active chromatin, neuroinflammation
- MeSH terms
- CX3C Chemokine Receptor 1, Genetic Profile, Animals, Disease Models, Animal, Female, Inflammation, Lipopolysaccharides, Male, Mice, Inbred C57BL, Mice, Transgenic, Neurons, Signal Transduction, Gene Deletion, Microglia, Mice, Knockout, Aging, Premature, Receptors, Chemokine, Mice, Transcriptome
About these checks
Registry, retraction, Cites and statistics results are computed, not judged, with one exception: a printed reference that no index lists is read once by a model before it counts as a citation error. Claims are extracted by a model and kept only when their quote appears verbatim in the text; each cited source is then checked, with a model’s help, for whether it says what the claim relies on. Those verdicts can be wrong — read the claim’s quote and the cited source before relying on one.
Statistics and arithmetic are recomputed, not judged.
Confidence bands are shown only for fields calibrated on our annotated test set. None is calibrated yet, so no band is shown.
What counts as a claim ›How we measure confidence ›How we check this ›
Are you an author, or do you see a problem with this page? Request a review
