

The DOI matches its Crossref record; 5 of the 5 references it cites were found in a registry or an index.
Distinct RNA profiles in subpopulations of extracellular vesicles: apoptotic bodies, microvesicles and exosomes
Abstract
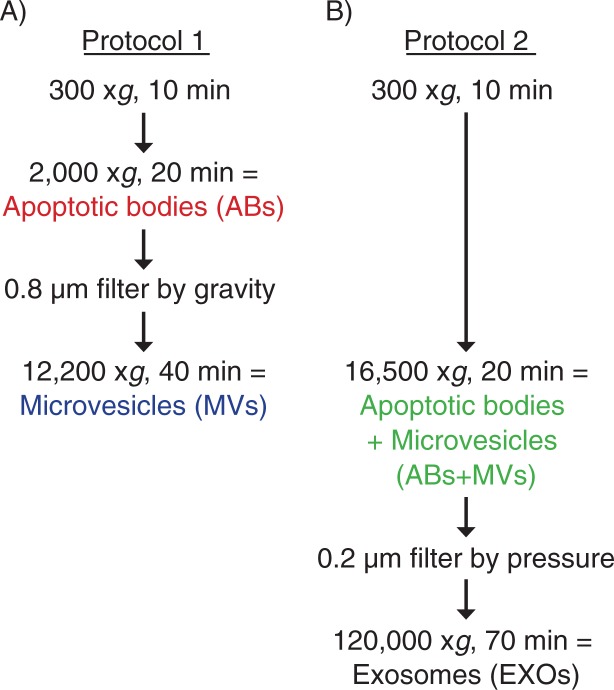
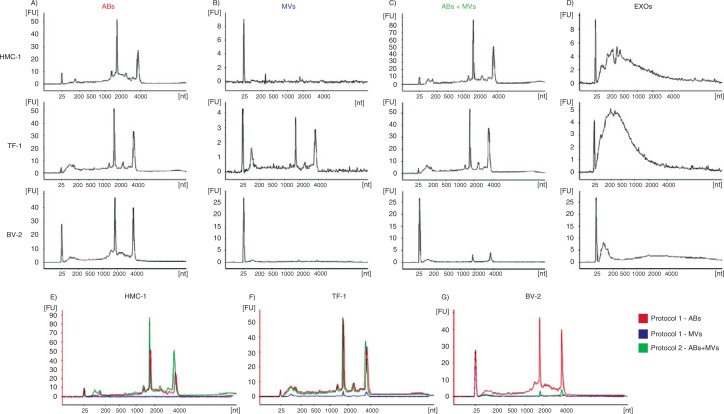
Introduction: In recent years, there has been an exponential increase in the number of studies aiming to understand the biology of exosomes, as well as other extracellular vesicles. However, classification of membrane vesicles and the appropriate protocols for their isolation are still under intense discussion and investigation. When isolating vesicles, it is crucial to use systems that are able to separate them, to avoid cross‐contamination. Method: EVs released from three different kinds of cell lines: HMC‐1, TF‐1 and BV‐2 were isolated using two centrifugation‐based protocols. In protocol 1, apoptotic bodies were collected at 2,000×g, followed by filtering the supernatant through 0.8 µm pores and pelleting of microvesicles at 12,200×g. In protocol 2, apoptotic bodies and microvesicles were collected together at 16,500×g, followed by filtering of the supernatant through 0.2 µm pores and pelleting of exosomes at 120,000×g. Extracellular vesicles were analyzed by transmission electron microscopy, flow cytometry and the RNA profiles were investigated using a Bioanalyzer ® . Results: RNA profiles showed that ribosomal RNA was primary detectable in apoptotic bodies and smaller RNAs without prominent ribosomal RNA peaks in exosomes. In contrast, microvesicles contained little or no RNA except for microvesicles collected from TF‐1 cell cultures. The different vesicle pellets showed highly different distribution of size, shape and electron density with typical apoptotic body, microvesicle and exosome characteristics when analyzed by transmission electron microscopy. Flow cytometry revealed the presence of CD63 and CD81 in all vesicles investigated, as well as CD9 except in the TF‐1‐derived vesicles, as these cells do not express CD9. Conclusions: Our results demonstrate that centrifugation‐based protocols are simple and fast systems to distinguish subpopulations of extracellular vesicles. Different vesicles show different RNA profiles and morphological characteristics, but they are indistinguishable using CD63‐coated beads for flow cytometry analysis.
Overview
The claims and statistics of this paper haven’t been checked yet.
Run the check — free, no account needed. It reads the open-access text and checks the sources it cites.
Integrity signals
Registry
Cites
Statistics
Figures
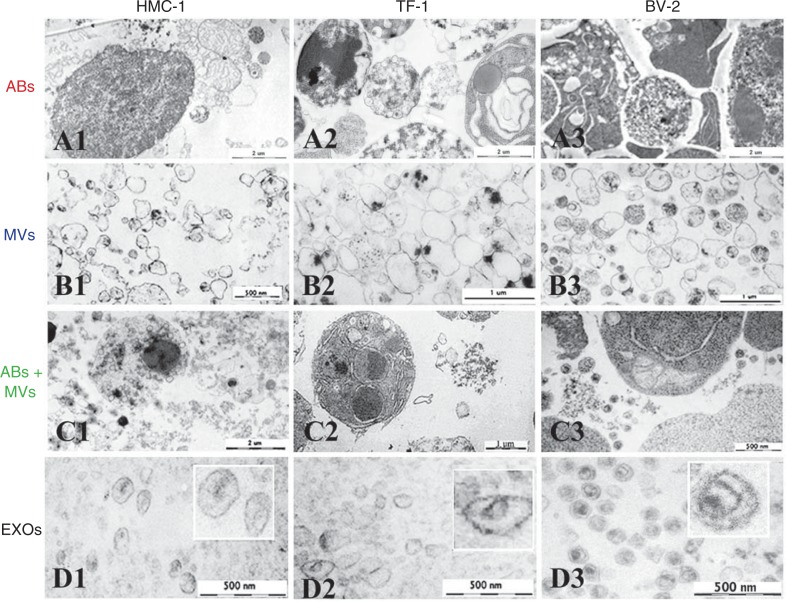
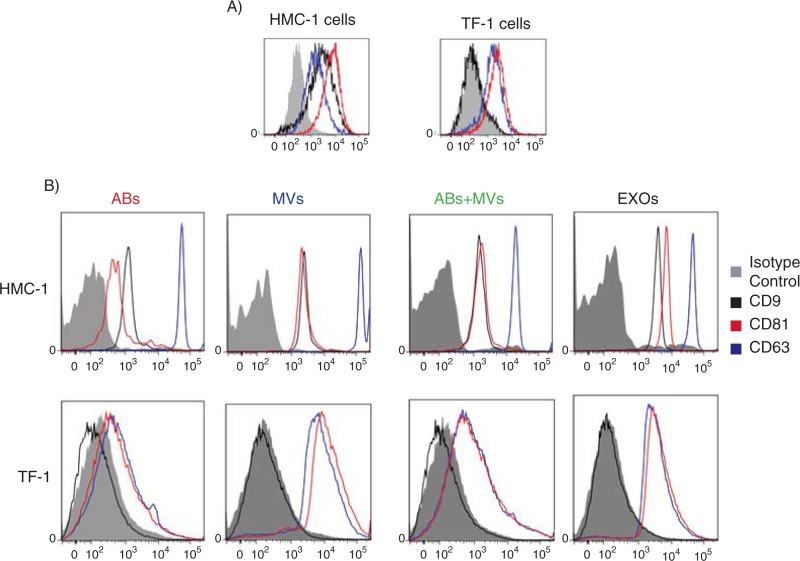
Verification
Claims the paper makes
The claims and statistics of this paper haven’t been checked yet.
Run the check — free, no account needed. It reads the open-access text and checks the sources it cites.
Claims other papers make about this one
Each is checked against this paper’s own text: does it say what the citing paper says it does?
In the citing paper
“As previously reported, cellular RNA samples had prominent 18S and 28S ribosomal RNA peaks, which were not observed in sEV RNA samples [45].”
From Differential RNA packaging into small extracellular vesicles by neurons and astrocytes (2021) · cites this paper as [45]
Self-check
Percentages, sums and reported differences re-computed from the paper’s own numbers.
The self-check needs the paper’s full text.
Citations
Cites
Valadi, H., Ekström, K., Bossios, A., Sjöstrand, M., Lee, J. J., & Lötvall, J. O. (2007) · Nature Cell Biology · doi:10.1038/ncb1596 · Cited by 12,834
Self-citationVesiclepedia: A Compendium for Extracellular Vesicles with Continuous Community Annotation
Kalra, H., Simpson, R. J., Ji, H., Aikawa, E., Altevogt, P., Askenase, P., Bond, V. C., Borràs, F. E., Breakefield, X., Budnik, V., et al. (2012) · PLoS Biology · doi:10.1371/journal.pbio.1001450 · Cited by 1,367
Self-citationRatajczak, J., Wysoczynski, M., Hayek, F., Janowska-Wieczorek, A., & Ratajczak, M. Z. (2006) · Leukemia · doi:10.1038/sj.leu.2404296 · Cited by 1,340
Isolation and Characterization of RNA-Containing Exosomes
Lässer, C., Eldh, M., & Lötvall, J. (2012) · Journal of Visualized Experiments · doi:10.3791/3037 · Cited by 509
Self-citationEkström, K., Valadi, H., Sjöstrand, M., Malmhäll, C., Bossios, A., Eldh, M., & Lötvall, J. (2012) · Journal of Extracellular Vesicles · doi:10.3402/jev.v1i0.18389 · Cited by 201
Self-citation
Research works printed but not linked: 29
- 10.1038/nri2567 · DOI
- 10.1016/j.imlet.2006.09.005 · DOI
- 10.1016/j.jprot.2010.06.006 · DOI
- 10.1016/j.tcb.2008.11.003 · DOI · Paper page
- 10.1034/j.1600-0854.2002.30502.x · DOI
- 10.1093/jb/mvj128 · DOI
- 10.1016/j.bcmd.2005.12.001 · DOI
- 10.1073/pnas.0603838103 · DOI · Paper page
- 10.4172/jpb.10000e10 · DOI
- 10.1007/s00018-011-0689-3 · DOI
- 10.1021/pr200842h · DOI
- Jong OG, 2012, Cellular stress conditions are reflected in the protein and RNA content of endothelial cell‐derived exosomes, J Extracell Vesicles, 1
- 10.3402/jev.v1i0.18374 · DOI
- 10.3402/jev.v2i0.20389 · DOI
- 10.1124/pr.112.005983 · DOI
- 10.1007/s00281-010-0233-9 · DOI
- 10.1111/j.1538-7836.2010.04074.x · DOI
- 10.1016/j.jprot.2011.05.023 · DOI
- 10.1007/978-1-62703-453-1_9 · DOI
- 10.1016/j.canlet.2011.06.016 · DOI
- 10.1038/sj.onc.1204282 · DOI
- Berent‐Maoz B, 2013, Human mast cells undergo TRAIL‐induced apoptosis, J Immunol, 176, 2272, 10.4049/jimmunol.176.4.2272 · DOI
- 10.1074/jbc.273.32.20121 · DOI · Paper page
- 10.3402/jev.v1i0.18397 · DOI
- Tatischeff I, 2012, Fast characterisation of cell‐derived extracellular vesicles by nanoparticles tracking analysis, cryo‐electron microscopy, and Raman tweezers microspectroscopy, J Extracell Vesicles, 1, 10.3402/jev.v1i0.19179 · DOI
- 10.1158/0008-5472.CAN-05-4579 · DOI
- 10.1038/cdd.2008.104 · DOI
- 10.1158/0008-5472.CAN-07-6538 · DOI · Paper page
- 10.1111/j.1538-7836.2009.03679.x · DOI
Cited by
Sorted by citations
Théry, C., Witwer, K. W., Aikawa, E., Alcaraz, M. J., Anderson, J. D., Andriantsitohaina, R., Antoniou, A., Arab, T., Archer, F., Atkin‐Smith, G. K., et al. (2018) · Journal of Extracellular Vesicles · doi:10.1080/20013078.2018.1535750 · Cited by 11,099
Self-citationBiogenesis, Secretion, and Intercellular Interactions of Exosomes and Other Extracellular Vesicles
Colombo, M., Raposo, G., & Théry, C. (2014) · Annual Review of Cell and Developmental Biology · doi:10.1146/annurev-cellbio-101512-122326 · Cited by 6,186
Reassessment of exosome composition
Jeppesen, D. K., Fenix, A. M., Franklin, J. L., Higginbotham, J. N., Zhang, Q., Zimmerman, L. J., Liebler, D. C., Ping, J., Liu, Q., Evans, R., et al. (2019) · Cell · doi:10.1016/j.cell.2019.02.029 · Cited by 2,975
RNA delivery by extracellular vesicles in mammalian cells and its applications
O’Brien, K., Breyne, K., Ughetto, S., Laurent, L. C., & Breakefield, X. O. (2020) · Nature Reviews Molecular Cell Biology · doi:10.1038/s41580-020-0251-y · Cited by 1,811
Exosomes and Ectosomes in Intercellular Communication
Meldolesi, J. (2018) · Current Biology · doi:10.1016/j.cub.2018.01.059 · Cited by 944
Therapeutically harnessing extracellular vesicles
Cheng, L., & Hill, A. F. (2022) · Nature Reviews Drug Discovery · doi:10.1038/s41573-022-00410-w · Cited by 737
Extracellular vesicles round off communication in the nervous system
Budnik, V., Ruiz-Cañada, C., & Wendler, F. (2016) · Nature Reviews Neuroscience · doi:10.1038/nrn.2015.29 · Cited by 712
Exosome Processing and Characterization Approaches for Research and Technology Development
Lai, J. J., Chau, Z. L., Chen, S., Hill, J. J., Korpany, K. V., Liang, N., Lin, L., Lin, Y., Liu, J. K., Liu, Y., et al. (2022) · Advanced Science · doi:10.1002/advs.202103222 · Cited by 623
Combining Machine Learning and Nanofluidic Technology To Diagnose Pancreatic Cancer Using Exosomes
Ko, J., Bhagwat, N., Yee, S. S., Ortiz, N., Sahmoud, A., Black, T., Aiello, N. M., McKenzie, L., O’Hara, M., Redlinger, C., et al. (2017) · ACS Nano · doi:10.1021/acsnano.7b05503 · Cited by 249
Antibiotic-induced release of small extracellular vesicles (exosomes) with surface-associated DNA
Németh, A., Orgovan, N., Sódar, B. W., Osteikoetxea, X., Pálóczi, K., Szabó-Taylor, K. É., Vukman, K. V., Kittel, Á., Turiák, L., Wiener, Z., et al. (2017) · Scientific Reports · doi:10.1038/s41598-017-08392-1 · Cited by 146
Self-citationForms of extracellular mitochondria and their impact in health
Miliotis, S., Nicolalde, B., Ortega, M., Yepez, J., & Caicedo, A. (2019) · Mitochondrion · doi:10.1016/j.mito.2019.02.002 · Cited by 138
Skeletal Muscle-Released Extracellular Vesicles: State of the Art
Rome, S., Forterre, A., Mizgier, M. L., & Bouzakri, K. (2019) · Frontiers in Physiology · doi:10.3389/fphys.2019.00929 · Cited by 139
Extracellular Vesicles in Brain Tumors and Neurodegenerative Diseases
Ciregia, F., Urbani, A., & Palmisano, G. (2017) · Frontiers in Molecular Neuroscience · doi:10.3389/fnmol.2017.00276 · Cited by 110
Geis-Asteggiante, L., Belew, A. T., Clements, V. K., Edwards, N. J., Ostrand-Rosenberg, S., El-Sayed, N. M., & Fenselau, C. (2018) · Journal of Proteome Research · doi:10.1021/acs.jproteome.7b00646 · Cited by 104
Extracellular vesicles as personalized medicine
Beetler, D. J., Di Florio, D. N., Bruno, K. A., Ikezu, T., March, K. L., Cooper, L. T., Wolfram, J., & Fairweather, D. (2023) · Molecular Aspects of Medicine · doi:10.1016/j.mam.2022.101155 · Cited by 101
Extracellular vesicles in renal tissue damage and regeneration
Bruno, S., Porta, S., & Bussolati, B. (2016) · European Journal of Pharmacology · doi:10.1016/j.ejphar.2016.06.058 · Cited by 74
Roles of Macrophages and Exosomes in Liver Diseases
Shen, M., Shen, Y., Fan, X., Men, R., Ye, T., & Yang, L. (2020) · Frontiers in Medicine · doi:10.3389/fmed.2020.583691 · Cited by 61
MicroRNAs in Extracellular Vesicles of Alzheimer’s Disease
Li, W., & Zheng, Y. (2023) · Cells · doi:10.3390/cells12101378 · Cited by 43
Differential RNA packaging into small extracellular vesicles by neurons and astrocytes
Luo, X., Jean-Toussaint, R., Sacan, A., & Ajit, S. K. (2021) · Cell Communication and Signaling · doi:10.1186/s12964-021-00757-4 · Cited by 32
Metadata
- Authors
- Crescitelli, R., Lässer, C., Szabó, T. G., Kittel, A., Eldh, M., Dianzani, I., Buzás, E. I., & Lötvall, J.
- Affiliations
- Department of Internal Medicine and Clinical Nutrition Krefting Research Centre University of Gothenburg Gothenburg Sweden
- Department of Genetics Cell and Immunobiology Semmelweis University Budapest Hungary
- Institute of Experimental Medicine Hungarian Academy of Sciences Budapest Hungary
- Department of Health Sciences University of Eastern Piedmont Novara Italy
- Venue
- Journal of Extracellular Vesicles
- Publisher
- Wiley
- Published
- 2013-01
- Volume
- 2
- Issue
- 1
- ISSN
- 2001-3078
- PMC
- PMC3823106
- Cited by
- 876
- References
- 5
- Language
- en
- Funders
- Vetenskapsrådet (K2011‐56X‐20676‐04‐6)
About these checks
Registry, retraction, Cites and statistics results are computed, not judged, with one exception: a printed reference that no index lists is read once by a model before it counts as a citation error. Claims are extracted by a model and kept only when their quote appears verbatim in the text; each cited source is then checked, with a model’s help, for whether it says what the claim relies on. Those verdicts can be wrong — read the claim’s quote and the cited source before relying on one.
Statistics and arithmetic are recomputed, not judged.
Confidence bands are shown only for fields calibrated on our annotated test set. None is calibrated yet, so no band is shown.
What counts as a claim ›How we measure confidence ›How we check this ›
Are you an author, or do you see a problem with this page? Request a review
