

The DOI matches its Crossref record; 109 of the 110 references it cites were found in a registry or an index; none of the 57 sources its claims cite is checked for support yet.
Age-dependent instability of mature neuronal fate in induced neurons from Alzheimer’s patients
Open accessAbstract
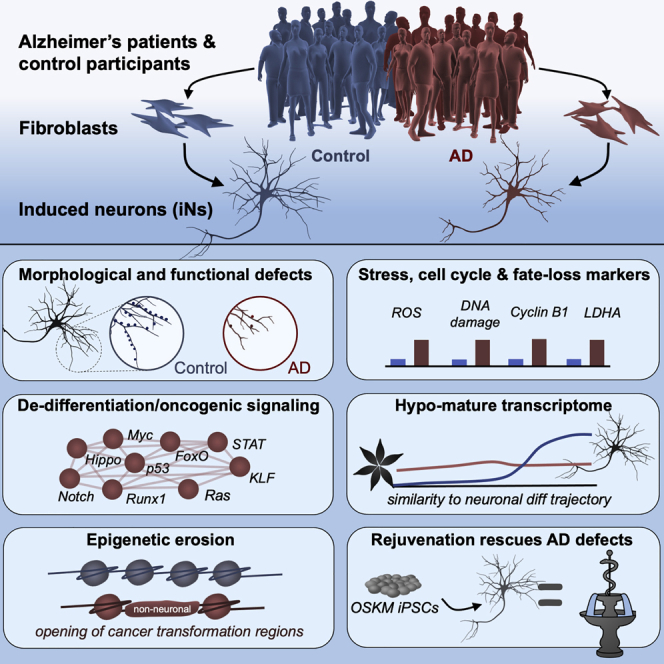
Sporadic Alzheimer's disease (AD) exclusively affects elderly people. Using direct conversion of AD patient fibroblasts into induced neurons (iNs), we generated an age-equivalent neuronal model. AD patient-derived iNs exhibit strong neuronal transcriptome signatures characterized by downregulation of mature neuronal properties and upregulation of immature and progenitor-like signaling pathways. Mapping iNs to longitudinal neuronal differentiation trajectory data demonstrated that AD iNs reflect a hypo-mature neuronal identity characterized by markers of stress, cell cycle, and de-differentiation. Epigenetic landscape profiling revealed an underlying aberrant neuronal state that shares similarities with malignant transformation and age-dependent epigenetic erosion. To probe for the involvement of aging, we generated rejuvenated iPSC-derived neurons that showed no significant disease-related transcriptome signatures, a feature that is consistent with epigenetic clock and brain ontogenesis mapping, which indicate that fibroblast-derived iNs more closely reflect old adult brain stages. Our findings identify AD-related neuronal changes as age-dependent cellular programs that impair neuronal identity.
Overview
AI snapshot
Written from the paper’s full text.
TL;DR
Directly converted induced neurons (iNs) from Alzheimer’s disease patients retain age-equivalent neuronal identity and show a hypo-mature, de-differentiated state with loss of mature neuronal gene expression and functional deficits. This AD-related instability is age-dependent: rejuvenated iPSC-derived neurons from the same patients show no significant disease transcriptome signature.
Key findings
- AD iNs had 778 highly significant DE genes (FDR < 0.01), while parental fibroblasts showed no significant AD-specific DE genes; AD iN transcriptomes overlapped with post-mortem AD brain and neuronal single-nucleus AD signatures.
- Downregulated genes in AD iNs were enriched for mature neuronal categories including synaptic transmission, oxidative phosphorylation, neuronal action potential, ion transport, and mitochondria; AD iNs showed reduced dendritic complexity, fewer synapsin and synapsin/PSD-95 puncta, and reduced spontaneous Ca²⁺ event frequency.
- Upregulated genes in AD iNs were enriched for cell cycle, stem/progenitor maintenance, stress, apoptosis, senescence, and cancer-related pathways; ATAC-seq showed on average 36% more open chromatin peaks that were 7% wider, with 7,188 differentially accessible peaks, 97% gained in AD.
- Rejuvenated iPSC-derived neurons showed no significant DE genes between control and AD subjects; iN DNA methylation ages reflected donor adult/old ages, whereas iPSC derivatives reflected pre-natal ages, and AD iNs did not show accelerated epigenetic aging over controls.
Methods
- Fibroblasts from 16 AD subjects (13 sporadic, 3 familial) and 19 age- and sex-matched non-demented controls were directly converted into iNs using Ngn2/Ascl1-based, small-molecule-enhanced conversion and PSA-NCAM FACS isolation.
- Assays included whole-genome RNA-seq, ATAC-seq, DNA methylation EPIC arrays, immunofluorescence, ELISA for Aβ42/40, ROS measurement, live-cell Ca²⁺ imaging, and morphological reconstruction.
- A subset (n = 20) was reprogrammed to iPSCs and converted to iPSC-iNs as rejuvenated isogenic controls; transcriptomes were compared with post-mortem bulk and single-nucleus AD data, BrainSpan fetal/adult brain samples, and published neuronal differentiation trajectories.
Limitations
- Stated in the paper: fibroblasts carry skin-specific, age-related changes that might interfere with AD-related iN changes; some brain-specific changes might not be captured; Ngn2/Ascl1 overexpression might override endogenous differences; other iPSC differentiation models might recapitulate AD phenotypes more prominently; and the cohort might not fully represent all AD patients.
- Evident from the text: the model is in vitro and fibroblast-derived, and although AD iNs showed cell cycle re-entry markers and increased DNA content above diploid, no completed neuronal DNA replication was detected, so conclusions about cell cycle re-entry rely on markers and aneuploidy rather than completed division.
Model-written summary. Check it against the paper before relying on it.
Integrity signals
Registry
Cites
Statistics
Figures
Verification
Claims the paper makes
55 Own result · 27 Not checked yet · 15 Own interpretation · 6 Own method · 3 No basis given
A result the paper reports from its own data — it cites no other source for it, so there is none to check. The quote shows it is in the paper.
In the paper
“Mapping iNs to longitudinal neuronal differentiation trajectory data demonstrated that AD iNs reflect a hypo-mature neuronal identity characterized by markers of stress, cell cycle, and de-differentiation.”
§ Age-dependent instability of mature neuronal fate in induced neurons from Alzheimer’s patients > Abstract
boostedcorrelational- Asserted: passes — The authors put it forward as true.
- Checkable: passes — It can be checked against evidence.
- Load-bearing: passes — The paper’s conclusions depend on it.
- Based: passes — The paper gives a reason why it holds.
A result the paper reports from its own data — it cites no other source for it, so there is none to check. The quote shows it is in the paper.
In the paper
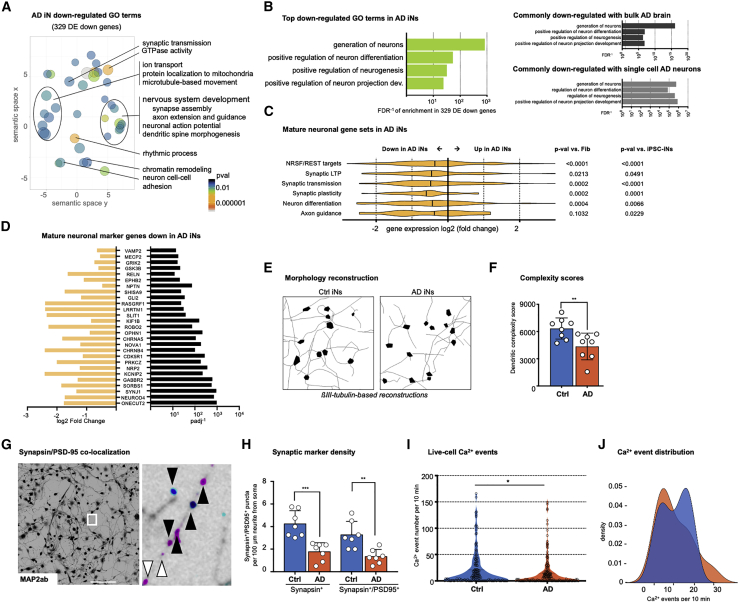
“We used GcAMP6m-based live-cell Ca2+ imaging to assess spontaneous neuronal activity, and we detected a reduced frequency of Ca2+ neuronal activity events in AD iNs (Figures 3I and 3J).”
§ Age-dependent instability of mature neuronal fate in induced neurons from Alzheimer’s patients > Results > Loss of mature neuronal gene expression and in vitro functionality in AD iNs
plain- Asserted: passes — The authors put it forward as true.
- Checkable: passes — It can be checked against evidence.
- Load-bearing: passes — The paper’s conclusions depend on it.
- Based: passes — The paper gives a reason why it holds.
The paper states this without a source or data behind it here, so there is nothing to check it against. The quote shows it is in the paper.
In the paper
“These GO and KEGG categories were also enriched within upregulated genes in post-mortem AD data.”
§ Age-dependent instability of mature neuronal fate in induced neurons from Alzheimer’s patients > Results > Activation of an immature and transformation-like transcriptional program in AD iNs
plaincorrelational- Asserted: passes — The authors put it forward as true.
- Checkable: passes — It can be checked against evidence.
- Load-bearing: passes — The paper’s conclusions depend on it.
- Based: passes — The paper gives a reason why it holds.
A result the paper reports from its own data — it cites no other source for it, so there is none to check. The quote shows it is in the paper.
In the paper
“These top-ranked categories were also enriched within downregulated genes in post mortem AD, further indicating a loss of genes promoting the differentiation of neurons (Figure 3B; Table S5).”
§ Age-dependent instability of mature neuronal fate in induced neurons from Alzheimer’s patients > Results > Loss of mature neuronal gene expression and in vitro functionality in AD iNs
hedgedcorrelational- Asserted: passes — The authors put it forward as true.
- Checkable: passes — It can be checked against evidence.
- Load-bearing: passes — The paper’s conclusions depend on it.
- Based: passes — The paper gives a reason why it holds.
A result the paper reports from its own data — it cites no other source for it, so there is none to check. The quote shows it is in the paper.
In the paper
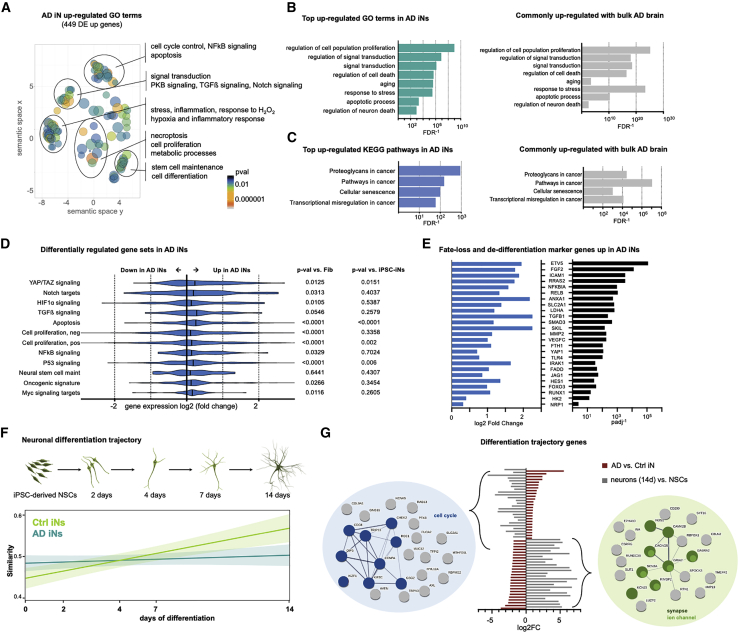
“GSEA of the most significantly (padj < 0.01) upregulated AD iN DE genes indicated that these genes were enriched for a broad semantic spectrum around cell cycle control, stem/progenitor cell maintenance, signal transduction pathways, apoptosis, and cancer-related pathways (Figure 4A; Table S5).”
§ Age-dependent instability of mature neuronal fate in induced neurons from Alzheimer’s patients > Results > Activation of an immature and transformation-like transcriptional program in AD iNs
hedgedcorrelational- Asserted: passes — The authors put it forward as true.
- Checkable: passes — It can be checked against evidence.
- Load-bearing: passes — The paper’s conclusions depend on it.
- Based: passes — The paper gives a reason why it holds.
A result the paper reports from its own data — it cites no other source for it, so there is none to check. The quote shows it is in the paper.
In the paper
“Consistent with the transcriptional changes, PSA-NCAM-positive FACS-purified AD iN cultures displayed less complex dendritic morphologies, as revealed by βIII-tubulin-based reconstructions (Figures 3E and 3F).”
§ Age-dependent instability of mature neuronal fate in induced neurons from Alzheimer’s patients > Results > Loss of mature neuronal gene expression and in vitro functionality in AD iNs
plaincorrelational- Asserted: passes — The authors put it forward as true.
- Checkable: passes — It can be checked against evidence.
- Load-bearing: passes — The paper’s conclusions depend on it.
- Based: passes — The paper gives a reason why it holds.
The paper states this without a source or data behind it here, so there is nothing to check it against. The quote shows it is in the paper.
In the paper
“To probe for the involvement of aging, we generated rejuvenated iPSC-derived neurons that showed no significant disease-related transcriptome signatures, a feature that is consistent with epigenetic clock and brain ontogenesis mapping, which indicate that fibroblast-derived iNs more closely reflect old adult brain stages.”
§ Age-dependent instability of mature neuronal fate in induced neurons from Alzheimer’s patients > Abstract
hedgedcorrelational- Asserted: passes — The authors put it forward as true.
- Checkable: passes — It can be checked against evidence.
- Load-bearing: passes — The paper’s conclusions depend on it.
- Based: passes — The paper gives a reason why it holds.
A result the paper reports from its own data — it cites no other source for it, so there is none to check. The quote shows it is in the paper.
In the paper
“Epigenetic landscape profiling revealed an underlying aberrant neuronal state that shares similarities with malignant transformation and age-dependent epigenetic erosion.”
§ Age-dependent instability of mature neuronal fate in induced neurons from Alzheimer’s patients > Abstract
plaincorrelational- Asserted: passes — The authors put it forward as true.
- Checkable: passes — It can be checked against evidence.
- Load-bearing: passes — The paper’s conclusions depend on it.
- Based: passes — The paper gives a reason why it holds.
A result the paper reports from its own data — it cites no other source for it, so there is none to check. The quote shows it is in the paper.
In the paper
“To probe for the involvement of aging, we generated rejuvenated iPSC-derived neurons that showed no significant disease-related transcriptome signatures, a feature that is consistent with epigenetic clock and brain ontogenesis mapping, which indicate that fibroblast-derived iNs more closely reflect old adult brain stages.”
§ Age-dependent instability of mature neuronal fate in induced neurons from Alzheimer’s patients > Abstract
plain- Asserted: passes — The authors put it forward as true.
- Checkable: passes — It can be checked against evidence.
- Load-bearing: passes — The paper’s conclusions depend on it.
- Based: passes — The paper gives a reason why it holds.
A result the paper reports from its own data — it cites no other source for it, so there is none to check. The quote shows it is in the paper.
In the paper
“On the basis of these marker genes, we did not observe systematic differences between iNs from sporadic and familial AD patients (Figure S1).”
§ Age-dependent instability of mature neuronal fate in induced neurons from Alzheimer’s patients > Results > Loss of mature neuronal gene expression and in vitro functionality in AD iNs
plain- Asserted: passes — The authors put it forward as true.
- Checkable: passes — It can be checked against evidence.
- Load-bearing: unclear — It is unclear whether the paper’s conclusions depend on it.
- Based: passes — The paper gives a reason why it holds.
- It may state two separate claims as one. 40
- Probably not a substantial claim. 13
A result the paper reports from its own data — it cites no other source for it, so there is none to check. The quote shows it is in the paper.
In the paper
“AD patient-derived iNs exhibit strong neuronal transcriptome signatures characterized by downregulation of mature neuronal properties and upregulation of immature and progenitor-like signaling pathways.”
§ Age-dependent instability of mature neuronal fate in induced neurons from Alzheimer’s patients > Abstract
boostedcorrelational- Asserted: passes — The authors put it forward as true.
- Checkable: passes — It can be checked against evidence.
- Load-bearing: passes — The paper’s conclusions depend on it.
- Based: passes — The paper gives a reason why it holds.
It may state two separate claims as one.
A result the paper reports from its own data — it cites no other source for it, so there is none to check. The quote shows it is in the paper.
In the paper
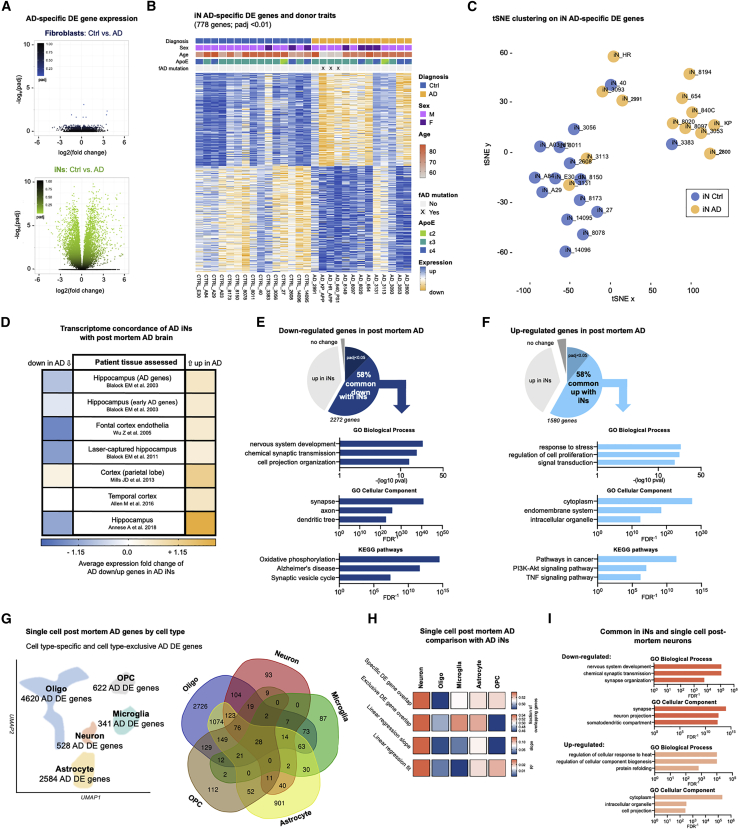
“Unsurprisingly, fibroblasts did not display any significant AD-specific DE genes, whereas 778 highly significant (false discovery rate [FDR] < 0.01) DE genes were identified in iNs (Figure 2A; Table S3).”
§ Age-dependent instability of mature neuronal fate in induced neurons from Alzheimer’s patients > Results > Differential gene expression in iNs from AD patients
plain- Asserted: passes — The authors put it forward as true.
- Checkable: passes — It can be checked against evidence.
- Load-bearing: passes — The paper’s conclusions depend on it.
- Based: passes — The paper gives a reason why it holds.
It may state two separate claims as one.
A result the paper reports from its own data — it cites no other source for it, so there is none to check. The quote shows it is in the paper.
In the paper
“Gene set enrichment analysis (GSEA) of overlapping AD genes showed that they were enriched for mature neuronal categories such as synaptic transmission and oxidative phosphorylation (downregulated; Figure 2E) and response to stress, regulation of cell proliferation, and pathways in cancer (upregulated; Figure 2F).”
§ Age-dependent instability of mature neuronal fate in induced neurons from Alzheimer’s patients > Results > Differential gene expression in iNs from AD patients
plaincorrelational- Asserted: passes — The authors put it forward as true.
- Checkable: passes — It can be checked against evidence.
- Load-bearing: passes — The paper’s conclusions depend on it.
- Based: passes — The paper gives a reason why it holds.
It may state two separate claims as one.
A result the paper reports from its own data — it cites no other source for it, so there is none to check. The quote shows it is in the paper.
In the paper
“The validity of the DE genes was evidenced by a clear separation of control and AD iNs by t-distributed stochastic neighbor embedding (tSNE) that largely confirmed the presence of an AD-specific transcriptome signature that unified most patient iN samples, despite some heterogeneity driven by four outlier samples (Figure 2C).”
§ Age-dependent instability of mature neuronal fate in induced neurons from Alzheimer’s patients > Results > Differential gene expression in iNs from AD patients
boostedcorrelational- Asserted: passes — The authors put it forward as true.
- Checkable: passes — It can be checked against evidence.
- Load-bearing: passes — The paper’s conclusions depend on it.
- Based: passes — The paper gives a reason why it holds.
It may state two separate claims as one.
A result the paper reports from its own data — it cites no other source for it, so there is none to check. The quote shows it is in the paper.
In the paper
“AD iNs consistently showed the highest overlap with, and the best correlation to, the neuronal cell-type-specific AD signatures (Figure 2H), with downregulated synapse-related and upregulated stress-related gene categories commonly visible in both systems (Figure 2I).”
§ Age-dependent instability of mature neuronal fate in induced neurons from Alzheimer’s patients > Results > Differential gene expression in iNs from AD patients
plaincorrelational- Asserted: passes — The authors put it forward as true.
- Checkable: passes — It can be checked against evidence.
- Load-bearing: passes — The paper’s conclusions depend on it.
- Based: passes — The paper gives a reason why it holds.
It may state two separate claims as one.
A result the paper reports from its own data — it cites no other source for it, so there is none to check. The quote shows it is in the paper.
In the paper
“The top significantly ranked Gene Ontology (GO) terms also identified an overrepresentation of genes involved in cellular stress response, stem cell-related signal transduction, aging, and cell death competence; the top significantly ranked Kyoto Encyclopedia of Genes and Genomes (KEGG) pathways were related to pathways involved in cancer and senescence (Figures 4B and 4C).”
§ Age-dependent instability of mature neuronal fate in induced neurons from Alzheimer’s patients > Results > Activation of an immature and transformation-like transcriptional program in AD iNs
plaincorrelational- Asserted: passes — The authors put it forward as true.
- Checkable: passes — It can be checked against evidence.
- Load-bearing: passes — The paper’s conclusions depend on it.
- Based: passes — The paper gives a reason why it holds.
It may state two separate claims as one.
A result the paper reports from its own data — it cites no other source for it, so there is none to check. The quote shows it is in the paper.
In the paper
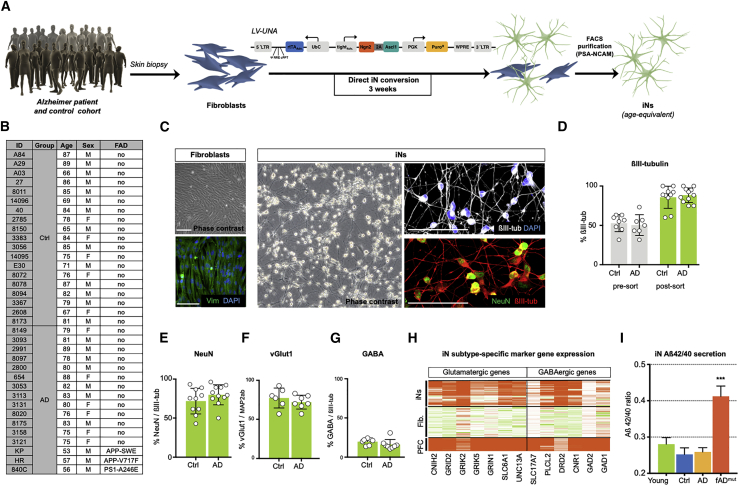
“Consistent with the immunocytochemistry and results from previous studies (Kim et al., 2018; Vadodaria et al., 2016), we detected expression of both glutamatergic and GABAergic marker genes in the iNs (Figure 1H).”
§ Age-dependent instability of mature neuronal fate in induced neurons from Alzheimer’s patients > Results > Direct iN conversion of fibroblasts from AD patients and controls
plain- Asserted: passes — The authors put it forward as true.
- Checkable: passes — It can be checked against evidence.
- Load-bearing: fails — The paper’s conclusions may not depend on it.
- Based: passes — The paper gives a reason why it holds.
Probably not a substantial claim. The paper’s conclusions may not depend on it.
A result the paper reports from its own data — it cites no other source for it, so there is none to check. The quote shows it is in the paper.
In the paper
“Indeed, the gene sets that were previously found to be downregulated in AD brains were typically also downregulated in AD iNs, and upregulated gene sets were also upregulated in AD iNs (Figure 2D; Table S4).”
§ Age-dependent instability of mature neuronal fate in induced neurons from Alzheimer’s patients > Results > Differential gene expression in iNs from AD patients
plaincorrelational- Asserted: passes — The authors put it forward as true.
- Checkable: passes — It can be checked against evidence.
- Load-bearing: passes — The paper’s conclusions depend on it.
- Based: passes — The paper gives a reason why it holds.
It may state two separate claims as one.
A result the paper reports from its own data — it cites no other source for it, so there is none to check. The quote shows it is in the paper.
In the paper
“Ngn2/Ascl1-based, small molecule-enhanced iN conversion and subsequent polysialylated neural cell adhesion molecule (PSA-NCAM) fluorescence-activated cell sorting (FACS) isolation resulted in cultures of ∼90% βIII-tubulin-positive neuronal cells that readily expressed NeuN (Figures 1C–1E).”
§ Age-dependent instability of mature neuronal fate in induced neurons from Alzheimer’s patients > Results > Direct iN conversion of fibroblasts from AD patients and controls
plaindirect- Asserted: passes — The authors put it forward as true.
- Checkable: passes — It can be checked against evidence.
- Load-bearing: passes — The paper’s conclusions depend on it.
- Based: passes — The paper gives a reason why it holds.
It may state two separate claims as one.
A result the paper reports from its own data — it cites no other source for it, so there is none to check. The quote shows it is in the paper.
In the paper
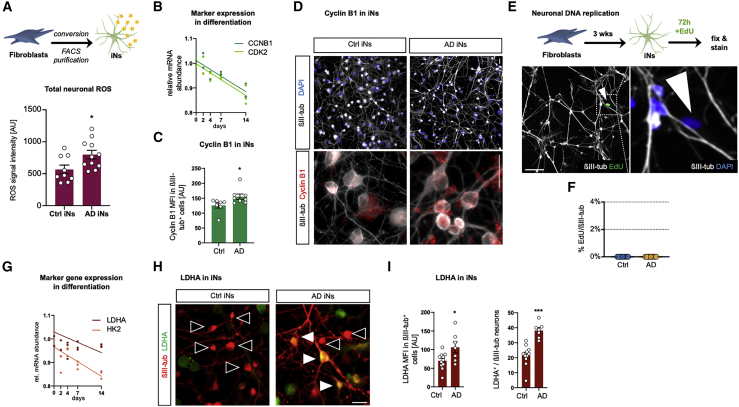
“Within the AD iN group, we observed slightly more neurons with both lower and higher DNA content, with the increase of AD iNs over the diploid level being significant (Figure S2), but we could not detect a completed neuronal DNA replication in iNs (Figures 5E and 5F; Figure S2).”
§ Age-dependent instability of mature neuronal fate in induced neurons from Alzheimer’s patients > Results > AD patient iNs display markers of stress-related de-differentiation
plaincorrelational- Asserted: passes — The authors put it forward as true.
- Checkable: passes — It can be checked against evidence.
- Load-bearing: passes — The paper’s conclusions depend on it.
- Based: passes — The paper gives a reason why it holds.
It may state two separate claims as one.
A result the paper reports from its own data — it cites no other source for it, so there is none to check. The quote shows it is in the paper.
In the paper
“Indeed, AD iNs displayed increased levels of total ROS (Figure 5A), and we also detected changes in DNA damage repair-related gene expression and increased numbers of nuclear H2A.X-positive foci in AD iN nuclei (Figure S2).”
§ Age-dependent instability of mature neuronal fate in induced neurons from Alzheimer’s patients > Results > AD patient iNs display markers of stress-related de-differentiation
plaincorrelational- Asserted: passes — The authors put it forward as true.
- Checkable: passes — It can be checked against evidence.
- Load-bearing: passes — The paper’s conclusions depend on it.
- Based: passes — The paper gives a reason why it holds.
It may state two separate claims as one.
A result the paper reports from its own data — it cites no other source for it, so there is none to check. The quote shows it is in the paper.
In the paper
“The genes that are both the most upregulated during differentiation and also decreased in AD iNs relate to synaptic functions, whereas the genes that are downregulated during differentiation and increased in AD iNs hint toward changes in cell cycle control (Figure 4G).”
§ Age-dependent instability of mature neuronal fate in induced neurons from Alzheimer’s patients > Results > Activation of an immature and transformation-like transcriptional program in AD iNs
hedgedcorrelational- Asserted: passes — The authors put it forward as true.
- Checkable: passes — It can be checked against evidence.
- Load-bearing: passes — The paper’s conclusions depend on it.
- Based: passes — The paper gives a reason why it holds.
It may state two separate claims as one.
A result the paper reports from its own data — it cites no other source for it, so there is none to check. The quote shows it is in the paper.
In the paper
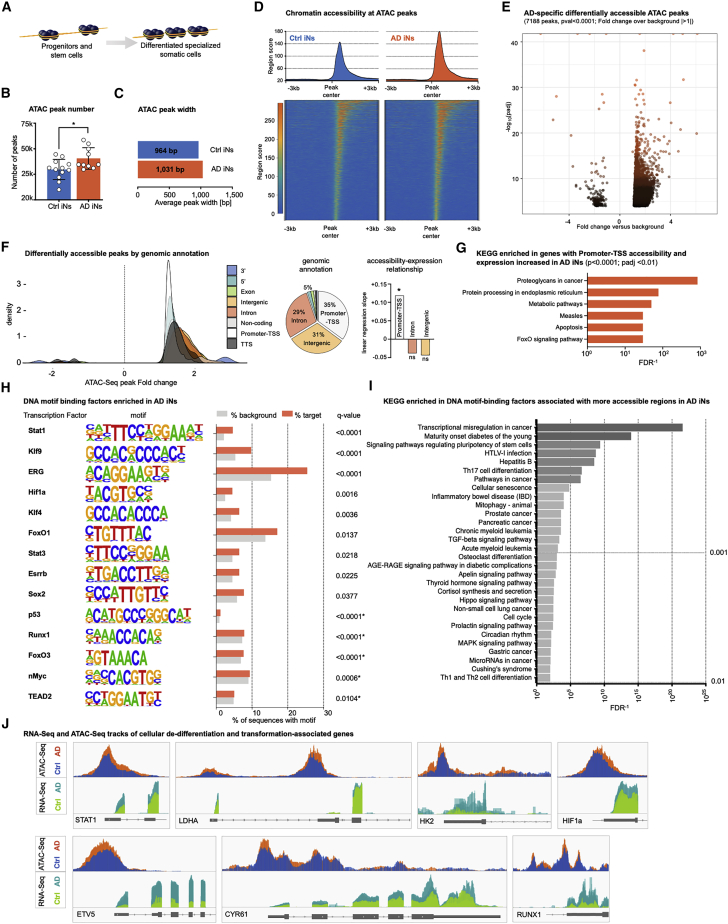
“ATAC-seq revealed a widespread increase in the number and width of open chromatin regions in AD iNs, which on average displayed 36% more peaks that were 7% wider (Figures 6B and 6C).”
§ Age-dependent instability of mature neuronal fate in induced neurons from Alzheimer’s patients > Results > Epigenetic landscape changes underlie hypo-mature neuronal state
plaindirectn = 21- Asserted: passes — The authors put it forward as true.
- Checkable: passes — It can be checked against evidence.
- Load-bearing: passes — The paper’s conclusions depend on it.
- Based: passes — The paper gives a reason why it holds.
It may state two separate claims as one.
A result the paper reports from its own data — it cites no other source for it, so there is none to check. The quote shows it is in the paper.
In the paper
“Control iNs showed a clear increase in similarity with progressive differentiation, whereas AD iNs showed little increase of similarity with progressive differentiation and higher similarity to immature stages (Figure 4F).”
§ Age-dependent instability of mature neuronal fate in induced neurons from Alzheimer’s patients > Results > Activation of an immature and transformation-like transcriptional program in AD iNs
boostedcorrelational- Asserted: passes — The authors put it forward as true.
- Checkable: passes — It can be checked against evidence.
- Load-bearing: passes — The paper’s conclusions depend on it.
- Based: passes — The paper gives a reason why it holds.
It may state two separate claims as one.
A result the paper reports from its own data — it cites no other source for it, so there is none to check. The quote shows it is in the paper.
In the paper
“ROS and DNA damage can trigger neuronal aneuploidy and expression of cell cycle re-entry markers in AD brains (Mosch et al., 2007), and the cell cycle markers CCNB1 (cyclin B1) and CDK2 become silenced during neuronal differentiation (Figure 5B).”
§ Age-dependent instability of mature neuronal fate in induced neurons from Alzheimer’s patients > Results > AD patient iNs display markers of stress-related de-differentiation
plaindirect- Asserted: passes — The authors put it forward as true.
- Checkable: passes — It can be checked against evidence.
- Load-bearing: passes — The paper’s conclusions depend on it.
- Based: passes — The paper gives a reason why it holds.
Probably not a substantial claim.
In the paper
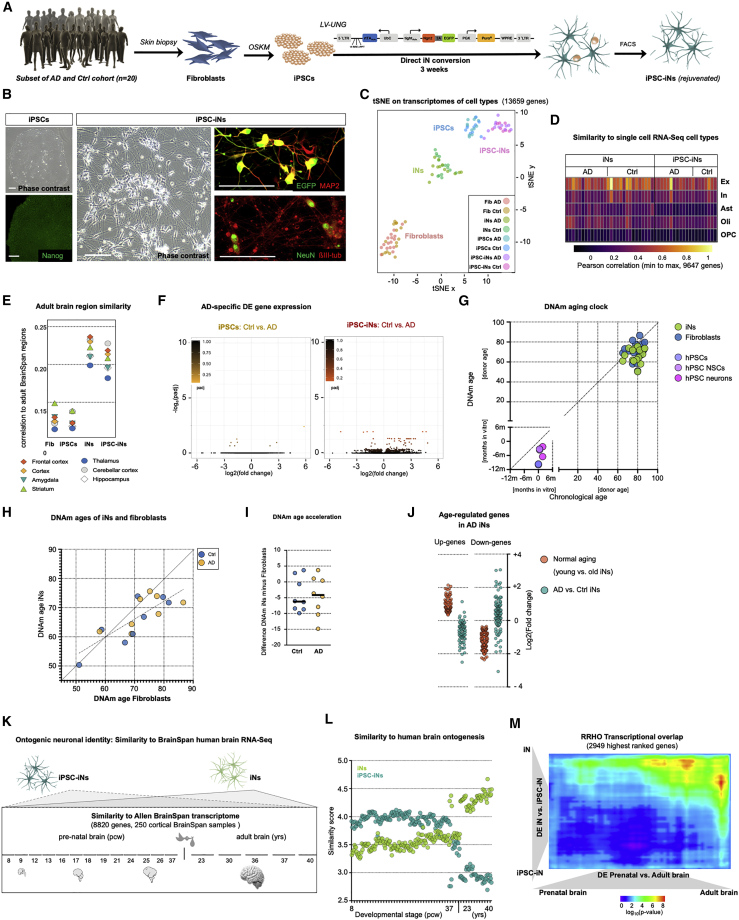
“Similar to iNs, iPSC-iN cultures contained vGlut1+ and GABA+ neurons and expressed marker genes for both subtypes, and both showed the highest similarity to cortical excitatory neurons from single-cell RNA-seq (scRNA-seq) data (Figure 7D; Figure S5; Mathys et al., 2019).”
§ Age-dependent instability of mature neuronal fate in induced neurons from Alzheimer’s patients > Results > Isogenic iPSC-derived neurons show only very dampened AD transcriptome changes
What the sources say
- Not checked yetcites Mathys et al., 2019 source
plain- Asserted: passes — The authors put it forward as true.
- Checkable: passes — It can be checked against evidence.
- Load-bearing: unclear — It is unclear whether the paper’s conclusions depend on it.
- Based: passes — The paper gives a reason why it holds.
It may state two separate claims as one.
A result the paper reports from its own data — it cites no other source for it, so there is none to check. The quote shows it is in the paper.
In the paper
“Differential peak analysis revealed 7,188 highly significantly differentially accessible peaks, 97% of which were gained in AD (Figure 6E).”
§ Age-dependent instability of mature neuronal fate in induced neurons from Alzheimer’s patients > Results > Epigenetic landscape changes underlie hypo-mature neuronal state
plaincorrelationaln = 21- Asserted: passes — The authors put it forward as true.
- Checkable: passes — It can be checked against evidence.
- Load-bearing: passes — The paper’s conclusions depend on it.
- Based: passes — The paper gives a reason why it holds.
It may state two separate claims as one.
A result the paper reports from its own data — it cites no other source for it, so there is none to check. The quote shows it is in the paper.
In the paper
“Similar to iNs, iPSC-iN cultures contained vGlut1+ and GABA+ neurons and expressed marker genes for both subtypes, and both showed the highest similarity to cortical excitatory neurons from single-cell RNA-seq (scRNA-seq) data (Figure 7D; Figure S5; Mathys et al., 2019).”
§ Age-dependent instability of mature neuronal fate in induced neurons from Alzheimer’s patients > Results > Isogenic iPSC-derived neurons show only very dampened AD transcriptome changes
plain- Asserted: passes — The authors put it forward as true.
- Checkable: passes — It can be checked against evidence.
- Load-bearing: unclear — It is unclear whether the paper’s conclusions depend on it.
- Based: passes — The paper gives a reason why it holds.
It may state two separate claims as one.
In the paper
“As shown previously, conversion of iPSCs to iPSC-iNs is highly efficient, as virtually all EGFP-positive iPSCs convert into neurons that also predominantly express NeuN and vGlut1 (Figures S5; Schafer et al., 2019).”
§ Age-dependent instability of mature neuronal fate in induced neurons from Alzheimer’s patients > Results > Isogenic iPSC-derived neurons show only very dampened AD transcriptome changes
What the sources say
- Not checked yetcites Schafer et al., 2019
plaindirect- Asserted: passes — The authors put it forward as true.
- Checkable: passes — It can be checked against evidence.
- Load-bearing: fails — The paper’s conclusions may not depend on it.
- Based: passes — The paper gives a reason why it holds.
Probably not a substantial claim. The paper’s conclusions may not depend on it. It may state two separate claims as one.
A result the paper reports from its own data — it cites no other source for it, so there is none to check. The quote shows it is in the paper.
In the paper
“iPSC-iNs showed more gene expression differences than iPSCs or fibroblasts, which did not reach statistical significance (Figure 7F).”
§ Age-dependent instability of mature neuronal fate in induced neurons from Alzheimer’s patients > Results > Isogenic iPSC-derived neurons show only very dampened AD transcriptome changes
plain- Asserted: passes — The authors put it forward as true.
- Checkable: passes — It can be checked against evidence.
- Load-bearing: unclear — It is unclear whether the paper’s conclusions depend on it.
- Based: passes — The paper gives a reason why it holds.
It may state two separate claims as one.
A result the paper reports from its own data — it cites no other source for it, so there is none to check. The quote shows it is in the paper.
In the paper
“As expected, we found that iPSC-iNs showed a relatively high degree of similarity with the transcriptomes of the pre-natal brain samples but exhibited relatively poor correlation with adult brain stages (Figure 7L; Figure S6).”
§ Age-dependent instability of mature neuronal fate in induced neurons from Alzheimer’s patients > Results > Directly converted iNs reflect an old and adult neuronal ontogenic identity, whereas iPSC-derived neurons represent rejuvenated and fetal-like states
plaincorrelational- Asserted: passes — The authors put it forward as true.
- Checkable: passes — It can be checked against evidence.
- Load-bearing: passes — The paper’s conclusions depend on it.
- Based: passes — The paper gives a reason why it holds.
It may state two separate claims as one.
In the paper
“Consistently, aging genes in iNs previously identified by RNA-seq from a healthy aging cohort did not show extended changes in AD iNs, and plotting AD iN DE genes across healthy aging iNs did not indicate their regulation by age; rather, a slightly inverse trend was detected (Figure 7J; Figure S6; Mertens et al., 2015a).”
§ Age-dependent instability of mature neuronal fate in induced neurons from Alzheimer’s patients > Results > Directly converted iNs reflect an old and adult neuronal ontogenic identity, whereas iPSC-derived neurons represent rejuvenated and fetal-like states
What the sources say
- Not checked yetcites Mertens et al., 2015a
plain- Asserted: passes — The authors put it forward as true.
- Checkable: passes — It can be checked against evidence.
- Load-bearing: passes — The paper’s conclusions depend on it.
- Based: passes — The paper gives a reason why it holds.
It may state two separate claims as one.
A result the paper reports from its own data — it cites no other source for it, so there is none to check. The quote shows it is in the paper.
In the paper
“Integration of single-nucleus RNA-seq data showed a similar pattern for excitatory and inhibitory neurons and further indicated that adult transcriptome identity is encoded primarily within excitatory neuronal profiles (Figure S6).”
§ Age-dependent instability of mature neuronal fate in induced neurons from Alzheimer’s patients > Results > Directly converted iNs reflect an old and adult neuronal ontogenic identity, whereas iPSC-derived neurons represent rejuvenated and fetal-like states
hedgedcorrelational- Asserted: passes — The authors put it forward as true.
- Checkable: passes — It can be checked against evidence.
- Load-bearing: unclear — It is unclear whether the paper’s conclusions depend on it.
- Based: passes — The paper gives a reason why it holds.
It may state two separate claims as one.
A result the paper reports from its own data — it cites no other source for it, so there is none to check. The quote shows it is in the paper.
In the paper
“Furthermore, along a PCA-based pre-natal versus adult variance dimension, iNs also mapped close to adult brain samples, whereas iPSC-iNs mapped close to pre-natal samples (Figure S6).”
§ Age-dependent instability of mature neuronal fate in induced neurons from Alzheimer’s patients > Results > Directly converted iNs reflect an old and adult neuronal ontogenic identity, whereas iPSC-derived neurons represent rejuvenated and fetal-like states
plaincorrelational- Asserted: passes — The authors put it forward as true.
- Checkable: passes — It can be checked against evidence.
- Load-bearing: passes — The paper’s conclusions depend on it.
- Based: passes — The paper gives a reason why it holds.
It may state two separate claims as one.
A result the paper reports from its own data — it cites no other source for it, so there is none to check. The quote shows it is in the paper.
In the paper
“Conversely, iNs displayed the highest similarity to the adult brain samples but not to pre-natal samples, and no similarity differences between control and AD iNs were detected (Figure 7L; Figure S6).”
§ Age-dependent instability of mature neuronal fate in induced neurons from Alzheimer’s patients > Results > Directly converted iNs reflect an old and adult neuronal ontogenic identity, whereas iPSC-derived neurons represent rejuvenated and fetal-like states
plaincorrelational- Asserted: passes — The authors put it forward as true.
- Checkable: passes — It can be checked against evidence.
- Load-bearing: passes — The paper’s conclusions depend on it.
- Based: passes — The paper gives a reason why it holds.
It may state two separate claims as one.
In the paper
“However, familial AD is comparatively rare, and sporadic AD cases that develop without clear genetic etiology represent the vast majority of cases, wherein disease risk increases exponentially with age (Querfurth and LaFerla, 2010).”
§ Age-dependent instability of mature neuronal fate in induced neurons from Alzheimer’s patients > Introduction
What the sources say
- Not checked yetcites Querfurth and LaFerla, 2010 source
plaindirect- Asserted: passes — The authors put it forward as true.
- Checkable: passes — It can be checked against evidence.
- Load-bearing: fails — The paper’s conclusions may not depend on it.
- Based: passes — The paper gives a reason why it holds.
Probably not a substantial claim. The paper’s conclusions may not depend on it. It may state two separate claims as one.
None of the sources cited for this claim have been checked yet.
In the paper
“In contrast, direct conversion of human fibroblasts into induced neurons (iNs) bypasses the embryo-like state and directly results in postmitotic neurons with mature marker expression and functionality (Liu et al., 2013; Pang et al., 2011).”
§ Age-dependent instability of mature neuronal fate in induced neurons from Alzheimer’s patients > Introduction
What the sources say
- Not checked yetcites Liu et al., 2013 source
- Not checked yetcites Pang et al., 2011
plaindirect- Asserted: passes — The authors put it forward as true.
- Checkable: passes — It can be checked against evidence.
- Load-bearing: passes — The paper’s conclusions depend on it.
- Based: passes — The paper gives a reason why it holds.
It may state two separate claims as one.
None of the sources cited for this claim have been checked yet.
In the paper
“However, reprogramming into pluripotency leaves old, donor-derived iPSC-derived neurons with practically no traces of their donors’ ages, and iPSC-associated cellular rejuvenation represents a major challenge when attempting to model age-dependent diseases (Böhnke et al., 2018; Kang et al., 2016; Mertens et al., 2015a; Miller et al., 2013; Tang et al., 2017).”
§ Age-dependent instability of mature neuronal fate in induced neurons from Alzheimer’s patients > Introduction
What the sources say
- Not checked yetcites Böhnke et al., 2018
- Not checked yetcites Kang et al., 2016
- Not checked yetcites Mertens et al., 2015a
plaindirect- Asserted: passes — The authors put it forward as true.
- Checkable: passes — It can be checked against evidence.
- Load-bearing: passes — The paper’s conclusions depend on it.
- Based: passes — The paper gives a reason why it holds.
It may state two separate claims as one.
What the paper did — it cites no source for this, so there is none to check. The quote shows it is in the paper.
In the paper
“Gene expression differences between the groups largely aligned with clinical diagnosis, whereas other classifiers did not appear to bias the detected DE genes (Figure 2B).”
§ Age-dependent instability of mature neuronal fate in induced neurons from Alzheimer’s patients > Results > Differential gene expression in iNs from AD patients
hedgedcorrelational- Asserted: passes — The authors put it forward as true.
- Checkable: passes — It can be checked against evidence.
- Load-bearing: passes — The paper’s conclusions depend on it.
- Based: passes — The paper gives a reason why it holds.
It may state two separate claims as one.
A conclusion the paper draws from its own results — it cites no other source for it, so there is none to check. The quote shows it is in the paper.
In the paper
“This hypo-mature state partially resembles both malignant transformation-like signatures and immature neuronal stages.”
§ Age-dependent instability of mature neuronal fate in induced neurons from Alzheimer’s patients > Results > Activation of an immature and transformation-like transcriptional program in AD iNs
plaincorrelational- Asserted: passes — The authors put it forward as true.
- Checkable: passes — It can be checked against evidence.
- Load-bearing: passes — The paper’s conclusions depend on it.
- Based: passes — The paper gives a reason why it holds.
It may state two separate claims as one.
A conclusion the paper draws from its own results — it cites no other source for it, so there is none to check. The quote shows it is in the paper.
In the paper
“Furthermore, the chromatin landscape signatures at key genes such as LDHA showed that AD iNs gained accessibility at normally silenced promoter regions, where gained accessibility leads to leaky expression and thus promotion of an immature neuronal state, stem cell- and cancer-associated signaling pathways, and precursor-like metabolic properties (Figure 6G).”
§ Age-dependent instability of mature neuronal fate in induced neurons from Alzheimer’s patients > Results > Epigenetic landscape changes underlie hypo-mature neuronal state
plaindirect- Asserted: passes — The authors put it forward as true.
- Checkable: passes — It can be checked against evidence.
- Load-bearing: passes — The paper’s conclusions depend on it.
- Based: passes — The paper gives a reason why it holds.
It may state two separate claims as one.
A conclusion the paper draws from its own results — it cites no other source for it, so there is none to check. The quote shows it is in the paper.
In the paper
“Overall, the AD iN-specific chromatin landscape changes accommodate a persistent lack of a differentiated identity and suggest that epigenetic changes might underlie the transcriptional and functional lack of the differentiated state in AD neurons.”
§ Age-dependent instability of mature neuronal fate in induced neurons from Alzheimer’s patients > Results > Epigenetic landscape changes underlie hypo-mature neuronal state
hedgedconditional- Asserted: passes — The authors put it forward as true.
- Checkable: passes — It can be checked against evidence.
- Load-bearing: passes — The paper’s conclusions depend on it.
- Based: passes — The paper gives a reason why it holds.
It may state two separate claims as one.
- Rests on an assumption: Stem and progenitor cells, as well as transformed cells, typically reflect a globally open chromatin state, whereas differentiated cells possess a more defined and closed chromatin landscape.
A conclusion the paper draws from its own results — it cites no other source for it, so there is none to check. The quote shows it is in the paper.
In the paper
“AD iNs thus successfully completed iN conversion but showed a lack of mature neuronal identity gene expression.”
§ Age-dependent instability of mature neuronal fate in induced neurons from Alzheimer’s patients > Results > Activation of an immature and transformation-like transcriptional program in AD iNs
plain- Asserted: passes — The authors put it forward as true.
- Checkable: passes — It can be checked against evidence.
- Load-bearing: passes — The paper’s conclusions depend on it.
- Based: passes — The paper gives a reason why it holds.
It may state two separate claims as one.
A conclusion the paper draws from its own results — it cites no other source for it, so there is none to check. The quote shows it is in the paper.
In the paper
“Thus, AD iNs show signs of elevated ROS, DNA damage, and aneuploid DNA contents, which may trigger neuronal de-differentiation and lead to an aberrant hypo-mature cellular state that partially mirrors a stem/progenitor-associated transcriptional program and expression of non-neuronal proteins, including markers of cell cycle and non-neuronal energy metabolism.”
§ Age-dependent instability of mature neuronal fate in induced neurons from Alzheimer’s patients > Results > AD patient iNs display markers of stress-related de-differentiation
hedgedconditional- Asserted: passes — The authors put it forward as true.
- Checkable: passes — It can be checked against evidence.
- Load-bearing: passes — The paper’s conclusions depend on it.
- Based: passes — The paper gives a reason why it holds.
It may state two separate claims as one.
- Rests on an assumption: LDHA is inversely associated with mature neuronal identity.
What the paper did — it cites no source for this, so there is none to check. The quote shows it is in the paper.
In the paper
“Both control and AD iNs showed an equally increasing similarity, paralleling progressive iN conversion, and they exhibited equivalent conversion efficiencies, loss of fibroblast signatures, and iN identity marked by NeuN (Figures 1D and 1E; Figures S1 and S3).”
§ Age-dependent instability of mature neuronal fate in induced neurons from Alzheimer’s patients > Results > Activation of an immature and transformation-like transcriptional program in AD iNs
plain- Asserted: passes — The authors put it forward as true.
- Checkable: passes — It can be checked against evidence.
- Load-bearing: passes — The paper’s conclusions depend on it.
- Based: passes — The paper gives a reason why it holds.
It may state two separate claims as one.
None of the sources cited for this claim have been checked yet.
In the paper
“Erosion of epigenetic control and transcriptional drift and the incidence of malignant transformation are strongly associated with human aging (Veitia et al., 2017; Zheng et al., 2016a).”
§ Age-dependent instability of mature neuronal fate in induced neurons from Alzheimer’s patients > Results > Isogenic iPSC-derived neurons show only very dampened AD transcriptome changes
What the sources say
- Not checked yetcites Veitia et al., 2017
- Not checked yetcites Zheng et al., 2016a
boostedcorrelational- Asserted: passes — The authors put it forward as true.
- Checkable: passes — It can be checked against evidence.
- Load-bearing: fails — The paper’s conclusions may not depend on it.
- Based: passes — The paper gives a reason why it holds.
Probably not a substantial claim. The paper’s conclusions may not depend on it. It may state two separate claims as one.
None of the sources cited for this claim have been checked yet.
In the paper
“Neuronal de-differentiation, loss of mature neuronal fate, and markers that suggest a re-entry of neurons into the cell cycle are pathological hallmarks of AD (Arendt, 2012; Arendt et al., 2000; Busser et al., 1998; Currais et al., 2009; Herrup and Yang, 2007; McShea et al., 1999; Nagy et al., 1997; Yang et al., 2001).”
§ Age-dependent instability of mature neuronal fate in induced neurons from Alzheimer’s patients > Discussion
What the sources say
- Not checked yetcites Arendt, 2012
- Not checked yetcites Arendt et al., 2000
- Not checked yetcites Busser et al., 1998
plaincorrelational- Asserted: passes — The authors put it forward as true.
- Checkable: passes — It can be checked against evidence.
- Load-bearing: passes — The paper’s conclusions depend on it.
- Based: passes — The paper gives a reason why it holds.
It may state two separate claims as one.
None of the sources cited for this claim have been checked yet.
In the paper
“Outside of the nervous system, epigenetic erosion and loss of cell identity are established key features of aging (Ma et al., 2018; Teschendorff et al., 2013; Veitia et al., 2017; Wang et al., 2008; Zheng et al., 2016a).”
§ Age-dependent instability of mature neuronal fate in induced neurons from Alzheimer’s patients > Discussion
What the sources say
- Not checked yetcites Ma et al., 2018
- Not checked yetcites Teschendorff et al., 2013
- Not checked yetcites Veitia et al., 2017
boostedcorrelational- Asserted: passes — The authors put it forward as true.
- Checkable: passes — It can be checked against evidence.
- Load-bearing: fails — The paper’s conclusions may not depend on it.
- Based: passes — The paper gives a reason why it holds.
Probably not a substantial claim. The paper’s conclusions may not depend on it.
None of the sources cited for this claim have been checked yet.
In the paper
“Our data are consistent with the observation that oxidative stress and DNA damage can induce cell cycle re-entry markers of neurons (Walton et al., 2019; Yang et al., 2001), leading to neuronal hypo-maturity and functional defects (Kruman et al., 2004; Sharma et al., 2017), that might further lead to metabolic reprogramming, activation of cell death competence (Benn and Woolf, 2004; Kole et al., 2”
§ Age-dependent instability of mature neuronal fate in induced neurons from Alzheimer’s patients > Discussion
What the sources say
- Not checked yetcites Walton et al., 2019
- Not checked yetcites Yang et al., 2001
- Not checked yetcites Kruman et al., 2004
hedgeddirect- Asserted: passes — The authors put it forward as true.
- Checkable: passes — It can be checked against evidence.
- Load-bearing: passes — The paper’s conclusions depend on it.
- Based: passes — The paper gives a reason why it holds.
It may state two separate claims as one.
A conclusion the paper draws from its own results — it cites no other source for it, so there is none to check. The quote shows it is in the paper.
In the paper
“These data further support the view that features of AD relate to, but are distinct from, the features of normal aging, and their emergence in human cell culture models depends on age and adult-specific neuronal features.”
§ Age-dependent instability of mature neuronal fate in induced neurons from Alzheimer’s patients > Results > Directly converted iNs reflect an old and adult neuronal ontogenic identity, whereas iPSC-derived neurons represent rejuvenated and fetal-like states
hedgedcorrelational- Asserted: passes — The authors put it forward as true.
- Checkable: passes — It can be checked against evidence.
- Load-bearing: passes — The paper’s conclusions depend on it.
- Based: passes — The paper gives a reason why it holds.
It may state two separate claims as one.
What the paper did — it cites no source for this, so there is none to check. The quote shows it is in the paper.
In the paper
“They were followed for at least 2 years after biopsy with no evidence of cognitive decline (controls) and with evidence of progressive impairment (AD).”
§ Age-dependent instability of mature neuronal fate in induced neurons from Alzheimer’s patients > STAR★Methods > Experimental model and subject details
plain- Asserted: passes — The authors put it forward as true.
- Checkable: passes — It can be checked against evidence.
- Load-bearing: fails — The paper’s conclusions may not depend on it.
- Based: passes — The paper gives a reason why it holds.
Probably not a substantial claim. The paper’s conclusions may not depend on it. It may state two separate claims as one.
None of the sources cited for this claim have been checked yet.
In the paper
“Injury is a well-established trigger of cellular de-differentiation, and the changes we observed are likely a consequence of human neurons adhering to this principle (Gu et al., 2020; Jopling et al., 2010; Poplawski et al., 2020; Renthal et al., 2020; Tzahor and Poss, 2017; Wagner et al., 2017).”
§ Age-dependent instability of mature neuronal fate in induced neurons from Alzheimer’s patients > Discussion
What the sources say
boosteddirect- Asserted: passes — The authors put it forward as true.
- Checkable: passes — It can be checked against evidence.
- Load-bearing: fails — The paper’s conclusions may not depend on it.
- Based: passes — The paper gives a reason why it holds.
Probably not a substantial claim. The paper’s conclusions may not depend on it.
None of the sources cited for this claim have been checked yet.
In the paper
“Collectively, for studying age-related vulnerability and mechanisms relevant to AD, iNs have advantages over iPSC models and thus complement isogenic iPSC strategies (van der Kant et al., 2019; Meyer et al., 2019; Woodruff et al., 2013).”
§ Age-dependent instability of mature neuronal fate in induced neurons from Alzheimer’s patients > Discussion
What the sources say
plain- Asserted: passes — The authors put it forward as true.
- Checkable: passes — It can be checked against evidence.
- Load-bearing: passes — The paper’s conclusions depend on it.
- Based: passes — The paper gives a reason why it holds.
It may state two separate claims as one.
What the paper did — it cites no source for this, so there is none to check. The quote shows it is in the paper.
In the paper
“All data for one experiment were acquired from cells cultured and processed in parallel on the same microscope with the exact same setting used.”
§ Age-dependent instability of mature neuronal fate in induced neurons from Alzheimer’s patients > STAR★Methods > Method details
plain- Asserted: passes — The authors put it forward as true.
- Checkable: passes — It can be checked against evidence.
- Load-bearing: fails — The paper’s conclusions may not depend on it.
- Based: passes — The paper gives a reason why it holds.
Probably not a substantial claim. The paper’s conclusions may not depend on it.
What the paper did — it cites no source for this, so there is none to check. The quote shows it is in the paper.
In the paper
“Statistical values were corrected for false discovery rates (FDR) using the Benjamini-Hochberg method implemented in R.”
§ Age-dependent instability of mature neuronal fate in induced neurons from Alzheimer’s patients > STAR★Methods > Method details
plain- Asserted: passes — The authors put it forward as true.
- Checkable: passes — It can be checked against evidence.
- Load-bearing: fails — The paper’s conclusions may not depend on it.
- Based: passes — The paper gives a reason why it holds.
Probably not a substantial claim. The paper’s conclusions may not depend on it.
None of the sources cited for this claim have been checked yet.
In the paper
“Previous studies on Huntington’s disease have consistently detected signs of neuronal epigenetic instability (Ayata et al., 2018; von Schimmelmann et al., 2016).”
§ Age-dependent instability of mature neuronal fate in induced neurons from Alzheimer’s patients > Discussion
What the sources say
boosted- Asserted: passes — The authors put it forward as true.
- Checkable: passes — It can be checked against evidence.
- Load-bearing: fails — The paper’s conclusions may not depend on it.
- Based: passes — The paper gives a reason why it holds.
Probably not a substantial claim. The paper’s conclusions may not depend on it.
What the paper did — it cites no source for this, so there is none to check. The quote shows it is in the paper.
In the paper
“Both AD and control subjects underwent rigorous clinical assessment as part of the ADRC study, including detailed neuropsychological testing and brain imaging (MRI), and the subjects selected for biopsies were stratified to show either a clear non-demented clinical picture or clear phenotype of AD (classified as probable AD until pathological confirmation).”
§ Age-dependent instability of mature neuronal fate in induced neurons from Alzheimer’s patients > STAR★Methods > Experimental model and subject details
plain- Asserted: passes — The authors put it forward as true.
- Checkable: passes — It can be checked against evidence.
- Load-bearing: passes — The paper’s conclusions depend on it.
- Based: passes — The paper gives a reason why it holds.
Probably not a substantial claim. It may state two separate claims as one.
In the paper
“the ‘in vitro clock,’ also known as the ‘skin and blood clock,’ was used as it best predicts chronological ages of cell culture samples (Horvath et al., 2019).”
§ Age-dependent instability of mature neuronal fate in induced neurons from Alzheimer’s patients > STAR★Methods > Method details
What the sources say
- Not checked yetcites Horvath et al., 2019
plaincorrelational- Asserted: passes — The authors put it forward as true.
- Checkable: passes — It can be checked against evidence.
- Load-bearing: fails — The paper’s conclusions may not depend on it.
- Based: passes — The paper gives a reason why it holds.
Probably not a substantial claim. The paper’s conclusions may not depend on it.
The paper relies on this without support.
Aging is crucial for age-related neurodegenerative diseases to unfold.
“Because aging is likely crucial for age-related neurodegenerative diseases to unfold, we generated age-equivalent fibroblast-derived iNs from a cohort of primarily sporadic AD patients and cognitively normal controls.”
The paper relies on this without support.
Stem and progenitor cells, as well as transformed cells, typically reflect a globally open chromatin state, whereas differentiated cells possess a more defined and closed chromatin landscape.
“Stem and progenitor cells, as well as transformed cells, typically reflect a globally open chromatin state, whereas differentiated cells possess a more defined and closed chromatin landscape (Figure 6A).”
The paper relies on this without support.
LDHA is inversely associated with mature neuronal identity.
“We assessed lactate dehydrogenase A (LDHA), a canonical glycolysis gene that is inversely associated with mature neuronal identity and is downregulated during neuronal differentiation (Figure 5G).”
The paper relies on this without support.
Transcriptome similarity between cultured neurons and BrainSpan cortical samples reflects their ontogenic (developmental) identity.
“To classify the iNs and iPSC-iNs on an ontogenic identity scale, we compared our transcriptome data with samples from the entire range of human cortical brain development (Figure 7K).”
Claims other papers make about this one
Each is checked against this paper’s own text: does it say what the citing paper says it does?
The source backs part of the claim, not all of it — or backs it for a different population, condition or comparison.
In the citing paper
“These neurons exhibited several age-associated dysregulations such as instability of mature neuronal fate, increased cellular senescence, and metabolic shifts (11, 24, 25)”
From Modeling late-onset Alzheimer’s disease neuropathology via direct neuronal reprogramming (2024) · cites this paper as [11]
Experimental — accuracy not yet measuredThe source backs part of the claim, not all of it — or backs it for a different population, condition or comparison.
In the citing paper
“but no AD hallmark neuropathology was shown.”
From Modeling late-onset Alzheimer’s disease neuropathology via direct neuronal reprogramming (2024) · cites this paper as [11]
Experimental — accuracy not yet measuredThe cited source says what the claim attributes to it.
In the citing paper
“Recent studies have directly induced neurons from individuals with AD through NGN2/ASCL1 overexpression.”
From Modeling late-onset Alzheimer’s disease neuropathology via direct neuronal reprogramming (2024) · cites this paper as [11]
The cited source says what the claim attributes to it.
In the citing paper
“A caveat of our study arises from the nature of hiPSC models, which remove the ‘age’ associated epigenetic signatures that may contribute significantly to AD progression (Mertens et al., 2021).”
From Cholesterol and matrisome pathways dysregulated in astrocytes and microglia (2022) · cites this paper as Mertens et al., 2021
In the citing paper
“More recently, increased ROS and DSBs have also been documented in neurons derived directly from sporadic AD patient fibroblasts, indicating that age‐dependent features of genomic instability are recapitulated in human in vitro models of disease (Mertens et al, 2021).”
From Mechanisms of DNA damage-mediated neurotoxicity in neurodegenerative disease (2022) · cites this paper as Mertens et al, 2021
Self-check
Percentages, sums and reported differences re-computed from the paper’s own numbers.
Each contradiction between two passages listed here was confirmed by an independent check.
Rated minor: it would not touch a result — a value no result rests on, a p-value that stays on the same side of the significance level, or a conflict that is clerical, resolved elsewhere in the paper, or outside its own findings.
In the paper
§ Age-dependent instability of mature neuronal fate in induced neurons from Alzheimer’s patients > STAR★Methods > Key resources table
“| pLVXUbC-rtTA-Ngn2:2A:Ascl1 | (Herdy et al., 2019) | Addgene #127289 | | pLVXUbC-rtTA-Ngn2:2A:EGFP | (Schafer et al., 2019) | Addgene #84777 |”
§ Age-dependent instability of mature neuronal fate in induced neurons from Alzheimer’s patients > STAR★Methods > Resource availability
“Direct conversion lentiviral plasmids have been deposited to Addgene #127288 (pLVX-UbC-rtTA-Ngn2:2A:Ascl1) and #127289 (pLVX-UbC-rtTA-Ngn2:2A:EGFP).”
Rated minor: it would not touch a result — a value no result rests on, a p-value that stays on the same side of the significance level, or a conflict that is clerical, resolved elsewhere in the paper, or outside its own findings.
In the paper
§ Age-dependent instability of mature neuronal fate in induced neurons from Alzheimer’s patients > Results > Loss of mature neuronal gene expression and in vitro functionality in AD iNs
“(I) Ca2+ event number in control (n = 160 cells; five donors) and AD neurons (n = 184 cells; five donors).”
§ Age-dependent instability of mature neuronal fate in induced neurons from Alzheimer’s patients > STAR★Methods > Method details
“Control and AD iNs (n = 10) were assessed with 3 fields recorded for each donor. We analyzed 10 cells per field that were hSyn-dsRed+ and exhibited neuron morphologies.”
Rated minor: it would not touch a result — a value no result rests on, a p-value that stays on the same side of the significance level, or a conflict that is clerical, resolved elsewhere in the paper, or outside its own findings.
In the paper
§ Age-dependent instability of mature neuronal fate in induced neurons from Alzheimer’s patients > Results > Loss of mature neuronal gene expression and in vitro functionality in AD iNs
“Then we tested representative, previously defined mature neuronal gene sets and corresponding marker genes, including synaptic plasticity and NRFS/REST targets, that were markedly downregulated in AD iNs (Figures 4C and 4D; Kim et al., 2015; Satoh et al., 2013).”
§ Age-dependent instability of mature neuronal fate in induced neurons from Alzheimer’s patients > Results > Loss of mature neuronal gene expression and in vitro functionality in AD iNs
“(C) Violin plot showing expression changes in control versus AD iNs of published gene sets that represent mature neuronal identity. Significance values for each gene set are based on comparison with fibroblast and iPSC-iNs from the same cohort (Figures S5H and S5I). (D) Bar graphs showing fold changes and significance of downregulated mature neuronal marker genes in AD versus control iNs.”
Citations
Cites
Induction of Pluripotent Stem Cells from Adult Human Fibroblasts by Defined Factors
Takahashi, K., Tanabe, K., Ohnuki, M., Narita, M., Ichisaka, T., Tomoda, K., & Yamanaka, S. (2007) · Cell · doi:10.1016/j.cell.2007.11.019 · Cited by 20,221
DNA methylation age of human tissues and cell types
Horvath, S. (2013) · Genome Biology · doi:10.1186/gb-2013-14-10-r115 · Cited by 7,075
Self-citationBuenrostro, J. D., Giresi, P. G., Zaba, L. C., Chang, H. Y., & Greenleaf, W. J. (2013) · Nature Methods · doi:10.1038/nmeth.2688 · Cited by 6,422
2016 Alzheimer's disease facts and figures
Alzheimer's Association (2016) · Alzheimer's & Dementia · doi:10.1016/j.jalz.2016.03.001 · Cited by 5,069
Querfurth, H. W., & LaFerla, F. M. (2010) · New England Journal of Medicine · doi:10.1056/nejmra0909142 · Cited by 4,569
Scheltens, P., Blennow, K., Breteler, M. M. B., de Strooper, B., Frisoni, G. B., Salloway, S., & Van der Flier, W. M. (2016) · The Lancet · doi:10.1016/s0140-6736(15)01124-1 · Cited by 3,125
Single-cell transcriptomic analysis of Alzheimer’s disease
Mathys, H., Davila-Velderrain, J., Peng, Z., Gao, F., Mohammadi, S., Young, J. Z., Menon, M., He, L., Abdurrob, F., Jiang, X., et al. (2019) · Nature · doi:10.1038/s41586-019-1195-2 · Cited by 2,568
Oncogenic pathway signatures in human cancers as a guide to targeted therapies
Bild, A., Yao, G., Chang, J. T., Wang, Q., Potti, A., Chasse, D. A. D., Joshi, M.-B., Harpole, D. H., Lancaster, J. M., Berchuck, A., et al. (2005) · Nature · doi:10.1038/nature04296 · Cited by 2,008
The Cellular Phase of Alzheimer’s Disease
De Strooper, B., & Karran, E. (2016) · Cell · doi:10.1016/j.cell.2015.12.056 · Cited by 1,990
2015 Alzheimer's disease facts and figures
Alzheimer's Association (2015) · Alzheimer s & Dementia · doi:10.1016/j.jalz.2015.02.003 · Cited by 1,673
Cited by
Sorted by citations
Induced pluripotent stem cells (iPSCs): molecular mechanisms of induction and applications
Cerneckis, J., Cai, H., & Shi, Y. (2024) · Signal Transduction and Targeted Therapy · doi:10.1038/s41392-024-01809-0 · Cited by 452
Cholesterol and matrisome pathways dysregulated in astrocytes and microglia
TCW, J., Qian, L., Pipalia, N. H., Chao, M. J., Liang, S. A., Shi, Y., Jain, B. R., Bertelsen, S. E., Kapoor, M., Marcora, E., et al. (2022) · Cell · doi:10.1016/j.cell.2022.05.017 · Cited by 411
Neuronal cell death mechanisms in Alzheimer’s disease: An insight
Goel, P., Chakrabarti, S., Goel, K., Bhutani, K., Chopra, T., & Bali, S. (2022) · Frontiers in Molecular Neuroscience · doi:10.3389/fnmol.2022.937133 · Cited by 242
MEG3 activates necroptosis in human neuron xenografts modeling Alzheimer’s disease
Balusu, S., Horré, K., Thrupp, N., Craessaerts, K., Snellinx, A., Serneels, L., T’Syen, D., Chrysidou, I., Arranz, A. M., Sierksma, A. S. R., et al. (2023) · Science · doi:10.1126/science.abp9556 · Cited by 246
Herdy, J. R., Traxler, L., Agarwal, R. K., Karbacher, L., Schlachetzki, J. C. M., Boehnke, L., Zangwill, D., Galasko, D., Glass, C. K., Mertens, J., et al. (2022) · Cell Stem Cell · doi:10.1016/j.stem.2022.11.010 · Cited by 208
Self-citationiPSC-based disease modeling and drug discovery in cardinal neurodegenerative disorders
Okano, H., & Morimoto, S. (2022) · Cell stem cell · doi:10.1016/j.stem.2022.01.007 · Cited by 206
Epigenomic dissection of Alzheimer’s disease pinpoints causal variants and reveals epigenome erosion
Xiong, X., James, B. T., Boix, C. A., Park, Y. P., Galani, K., Victor, M. B., Sun, N., Hou, L., Ho, L.-L., Mantero, J., et al. (2023) · Cell · doi:10.1016/j.cell.2023.08.040 · Cited by 205
Traxler, L., Herdy, J. R., Stefanoni, D., Eichhorner, S., Pelucchi, S., Szücs, A., Santagostino, A., Kim, Y., Agarwal, R. K., Schlachetzki, J. C. M., et al. (2022) · Cell Metabolism · doi:10.1016/j.cmet.2022.07.014 · Cited by 179
Self-citationAdult hippocampal neurogenesis in Alzheimer’s disease: A roadmap to clinical relevance
Salta, E., Lazarov, O., Fitzsimons, C. P., Tanzi, R. E., Lucassen, P. J., & Choi, S. H. (2023) · Cell stem cell · doi:10.1016/j.stem.2023.01.002 · Cited by 171
Microglial lipid droplet accumulation in tauopathy brain is regulated by neuronal AMPK
Li, Y., Munoz-Mayorga, D., Nie, Y., Kang, N., Tao, Y., Lagerwall, J., Pernaci, C., Curtin, G., Coufal, N. G., Mertens, J., et al. (2024) · Cell Metabolism · doi:10.1016/j.cmet.2024.03.014 · Cited by 160
Self-citationThe interaction between ageing and Alzheimer's disease: insights from the hallmarks of ageing
Liu, Y., Tan, Y., Zhang, Z., Yi, M., Zhu, L., & Peng, W. (2024) · Translational Neurodegeneration · doi:10.1186/s40035-024-00397-x · Cited by 156
Direct neuronal reprogramming: Fast forward from new concepts toward therapeutic approaches
Bocchi, R., Masserdotti, G., & Götz, M. (2021) · Neuron · doi:10.1016/j.neuron.2021.11.023 · Cited by 131
Mechanisms of DNA damage-mediated neurotoxicity in neurodegenerative disease
Welch, G., & Tsai, L. (2022) · The EMBO Reports · doi:10.15252/embr.202154217 · Cited by 129
Barák, M., Fedorová, V., Pospíšilová, V., Raška, J., Vochyánová, S., Sedmík, J., Hříbková, H., Klímová, H., Váňová, T., & Bohačiaková, D. (2022) · Stem Cell Reviews and Reports · doi:10.1007/s12015-021-10254-3 · Cited by 102
Proteostasis and lysosomal repair deficits in transdifferentiated neurons of Alzheimer’s disease
Chou, C.-C., Vest, R., Prado, M. A., Wilson-Grady, J., Paulo, J. A., Shibuya, Y., Moran-Losada, P., Lee, T.-T., Luo, J., Gygi, S. P., et al. (2025) · Nature Cell Biology · doi:10.1038/s41556-025-01623-y · Cited by 94
Welch, G. M., Boix, C. A., Schmauch, E., Davila-Velderrain, J., Victor, M. B., Dileep, V., Bozzelli, P. L., Su, Q., Cheng, J. D., Lee, A., et al. (2022) · Science Advances · doi:10.1126/sciadv.abo4662 · Cited by 84
Human neuronal maturation comes of age: cellular mechanisms and species differences
Wallace, J. L., & Pollen, A. A. (2024) · Nature Reviews Neuroscience · doi:10.1038/s41583-023-00760-3 · Cited by 82
Modeling late-onset Alzheimer’s disease neuropathology via direct neuronal reprogramming
Sun, Z., Kwon, J.-S., Ren, Y., Chen, S., Walker, C. K., Lu, X., Cates, K., Karahan, H., Sviben, S., Fitzpatrick, J. A. J., et al. (2024) · Science · doi:10.1126/science.adl2992 · Cited by 77
“These results underscore the potential of 3D neuronal reprogramming to model age-dependent A β deposition in LOAD neurons.”
Váňová, T., Sedmík, J., Raška, J., Černá, K. A., Tauš, P., Pospisilova, V., Nezvedová, M., Fedorová, V., Kadakova, S., Klímová, H., et al. (2023) · Cell Reports · doi:10.1016/j.celrep.2023.113310 · Cited by 81
Integrated transcriptome landscape of ALS identifies genome instability linked to TDP-43 pathology
Ziff, O. J., Neeves, J., Mitchell, J. S., Tyzack, G. E., Martínez‐Ruiz, C., Luisier, R., Chakrabarti, A. M., McGranahan, N., Litchfield, K., Boulton, S. J., et al. (2023) · Nature Communications · doi:10.1038/s41467-023-37630-6 · Cited by 75
Therapeutic targeting of senescent cells in the CNS
Riessland, M., Ximerakis, M., Jarjour, A. A., Zhang, B., & Orr, M. E. (2024) · Nature Reviews Drug Discovery · doi:10.1038/s41573-024-01033-z · Cited by 77
Capano, L. S., Sato, C., Ficulle, E., Yu, A., Horie, K., Kwon, J.-S., Burbach, K. F., Barthélemy, N. R., Fox, S. G., Karch, C. M., et al. (2022) · Cell Stem Cell · doi:10.1016/j.stem.2022.04.018 · Cited by 65
Ji, Y., Chen, X., Wang, Z., Meek, C. J., McLean, J. L., Yang, Y., Yuan, C., Rochet, J., Liu, F., & Xu, R. (2025) · Molecular Psychiatry · doi:10.1038/s41380-025-03041-w · Cited by 67
The future of stem cell therapies of Alzheimer’s disease
Wang, Z., Wang, Z.-T., Sun, Y., Tan, L., & Yu, J. (2022) · Ageing Research Reviews · doi:10.1016/j.arr.2022.101655 · Cited by 62
Ring, N., Valdivieso, K., Grillari, J., Redl, H. R., & Ogrodnik, M. B. (2022) · Developmental Cell · doi:10.1016/j.devcel.2022.04.005 · Cited by 59
Stern, S., Lau, S., Manole, A., Rosh, I., Percia, M. M., Ezer, R. B., Shokhirev, M. N., Qiu, F., Schafer, S. T., Mansour, A. A., et al. (2022) · npj Parkinson s Disease · doi:10.1038/s41531-022-00366-z · Cited by 60
Self-citationSaurat, N. G., Minotti, A. P., Rahman, M. T., Sikder, T., Zhang, C., Cornacchia, D., Jungverdorben, J., Ciceri, G., Betel, D., & Studer, L. (2024) · Cell stem cell · doi:10.1016/j.stem.2024.06.001 · Cited by 60
Metabolism navigates neural cell fate in development, aging and neurodegeneration
Traxler, L., Lagerwall, J., Eichhorner, S., Stefanoni, D., D’Alessandro, A., & Mertens, J. (2021) · Disease Models & Mechanisms · doi:10.1242/dmm.048993 · Cited by 57
Self-citationCellular plasticity in reprogramming, rejuvenation and tumorigenesis: a pioneer TF perspective
Huyghe, A., Trajkova, A., & Lavial, F. (2024) · Trends in Cell Biology · doi:10.1016/j.tcb.2023.07.013 · Cited by 56
Altered Extracellular Vesicle miRNA Profile in Prodromal Alzheimer’s Disease
Visconte, C., Fenoglio, C., Serpente, M., Muti, P., Sacconi, A., Rigoni, M., Arighi, A., Borracci, V., Arcaro, M., Arosio, B., et al. (2023) · International Journal of Molecular Sciences · doi:10.3390/ijms241914749 · Cited by 57
Neurodegeneration cell per cell
Balusu, S., Praschberger, R., Lauwers, E., Strooper, B. D., & Verstreken, P. (2023) · Neuron · doi:10.1016/j.neuron.2023.01.016 · Cited by 53
Alzheimer’s disease and related tauopathies: disorders of disrupted neuronal identity
Frost, B. E. (2023) · Trends in Neurosciences · doi:10.1016/j.tins.2023.07.006 · Cited by 58
Cellular reprogramming as a tool to model human aging in a dish
Pitrez, P. R., Monteiro, L. M., Borgogno, O., Nissan, X., Mertens, J., & Ferreira, L. (2024) · Nature Communications · doi:10.1038/s41467-024-46004-5 · Cited by 51
Self-citationDrouin‐Ouellet, J., Legault, E. M., Nilsson, F., Pircs, K., Bouquety, J., Petit, F., Shrigley, S., Birtele, M., Pereira, M., Storm, P., et al. (2022) · Stem Cell Reports · doi:10.1016/j.stemcr.2022.08.010 · Cited by 49
Namboori, S. C., Thomas, P., Ames, R. M., Hawkins, S., Garrett, L. O., Willis, C. R. G., Rosa, A., Stanton, L. W., & Bhinge, A. (2021) · Stem Cell Reports · doi:10.1016/j.stemcr.2021.10.010 · Cited by 41
Rosh, I., Tripathi, U., Hussein, Y., Rike, W. A., Djamus, J., Shklyar, B., Manole, A., Houlden, H., Winkler, J., Gage, F. H., et al. (2024) · npj Parkinson s Disease · doi:10.1038/s41531-024-00653-x · Cited by 41
Self-citationSenopathies-Diseases Associated with Cellular Senescence
Lushchak, O., Schosserer, M., & Grillari, J. (2023) · Biomolecules · doi:10.3390/biom13060966 · Cited by 35
Tools for studying human microglia: In vitro and in vivo strategies
Warden, A. S., Han, C. Z., Hansen, E. A., Trescott, S., Nguyen, C. T., Kim, R. Y., Schafer, D. M., Johnson, A., Wright, M., Ramírez, G., et al. (2022) · Brain Behavior and Immunity · doi:10.1016/j.bbi.2022.10.008 · Cited by 38
Strategies for modeling aging and age-related diseases
Jothi, D., & Kulka, L. A. M. (2024) · npj Aging · doi:10.1038/s41514-024-00161-5 · Cited by 39
Neural cell state shifts and fate loss in ageing and age-related diseases
Traxler, L., Lucciola, R., Herdy, J. R., Jones, J. R., Mertens, J., & Gage, F. H. (2023) · Nature Reviews Neurology · doi:10.1038/s41582-023-00815-0 · Cited by 37
Self-citationPiperidine: A Versatile Heterocyclic Ring for Developing Monoamine Oxidase Inhibitors
Jayan, J., Chandran, N., Thekkantavida, A. C., Abdelgawad, M. A., Ghoneim, M. M., Shaker, M. E., Uniyal, P., Benny, F., Zachariah, S. M., Kumar, S., et al. (2023) · ACS Omega · doi:10.1021/acsomega.3c05883 · Cited by 34
Current Position and Future Direction of Inflammation in Neuropsychiatric Disorders
Upthegrove, R., Zuelli, F. M. D. G. C., Couch, A. C. M., Barnes, N. M., & Vernon, A. C. (2025) · JAMA Psychiatry · doi:10.1001/jamapsychiatry.2025.1369 · Cited by 40
Integration of iPSC-Derived Microglia into Brain Organoids for Neurological Research
Mrza, M. A., He, J., & Wang, Y. (2024) · International Journal of Molecular Sciences · doi:10.3390/ijms25063148 · Cited by 31
Aversano, S., Caiazza, C., & Caiazzo, M. (2022) · Frontiers in Aging Neuroscience · doi:10.3389/fnagi.2022.1069482 · Cited by 33
Guo, W., Wang, H., Tharkeshwar, A. K., Couthouis, J., Braems, E., Masrori, P., Schoor, E. V., Fan, Y., Ahuja, K., Moisse, M., et al. (2022) · Alzheimer s & Dementia · doi:10.1002/alz.12760 · Cited by 31
Weigel, B., Tegethoff, J. F., Grieder, S. D., Lim, B., Nagarajan, B., Liu, Y.-C., Truberg, J., Papageorgiou, D., Adrian-Segarra, J. M., Schmidt, L. K., et al. (2023) · Molecular Psychiatry · doi:10.1038/s41380-023-01959-7 · Cited by 31
Wang, X., Ding, C., & Li, H. (2023) · Science China Life Sciences · doi:10.1007/s11427-023-2376-0 · Cited by 29
Maiden voyage: induced pluripotent stem cell-based drug screening for amyotrophic lateral sclerosis
Ito, D., Morimoto, S., Takahashi, S., Okada, K., Nakahara, J., & Okano, H. (2022) · Brain · doi:10.1093/brain/awac306 · Cited by 28
Tripathi, U., Rosh, I., Ezer, R. B., Nayak, R., Hussein, Y., Choudhary, A., Djamus, J., Manole, A., Houlden, H., Gage, F. H., et al. (2024) · npj Parkinson s Disease · doi:10.1038/s41531-024-00715-0 · Cited by 34
Self-citationProgress and challenges in directing the differentiation of human iPSCs into spinal motor neurons
Bautista, C. M. C., & Sterneckert, J. L. (2023) · Frontiers in Cell and Developmental Biology · doi:10.3389/fcell.2022.1089970 · Cited by 27
Modeling Alzheimer’s disease using human cell derived brain organoids and 3D models
Fernandes, S., Revanna, J. S., Pratt, J. M., Hayes, N., Marchetto, M. C., & Gage, F. H. (2024) · Frontiers in Neuroscience · doi:10.3389/fnins.2024.1434945 · Cited by 33
Self-citationExperimental modeling of Alzheimer's disease: Translational lessons from cross‐taxon analyses
Yenkoyan, K. B., Kotova, M. M., Apukhtin, K. V., Galstyan, D. S., Amstislavskaya, T. G., Strekalova, T. V., de Abreu, M. S., Chavushyan, V. A., Lim, L. W., Yang, L., et al. (2025) · Alzheimer s & Dementia · doi:10.1002/alz.70273 · Cited by 30
NF-κB in Alzheimer’s Disease: Friend or Foe? Opposite Functions in Neurons and Glial Cells
Kaltschmidt, B., Czaniera, N. J., Schulten, W., & Kaltschmidt, C. (2024) · International Journal of Molecular Sciences · doi:10.3390/ijms252111353 · Cited by 28
Hudson, H. R., Sun, X., & Orr, M. E. (2025) · Neurotherapeutics · doi:10.1016/j.neurot.2024.e00519 · Cited by 28
Distinct systemic impacts of Aβ42 and Tau revealed by whole-organism snRNA-seq
Park, Y.-J., Lu, T., Jackson, T., Goodman, L. D., Ran, L., Chen, J., Liang, C., Harrison, E. M., Ko, C., Chen, X. X., et al. (2024) · Neuron · doi:10.1016/j.neuron.2025.04.017 · Cited by 26
Current status and future directions of clinical applications using iPS cells—focus on Japan
Tsujimoto, H., & Osafune, K. (2021) · FEBS Journal · doi:10.1111/febs.16162 · Cited by 25
Transcriptomic profiling of sporadic Alzheimer’s disease patients
Caldwell, A. B., Anantharaman, B. G., Ramachandran, S., Nguyen, P. A. H., Liu, Q., Trinh, I., Galasko, D. R., Desplats, P., Wagner, S. L., & Subramaniam, S. (2022) · Molecular Brain · doi:10.1186/s13041-022-00963-2 · Cited by 27
Self-citationBeckmann, A., Ramirez, P., Gamez-Guijarro, M., Gonzalez, E. M., Mange, J. D., Bieniek, K. F., Ray, W. J., & Frost, B. E. (2023) · iScience · doi:10.1016/j.isci.2023.106152 · Cited by 24
Monozygotic twins discordant for schizophrenia differ in maturation and synaptic transmission
Stern, S., Zhang, L., Wang, M., Wright, R., Rosh, I., Hussein, Y., Stern, T., Choudhary, A., Tripathi, U., Reed, P., et al. (2024) · Molecular Psychiatry · doi:10.1038/s41380-024-02561-1 · Cited by 23
Self-citationKim, H., Kim, S., Cho, B., Shin, J., & Kim, J. (2022) · Translational Neurodegeneration · doi:10.1186/s40035-022-00319-9 · Cited by 22
Human brain organoids to explore SARS‐CoV‐2‐induced effects on the central nervous system
Ostermann, P. N., & Schaal, H. (2023) · Reviews in Medical Virology · doi:10.1002/rmv.2430 · Cited by 22
Iqbal, M. A., Bilen, M., Liu, Y., Jabre, V., Fong, B. C., Chakroun, I., Paul, S., Chen, J., Wade, S., Kanaan, M., et al. (2024) · Aging Cell · doi:10.1111/acel.14165 · Cited by 24
Österlund, N., Frankel, R., Carlsson, A., Thacker, D., Karlsson, M., Matus, V., Gräslund, A., Emanuelsson, C. S., & Linse, S. S. (2023) · Journal of Biological Chemistry · doi:10.1016/j.jbc.2023.105317 · Cited by 22
Sommer, D., Rajkumar, S., Seidel, M., Aly, A., Ludolph, A. C., Ho, R., Boeckers, T. M., & Catanese, A. (2022) · Frontiers in Molecular Neuroscience · doi:10.3389/fnmol.2022.894230 · Cited by 20
Pinpointing the locus of GABAergic vulnerability in Alzheimer’s disease
Melgosa-Ecenarro, L., Doostdar, N., Radulescu, C. I., Jackson, J., & Barnes, S. J. (2022) · Seminars in Cell and Developmental Biology · doi:10.1016/j.semcdb.2022.06.017 · Cited by 20
Defining and characterizing neuronal senescence, ‘neurescence’, as GX arrested cells
Hudson, H. R., Rießland, M., & Orr, M. E. (2024) · Trends in Neurosciences · doi:10.1016/j.tins.2024.09.006 · Cited by 21
Valdes, P., Caldwell, A. B., Liu, Q., Fitzgerald, M. Q., Ramachandran, S., Karch, C. M. M., Dominantly Inherited Alzheimer Network (DIAN), Adams, S., Allegri, R., Araki, A., et al. (2025) · Alzheimer s Research & Therapy · doi:10.1186/s13195-024-01659-6 · Cited by 25
Kim, H., Kang, S., Cho, B., An, S., Kim, Y.-K., & Kim, J. (2025) · Advanced Science · doi:10.1002/advs.202412548 · Cited by 21
Cell Reprogramming for Regeneration and Repair of the Nervous System
Clark, I. H., Roman, A., Fellows, E., Radha, S., Var, S. R., Roushdy, Z., Borer, S. M., Johnson, S., Chen, O. M., Borgida, J. S. W., et al. (2022) · Biomedicines · doi:10.3390/biomedicines10102598 · Cited by 20
Weng, M., Hu, H., Graus, M. S., Tan, D. S., Gao, Y., Ren, S., Ho, D. H. H., Langer, J., Holzner, M., Huang, Y., et al. (2023) · Science Advances · doi:10.1126/sciadv.adh2501 · Cited by 20
Engineering Innervated Musculoskeletal Tissues for Regenerative Orthopedics and Disease Modeling
Zhou, Z., Liu, J., Xiong, T., Liu, Y., Tuan, R. S., & Li, Z. A. (2024) · Small · doi:10.1002/smll.202310614 · Cited by 19
Epigenetic control and manipulation of neuronal maturation timing
Ciceri, G., & Studer, L. (2024) · Current Opinion in Genetics & Development · doi:10.1016/j.gde.2024.102164 · Cited by 19
Ceccarelli, D. C., & Solerte, S. B. (2025) · Metabolites · doi:10.3390/metabo15030159 · Cited by 18
Kajtez, J., Nilsson, F., Laurin, K., Bruzelius, A., Cepeda-Prado, E., Birtele, M., Barker, R. A., Herborg, F., Ottosson, D. R., Storm, P., et al. (2025) · Science Advances · doi:10.1126/sciadv.adq7855 · Cited by 16
Cell models for Down syndrome-Alzheimer’s disease research
Wu, Y., West, N. R., Bhattacharyya, A., & Wiseman, F. K. (2022) · Neuronal Signaling · doi:10.1042/ns20210054 · Cited by 17
Genotoxic Damage During Brain Development Presages Prototypical Neurodegenerative Disease
Kisby, G. E., & Spencer, P. S. (2021) · Frontiers in Neuroscience · doi:10.3389/fnins.2021.752153 · Cited by 17
A cellular identity crisis? Plasticity changes during aging and rejuvenationPreprint
Gorelov, R. A., & Hochedlinger, K. (2024) · Genes & Development · doi:10.1101/gad.351728.124 · Cited by 18
Phospho-Tau and Chromatin Landscapes in Early and Late Alzheimer’s Disease
Gil, L., Niño, S. A., Guerrero, C., & Jiménez-Capdeville, M. E. (2021) · International Journal of Molecular Sciences · doi:10.3390/ijms221910283 · Cited by 16
Quéré, M., Alberto, J., Broly, F., Hergalant, S., Christov, C., Gauchotte, G., Guéant, J., Namour, F., & Battaglia-Hsu, S.-F. (2022) · Nutrients · doi:10.3390/nu14091887 · Cited by 16
Trigeminal Neuralgia Is a Dementia Risk Factor: A Retrospective Cohort Study
Cheng, Y.-H., Wu, C., Wang, W., Lu, Y., & Wu, M. (2022) · International Journal of Environmental Research and Public Health · doi:10.3390/ijerph19106073 · Cited by 16
Endotype reversal as a novel strategy for screening drugs targeting familial Alzheimer's disease
Caldwell, A. B., Liu, Q., Zhang, C. M., Schroth, G. P., Galasko, D. R., Rynearson, K. D., Tanzi, R. E., Yuan, S. H., Wagner, S. L., & Subramaniam, S. (2022) · Alzheimer s & Dementia · doi:10.1002/alz.12553 · Cited by 15
Self-citationA new age in understanding adult hippocampal neurogenesis in Alzheimer’s disease
Gillotin, S., & Hanspal, M. A. (2022) · Neural Regeneration Research · doi:10.4103/1673-5374.339472 · Cited by 15
Zhu, B., Fisher, E., Li, L., Zhong, P., Yan, Z., & Feng, J. (2023) · Stem Cell Reports · doi:10.1016/j.stemcr.2023.09.012 · Cited by 14
Modeling APOE ε4 familial Alzheimer’s disease in directly converted 3D brain organoids
Kim, Y.-K., Kim, H., Cho, B., An, S., Kang, S., Kim, S., & Kim, J. (2024) · Frontiers in Aging Neuroscience · doi:10.3389/fnagi.2024.1435445 · Cited by 14
Supakul, S., Okano, H., & Maeda, S. (2021) · Frontiers in Aging Neuroscience · doi:10.3389/fnagi.2021.768948 · Cited by 15
Antón‐Fernández, A., de Alegría, Á. R., Mariscal-Casero, A., Roldán-Lázaro, M., Peinado-Cahuchola, R., Ávila, J., & Hernández, F. (2025) · Progress in Neurobiology · doi:10.1016/j.pneurobio.2025.102743 · Cited by 13
Research models to study lewy body dementia
Boschen, S. L., Mukerjee, A. A., Faroqi, A. H., Rabichow, B. E., & Fryer, J. D. (2025) · Molecular Neurodegeneration · doi:10.1186/s13024-025-00837-w · Cited by 16
Human fetal tissue is critical for biomedical research
Brumbaugh, J., Aguado, B. A., Lysaght, T., & Goldstein, L. S. B. (2023) · Stem Cell Reports · doi:10.1016/j.stemcr.2023.10.008 · Cited by 13
Self-citationMacMullen, C., Sharma, N., & Davis, R. L. (2024) · Brain · doi:10.1093/brain/awae364 · Cited by 14
Provasek, V. E., Bacolla, A., Rangaswamy, S., Kodavati, M. M., Mitra, J., Yusuf, I. O., Malojirao, V. H., Vasquez, V., Britz, G. W., Li, G., et al. (2025) · Nucleic Acids Research · doi:10.1093/nar/gkaf920 · Cited by 14
Mollinari, C., Dominicis, C. D., Lupacchini, L., Sansone, L., Caprini, D., Casciola, C. M., Wang, Y., Zhao, J., Fini, M., Russo, M. A., et al. (2022) · International Journal of Molecular Sciences · doi:10.3390/ijms23042147 · Cited by 13
Tosoni, G., Ayyildiz, D., Snoeck, S., Moreno‐Jiménez, E. P., Penning, A., Santiago-Mujika, E., Ormaechea, O. R., Lee, H., Poovathingal, S. K., Davie, K., et al. (2026) · Cell stem cell · doi:10.1016/j.stem.2026.04.002 · Cited by 13
Self-citationWu, H., Wang, J., Hu, X., Zhuang, C., Zhou, J., Wu, P., Li, S., & Zhao, R. C. (2023) · Frontiers in Aging Neuroscience · doi:10.3389/fnagi.2023.1191680 · Cited by 12
Qu, W., Lam, M., McInvale, J. J., Mares, J. A., Kwon, S. H., Humala, N., Mahajan, A., Nguyen, T. T. T., Jakubiak, K. A., Mun, J.-Y., et al. (2024) · Acta Neuropathologica · doi:10.1007/s00401-024-02755-5 · Cited by 13
Maksour, S., & Ooi, L. (2023) · Journal of Neurochemistry · doi:10.1111/jnc.15885 · Cited by 12
Gil, L., Chi-Ahumada, É., Niño, S. A., Capdeville, G., Méndez-Torres, A. M., Guerrero, C., Poves, A. B. R., Olazabal, I. M., & Jiménez-Capdeville, M. E. (2022) · International Journal of Molecular Sciences · doi:10.3390/ijms232112873 · Cited by 10
Yoon, L., Botham, R. C., Verhelle, A., Wu, Y., Cole, C. M., Tan, E. P., Massey, L. A., Sanz-Martinez, P., Chou, C., Xu, J., et al. (2022) · bioRxiv (Cold Spring Harbor Laboratory) · doi:10.1101/2022.09.29.509997 · Cited by 11
Ma, L., Wei, Q., Jiang, M., Wu, Y., Liu, X., Yang, Q., Bai, Z., & Yang, L. (2025) · International Journal of Molecular Sciences · doi:10.3390/ijms26136105 · Cited by 11
Approaches for studying neuroimmune interactions in Alzheimer’s disease
Lin, C., Tian, Y., Tanzi, R. E., & Jorfi, M. (2024) · Trends in Immunology · doi:10.1016/j.it.2024.10.002 · Cited by 10
Cates, K., Yuan, L., Yang, Y., & Yoo, A. S. J. (2025) · Cell Reports · doi:10.1016/j.celrep.2024.115153 · Cited by 11
Metadata
- Authors
- Mertens, J., Herdy, J. R., Traxler, L., Schafer, S. T., Schlachetzki, J. C. M., Böhnke, L., Reid, D. A., Lee, H., Zangwill, D., Fernandes, D. P., Agarwal, R. K., Lucciola, R., Zhou-Yang, L., Karbacher, L., Edenhofer, F., Stern, S., Horvath, S., Paquola, A. C. M., Glass, C. K., Yuan, S. H., Ku, M., Szücs, A., Goldstein, L. S. B., Galasko, D., & Gage, F. H.
- Affiliations
- Salk Institute for Biological Studies (US)
- University of California San Diego (US)
- Universität Innsbruck (AT)
- University of California, Los Angeles (US)
- University of Minnesota (US)
- University of Freiburg (DE)
- Corresponding author
- Gage, Fred H.
- ORCID
- Venue
- Cell Stem Cell
- Publisher
- Elsevier BV
- Published
- 2021-09
- Volume
- 28
- Issue
- 9
- Pages
- 1533-1548.e6
- ISSN
- 1875-9777 (ISSN-L)
- 1934-5909
- PMC
- PMC8423435
- OpenAlex
- W3157334032
- Semantic Scholar
- 8048718b1b52a70eeaec2916188b07119caa46f5
- Cited by
- 240
- References
- 110
- Citations by year
- 2026: 34 · 2025: 45 · 2024: 54 · 2023: 54 · 2022: 42 · 2021: 11
- FWCI
- 13.19
- Type
- journal article
- Language
- en
- Open access
- hybrid
- doi.org
- Licence
- Locations
- Cell stem cell (publishedVersion, cc-by-nc-nd)
- PubMed Central (publishedVersion, cc-by-nc-nd)
- PubMed (publishedVersion)
- ELTE Digital Institutional Repository (EDIT) (Eötvös Loránd University) (submittedVersion, other-oa)
- Funders
- Leona M. and Harry B. Helmsley Charitable Trust
- University of California, San Diego
- Marshallplan-Jubiläumsstiftung
- Deutsche Forschungsgemeinschaft
- Austrian Science Fund (ANN-135291)
- BrightFocus Foundation
- Bundesministerium für Bildung, Wissenschaft, Forschung und Technologie
- Alzheimer's Disease Research Center, Emory University
- Alzheimer Nederland
- European Commission (ERC-STG-2019-852086, H2020-MSCA-IF-2017-797205)
- Alzheimer's Association
- Deutscher Akademischer Austauschdienst
- American Heart Association
- G. Harold and Leila Y. Mathers Charitable Foundation
- Allen Foundation (19PABH134610000)
- National Institutes of Health (AG056306, AG056511, AG057706, AG062429)
- European Research Council
- National Institute on Aging (K99-AG056679)
- Horizon 2020 Marie Skłodowska-Curie Actions
- EU Joint Programme – Neurodegenerative Disease Research
- California Institute for Regenerative Medicine (RT2-01927)
- Topics
- Life Sciences › Biochemistry, Genetics and Molecular Biology › Molecular Biology › Pluripotent Stem Cells Research
- Life Sciences › Neuroscience › Cellular and Molecular Neuroscience › Alzheimer's disease research and treatments
- Life Sciences › Neuroscience › Developmental Neuroscience › Neurogenesis and neuroplasticity mechanisms
- Keywords
- Alzheimer's disease, induced neurons, neuronal identity, neuronal maturation, fibroblast-to-neuron conversion, iPSC-derived neurons, epigenetic clocks, dedifferentiation, neuronal transcriptome
- MeSH terms
- Aged, Aging, Alzheimer Disease, Fibroblasts, Humans, Neurons, Induced Pluripotent Stem Cells
About these checks
Registry, retraction, Cites and statistics results are computed, not judged, with one exception: a printed reference that no index lists is read once by a model before it counts as a citation error. Claims are extracted by a model and kept only when their quote appears verbatim in the text; each cited source is then checked, with a model’s help, for whether it says what the claim relies on. Those verdicts can be wrong — read the claim’s quote and the cited source before relying on one.
A language model drew the claims from the paper on 2026-10-10, under version 3 of the claim definition (model deepseek-v4.1-flash, prompt extract-v3).
A second model labelled each claim on 2026-10-10 (model jev-1.13-20260917, definition revision gold-guideline-v0.2).
Statistics and arithmetic are recomputed, not judged.
Confidence bands are shown only for fields calibrated on our annotated test set. None is calibrated yet, so no band is shown.
What counts as a claim ›How we measure confidence ›How we check this ›
Are you an author, or do you see a problem with this page? Request a review
