Cited by 1,062

The DOI matches its Crossref record; 10 of the 10 references it cites were found in a registry or an index.

5-methylcytosine promotes mRNA export — NSUN2 as the methyltransferase and ALYREF as an m5C reader

Yang, Xin, Yang, Ying, Sun, Bao-Fa, Chen, Yu-Sheng, Xu, Jia-Wei, Lai, Wei-Yi, Li, Ang, Wang, Xing, Bhattarai, Devi Prasad, Xiao, Wen, Sun, Hui-Ying, Zhu, Qin, Ma, Hai-Li, Adhikari, Samir, Sun, Min, Hao, Ya-Juan, Zhang, Bing, Huang, Chun-Min, Huang, Niu, Jiang, Gui-Bin, Zhao, Yong-Liang, Wang, Hai-Lin, Sun, Ying-Pu, Yang, Yun-Gui·2017·Cell Research

Overview

The claims and statistics of this paper haven’t been checked yet.

Run the check — free, no account needed. It reads the open-access text and checks the sources it cites.

A few free checks a day · papers already verified open instantly · results are public

Integrity signals

Registry

Crossref · 10.1038/cr.2017.55

Cites

10 of 10 references verified0 citation errors · 0 not checkable

Statistics

Figures

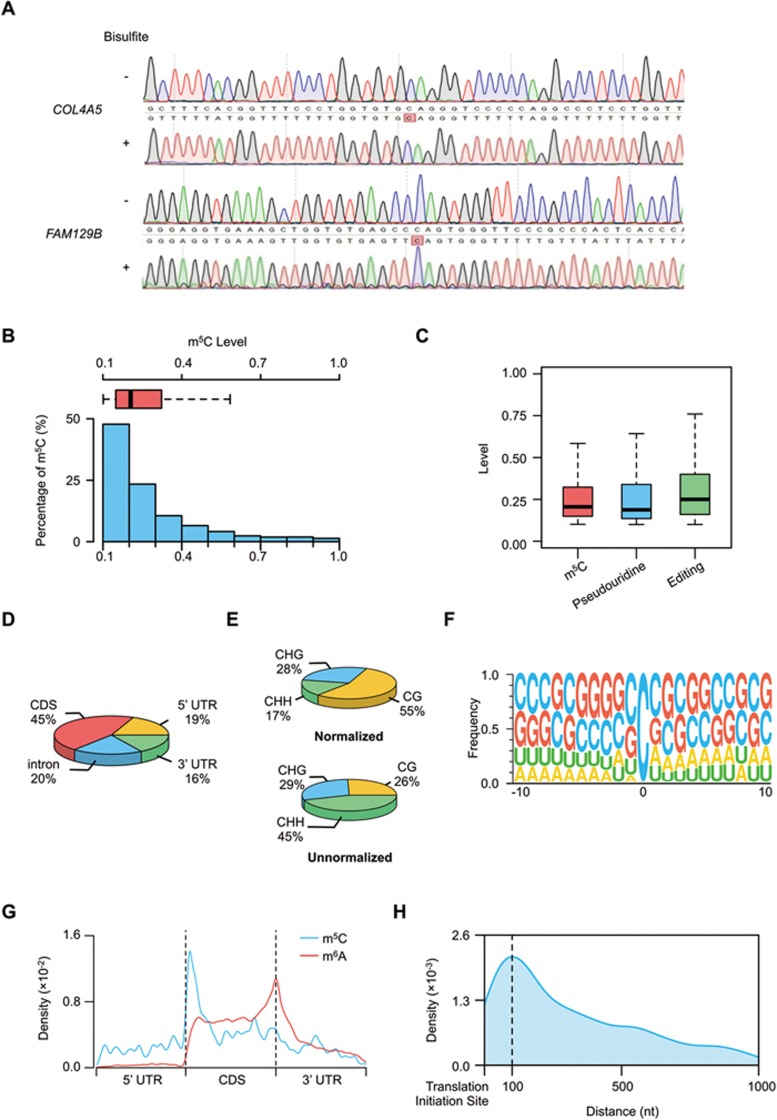
Figure 1 Distribution profiles of m5C in mRNAs. (A) Sanger-based validation of representative m5C sites. m5C sites within COL4A5 (chrX:107911644) and FAM129B (chr9:130268749) (hg19) identified by RNA-BisSeq were validated. cDNA was amplified by PCR using normal primers for untreated mRNAs and specific primers for bisulfite-treated mRNAs. (B) Histogram and box plot showing the mRNA m5C levels. Methylation levels of majority of m5C sites were < 40%. (C) Box plot showing the levels of mRNA m5C, pseudouridine and editing. (D) Transcriptome-wide distribution of mRNA m5C sites. Pie chart presenting the fraction of m5C sites within distinct mRNA regions: CDS, intron, 5′ UTR and 3′ UTR. (E) The normalized and unnormalized proportions of mRNA m5C sites identified in each sequence context: CG, CHG and CHH, where H = A, C, or U. The normalization was done by normalizing m5C numbers in each of three contexts to their individual context proportion within transcriptome. (F) Sequence frequency logo for the sequences proximal to mRNA m5C sites. (G) Distribution of m5C sites and m6A peaks along mRNA transcripts. The moving averages of percentages of mRNA m5C sites and m6A peaks were shown. (H) Distribution of m5C sites across CDS regions of mRNA transcripts.
Figure 1 Distribution profiles of m5C in mRNAs. (A) Sanger-based validation of representative m5C sites. m5C sites within COL4A5 (chrX:107911644) and FAM129B (chr9:130268749) (hg19) identified by RNA-BisSeq were validated. cDNA was amplified by PCR using normal primers for untreated mRNAs and specific primers for bisulfite-treated mRNAs. (B) Histogram and box plot showing the mRNA m5C levels. Methylation levels of majority of m5C sites were < 40%. (C) Box plot showing the levels of mRNA m5C, pseudouridine and editing. (D) Transcriptome-wide distribution of mRNA m5C sites. Pie chart presenting the fraction of m5C sites within distinct mRNA regions: CDS, intron, 5′ UTR and 3′ UTR. (E) The normalized and unnormalized proportions of mRNA m5C sites identified in each sequence context: CG, CHG and CHH, where H = A, C, or U. The normalization was done by normalizing m5C numbers in each of three contexts to their individual context proportion within transcriptome. (F) Sequence frequency logo for the sequences proximal to mRNA m5C sites. (G) Distribution of m5C sites and m6A peaks along mRNA transcripts. The moving averages of percentages of mRNA m5C sites and m6A peaks were shown. (H) Distribution of m5C sites across CDS regions of mRNA transcripts.CC BY · PubMed Central
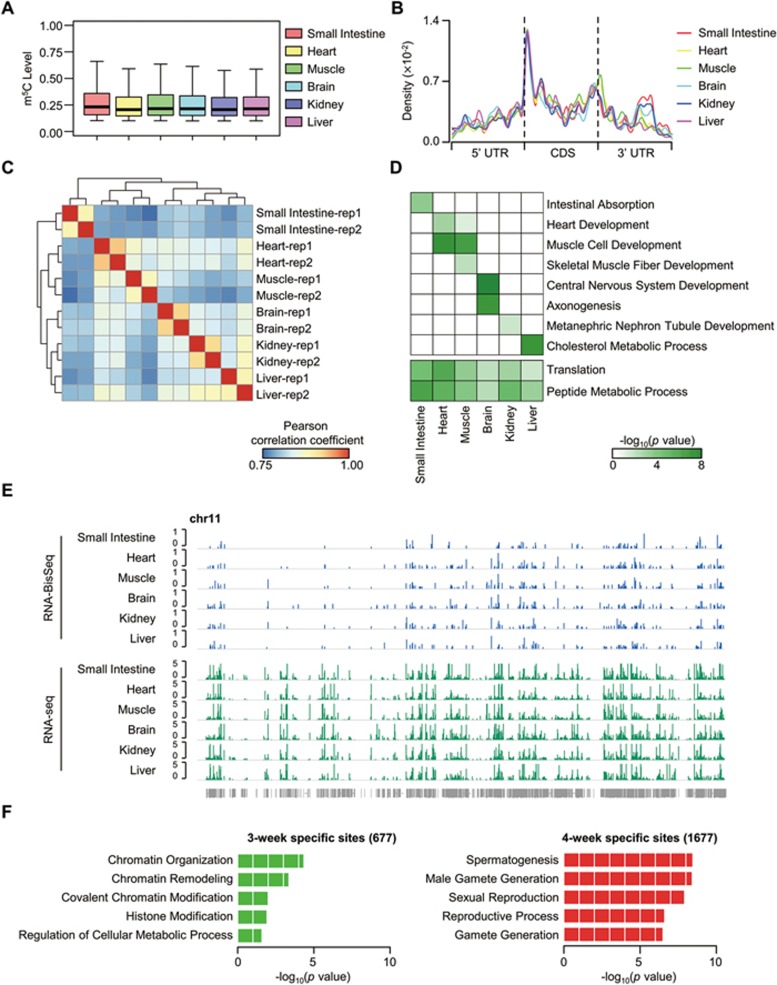
Figure 2 Tissue-specific mRNA m5C methylomes and dynamic features of mRNA m5C during testis development. (A) Boxplots showing the distributions of mRNA m5C levels across mouse tissues. (B) Distribution of m5C sites along mRNA transcripts in each tissue. The moving averages of mRNA m5C site percentage were shown. (C) Hierarchical clustering of Pearson correlation coefficient across mouse tissues, calculated by pairwise comparison of m5C levels. (D) Heatmap representing the combination of representative GO term enrichment (top: tissue-specific functions; bottom: common functions) in m5C-containing mRNAs in each tissue. Green to white color: high to low levels of GO term enrichment. (E) Browser representation of m5C levels and mRNA abundance within chromosome 11 across mouse tissues. (F) Gene ontology analysis of mRNAs with specific m5C sites in 3- or 4-week stage testis.
Figure 2 Tissue-specific mRNA m5C methylomes and dynamic features of mRNA m5C during testis development. (A) Boxplots showing the distributions of mRNA m5C levels across mouse tissues. (B) Distribution of m5C sites along mRNA transcripts in each tissue. The moving averages of mRNA m5C site percentage were shown. (C) Hierarchical clustering of Pearson correlation coefficient across mouse tissues, calculated by pairwise comparison of m5C levels. (D) Heatmap representing the combination of representative GO term enrichment (top: tissue-specific functions; bottom: common functions) in m5C-containing mRNAs in each tissue. Green to white color: high to low levels of GO term enrichment. (E) Browser representation of m5C levels and mRNA abundance within chromosome 11 across mouse tissues. (F) Gene ontology analysis of mRNAs with specific m5C sites in 3- or 4-week stage testis.CC BY · PubMed Central
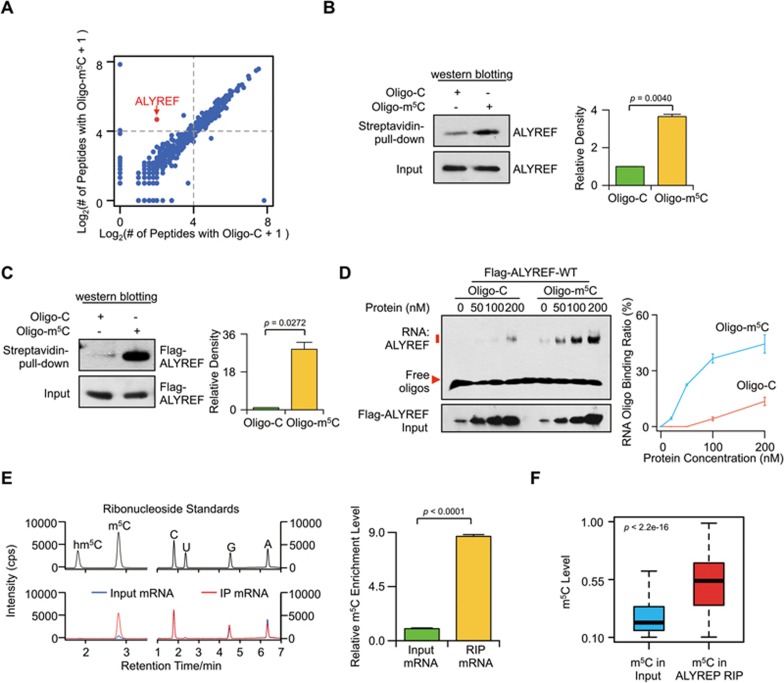
Figure 3 ALYREF is a specifi c mRNA m5C-binding protein. (A) Scatter plot of proteins bound to Oligo-m5C versus Oligo-C RNA oligos. The plot was based on the average peptide numbers of proteins detected in both replicates. Enriched ALYREF protein was highlighted. (B) Demonstration of endogenous ALYREF pulled down by biotin-labeled RNA oligonucleotides containing m5C (Oligo-m5C). Left, western blotting; right, quantification level. (C) Demonstration of purified Flag-ALYREF pulled down by biotin-labeled Oligo-m5C. Left, western blotting; right, quantification level. (D) EMSA (left) and line graph quantification (right) showing the binding ability of purified Flag-ALYREF-WT with Oligo-m5C or Oligo-C. 100 nM of RNA Oligo-m5C or Oligo-C was incubated with different concentrations of Flag-ALYREF-WT protein. The RNA binding ratio was calculated by (RNA-protein)/((free RNA) + (RNA-protein)). Error bars indicate SEM (n = 3). P values were calculated using Student's t-test. (E) UHPLC-MRM-MS/MS chromatograms (left) and quantification (right) of m5C in input and in vitro ALYREF-RIP mRNA samples. (F) Boxplot showing m5C level of methylation sites detected in both input and in vivo ALYREF-RIP mRNA samples. P values were calculated using Mann-Whitney U test.
Figure 3 ALYREF is a specifi c mRNA m5C-binding protein. (A) Scatter plot of proteins bound to Oligo-m5C versus Oligo-C RNA oligos. The plot was based on the average peptide numbers of proteins detected in both replicates. Enriched ALYREF protein was highlighted. (B) Demonstration of endogenous ALYREF pulled down by biotin-labeled RNA oligonucleotides containing m5C (Oligo-m5C). Left, western blotting; right, quantification level. (C) Demonstration of purified Flag-ALYREF pulled down by biotin-labeled Oligo-m5C. Left, western blotting; right, quantification level. (D) EMSA (left) and line graph quantification (right) showing the binding ability of purified Flag-ALYREF-WT with Oligo-m5C or Oligo-C. 100 nM of RNA Oligo-m5C or Oligo-C was incubated with different concentrations of Flag-ALYREF-WT protein. The RNA binding ratio was calculated by (RNA-protein)/((free RNA) + (RNA-protein)). Error bars indicate SEM (n = 3). P values were calculated using Student's t-test. (E) UHPLC-MRM-MS/MS chromatograms (left) and quantification (right) of m5C in input and in vitro ALYREF-RIP mRNA samples. (F) Boxplot showing m5C level of methylation sites detected in both input and in vivo ALYREF-RIP mRNA samples. P values were calculated using Mann-Whitney U test.CC BY · PubMed Central
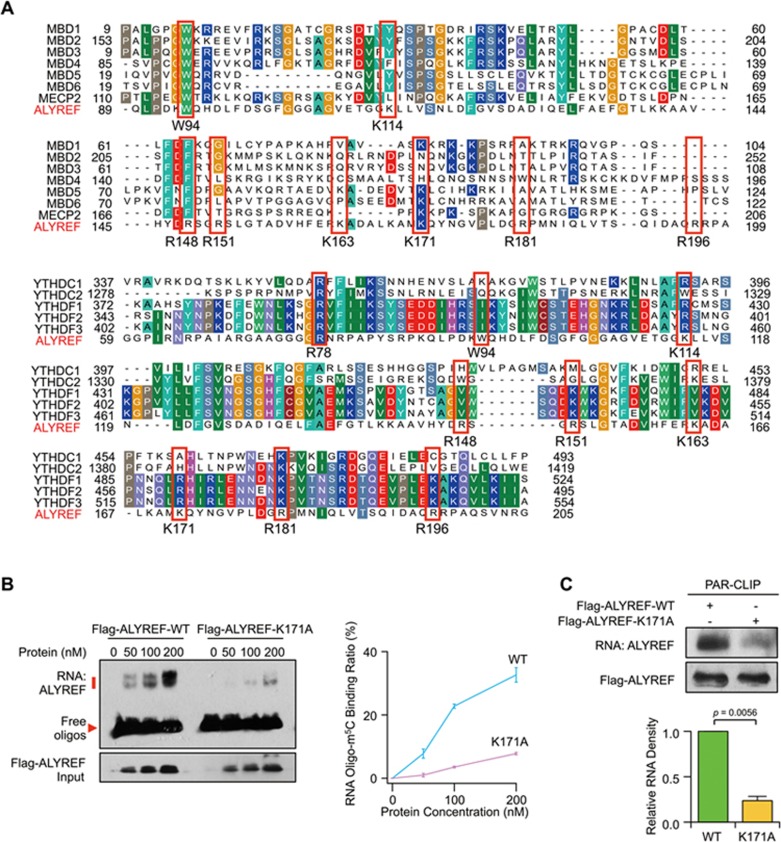
Figure 4 ALYREF specifically binds to mRNA m5C sites via K171. (A) Multiple sequence alignments of ALYREF (GenBank: NP_005773.3), MBD family members MBD1-6 (GenBank: NP_001191065.1, NP_003918.1, NP_001268382.1, NP_001263199.1, NP_060798.2, and NP_443129.3) and MeCP2 (GenBank: NP_001104262.1) (top). Multiple sequence alignments of ALYREF and YTH family members: YTHDC1, YTHDC2, YTHDF1, YTHDF2 and YTHDF3 (GenBank: NP_001026902.1, NP_073739.3, NP_060268.2, NP_001166299.1, and NP_001264742.1) (bottom). The relatively conserved amino acids used for constructing mutants are highlighted in red boxes. (B) EMSA (left) and line graph quantification (right) showing the RNA-binding ability of Flag-ALYREF wild-type (WT) or mutant (K171A) to Oligo-m5C. (C) PAR-CLIP assay (top) and quantification (bottom) of RNAs pulled down by Flag-ALYREF-WT or -K171A in HeLa cells. P values were calculated by Student's t-test. Data shown are mean ± SEM (n = 3).
Figure 4 ALYREF specifically binds to mRNA m5C sites via K171. (A) Multiple sequence alignments of ALYREF (GenBank: NP_005773.3), MBD family members MBD1-6 (GenBank: NP_001191065.1, NP_003918.1, NP_001268382.1, NP_001263199.1, NP_060798.2, and NP_443129.3) and MeCP2 (GenBank: NP_001104262.1) (top). Multiple sequence alignments of ALYREF and YTH family members: YTHDC1, YTHDC2, YTHDF1, YTHDF2 and YTHDF3 (GenBank: NP_001026902.1, NP_073739.3, NP_060268.2, NP_001166299.1, and NP_001264742.1) (bottom). The relatively conserved amino acids used for constructing mutants are highlighted in red boxes. (B) EMSA (left) and line graph quantification (right) showing the RNA-binding ability of Flag-ALYREF wild-type (WT) or mutant (K171A) to Oligo-m5C. (C) PAR-CLIP assay (top) and quantification (bottom) of RNAs pulled down by Flag-ALYREF-WT or -K171A in HeLa cells. P values were calculated by Student's t-test. Data shown are mean ± SEM (n = 3).CC BY · PubMed Central
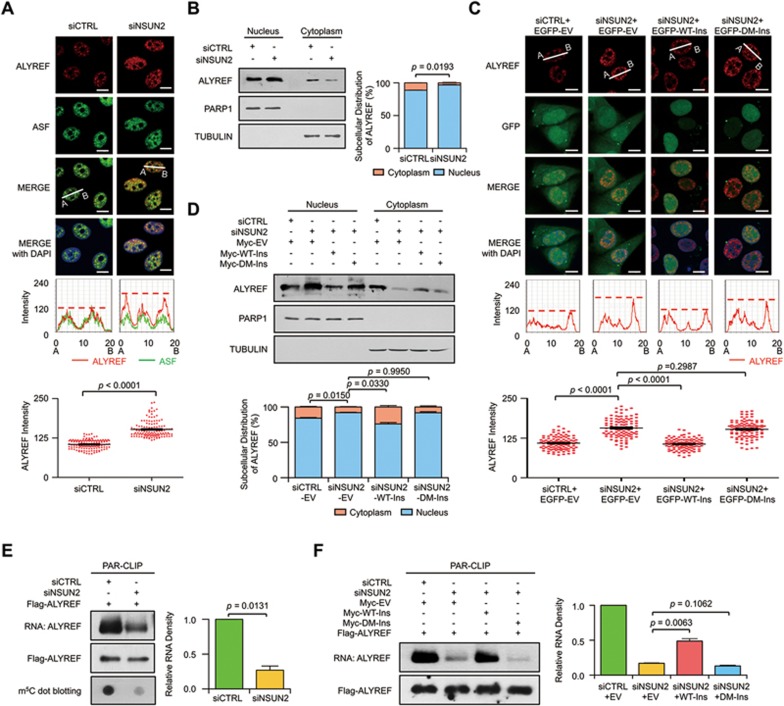
Figure 5 NSUN2 regulates nuclear-cytoplasmic shuttling and RNA-binding ability of ALYREF. (A) Immunofluorescence staining of ALYREF (red color) and ASF (green color) upon NSUN2 knockdown (top); line scan graphs (middle) and peak density quantification of line scan graphs (bottom) for ALYREF are also shown. Scale bar, 10 μm. Error bars indicate SEM (n = 120). (B) Western blotting (left) and quantification (right) of nuclear and cytoplasmic distribution of ALYREF in control and NSUN2-knockdown HeLa cells. The protein loading for the cytoplasmic fraction is about 2.5-fold higher than that for the nuclear fraction. PARP1 and TUBULIN serve as nuclear and cytoplasmic markers, respectively. Error bars indicate SEM (n = 3). (C) Immunofluorescence staining of ALYREF (red color) in NSUN2-knockdown HeLa cells transfected with control EGFP (EGFP-EV), EGFP-tagged siNSUN2-insensitive wild-type NSUN2 (EGFP-WT-Ins) or mutant (EGFP-DM-Ins) plasmids (top); line scan graphs (middle) and peak density quantification of line scan graphs (bottom) for ALYREF are also shown. Scale bar, 10 μm. Error bars indicate SEM (n = 120). (D) Western blotting (top) and quantification (bottom) of nuclear and cytoplasmic distribution of ALYREF in NSUN2-knockdown HeLa cells transfected with empty Myc expression vector (Myc-EV), Myc-tagged siNSUN2-insensitive wild-type NSUN2 (Myc-WT-Ins), or Mutant (Myc-DM-Ins). The protein loading for the cytoplasmic fraction is about 2.5-fold higher than that for the nuclear fraction. PARP1 and TUBULIN serve as nuclear and cytoplasmic markers, respectively. Error bars indicate SEM (n = 3). (E) PAR-CLIP assay (left) and quantification (right) of RNA pulled down by Flag-ALYREF upon NSUN2 knockdown. RNA labeled with biotin at 3′ end of RNA (End Biotinylation Kit, Thermo) was visualized by the chemiluminescent nucleic acid detection module. m5C-modified RNAs were visualized by dot blotting using m5C antibody. Error bars indicate SEM (n = 3). (F) Rescue PAR-CLIP assay (left) and quantification (right) of RNA pulled down by Flag-ALYREF in NSUN2-knockdown HeLa cells transfected with Myc-EV, Myc-WT-Ins, or Myc-DM-Ins. RNA labeled with biotin at 3′ end of RNA (End Biotinylation Kit, Thermo) was visualized by the Chemiluminescent nucleic acid detection module. Error bars indicate SEM (n = 3). P values were calculated by Student's t-test.
Figure 5 NSUN2 regulates nuclear-cytoplasmic shuttling and RNA-binding ability of ALYREF. (A) Immunofluorescence staining of ALYREF (red color) and ASF (green color) upon NSUN2 knockdown (top); line scan graphs (middle) and peak density quantification of line scan graphs (bottom) for ALYREF are also shown. Scale bar, 10 μm. Error bars indicate SEM (n = 120). (B) Western blotting (left) and quantification (right) of nuclear and cytoplasmic distribution of ALYREF in control and NSUN2-knockdown HeLa cells. The protein loading for the cytoplasmic fraction is about 2.5-fold higher than that for the nuclear fraction. PARP1 and TUBULIN serve as nuclear and cytoplasmic markers, respectively. Error bars indicate SEM (n = 3). (C) Immunofluorescence staining of ALYREF (red color) in NSUN2-knockdown HeLa cells transfected with control EGFP (EGFP-EV), EGFP-tagged siNSUN2-insensitive wild-type NSUN2 (EGFP-WT-Ins) or mutant (EGFP-DM-Ins) plasmids (top); line scan graphs (middle) and peak density quantification of line scan graphs (bottom) for ALYREF are also shown. Scale bar, 10 μm. Error bars indicate SEM (n = 120). (D) Western blotting (top) and quantification (bottom) of nuclear and cytoplasmic distribution of ALYREF in NSUN2-knockdown HeLa cells transfected with empty Myc expression vector (Myc-EV), Myc-tagged siNSUN2-insensitive wild-type NSUN2 (Myc-WT-Ins), or Mutant (Myc-DM-Ins). The protein loading for the cytoplasmic fraction is about 2.5-fold higher than that for the nuclear fraction. PARP1 and TUBULIN serve as nuclear and cytoplasmic markers, respectively. Error bars indicate SEM (n = 3). (E) PAR-CLIP assay (left) and quantification (right) of RNA pulled down by Flag-ALYREF upon NSUN2 knockdown. RNA labeled with biotin at 3′ end of RNA (End Biotinylation Kit, Thermo) was visualized by the chemiluminescent nucleic acid detection module. m5C-modified RNAs were visualized by dot blotting using m5C antibody. Error bars indicate SEM (n = 3). (F) Rescue PAR-CLIP assay (left) and quantification (right) of RNA pulled down by Flag-ALYREF in NSUN2-knockdown HeLa cells transfected with Myc-EV, Myc-WT-Ins, or Myc-DM-Ins. RNA labeled with biotin at 3′ end of RNA (End Biotinylation Kit, Thermo) was visualized by the Chemiluminescent nucleic acid detection module. Error bars indicate SEM (n = 3). P values were calculated by Student's t-test.CC BY · PubMed Central
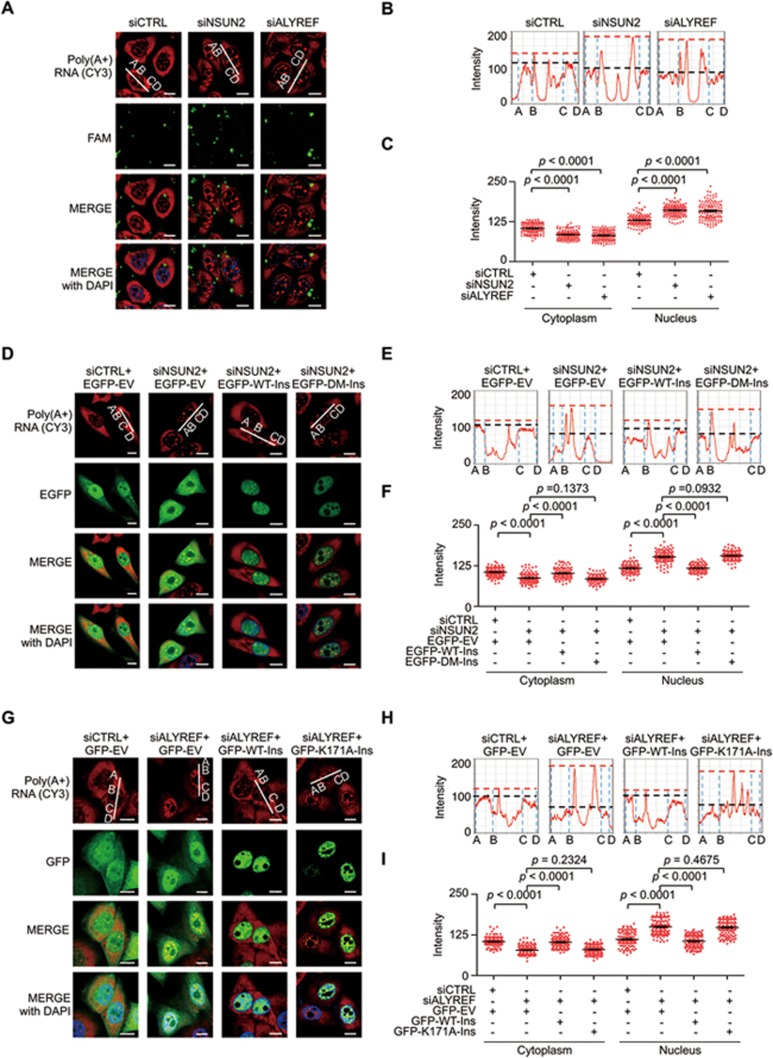
Figure 6 Involvement of m5C in mRNA export regulation. (A-C) Fluorescence in situ hybridization (FISH) analysis of mRNAs (red) in the control, NSUN2- or ALYREF-deficient HeLa cells (A); line scan graphs (B) and peak density quantification of line scan graphs (C) for mRNAs are shown. Green: FAM-labeled siRNAs. The red and black dash lines (B) represent the peak densities of nuclear and cytoplasmic mRNAs, respectively. Scale bar, 10 μm. Error bars indicate SEM (n = 120). (D-I) FISH analysis of mRNAs (red color) in NSUN2 (D-F) or ALYREF (G-I) knockdown HeLa cells reconstituted with control vector, EGFP/GFP-tagged wild-type or mutant forms of NSUN2 (D-F) or ALYREF (G-I); line scan graphs (E, H) and peak density quantification of line scan graphs (F, I) for mRNAs are shown. The red and black dash lines (E, H) represent the peak densities of nuclear and cytoplasmic mRNAs, respectively. Scale bar, 10 μm. Error bars indicate SEM (n = 120). P values were calculated by Student's t-test.
Figure 6 Involvement of m5C in mRNA export regulation. (A-C) Fluorescence in situ hybridization (FISH) analysis of mRNAs (red) in the control, NSUN2- or ALYREF-deficient HeLa cells (A); line scan graphs (B) and peak density quantification of line scan graphs (C) for mRNAs are shown. Green: FAM-labeled siRNAs. The red and black dash lines (B) represent the peak densities of nuclear and cytoplasmic mRNAs, respectively. Scale bar, 10 μm. Error bars indicate SEM (n = 120). (D-I) FISH analysis of mRNAs (red color) in NSUN2 (D-F) or ALYREF (G-I) knockdown HeLa cells reconstituted with control vector, EGFP/GFP-tagged wild-type or mutant forms of NSUN2 (D-F) or ALYREF (G-I); line scan graphs (E, H) and peak density quantification of line scan graphs (F, I) for mRNAs are shown. The red and black dash lines (E, H) represent the peak densities of nuclear and cytoplasmic mRNAs, respectively. Scale bar, 10 μm. Error bars indicate SEM (n = 120). P values were calculated by Student's t-test.CC BY · PubMed Central
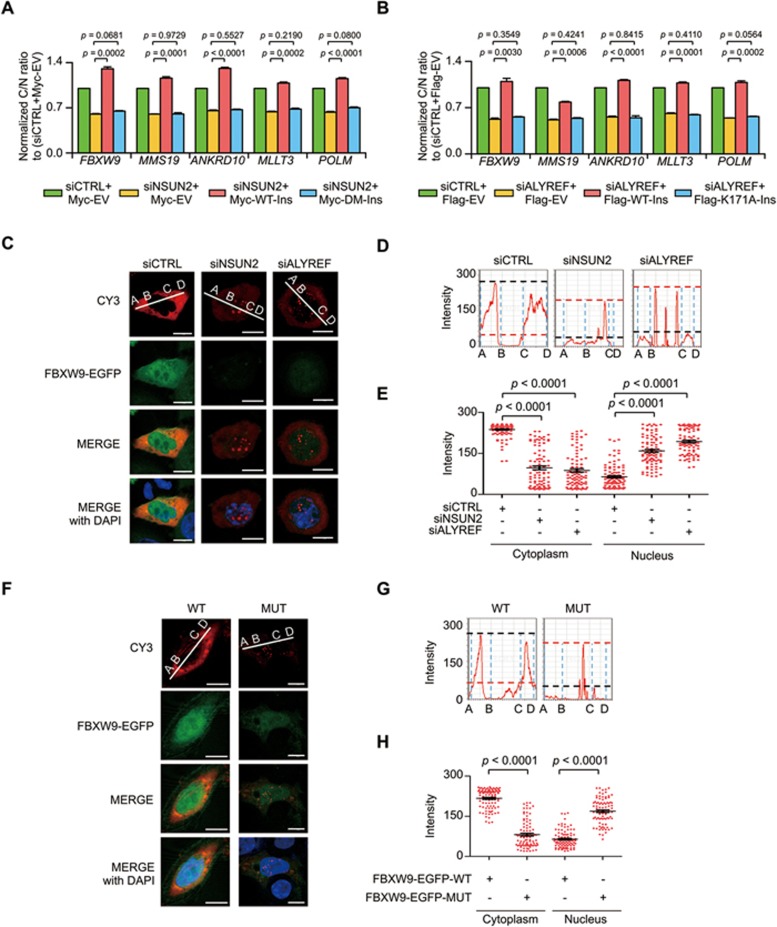
Figure 7 m5C recognition by ALYREF promotes mRNA export. (A, B) qPCR analysis of the relative cytoplasmic to nucleic ratios of NSUN2 target genes with m5C modification in NSUN2 (A) or ALYFEF (B) knockdown HeLa cells reconstituted with control vector, wild-type or mutant forms of NSUN2 (A) or ALYREF (B). Error bars indicate SEM (n = 3). (C-E) FISH analysis of EGFP-tagged FBXW9 Exon 1 minigene mRNAs (red color) in NSUN2 or ALYREF knockdown HeLa cells transfected with m5C site-containing wild-type FBXW9-EGFP minigene construct (FBXW9-EGFP-WT, C); line scan graphs (D) and peak density quantification of line scan graphs (E) for minigene mRNAs are shown. The minigene mRNA export was measured by Cy3-labeled oligonucleotide probes complementary to EGFP mRNAs. Scale bar, 10 μm. Error bars indicate SEM (n = 110). (F) Nuclear export of FBXW9 minigene mRNAs in HeLa cells transfected with m5C site-containing (FBXW9-EGFP-WT) or mutant (FBXW9-EGFP-MUT) minigene plasmids was analyzed by FISH assay using Cy3-labeled oligonucleotide probes complementary to EGFP mRNAs. (G-H) Line scan graphs (G) and peak density quantification of line scan graphs for minigene mRNAs (H) are shown. Scale bar, 10 μm. Error bars indicate SEM (n = 110). P values were calculated by Student's t-test.
Figure 7 m5C recognition by ALYREF promotes mRNA export. (A, B) qPCR analysis of the relative cytoplasmic to nucleic ratios of NSUN2 target genes with m5C modification in NSUN2 (A) or ALYFEF (B) knockdown HeLa cells reconstituted with control vector, wild-type or mutant forms of NSUN2 (A) or ALYREF (B). Error bars indicate SEM (n = 3). (C-E) FISH analysis of EGFP-tagged FBXW9 Exon 1 minigene mRNAs (red color) in NSUN2 or ALYREF knockdown HeLa cells transfected with m5C site-containing wild-type FBXW9-EGFP minigene construct (FBXW9-EGFP-WT, C); line scan graphs (D) and peak density quantification of line scan graphs (E) for minigene mRNAs are shown. The minigene mRNA export was measured by Cy3-labeled oligonucleotide probes complementary to EGFP mRNAs. Scale bar, 10 μm. Error bars indicate SEM (n = 110). (F) Nuclear export of FBXW9 minigene mRNAs in HeLa cells transfected with m5C site-containing (FBXW9-EGFP-WT) or mutant (FBXW9-EGFP-MUT) minigene plasmids was analyzed by FISH assay using Cy3-labeled oligonucleotide probes complementary to EGFP mRNAs. (G-H) Line scan graphs (G) and peak density quantification of line scan graphs for minigene mRNAs (H) are shown. Scale bar, 10 μm. Error bars indicate SEM (n = 110). P values were calculated by Student's t-test.CC BY · PubMed Central
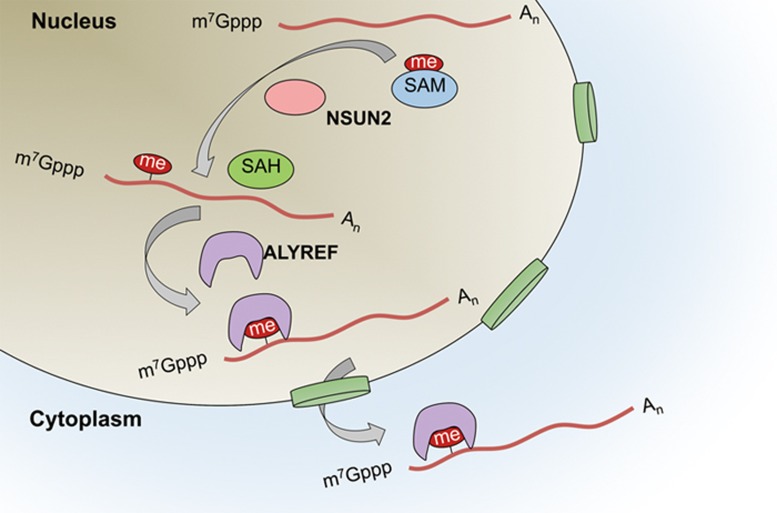
Figure 8 Working model showing dynamic regulation of m5C in mRNA. m5C formation is catalyzed by NSUN2. This modification provides a recognition target for ALYREF to mediate mRNA export from the nucleus.
Figure 8 Working model showing dynamic regulation of m5C in mRNA. m5C formation is catalyzed by NSUN2. This modification provides a recognition target for ALYREF to mediate mRNA export from the nucleus.CC BY · PubMed Central

Verification

Claims the paper makes

The claims and statistics of this paper haven’t been checked yet.

Run the check — free, no account needed. It reads the open-access text and checks the sources it cites.

A few free checks a day · papers already verified open instantly · results are public

Claims other papers make about this one

Each is checked against this paper’s own text: does it say what the citing paper says it does?

Self-check

Percentages, sums and reported differences re-computed from the paper’s own numbers.

The self-check needs the paper’s full text.

Citations

Cites

Research works printed but not linked: 62

  1. Dominissini D, Moshitch-Moshkovitz S, Schwartz S, et al. Topology of the human and mouse m6A RNA methylomes revealed by m6A-seq. Nature 2012; 485:201–206. · DOI · Paper page
  2. Zhao X, Yang Y, Sun BF, et al. FTO-dependent demethylation of N6-methyladenosine regulates mRNA splicing and is required for adipogenesis. Cell Res 2014; 24:1403–1419. · DOI
  3. Alarcόn CR, Goodarzi H, Lee H, Liu X, Tavazoie S, Tavazoie SF . HNRNPA2B1 is a mediator of m6A-dependent nuclear RNA processing events. Cell 2015; 162:1299–1308. · DOI · Paper page
  4. Alarcόn CR, Lee H, Goodarzi H, Halberg N, Tavazoie SF . N6-methyladenosine marks primary microRNAs for processing. Nature 2015; 519:482–485. · DOI
  5. Liu N, Dai Q, Zheng G, He C, Parisien M, Pan T . N6-methyladenosine-dependent RNA structural switches regulate RNA-protein interactions. Nature 2015; 518:560–564. · DOI · Paper page
  6. Meyer KD, Patil DP, Zhou J, et al. 5′ UTR m6A promotes cap-independent translation. Cell 2015; 163:999–1010. · DOI
  7. Wang X, Zhao BS, Roundtree IA, et al. N6-methyladenosine modulates messenger RNA translation efficiency. Cell 2015; 161:1388–1399. · DOI · Paper page
  8. Yang Y, Sun B-F, Xiao W, et al. Dynamic m6A modification and its emerging regulatory role in mRNA splicing. Sci Bull 2015; 60:21–32. · DOI
  9. Zhou J, Wan J, Gao X, Zhang X, Jaffrey SR, Qian SB . Dynamic m6A mRNA methylation directs translational control of heat shock response. Nature 2015; 526:591–594. · DOI
  10. Lin S, Choe J, Du P, Triboulet R, Gregory RI . The m6A methyltransferase METTL3 promotes translation in human cancer cells. Mol Cell 2016; 62:335–345. · DOI · Paper page
  11. Xiao W, Adhikari S, Dahal U, et al. Nuclear m6A reader YTHDC1 regulates mRNA splicing. Mol Cell 2016; 61:507–519. · DOI · Paper page
  12. Carlile TM, Rojas-Duran MF, Zinshteyn B, Shin H, Bartoli KM, Gilbert WV . Pseudouridine profiling reveals regulated mRNA pseudouridylation in yeast and human cells. Nature 2014; 515:143–146. · DOI
  13. Schwartz S, Bernstein DA, Mumbach MR, et al. Transcriptome-wide mapping reveals widespread dynamic-regulated pseudouridylation of ncRNA and mRNA. Cell 2014; 159:148–162. · DOI
  14. Li X, Zhu P, Ma S, et al. Chemical pulldown reveals dynamic pseudouridylation of the mammalian transcriptome. Nat Chem Biol 2015; 11:592–597. · DOI
  15. Dominissini D, Nachtergaele S, Moshitch-Moshkovitz S, et al. The dynamic N1-methyladenosine methylome in eukaryotic messenger RNA. Nature 2016; 530:441–446. · DOI
  16. Li X, Xiong X, Wang K, et al. Transcriptome-wide mapping reveals reversible and dynamic N1-methyladenosine methylome. Nat Chem Biol 2016; 12:311–316. · DOI
  17. Helm M . Post-transcriptional nucleotide modification and alternative folding of RNA. Nucleic Acids Res 2006; 34:721–733. · DOI
  18. Agris PF . Bringing order to translation: the contributions of transfer RNA anticodon-domain modifications. EMBO Rep 2008; 9:629–635. · DOI
  19. Schaefer M, Pollex T, Hanna K, Lyko F . RNA cytosine methylation analysis by bisulfite sequencing. Nucleic Acids Res 2009; 37:e12. · DOI
  20. Squires JE, Patel HR, Nousch M, et al. Widespread occurrence of 5-methylcytosine in human coding and non-coding RNA. Nucleic Acids Res 2012; 40:5023–5033. · DOI
  21. Edelheit S, Schwartz S, Mumbach MR, Wurtzel O, Sorek R . Transcriptome-wide mapping of 5-methylcytidine RNA modifications in bacteria, archaea, and yeast reveals m5C within archaeal mRNAs. PLoS Genet 2013; 9:e1003602. · DOI
  22. Khoddami V, Cairns BR . Identification of direct targets and modified bases of RNA cytosine methyltransferases. Nat Biotechnol 2013; 31:458–464. · DOI
  23. Hussain S, Sajini AA, Blanco S, et al. NSun2-mediated cytosine-5 methylation of vault noncoding RNA determines its processing into regulatory small RNAs. Cell Rep 2013; 4:255–261. · DOI
  24. Amort T, Rieder D, Wille A, et al. Distinct 5-methylcytosine profiles in poly(A) RNA from mouse embryonic stem cells and brain. Genome Biol 2017; 18:1. · DOI
  25. David R, Burgess A, Parker B, et al. Transcriptome-wide mapping of RNA 5-methylcytosine in Arabidopsis mRNAs and non-coding RNAs. Plant Cell 2017; doi: 10.1105/tpc.16.00751. · DOI
  26. Schaefer M . RNA 5-methylcytosine analysis by bisulfite sequencing. Methods Enzymol 2015; 560:297–329. · DOI
  27. Huber SM, van Delft P, Mendil L, et al. Formation and abundance of 5-hydroxymethylcytosine in RNA. Chembiochem 2015; 16:752–755. · DOI
  28. Ramaswami G, Lin W, Piskol R, Tan MH, Davis C, Li JB . Accurate identification of human Alu and non-Alu RNA editing sites. Nat Methods 2012; 9:579–581. · DOI
  29. Khil PP, Smirnova NA, Romanienko PJ, Camerini-Otero RD . The mouse X chromosome is enriched for sex-biased genes not subject to selection by meiotic sex chromosome inactivation. Nat Genet 2004; 36:642–646. · DOI
  30. Brzezicha B, Schmidt M, Makalowska I, Jarmolowski A, Pienkowska J, Szweykowska-Kulinska Z . Identification of human tRNA:m5C methyltransferase catalysing intron-dependent m5C formation in the first position of the anticodon of the pre-tRNA Leu (CAA). Nucleic Acids Res 2006; 34:6034–6043. · DOI
  31. Tuorto F, Liebers R, Musch T, et al. RNA cytosine methylation by Dnmt2 and NSun2 promotes tRNA stability and protein synthesis. Nat Struct Mol Biol 2012; 19:900–905. · DOI
  32. Popis MC, Blanco S, Frye M . Posttranscriptional methylation of transfer and ribosomal RNA in stress response pathways, cell differentiation, and cancer. Curr Opin Oncol 2016; 28:65–71. · DOI
  33. King MY, Redman KL . RNA methyltransferases utilize two cysteine residues in the formation of 5-methylcytosine. Biochemistry 2002; 41:11218–11225. · DOI
  34. Xu C, Wang X, Liu K, et al. Structural basis for selective binding of m6A RNA by the YTHDC1 YTH domain. Nat Chem Biol 2014; 10:927–929. · DOI
  35. Zhou Z, Luo MJ, Straesser K, Katahira J, Hurt E, Reed R . The protein Aly links pre-messenger-RNA splicing to nuclear export in metazoans. Nature 2000; 407:401–405. · DOI
  36. Wickramasinghe VO, Laskey RA . Control of mammalian gene expression by selective mRNA export. Nat Rev Mol Cell Biol 2015; 16:431–442. · DOI
  37. Luo GZ, MacQueen A, Zheng G, et al. Unique features of the m6A methylome in Arabidopsis thaliana. Nat Commun 2014; 5:5630. · DOI
  38. Reed R . Coupling transcription, splicing and mRNA export. Curr Opin Cell Biol 2003; 15:326–331. · DOI
  39. Kohler A, Hurt E . Exporting RNA from the nucleus to the cytoplasm. Nat Rev Mol Cell Biol 2007; 8:761–773. · DOI
  40. Rodriguez-Navarro S, Hurt E . Linking gene regulation to mRNA production and export. Curr Opin Cell Biol 2011; 23:302–309. · DOI
  41. Tutucci E, Stutz F . Keeping mRNPs in check during assembly and nuclear export. Nat Rev Mol Cell Biol 2011; 12:377–384. · DOI
  42. Chanarat S, Burkert-Kautzsch C, Meinel DM, Strasser K . Prp19C and TREX: interacting to promote transcription elongationand mRNA export. Transcription 2012; 3:8–12. · DOI
  43. Katahira J . mRNA export and the TREX complex. Biochim Biophys Acta 2012; 1819:507–513. · DOI
  44. Wickramasinghe VO, McMurtrie PI, Mills AD, et al. mRNA export from mammalian cell nuclei is dependent on GANP. Curr Biol 2010; 20:25–31. · DOI
  45. Umlauf D, Bonnet J, Waharte F, et al. The human TREX-2 complex is stably associated with the nuclear pore basket. J Cell Sci 2013; 126:2656–2667. · DOI
  46. Wickramasinghe VO, Andrews R, Ellis P, et al. Selective nuclear export of specific classes of mRNA from mammalian nuclei is promoted by GANP. Nucleic Acids Res 2014; 42:5059–5071. · DOI
  47. Zhang H, Mahadevan K, Palazzo AF . Sumoylation is required for the cytoplasmic accumulation of a subset of mRNAs. Genes 2014; 5:982–1000. · DOI
  48. Okamura M, Inose H, Masuda S . RNA export through the NPC in eukaryotes. Genes 2015; 6:124–149. · DOI
  49. Brennan CM, Gallouzi IE, Steitz JA . Protein ligands to HuR modulate its interaction with target mRNAs in vivo. J Cell Biol 2000; 151:1–14. · DOI
  50. Topisirovic I, Siddiqui N, Lapointe VL, et al. Molecular dissection of the eukaryotic initiation factor 4E (eIF4E) export-competent RNP. EMBO J 2009; 28:1087–1098. · DOI
  51. Yang J, Bogerd HP, Wang PJ, Page DC, Cullen BR . Two closely related human nuclear export factors utilize entirely distinct export pathways. Mol Cell 2001; 8:397–406. · DOI
  52. Zhao BS, Roundtree IA, He C . Post-transcriptional gene regulation by mRNA modifications. Nat Rev Mol Cell Biol 2017; 18:31–42. · DOI
  53. Chai Y, Hu N, Pan Y . Kinetic and thermodynamic control of protonation in atmospheric pressure chemical ionization. J Am Soc Mass Spectrom 2013; 24:1097–1101. · DOI
  54. Dignam JD, Lebovitz RM, Roeder RG . Accurate transcription initiation by RNA polymerase II in a soluble extract from isolated mammalian nuclei. Nucleic Acids Res 1983; 11:1475–1489. · DOI
  55. Loo LS, Tang N, Al-Haddawi M, Dawe GS, Hong W . A role for sorting nexin 27 in AMPA receptor trafficking. Nat Commun 2014; 5:3176. · DOI · Paper page
  56. Parkinson K, Baines AE, Keller T, et al. Calcium-dependent regulation of Rab activation and vesicle fusion by an intracellular P2X ion channel. Nat Cell Biol 2014; 16:87–98. · DOI
  57. Krueger F, Andrews SR . Bismark: a flexible aligner and methylation caller for Bisulfite-Seq applications. Bioinformatics 2011; 27:1571–1572. · DOI
  58. Crooks GE, Hon G, Chandonia JM, Brenner SE . WebLogo: a sequence logo generator. Genome Res 2004; 14:1188–1190. · DOI
  59. Kim D, Pertea G, Trapnell C, Pimentel H, Kelley R, Salzberg SL . TopHat2: accurate alignment of transcriptomes in the presence of insertions, deletions and gene fusions. Genome Biol 2013; 14:R36. · DOI · Paper page
  60. Zhang Y, Liu T, Meyer CA, et al. Model-based analysis of ChIP-Seq (MACS). Genome Biol 2008; 9:R137. · DOI · Paper page
  61. Wang Y, Song F, Zhu J, et al. GSA: Genome Sequence Archive. Genomics, Proteomics & Bioinformatics 2017; 15:14–18. · DOI
  62. BIG Data Center Members. The BIG Data Center: from deposition to integration to translation. Nucleic Acids Res 2017; 45:D18–D24. · DOI

Cited by

See all 1,062

Metadata

Authors
Yang, X., Yang, Y., Sun, B.-F., Chen, Y.-S., Xu, J.-W., Lai, W.-Y., Li, A., Wang, X., Bhattarai, D. P., Xiao, W., Sun, H.-Y., Zhu, Q., Ma, H.-L., Adhikari, S., Sun, M., Hao, Y.-J., Zhang, B., Huang, C.-M., Huang, N., Jiang, G.-B., Zhao, Y.-L., Wang, H.-L., Sun, Y.-P., & Yang, Y.-G.
Venue
Cell Research
Published
2017-04-18
Volume
27
Issue
5
Pages
606-625
ISSN
  • 1001-0602
  • 1748-7838
Cited by
1,062
References
10
Language
en

About these checks

Registry, retraction, Cites and statistics results are computed, not judged, with one exception: a printed reference that no index lists is read once by a model before it counts as a citation error. Claims are extracted by a model and kept only when their quote appears verbatim in the text; each cited source is then checked, with a model’s help, for whether it says what the claim relies on. Those verdicts can be wrong — read the claim’s quote and the cited source before relying on one.

Statistics and arithmetic are recomputed, not judged.

Confidence bands are shown only for fields calibrated on our annotated test set. None is calibrated yet, so no band is shown.

What counts as a claim ›How we measure confidence ›How we check this ›

Are you an author, or do you see a problem with this page? Request a review