Cited by 408

The DOI matches its Crossref record; 17 of the 17 references it cites were found in a registry or an index.

miR-137 regulates ferroptosis by targeting glutamine transporter SLC1A5 in melanoma

Luo, Meiying, Wu, Longfei, Zhang, Kexin, Wang, Hong, Zhang, Tian, Gutierrez, Lucas, O’Connell, Douglas, Zhang, Peng, Li, Yu, Gao, Tongtong, Ren, Wenyan, Yang, Yongfei·2018·Cell Death & Differentiation

Overview

The claims and statistics of this paper haven’t been checked yet.

Run the check — free, no account needed. It reads the open-access text and checks the sources it cites.

A few free checks a day · papers already verified open instantly · results are public

Integrity signals

Registry

Crossref · 10.1038/s41418-017-0053-8

Cites

17 of 17 references verified0 citation errors · 0 not checkable

Statistics

Figures

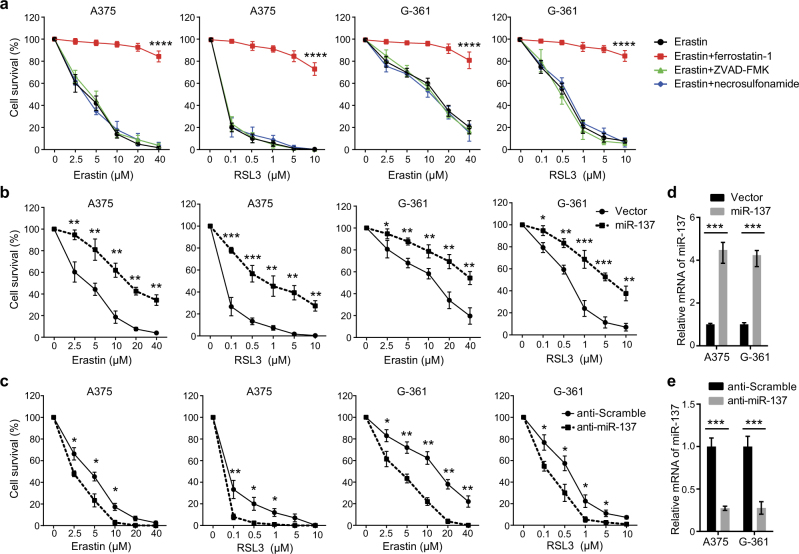
Fig. 1 miR-137 negatively regulates ferroptosis in melanoma. a The A375 and G-361 human melanoma cells were treated with erastin (2.5–40 µM) or RSL3 (0.1–10 µM) with or without a cell death inhibitor (ferrostatin-1, 1 µM; ZVAD-FMK, 10 µM; necrosulfonamide, 0.5 µM) for 24 h. Cell death was assayed using a CCK-8 kit. Data shown represent mean ± SD from three independent experiments. ****p < 0.0001. b Overexpression of miR-137 suppressed erastin- and RSL3-induced cell death in human melanoma cells. Indicated cells were treated with erastin (2.5–40 µM) or RSL3 (0.1–10 µM) for 24 h. Cell death was assayed using a CCK-8 kit. Data shown represent mean ± SD from three independent experiments. *p < 0.05; **p < 0.01; ***p < 0.001. c Inhibition of endogenous miR-137 enhanced erastin- and RSL3-induced cell death in human melanoma cells. Indicated cells were treated with erastin (2.5–40 µM) or RSL3 (0.1–10 µM) for 24 h. Cell death was assayed using a CCK-8 kit. Data shown represent mean ± SD from three independent experiments. *p < 0.05; **p < 0.01. d Quantitative RT-PCR showing the relative expression levels of miR-137 in b. Data are mean ± SD from three independent experiments. ***p < 0.001. e Quantitative RT-PCR showing the relative expression levels of miR-137 in d. Data are mean ± SD from three independent experiments. ***p < 0.001
Fig. 1 miR-137 negatively regulates ferroptosis in melanoma. a The A375 and G-361 human melanoma cells were treated with erastin (2.5–40 µM) or RSL3 (0.1–10 µM) with or without a cell death inhibitor (ferrostatin-1, 1 µM; ZVAD-FMK, 10 µM; necrosulfonamide, 0.5 µM) for 24 h. Cell death was assayed using a CCK-8 kit. Data shown represent mean ± SD from three independent experiments. ****p < 0.0001. b Overexpression of miR-137 suppressed erastin- and RSL3-induced cell death in human melanoma cells. Indicated cells were treated with erastin (2.5–40 µM) or RSL3 (0.1–10 µM) for 24 h. Cell death was assayed using a CCK-8 kit. Data shown represent mean ± SD from three independent experiments. *p < 0.05; **p < 0.01; ***p < 0.001. c Inhibition of endogenous miR-137 enhanced erastin- and RSL3-induced cell death in human melanoma cells. Indicated cells were treated with erastin (2.5–40 µM) or RSL3 (0.1–10 µM) for 24 h. Cell death was assayed using a CCK-8 kit. Data shown represent mean ± SD from three independent experiments. *p < 0.05; **p < 0.01. d Quantitative RT-PCR showing the relative expression levels of miR-137 in b. Data are mean ± SD from three independent experiments. ***p < 0.001. e Quantitative RT-PCR showing the relative expression levels of miR-137 in d. Data are mean ± SD from three independent experiments. ***p < 0.001CC BY-NC-SA · PubMed Central
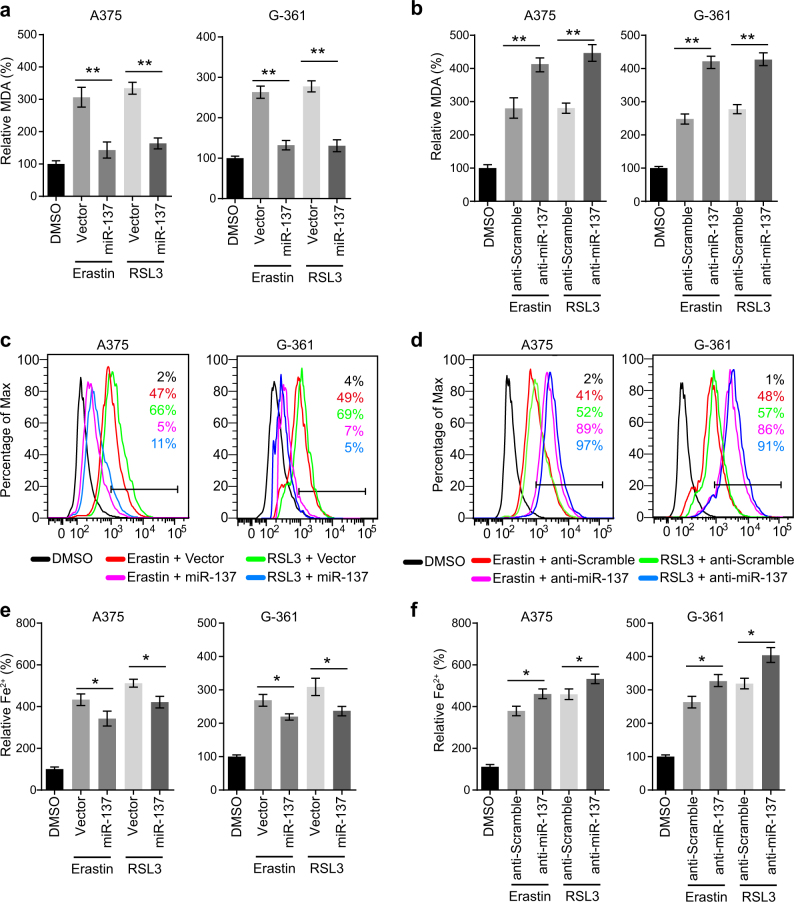
Fig. 2 miR-137 regulates the lipid metabolism of melanoma cells. a miR-137 overexpression significantly suppressed the erastin- and RSL3-induced lipid formation. Indicated cells were treated with erastin (5 µM in A375, 10 µM in G-361) or RSL3 (0.1 µM in A375, 0.5 µM in G-361) for 24 h. The lipid formation was measured by MDA assay. Data shown represent mean ± SD from three independent experiments. **p < 0.01. b miR-137 antagomirs significantly increased the erastin- and RSL3-induced lipid formation. Indicated cells were treated with erastin (5 µM in A375, 10 µM in G-361) or RSL3 (0.1 µM in A375, 0.5 µM in G-361) for 24 h. The lipid formation was measured by MDA assay. Data shown represent mean ± SD from three independent experiments. **p < 0.01. c Overexpression of miR-137 significantly suppressed erastin- and RSL3-induced lipid ROS level as assessed by flow cytometry using C11-BODIPY. Indicated cells were treated with erastin (5 µM in A375, 10 µM in G-361) or RSL3 (0.1 µM in A375, 0.5 µM in G-361) for 24 h. d Cells transfected with miR-137 antagomirs showed increased lipid ROS level as assessed by BODIPY-C11 staining. Indicated cells were treated with erastin (5 µM in A375, 10 µM in G-361) or RSL3 (0.1 µM in A375, 0.5 µM in G-361) for 24 h. e, f The expression levels of miR-137 influences the Fe2+ accumulation in erastin or RSL3-treated A375 and G-361 cells. Indicated cells were treated with erastin (5 µM in A375, 10 µM in G-361) or RSL3 (0.1 µM in A375, 0.5 µM in G-361) for 24 h and the intracellular Fe2+ was assayed. Data shown represent mean ± SD from three independent experiments. *p < 0.05
Fig. 2 miR-137 regulates the lipid metabolism of melanoma cells. a miR-137 overexpression significantly suppressed the erastin- and RSL3-induced lipid formation. Indicated cells were treated with erastin (5 µM in A375, 10 µM in G-361) or RSL3 (0.1 µM in A375, 0.5 µM in G-361) for 24 h. The lipid formation was measured by MDA assay. Data shown represent mean ± SD from three independent experiments. **p < 0.01. b miR-137 antagomirs significantly increased the erastin- and RSL3-induced lipid formation. Indicated cells were treated with erastin (5 µM in A375, 10 µM in G-361) or RSL3 (0.1 µM in A375, 0.5 µM in G-361) for 24 h. The lipid formation was measured by MDA assay. Data shown represent mean ± SD from three independent experiments. **p < 0.01. c Overexpression of miR-137 significantly suppressed erastin- and RSL3-induced lipid ROS level as assessed by flow cytometry using C11-BODIPY. Indicated cells were treated with erastin (5 µM in A375, 10 µM in G-361) or RSL3 (0.1 µM in A375, 0.5 µM in G-361) for 24 h. d Cells transfected with miR-137 antagomirs showed increased lipid ROS level as assessed by BODIPY-C11 staining. Indicated cells were treated with erastin (5 µM in A375, 10 µM in G-361) or RSL3 (0.1 µM in A375, 0.5 µM in G-361) for 24 h. e, f The expression levels of miR-137 influences the Fe2+ accumulation in erastin or RSL3-treated A375 and G-361 cells. Indicated cells were treated with erastin (5 µM in A375, 10 µM in G-361) or RSL3 (0.1 µM in A375, 0.5 µM in G-361) for 24 h and the intracellular Fe2+ was assayed. Data shown represent mean ± SD from three independent experiments. *p < 0.05CC BY-NC-SA · PubMed Central
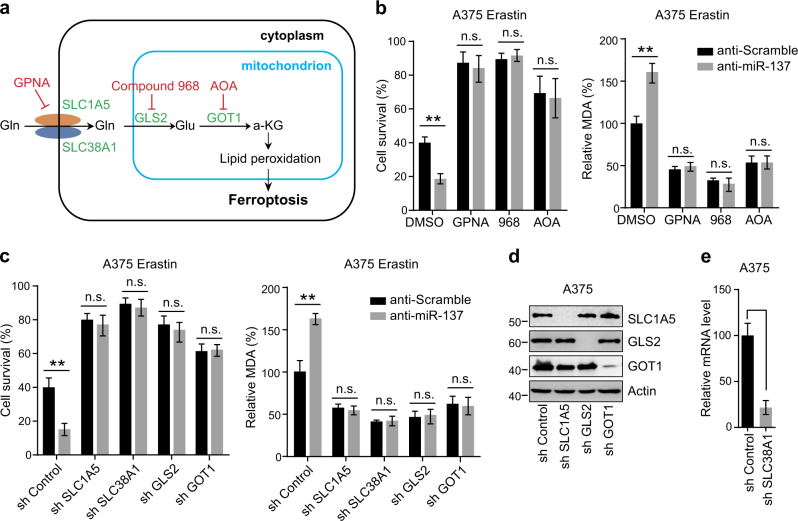
Fig. 3 Glutaminolysis mediates miR-137-induced ferroptosis inhibition. a Schematic overview of the glutaminolysis pathway in ferroptosis. Glutamine (Gln) is transferred into cell cytoplasm by importers SLC1A5/SLC38A1, and subsequently converted to glutamate (Glu) by glutaminase GLS2 in mitochondria. The aspartate transaminase GOT1 ultimately converts Glu to a-ketoglutarate (a-KG), which contributes to ROS accumulation by an unknown mechanism. The small-molecule inhibitors are indicated in red: L-Gln transporter inhibitor GPNA; GLS inhibitor Compound 968; Pan-transaminases inhibitor AOA. b Pharmacological inhibition of multiple components in the glutaminolysis pathway abrogated anti-miR-137-mediated ferroptosis cell death and lipid accumulation. Cells transfected with control or miR-137 antagomirs were treated with erastin (5 µM) and GPNA (5 mM)/compound 968 (20 µM)/AOA (0.5 mM) for 24 h. The cell viability was assayed using a CCK-8 kit and the lipid accumulation was measured by MDA assay. Data shown represent mean ± SD from three independent experiments. n.s. nonsignificant; **p < 0.01. c Knockdown of Gln importers or metabolic enzymes blocked anti-miR-137-mediated ferroptosis cell death and lipid accumulation. Cells stably expressing control shRNA or indicated shRNA targeting metabolic enzymes were transfected with control or miR-137 antagomir, and then treated with erastin (5 µM) for 24 h. The cell viability was assayed using a CCK-8 kit and the lipid accumulation was measured by MDA assay. Data shown represent mean ± SD from three independent experiments. **p < 0.01. d The knockdown efficiency of three shRNA constructs targeting SLC1A5, GLS2 and GOT1 were detected by western blot. e The knockdown efficiency of shRNA construct targeting SLC38A1 was measured by real-time RT-PCR. Data shown represent mean ± SD from three independent experiments. ***p < 0.001.
Fig. 3 Glutaminolysis mediates miR-137-induced ferroptosis inhibition. a Schematic overview of the glutaminolysis pathway in ferroptosis. Glutamine (Gln) is transferred into cell cytoplasm by importers SLC1A5/SLC38A1, and subsequently converted to glutamate (Glu) by glutaminase GLS2 in mitochondria. The aspartate transaminase GOT1 ultimately converts Glu to a-ketoglutarate (a-KG), which contributes to ROS accumulation by an unknown mechanism. The small-molecule inhibitors are indicated in red: L-Gln transporter inhibitor GPNA; GLS inhibitor Compound 968; Pan-transaminases inhibitor AOA. b Pharmacological inhibition of multiple components in the glutaminolysis pathway abrogated anti-miR-137-mediated ferroptosis cell death and lipid accumulation. Cells transfected with control or miR-137 antagomirs were treated with erastin (5 µM) and GPNA (5 mM)/compound 968 (20 µM)/AOA (0.5 mM) for 24 h. The cell viability was assayed using a CCK-8 kit and the lipid accumulation was measured by MDA assay. Data shown represent mean ± SD from three independent experiments. n.s. nonsignificant; **p < 0.01. c Knockdown of Gln importers or metabolic enzymes blocked anti-miR-137-mediated ferroptosis cell death and lipid accumulation. Cells stably expressing control shRNA or indicated shRNA targeting metabolic enzymes were transfected with control or miR-137 antagomir, and then treated with erastin (5 µM) for 24 h. The cell viability was assayed using a CCK-8 kit and the lipid accumulation was measured by MDA assay. Data shown represent mean ± SD from three independent experiments. **p < 0.01. d The knockdown efficiency of three shRNA constructs targeting SLC1A5, GLS2 and GOT1 were detected by western blot. e The knockdown efficiency of shRNA construct targeting SLC38A1 was measured by real-time RT-PCR. Data shown represent mean ± SD from three independent experiments. ***p < 0.001.CC BY-NC-SA · PubMed Central
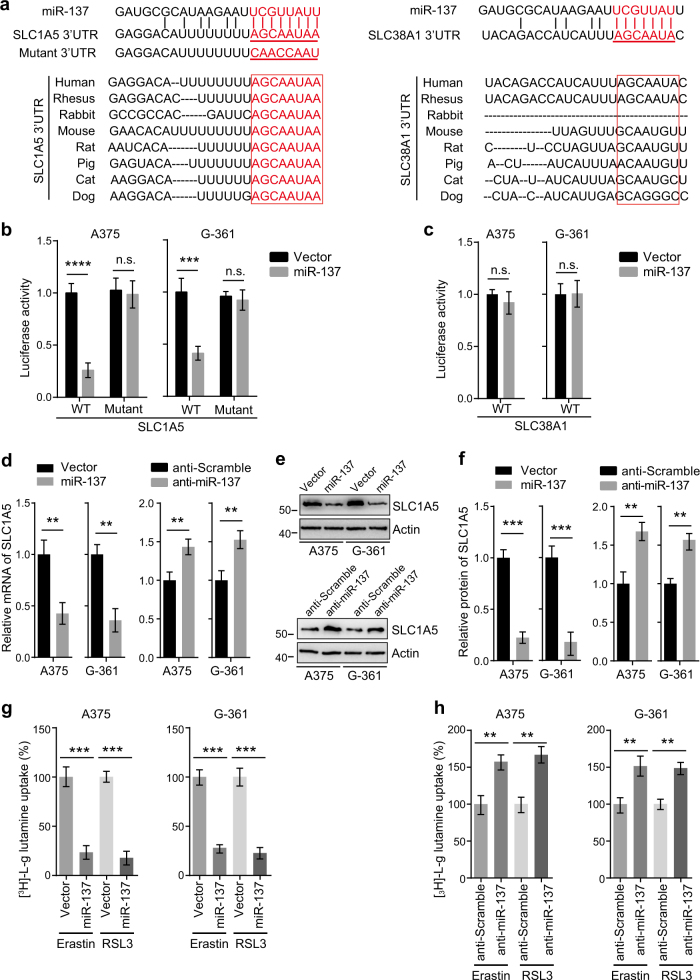
Fig. 4 miR-137 directly targets SLC1A5 in melanoma cells. a Sequence alignment of miR-137 and the 3′-UTR of SLC1A5 or SLC38A1. The seed sequence of miR-137 and the binding sites in 3′-UTR are indicated in red. The 3′-UTR mutants containing mismatched nucleotides are shown at the bottom. The binding site of SLC1A5 is highly conserved in several species (left), but the binding site of SLC38A1 is not conserved between different species (right). b miR-137 overexpression inhibited the expression of 3′-UTR-luciferase reporter of SLC1A5 in A375 and G-361 cells, but the mutant construct was immune to miR-137. Data are mean ± SD from three independent experiments. ***p < 0.001; n.s. not significant. c miR-137 overexpression has no effect on the expression of 3′-UTR-luciferase reporter of SLC38A1 in A375 and G-361 cells. d miR-137 regulates the mRNA level of SLC1A5 in A375 and G-361 cells. The mRNA levels were measured by quantitative RT-PCR, data are mean ± SD from three independent experiments. **p < 0.01. e The protein levels of SLC1A5 were modulated by miR-137 in A375 and G-361 cells. Cells transfected with indicated constructs or antagomirs were collected, and the protein level of SLC1A5 was detected by western blot. Actin was used as a loading control. f Quantitative analysis of the experiments in (e). Data are mean ± SD from three independent experiments. **p < 0.01, ***p < 0.001. g miR-137 overexpression significantly suppressed the [3H]-l-glutamine uptake in A375 and G-361 cells. Indicated cells were treated with erastin (5 µM in A375, 10 µM in G-361) or RSL3 (0.1 µM in A375, 0.5 µM in G-361) for 24 h. Data shown represent mean ± SD from three independent experiments. ***p < 0.001. h Inhibition of endogenous miR-137 showed increased [3H]-L-glutamine uptake in A375 and G-361 cells. Indicated cells were treated with erastin (5 µM in A375, 10 µM in G-361) or RSL3 (0.1 µM in A375, 0.5 µM in G-361) for 24 h. Data shown represent mean ± SD from three independent experiments. **p < 0.01
Fig. 4 miR-137 directly targets SLC1A5 in melanoma cells. a Sequence alignment of miR-137 and the 3′-UTR of SLC1A5 or SLC38A1. The seed sequence of miR-137 and the binding sites in 3′-UTR are indicated in red. The 3′-UTR mutants containing mismatched nucleotides are shown at the bottom. The binding site of SLC1A5 is highly conserved in several species (left), but the binding site of SLC38A1 is not conserved between different species (right). b miR-137 overexpression inhibited the expression of 3′-UTR-luciferase reporter of SLC1A5 in A375 and G-361 cells, but the mutant construct was immune to miR-137. Data are mean ± SD from three independent experiments. ***p < 0.001; n.s. not significant. c miR-137 overexpression has no effect on the expression of 3′-UTR-luciferase reporter of SLC38A1 in A375 and G-361 cells. d miR-137 regulates the mRNA level of SLC1A5 in A375 and G-361 cells. The mRNA levels were measured by quantitative RT-PCR, data are mean ± SD from three independent experiments. **p < 0.01. e The protein levels of SLC1A5 were modulated by miR-137 in A375 and G-361 cells. Cells transfected with indicated constructs or antagomirs were collected, and the protein level of SLC1A5 was detected by western blot. Actin was used as a loading control. f Quantitative analysis of the experiments in (e). Data are mean ± SD from three independent experiments. **p < 0.01, ***p < 0.001. g miR-137 overexpression significantly suppressed the [3H]-l-glutamine uptake in A375 and G-361 cells. Indicated cells were treated with erastin (5 µM in A375, 10 µM in G-361) or RSL3 (0.1 µM in A375, 0.5 µM in G-361) for 24 h. Data shown represent mean ± SD from three independent experiments. ***p < 0.001. h Inhibition of endogenous miR-137 showed increased [3H]-L-glutamine uptake in A375 and G-361 cells. Indicated cells were treated with erastin (5 µM in A375, 10 µM in G-361) or RSL3 (0.1 µM in A375, 0.5 µM in G-361) for 24 h. Data shown represent mean ± SD from three independent experiments. **p < 0.01CC BY-NC-SA · PubMed Central
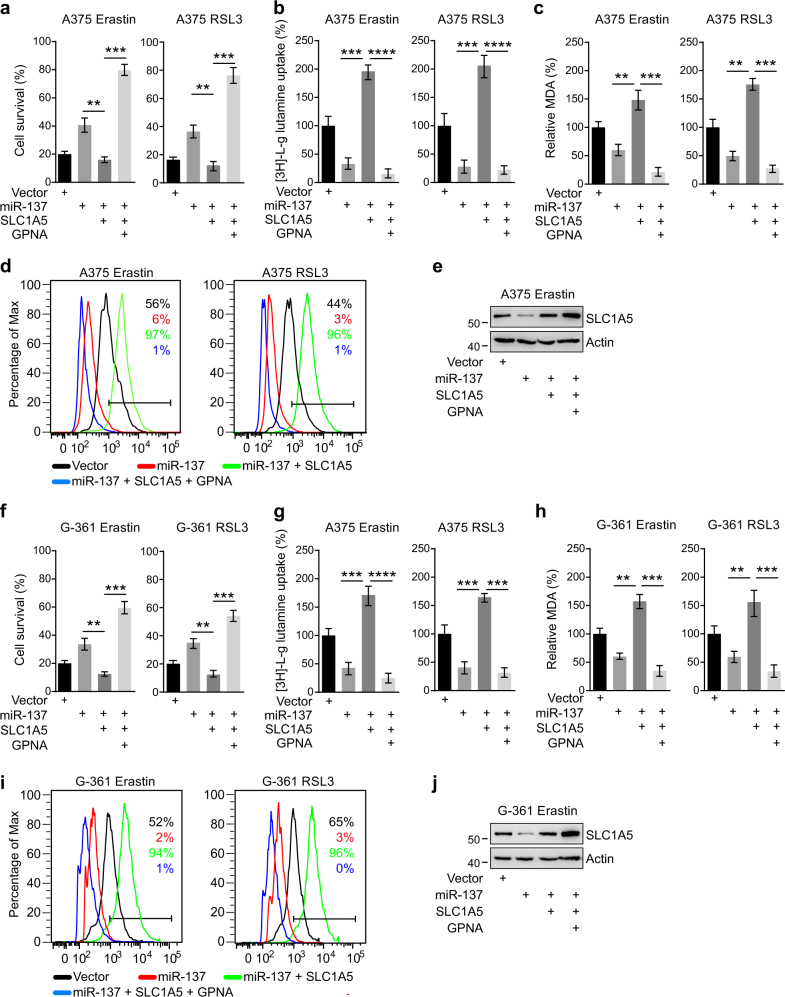
Fig. 5 Overexpression of SLC1A5 rescued miR-137-mediated ferroptosis inhibition. a, b, c Cell viability a, intracellular MDA levels b, and [3H]-L-glutamine uptake c of indicated cells were measured. A375 cells were transfected with indicated constructs and treated with erastin (5 µM) or RSL3 (0.1 µM). The concentration of GPNA is 5 mM. Data are mean ± SD from three independent experiments. **p < 0.01, ***p < 0.001, ****p < 0.0001. d Lipid ROS levels of indicated cells were measured by flow cytometry using C11-BODIPY. A375 cells were transfected with indicated constructs and treated with erastin (5 µM) or RSL3 (0.1 µM). e Immunoblot analysis of SLC1A5 in A375 cells following indicated transfections and treatments. Actin was used as a loading control. f, g, h Cell viability f, intracellular MDA levels g and [3H]-l-glutamine uptake h of indicated cells were measured. G-361 cells were transfected with indicated constructs and treated with erastin (10 µM) or RSL3 (0.5 µM). The concentration of GPNA is 5 mM. Data are mean ± SD from three independent experiments. **p < 0.01, ***p < 0.001, ****p < 0.0001. i Lipid ROS levels of indicated cells were measured by flow cytometry using C11-BODIPY. G-361 cells were transfected with indicated constructs and treated with erastin (10 µM) or RSL3 (0.5 µM). j Immunoblot analysis of SLC1A5 in G-361 cells following indicated transfections and treatments. Actin was used as a loading control
Fig. 5 Overexpression of SLC1A5 rescued miR-137-mediated ferroptosis inhibition. a, b, c Cell viability a, intracellular MDA levels b, and [3H]-L-glutamine uptake c of indicated cells were measured. A375 cells were transfected with indicated constructs and treated with erastin (5 µM) or RSL3 (0.1 µM). The concentration of GPNA is 5 mM. Data are mean ± SD from three independent experiments. **p < 0.01, ***p < 0.001, ****p < 0.0001. d Lipid ROS levels of indicated cells were measured by flow cytometry using C11-BODIPY. A375 cells were transfected with indicated constructs and treated with erastin (5 µM) or RSL3 (0.1 µM). e Immunoblot analysis of SLC1A5 in A375 cells following indicated transfections and treatments. Actin was used as a loading control. f, g, h Cell viability f, intracellular MDA levels g and [3H]-l-glutamine uptake h of indicated cells were measured. G-361 cells were transfected with indicated constructs and treated with erastin (10 µM) or RSL3 (0.5 µM). The concentration of GPNA is 5 mM. Data are mean ± SD from three independent experiments. **p < 0.01, ***p < 0.001, ****p < 0.0001. i Lipid ROS levels of indicated cells were measured by flow cytometry using C11-BODIPY. G-361 cells were transfected with indicated constructs and treated with erastin (10 µM) or RSL3 (0.5 µM). j Immunoblot analysis of SLC1A5 in G-361 cells following indicated transfections and treatments. Actin was used as a loading controlCC BY-NC-SA · PubMed Central
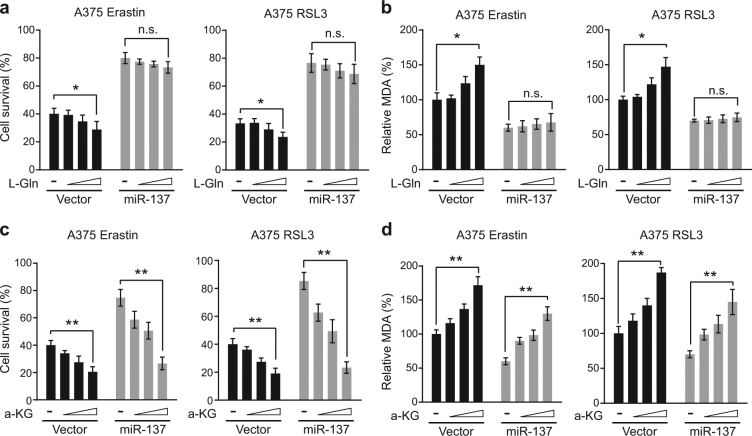
Fig. 6 miR-137-mediated ferroptosis inhibition was rescued by a-KG but not glutamine. a L-Gln induces cell death in erastin or RSL3-treated A375 cells in a dose-dependent manner. Overexpression of miR-137 blocked the cell death-inducing activity of L-Gln. Indicated cells were treated with erastin (5 µM) or RSL3 (0.1 µM) for 24 h, and the cell viability was assayed using a CCK-8 kit. The concentrations of L-Gln were 0.02, 0.1 and 0.5 mM. Data are mean ± SD from three independent experiments. n.s. not significant; *p < 0.05. b The intercellular MDA levels of erastin or RSL3-treated A375 cells were induced by L-Gln in a dose-dependent manner, which were blocked by the overexpression of miR-137. Indicated cells were treated with erastin (5 µM) or RSL3 (0.1 µM) for 24 h. The concentrations of L-Gln were 0.02, 0.1 and 0.5 mM. Data are mean ± SD from three independent experiments. *p < 0.05. c a-KG induces cell death in both control and miR-137-overexpressing A375 cells in a dose-dependent manner. Indicated cells were treated with erastin (5 µM) or RSL3 (0.1 µM) for 24 h. The concentrations of a-KG were 0.5, 1 and 2 mM. Data are mean ± SD from three independent experiments. **p < 0.01. d The intercellular MDA levels in both control and miR-137-overexpressing A375 cells were induced by a-KG in a dose-dependent manner. Indicated cells were treated with erastin (5 µM) or RSL3 (0.1 µM) for 24 h. The concentrations of a-KG were 0.5, 1 and 2 mM. Data are mean ± SD from three independent experiments. **p < 0.01
Fig. 6 miR-137-mediated ferroptosis inhibition was rescued by a-KG but not glutamine. a L-Gln induces cell death in erastin or RSL3-treated A375 cells in a dose-dependent manner. Overexpression of miR-137 blocked the cell death-inducing activity of L-Gln. Indicated cells were treated with erastin (5 µM) or RSL3 (0.1 µM) for 24 h, and the cell viability was assayed using a CCK-8 kit. The concentrations of L-Gln were 0.02, 0.1 and 0.5 mM. Data are mean ± SD from three independent experiments. n.s. not significant; *p < 0.05. b The intercellular MDA levels of erastin or RSL3-treated A375 cells were induced by L-Gln in a dose-dependent manner, which were blocked by the overexpression of miR-137. Indicated cells were treated with erastin (5 µM) or RSL3 (0.1 µM) for 24 h. The concentrations of L-Gln were 0.02, 0.1 and 0.5 mM. Data are mean ± SD from three independent experiments. *p < 0.05. c a-KG induces cell death in both control and miR-137-overexpressing A375 cells in a dose-dependent manner. Indicated cells were treated with erastin (5 µM) or RSL3 (0.1 µM) for 24 h. The concentrations of a-KG were 0.5, 1 and 2 mM. Data are mean ± SD from three independent experiments. **p < 0.01. d The intercellular MDA levels in both control and miR-137-overexpressing A375 cells were induced by a-KG in a dose-dependent manner. Indicated cells were treated with erastin (5 µM) or RSL3 (0.1 µM) for 24 h. The concentrations of a-KG were 0.5, 1 and 2 mM. Data are mean ± SD from three independent experiments. **p < 0.01CC BY-NC-SA · PubMed Central
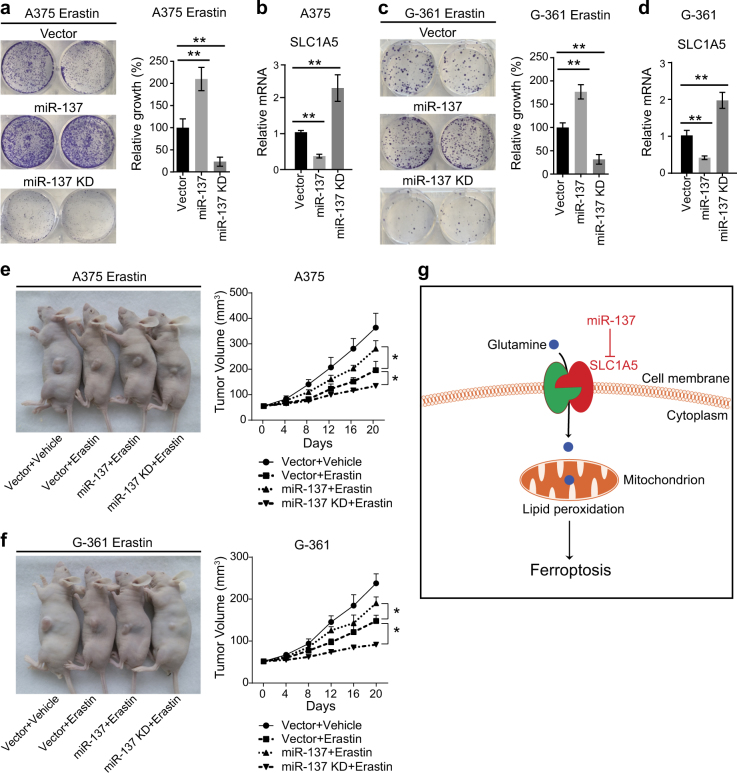
Fig. 7 Inhibition of miR-137 enhances the ferroptosis activity in vivo. a Colony formation assay of the indicated A375 cell lines. Cells were treated with erastin (5 µM) for 24 h, and were grown without erastin for 14 days. For each cell line, all dishes were fixed, stained, and photographed at the same time. Data are mean ± SD from three independent experiments. **p < 0.01. b Quantitative RT-PCR showing the relative expression levels of SLC1A5 in indicated A375 cells in a. Data are mean ± SD from three independent experiments. **p < 0.01. c Colony formation assay of the indicated G-361 cell lines. Cells were treated with erastin (10 µM) for 24 h, and were grown without erastin for 14 days. For each cell line, all dishes were fixed, stained, and photographed at the same time. Data are mean ± SD from three independent experiments. **p < 0.01. d Quantitative RT-PCR showing the relative expression levels of SLC1A5 in indicated G-361 cells in c. Data are mean ± SD from three independent experiments. **p < 0.01. e, f Suppression of miR-137 enhances erastin-induced ferroptosis in vivo. C57BL/6 mice were injected subcutaneously with indicated A375 cells e or G-361 cells f (1 × 10⁶ cells per mouse) and treated with erastin (15 mg/kg intraperitoneally, twice every other day) when the tumor volume reached 50 mm3. Tumor volume was calculated every 4 days. Data represent mean ± SD (n = 5–6 mice per group). Significance was determined by one-sided Mann–Whitney U-test, *p < 0.05. g Schematic depicting miR-137-mediated ferroptosis in melanoma cells. miR-137 suppresses erastin-induced ferroptosis by directly targeting Gln importer SLC1A5
Fig. 7 Inhibition of miR-137 enhances the ferroptosis activity in vivo. a Colony formation assay of the indicated A375 cell lines. Cells were treated with erastin (5 µM) for 24 h, and were grown without erastin for 14 days. For each cell line, all dishes were fixed, stained, and photographed at the same time. Data are mean ± SD from three independent experiments. **p < 0.01. b Quantitative RT-PCR showing the relative expression levels of SLC1A5 in indicated A375 cells in a. Data are mean ± SD from three independent experiments. **p < 0.01. c Colony formation assay of the indicated G-361 cell lines. Cells were treated with erastin (10 µM) for 24 h, and were grown without erastin for 14 days. For each cell line, all dishes were fixed, stained, and photographed at the same time. Data are mean ± SD from three independent experiments. **p < 0.01. d Quantitative RT-PCR showing the relative expression levels of SLC1A5 in indicated G-361 cells in c. Data are mean ± SD from three independent experiments. **p < 0.01. e, f Suppression of miR-137 enhances erastin-induced ferroptosis in vivo. C57BL/6 mice were injected subcutaneously with indicated A375 cells e or G-361 cells f (1 × 10⁶ cells per mouse) and treated with erastin (15 mg/kg intraperitoneally, twice every other day) when the tumor volume reached 50 mm3. Tumor volume was calculated every 4 days. Data represent mean ± SD (n = 5–6 mice per group). Significance was determined by one-sided Mann–Whitney U-test, *p < 0.05. g Schematic depicting miR-137-mediated ferroptosis in melanoma cells. miR-137 suppresses erastin-induced ferroptosis by directly targeting Gln importer SLC1A5CC BY-NC-SA · PubMed Central

Verification

Claims the paper makes

The claims and statistics of this paper haven’t been checked yet.

Run the check — free, no account needed. It reads the open-access text and checks the sources it cites.

A few free checks a day · papers already verified open instantly · results are public

Claims other papers make about this one

Each is checked against this paper’s own text: does it say what the citing paper says it does?

Self-check

Percentages, sums and reported differences re-computed from the paper’s own numbers.

The self-check needs the paper’s full text.

Citations

Cites

Research works printed but not linked: 37

  1. Galluzzi L, Vitale I, Abrams JM, Alnemri ES, Baehrecke EH, Blagosklonny MV, et al. Molecular definitions of cell death subroutines: recommendations of the Nomenclature Committee on Cell Death 2012. Cell Death Differ. 2012;19:107–20. · DOI · Paper page
  2. Blum ES, Abraham MC, Yoshimura S, Lu Y, Shaham S. Control of nonapoptotic developmental cell death in Caenorhabditis elegans by a polyglutamine-repeat protein. Science. 2012;335:970–3. · DOI
  3. Bergsbaken T, Fink SL, Cookson BT. Pyroptosis: host cell death and inflammation. Nat Rev Microbiol. 2009;7:99–109. · DOI
  4. Dixon SJ, Lemberg KM, Lamprecht MR, Skouta R, Zaitsev EM, Gleason CE, et al. Ferroptosis: an iron-dependent form of nonapoptotic cell death. Cell. 2012;149:1060–72. · DOI · Paper page
  5. Gao M, Monian P, Quadri N, Ramasamy R, Jiang X. Glutaminolysis and transferrin regulate ferroptosis. Mol Cell. 2015;59:298–308. · DOI · Paper page
  6. Dolma S, Lessnick SL, Hahn WC, Stockwell BR. Identification of genotype-selective antitumor agents using synthetic lethal chemical screening in engineered human tumor cells. Cancer Cell. 2003;3:285–96. · DOI · Paper page
  7. Yang WS, Stockwell BR. Ferroptosis: death by lipid peroxidation. Trends Cell Biol. 2016;26:165–76. · DOI · Paper page
  8. Zhu S, Zhang Q, Sun X, Zeh HJ, Lotze MT, Kang R, et al. HSPA5 regulates ferroptotic cell death in cancer cells. Cancer Res. 2017;77:2064–77. · DOI · Paper page
  9. Yuan H, Li X, Zhang X, Kang R, Tang D. CISD1 inhibits ferroptosis by protection against mitochondrial lipid peroxidation. Biochem Biophys Res Commun. 2016;478:838–44. · DOI
  10. Cao JY, Dixon SJ. Mechanisms of ferroptosis. Cell Mol Life Sci. 2016;73:2195–209. · DOI · Paper page
  11. Frankel LB, Lund AH. MicroRNA regulation of autophagy. Carcinogenesis. 2012;33:2018–25. · DOI
  12. Bartel DP. MicroRNAs: genomics, biogenesis, mechanism, and function. Cell. 2004;116:281–97. · DOI
  13. Wang Q, Bailey CG, Ng C, Tiffen J, Thoeng A, Minhas V, et al. Androgen receptor and nutrient signaling pathways coordinate the demand for increased amino acid transport during prostate cancer progression. Cancer Res. 2011;71:7525–36. · DOI
  14. Dixon SJ, Lemberg KM, Lamprecht MR, Skouta R, Zaitsev EM, Gleason CE, et al. Ferroptosis: an iron-dependent form of nonapoptotic cell death. Cell. 2012;149:1060–72. · DOI · Paper page
  15. DeBerardinis RJ, Lum JJ, Hatzivassiliou G, Thompson CB. The biology of cancer: metabolic reprogramming fuels cell growth and proliferation. Cell Metab. 2008;7:11–20. · DOI · Paper page
  16. Esslinger CS, Cybulski KA, Rhoderick JF. Ngamma-aryl glutamine analogues as probes of the ASCT2 neutral amino acid transporter binding site. Bioorg Med Chem. 2005;13:1111–8. · DOI
  17. Curthoys NP, Watford M. Regulation of glutaminase activity and glutamine metabolism. Annu Rev Nutr. 1995;15:133–59. · DOI
  18. Hensley CT, Wasti AT, DeBerardinis RJ. Glutamine and cancer: cell biology, physiology, and clinical opportunities. J Clin Invest. 2013;123:3678–84. · DOI · Paper page
  19. Agarwal V, Bell GW, Nam JW, Bartel DP. Predicting effective microRNA target sites in mammalian mRNAs. Elife. 2015;4:e05005. · DOI · Paper page
  20. John B, Enright AJ, Aravin A, Tuschl T, Sander C, Marks DS. Human microRNA targets. PLoS Biol. 2004;2:e363. · DOI · Paper page
  21. Griffiths-Jones S, Saini HK, van Dongen S, Enright AJ. miRBase: tools for microRNA genomics. Nucleic Acids Res. 2008;36(Database issue):D154–158.
  22. Gentner B, Schira G, Giustacchini A, Amendola M, Brown BD, Ponzoni M, et al. Stable knockdown of microRNA in vivo by lentiviral vectors. Nat Methods. 2009;6:63–66. · DOI
  23. Li X, Chen W, Zeng W, Wan C, Duan S, Jiang S. microRNA-137 promotes apoptosis in ovarian cancer cells via the regulation of XIAP. Br J Cancer. 2017;116:66–76. · DOI
  24. Chen R, Zhang Y, Zhang C, Wu H, Yang S. miR-137 inhibits the proliferation of human non-small cell lung cancer cells by targeting SRC3. Oncol Lett. 2017;13:3905–11. · DOI
  25. Duran RV, Oppliger W, Robitaille AM, Heiserich L, Skendaj R, Gottlieb E, et al. Glutaminolysis activates Rag-mTORC1 signaling. Mol Cell. 2012;47:349–58. · DOI
  26. Bian D, Shi W, Shao Y, Li P, Song G. Long non-coding RNA GAS5 inhibits tumorigenesis via miR-137 in melanoma. Am J Transl Res. 2017;9:1509–20.
  27. Li N. Low expression of Mir-137 predicts poor prognosis in cutaneous melanoma patients. Med Sci Monit. 2016;22:140–4. · DOI
  28. Ciafre SA, Galardi S, Mangiola A, Ferracin M, Liu CG, Sabatino G, et al. Extensive modulation of a set of microRNAs in primary glioblastoma. Biochem Biophys Res Commun. 2005;334:1351–8. · DOI · Paper page
  29. Balaguer F, Link A, Lozano JJ, Cuatrecasas M, Nagasaka T, Boland CR, et al. Epigenetic silencing of miR-137 is an early event in colorectal carcinogenesis. Cancer Res. 2010;70:6609–18. · DOI
  30. Wang Q, Beaumont KA, Otte NJ, Font J, Bailey CG, van Geldermalsen M, et al. Targeting glutamine transport to suppress melanoma cell growth. Int J Cancer. 2014;135:1060–71. · DOI
  31. Ren P, Yue M, Xiao D, Xiu R, Gan L, Liu H, et al. ATF4 and N-Myc coordinate glutamine metabolism in MYCN-amplified neuroblastoma cells through ASCT2 activation. J Pathol. 2015;235:90–100. · DOI
  32. Wang Q, Hardie RA, Hoy AJ, van Geldermalsen M, Gao D, Fazli L, et al. Targeting ASCT2-mediated glutamine uptake blocks prostate cancer growth and tumour development. J Pathol. 2015;236:278–89. · DOI · Paper page
  33. Qin Y, Zhang S, Deng S, An G, Qin X, Li F, et al. Epigenetic silencing of miR-137 induces drug resistance and chromosomal instability by targeting AURKA in multiple myeloma. Leukemia. 2017;31:1123–35. · DOI
  34. Shen H, Wang L, Ge X, Jiang CF, Shi ZM, Li DM, et al. MicroRNA-137 inhibits tumor growth and sensitizes chemosensitivity to paclitaxel and cisplatin in lung cancer. Oncotarget. 2016;7:20728–42. · DOI
  35. Guo Y, Pang Y, Gao X, Zhao M, Zhang X, Zhang H, et al. MicroRNA-137 chemosensitizes colon cancer cells to the chemotherapeutic drug oxaliplatin (OXA) by targeting YBX1. Cancer Biomark. 2017;18:1–9. · DOI
  36. Frankel LB, Wen J, Lees M, Hoyer-Hansen M, Farkas T, Krogh A, et al. microRNA-101 is a potent inhibitor of autophagy. EMBO J. 2011;30:4628–41. · DOI · Paper page
  37. Su H, Yang JR, Xu T, Huang J, Xu L, Yuan Y, et al. MicroRNA-101, down-regulated in hepatocellular carcinoma, promotes apoptosis and suppresses tumorigenicity. Cancer Res. 2009;69:1135–42. · DOI

Cited by

Sorted by citations

See all 408

Metadata

Authors
Luo, M., Wu, L., Zhang, K., Wang, H., Zhang, T., Gutierrez, L., O’Connell, D., Zhang, P., Li, Y., Gao, T., Ren, W., & Yang, Y.
Venue
Cell Death & Differentiation
Published
2018-01-18
Volume
25
Issue
8
Pages
1457-1472
ISSN
  • 1350-9047
  • 1476-5403
Cited by
408
References
17
Language
en

About these checks

Registry, retraction, Cites and statistics results are computed, not judged, with one exception: a printed reference that no index lists is read once by a model before it counts as a citation error. Claims are extracted by a model and kept only when their quote appears verbatim in the text; each cited source is then checked, with a model’s help, for whether it says what the claim relies on. Those verdicts can be wrong — read the claim’s quote and the cited source before relying on one.

Statistics and arithmetic are recomputed, not judged.

Confidence bands are shown only for fields calibrated on our annotated test set. None is calibrated yet, so no band is shown.

What counts as a claim ›How we measure confidence ›How we check this ›

Are you an author, or do you see a problem with this page? Request a review