

The DOI matches its Crossref record; 55 of the 55 references it cites were found in a registry or an index; 3 of the 39 sources its claims cite were checked for support.
In vivo partial reprogramming of myofibers promotes muscle regeneration by remodeling the stem cell niche
Open accessAbstract
Short-term, systemic expression of the Yamanaka reprogramming factors ( Oct-3/4 , Sox2 , Klf4 and c-Myc [OSKM]) has been shown to rejuvenate aging cells and promote tissue regeneration in vivo. However, the mechanisms by which OSKM promotes tissue regeneration are unknown. In this work, we focus on a specific tissue and demonstrate that local expression of OSKM, specifically in myofibers, induces the activation of muscle stem cells or satellite cells (SCs), which accelerates muscle regeneration in young mice. In contrast, expressing OSKM directly in SCs does not improve muscle regeneration. Mechanistically, expressing OSKM in myofibers regulates the expression of genes important for the SC microenvironment, including upregulation of p21, which in turn downregulates Wnt4 . This is critical because Wnt4 is secreted by myofibers to maintain SC quiescence. Thus, short-term induction of the Yamanaka factors in myofibers may promote tissue regeneration by modifying the stem cell niche.
Overview
AI snapshot
Written from the paper’s full text.
TL;DR
Myofiber-specific, short-term OSKM induction in mice activates satellite cells and accelerates muscle regeneration by inducing p21 and repressing the myofiber-secreted niche factor Wnt4; SC-specific OSKM induction does not improve regeneration. The effect is aging-independent and can be recapitulated by cyclic Wnt4 knockdown.
Key findings
- Myofiber-specific OSKM induction before injury accelerated regeneration: Cre+ muscles had more eMHC+ myofibers at day 3, more Pax7+ cells, larger regenerated myofibers, more Pax7+MyoD+ myoblasts, and higher hindlimb grip strength at day 6; OSKM induction after injury did not accelerate regeneration.
- OSKM in myofibers promoted SC activation/proliferation: Cre+ muscles had a 3-fold higher percentage of Pax7+BrdU+ cells; single Cre+ myofibers had 2-fold more Pax7+ cells and 3-fold more activated MyoD+ SCs, with quiescent MyoD− SCs decreased by half. Self-renewal was maintained after serial injuries.
- SC-specific OSKM induction did not activate/proliferate SCs or improve regeneration; in cultured myoblasts, OSKM inhibited MyoD and miR-133a.
- Mechanistically, Wnt4 was the only niche-related gene downregulated >2-fold; p21 was upregulated, p21 overexpression increased p21 60-fold and downregulated Wnt4 3-fold, ChIP showed 3-fold enrichment at the Wnt4 TATA-proximal region, and p21 inhibited a Wnt4 reporter 2-fold. Cyclic CasRx Wnt4 knockdown (gRNA1: 85% in vitro, 65% in vivo) recapitulated SC activation and regeneration. In 15-month-old mice, Cre+ muscles had 1.8-fold more Pax7+ cells, 2.8-fold more MyoD+ SCs, and 3-fold more BrdU+ SCs.
Methods
- Generated myofiber-specific Acta1-Cre/4Fhet and SC-specific Pax7creER/4Fhet inducible OSKM mouse models; used young (6 weeks–4 months) and aging (12–15 months) mice, both male and female. Doxycycline was given in drinking water (1 mg/ml), often cyclically (2 days on/5 days off), with cardiotoxin injury, BrdU labeling, and tamoxifen for Pax7creER induction.
- Readouts included RNA-seq of EDL/SOL muscles after 2.5 or 8.5 days Dox (DESeq2, WGCNA, GO/GSEA), qPCR, immunostaining/H&E, single myofiber isolation and culture, western blot, ChIP, luciferase assays, and AAV9-CasRx-mediated Wnt4 knockdown.
- Statistical analysis used two-tailed unpaired Student’s t-test with p<0.05; RNA-seq OSKM/niche comparisons used n=2 biological samples, while many histology experiments used n=4–6 mice.
Limitations
- Stated: the authors cannot exclude that other cell types (macrophages, endothelial cells, fibroblasts) or ECM/exosome-mediated indirect effects contribute to SC activation; two possible explanations for maintained SC self-renewal (homeostatic mechanism vs. temporary niche modification) were not distinguished.
- Stated: timing is important—post-injury OSKM did not accelerate regeneration—and systemic vs. myofiber-specific OSKM differ in induction level and p21 induction in SCs.
- Evident: findings are in mice only; key RNA-seq comparisons for OSKM/niche genes used n=2 biological samples; and although both male and female mice were used, sex-specific effects were not analyzed.
Model-written summary. Check it against the paper before relying on it.
Integrity signals
Registry
Cites
Statistics
Figures
Verification
Claims the paper makes
115 Own result · 35 Own interpretation · 24 Not checked yet · 4 No basis given · 2 Supported
Every source the paper cites for this claim was checked and supports it.
In the paper
“Besides amelioration of cellular aging hallmarks, reprogramming factors promote tissue regeneration in aged mice8,10.”
§ In vivo partial reprogramming of myofibers promotes muscle regeneration by remodeling the stem cell niche > Introduction
What the sources say
- Supportedcites [8] Ocampo, A. et al. In vivo amelioration of age-associated hallmarks by partial reprogramming. Cell 167, e1712 (2016). 1719-1733. source
The Discussion (p. 1730) states that short-term induction of the reprogramming factors OSKM improved regeneration of the pancreas and muscle after injury in physiologically aged mice. This directly supports the claim that reprogramming factors promote tissue regeneration in aged mice. (LLM, conf=0.94)
- Supportedcites [10] Lu, Y. et al. Reprogramming to recover youthful epigenetic information and restore vision. Nature 588, 124–129 (2020). source
The ‘OSK stimulates axon regeneration’ section reports robust axon regeneration after OSK treatment in 12-month-old mice. This supports the claim for regeneration in the eye’s nervous tissue of older mice. (LLM, conf=0.90)
plaindirect- Asserted: passes — The authors put it forward as true.
- Checkable: passes — It can be checked against evidence.
- Load-bearing: passes — The paper’s conclusions depend on it.
- Based: passes — The paper gives a reason why it holds.
- Supported
The paper states this without a source or data behind it here, so there is nothing to check it against. The quote shows it is in the paper.
In the paper
“Mechanistically, expressing OSKM in myofibers regulates the expression of genes important for the SC microenvironment, including upregulation of p21, which in turn downregulates Wnt4.”
§ In vivo partial reprogramming of myofibers promotes muscle regeneration by remodeling the stem cell niche > Abstract
plaindirect- Asserted: passes — The authors put it forward as true.
- Checkable: passes — It can be checked against evidence.
- Load-bearing: passes — The paper’s conclusions depend on it.
- Based: passes — The paper gives a reason why it holds.
A result the paper reports from its own data — it cites no other source for it, so there is none to check. The quote shows it is in the paper.
In the paper
“In contrast, expressing OSKM directly in SCs does not improve muscle regeneration.”
§ In vivo partial reprogramming of myofibers promotes muscle regeneration by remodeling the stem cell niche > Abstract
plain- Asserted: passes — The authors put it forward as true.
- Checkable: passes — It can be checked against evidence.
- Load-bearing: passes — The paper’s conclusions depend on it.
- Based: passes — The paper gives a reason why it holds.
A result the paper reports from its own data — it cites no other source for it, so there is none to check. The quote shows it is in the paper.
In the paper
“In this work, we focus on a specific tissue and demonstrate that local expression of OSKM, specifically in myofibers, induces the activation of muscle stem cells or satellite cells (SCs), which accelerates muscle regeneration in young mice.”
§ In vivo partial reprogramming of myofibers promotes muscle regeneration by remodeling the stem cell niche > Abstract
boosteddirect- Asserted: passes — The authors put it forward as true.
- Checkable: passes — It can be checked against evidence.
- Load-bearing: passes — The paper’s conclusions depend on it.
- Based: passes — The paper gives a reason why it holds.
A result the paper reports from its own data — it cites no other source for it, so there is none to check. The quote shows it is in the paper.
In the paper
“Mechanistically, expressing OSKM in myofibers regulates the expression of genes important for the SC microenvironment, including upregulation of p21, which in turn downregulates Wnt4.”
§ In vivo partial reprogramming of myofibers promotes muscle regeneration by remodeling the stem cell niche > Abstract
plaindirect- Asserted: passes — The authors put it forward as true.
- Checkable: passes — It can be checked against evidence.
- Load-bearing: passes — The paper’s conclusions depend on it.
- Based: passes — The paper gives a reason why it holds.
A result the paper reports from its own data — it cites no other source for it, so there is none to check. The quote shows it is in the paper.
In the paper
“In this work, we focus on a specific tissue and demonstrate that local expression of OSKM, specifically in myofibers, induces the activation of muscle stem cells or satellite cells (SCs), which accelerates muscle regeneration in young mice.”
§ In vivo partial reprogramming of myofibers promotes muscle regeneration by remodeling the stem cell niche > Abstract
boosteddirect- Asserted: passes — The authors put it forward as true.
- Checkable: passes — It can be checked against evidence.
- Load-bearing: passes — The paper’s conclusions depend on it.
- Based: passes — The paper gives a reason why it holds.
A result the paper reports from its own data — it cites no other source for it, so there is none to check. The quote shows it is in the paper.
In the paper
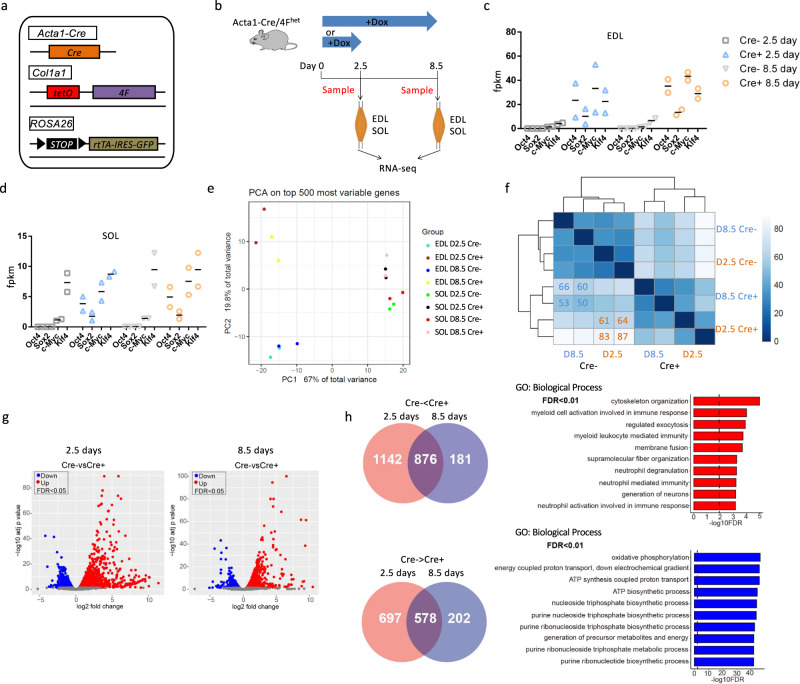
“Activated genes were enriched in pathways related to cytoskeleton organization (Supplementary Fig. 2b).”
§ In vivo partial reprogramming of myofibers promotes muscle regeneration by remodeling the stem cell niche > Results > RNA-seq analysis of myofiber-specific OSKM induction mice
plaincorrelational- Asserted: passes — The authors put it forward as true.
- Checkable: passes — It can be checked against evidence.
- Load-bearing: unclear — It is unclear whether the paper’s conclusions depend on it.
- Based: passes — The paper gives a reason why it holds.
A result the paper reports from its own data — it cites no other source for it, so there is none to check. The quote shows it is in the paper.
In the paper
“We first sought to confirm OSKM expression, and indeed measured higher levels of OSKM in Cre+ EDL muscles compared with Cre− EDL muscles (Fig. 1c).”
§ In vivo partial reprogramming of myofibers promotes muscle regeneration by remodeling the stem cell niche > Results > RNA-seq analysis of myofiber-specific OSKM induction mice
plaincorrelational- Asserted: passes — The authors put it forward as true.
- Checkable: passes — It can be checked against evidence.
- Load-bearing: passes — The paper’s conclusions depend on it.
- Based: passes — The paper gives a reason why it holds.
A result the paper reports from its own data — it cites no other source for it, so there is none to check. The quote shows it is in the paper.
In the paper
“As with the PCA analysis, the gene expression level induced or repressed by OSKM was more pronounced in EDL muscles than in SOL muscles (Supplementary Fig. 2a).”
§ In vivo partial reprogramming of myofibers promotes muscle regeneration by remodeling the stem cell niche > Results > RNA-seq analysis of myofiber-specific OSKM induction mice
plaincorrelational- Asserted: passes — The authors put it forward as true.
- Checkable: passes — It can be checked against evidence.
- Load-bearing: passes — The paper’s conclusions depend on it.
- Based: passes — The paper gives a reason why it holds.
A result the paper reports from its own data — it cites no other source for it, so there is none to check. The quote shows it is in the paper.
In the paper
“In addition, the expression of Oct4, Sox2, and c-Myc was 4-fold higher in Cre+ EDL muscles compared with Cre+ SOL muscles (baseline expression of these genes was comparable between Cre− EDL and Cre− SOL muscles) (Fig. 1c, d).”
§ In vivo partial reprogramming of myofibers promotes muscle regeneration by remodeling the stem cell niche > Results > RNA-seq analysis of myofiber-specific OSKM induction mice
plaincorrelational- Asserted: passes — The authors put it forward as true.
- Checkable: passes — It can be checked against evidence.
- Load-bearing: unclear — It is unclear whether the paper’s conclusions depend on it.
- Based: passes — The paper gives a reason why it holds.
- Probably not a substantial claim. 16
- It may state two separate claims as one. 35
- The quote only partly states this claim. 2
Every source the paper cites for this claim was checked and supports it.
In the paper
“Reprogramming factors have been shown to promote axon regeneration through intrinsic rejuvenation of retinal ganglion cells10.”
§ In vivo partial reprogramming of myofibers promotes muscle regeneration by remodeling the stem cell niche > Discussion
What the sources say
- Supportedcites [10] Lu, Y. et al. Reprogramming to recover youthful epigenetic information and restore vision. Nature 588, 124–129 (2020). source
In “OSK stimulates axon regeneration” (page not provided), the paper reports that expressing Oct4, Sox2 and Klf4 in retinal ganglion cells promotes axon regeneration, while expression in amacrine cells does not. “Regeneration requires DNA demethylation” (page not provided) links this effect to reprogramming within the ganglion cells, supporting the paraphrase of intrinsic rejuvenation. (LLM, conf=0.92)
plaindirect- Asserted: passes — The authors put it forward as true.
- Checkable: passes — It can be checked against evidence.
- Load-bearing: fails — The paper’s conclusions may not depend on it.
- Based: passes — The paper gives a reason why it holds.
Probably not a substantial claim. The paper’s conclusions may not depend on it.
- Supported
A result the paper reports from its own data — it cites no other source for it, so there is none to check. The quote shows it is in the paper.
In the paper
“Principal component analysis (PCA) of the RNA-seq data revealed a clear separation between Cre+ and Cre− samples, and the separation distance was wider in EDL muscles than in SOL muscles (Fig. 1e), consistent with the levels of OSKM induction.”
§ In vivo partial reprogramming of myofibers promotes muscle regeneration by remodeling the stem cell niche > Results > RNA-seq analysis of myofiber-specific OSKM induction mice
boostedcorrelational- Asserted: passes — The authors put it forward as true.
- Checkable: passes — It can be checked against evidence.
- Load-bearing: passes — The paper’s conclusions depend on it.
- Based: passes — The paper gives a reason why it holds.
It may state two separate claims as one.
A result the paper reports from its own data — it cites no other source for it, so there is none to check. The quote shows it is in the paper.
In the paper
“In SOL muscles, however, Oct4, Sox2, and c-Myc were induced, but the expression of Klf4 was similar between Cre+ and Cre− SOL muscles (Fig. 1d).”
§ In vivo partial reprogramming of myofibers promotes muscle regeneration by remodeling the stem cell niche > Results > RNA-seq analysis of myofiber-specific OSKM induction mice
plain- Asserted: passes — The authors put it forward as true.
- Checkable: passes — It can be checked against evidence.
- Load-bearing: unclear — It is unclear whether the paper’s conclusions depend on it.
- Based: passes — The paper gives a reason why it holds.
It may state two separate claims as one.
A result the paper reports from its own data — it cites no other source for it, so there is none to check. The quote shows it is in the paper.
In the paper
“Furthermore, DE genes resulting from 2.5 or 8.5 days of treatment had similar distribution patterns when visualized using volcano plots (Fig. 1g).”
§ In vivo partial reprogramming of myofibers promotes muscle regeneration by remodeling the stem cell niche > Results > RNA-seq analysis of myofiber-specific OSKM induction mice
plain- Asserted: passes — The authors put it forward as true.
- Checkable: passes — It can be checked against evidence.
- Load-bearing: fails — The paper’s conclusions may not depend on it.
- Based: passes — The paper gives a reason why it holds.
Probably not a substantial claim. The paper’s conclusions may not depend on it.
A result the paper reports from its own data — it cites no other source for it, so there is none to check. The quote shows it is in the paper.
In the paper
“Eleven modules were identified, but only three were enriched for GO terms associated with biological processes (Supplementary Fig. 2a, b).”
§ In vivo partial reprogramming of myofibers promotes muscle regeneration by remodeling the stem cell niche > Results > RNA-seq analysis of myofiber-specific OSKM induction mice
plain- Asserted: passes — The authors put it forward as true.
- Checkable: passes — It can be checked against evidence.
- Load-bearing: fails — The paper’s conclusions may not depend on it.
- Based: passes — The paper gives a reason why it holds.
Probably not a substantial claim. The paper’s conclusions may not depend on it. It may state two separate claims as one.
A result the paper reports from its own data — it cites no other source for it, so there is none to check. The quote shows it is in the paper.
In the paper
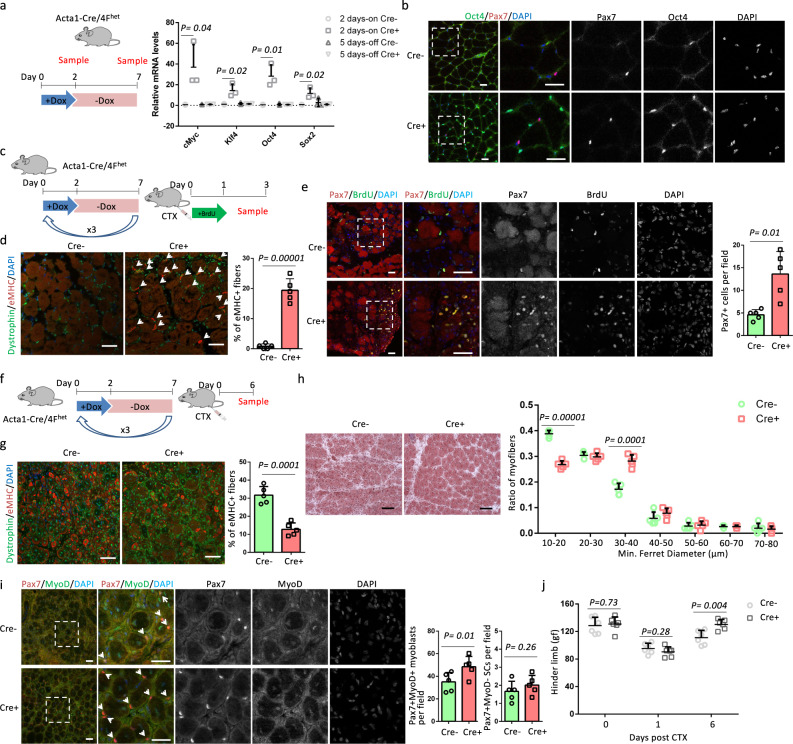
“In addition, Cre+ samples had more Pax7+ cells than Cre− samples (Fig. 2e).”
§ In vivo partial reprogramming of myofibers promotes muscle regeneration by remodeling the stem cell niche > Results > OSKM induction in myofibers accelerates muscle regeneration
plaincorrelational- Asserted: passes — The authors put it forward as true.
- Checkable: passes — It can be checked against evidence.
- Load-bearing: passes — The paper’s conclusions depend on it.
- Based: passes — The paper gives a reason why it holds.
The quote only partly states this claim.
A result the paper reports from its own data — it cites no other source for it, so there is none to check. The quote shows it is in the paper.
In the paper
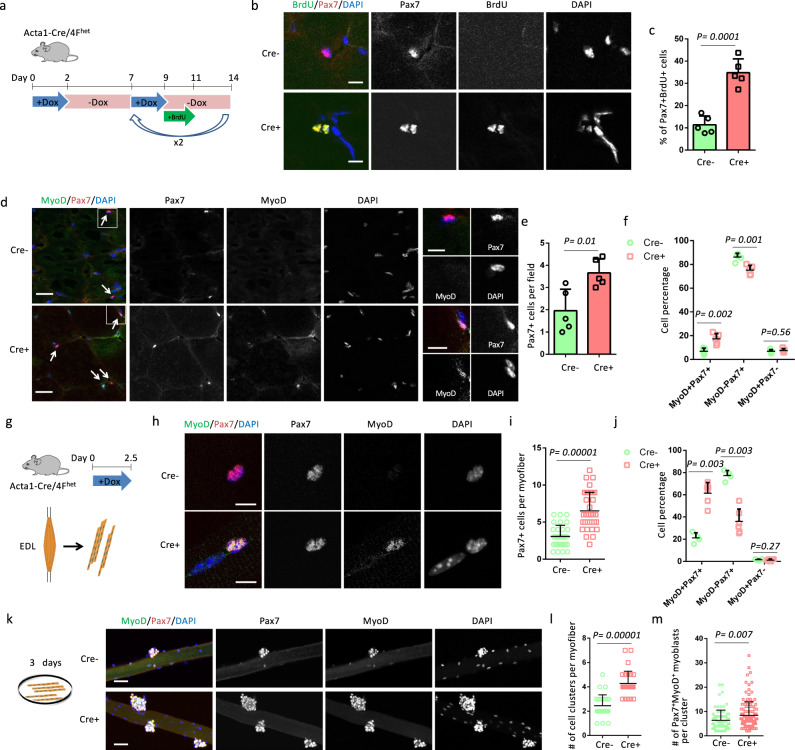
“Co-staining for Pax7 and MyoD showed that Cre+ muscles had a higher percentage of activated (MyoD+) SCs and a lower percentage of quiescent (MyoD−) SCs than Cre− muscles (Fig. 3d, f).”
§ In vivo partial reprogramming of myofibers promotes muscle regeneration by remodeling the stem cell niche > Results > OSKM induction in myofibers promotes SC proliferation
plaincorrelational- Asserted: passes — The authors put it forward as true.
- Checkable: passes — It can be checked against evidence.
- Load-bearing: passes — The paper’s conclusions depend on it.
- Based: passes — The paper gives a reason why it holds.
It may state two separate claims as one.
A result the paper reports from its own data — it cites no other source for it, so there is none to check. The quote shows it is in the paper.
In the paper
“H&E staining did not reveal any morphological differences between Cre+ and Cre− muscle sections and the myofibers in Cre− and Cre+ muscles lacked central nuclei (Supplementary Fig. 5a).”
§ In vivo partial reprogramming of myofibers promotes muscle regeneration by remodeling the stem cell niche > Results > OSKM induction in myofibers promotes SC proliferation
plain- Asserted: passes — The authors put it forward as true.
- Checkable: passes — It can be checked against evidence.
- Load-bearing: unclear — It is unclear whether the paper’s conclusions depend on it.
- Based: passes — The paper gives a reason why it holds.
It may state two separate claims as one.
A result the paper reports from its own data — it cites no other source for it, so there is none to check. The quote shows it is in the paper.
In the paper
“The GO biological process term most enriched in these upregulated genes was related to cytoskeleton organization, whereas downregulated genes were related to oxidative phosphorylation (Fig. 1h).”
§ In vivo partial reprogramming of myofibers promotes muscle regeneration by remodeling the stem cell niche > Results > RNA-seq analysis of myofiber-specific OSKM induction mice
plaincorrelational- Asserted: passes — The authors put it forward as true.
- Checkable: passes — It can be checked against evidence.
- Load-bearing: unclear — It is unclear whether the paper’s conclusions depend on it.
- Based: passes — The paper gives a reason why it holds.
It may state two separate claims as one.
A result the paper reports from its own data — it cites no other source for it, so there is none to check. The quote shows it is in the paper.
In the paper
“OSKM expression was induced in the TA muscle following 2 days of Dox treatment, with OSKM levels returning back to control levels following 5 days of withdrawal (Fig. 2a).”
§ In vivo partial reprogramming of myofibers promotes muscle regeneration by remodeling the stem cell niche > Results > OSKM induction in myofibers accelerates muscle regeneration
plaindirect- Asserted: passes — The authors put it forward as true.
- Checkable: passes — It can be checked against evidence.
- Load-bearing: passes — The paper’s conclusions depend on it.
- Based: passes — The paper gives a reason why it holds.
It may state two separate claims as one.
A result the paper reports from its own data — it cites no other source for it, so there is none to check. The quote shows it is in the paper.
In the paper
“These 202 downregulated genes were enriched in GO biological process terms related to cellular response to stimulus (Supplementary Fig. 3b), whereas the 181 upregulated genes were not enriched for a specific GO biological process term.”
§ In vivo partial reprogramming of myofibers promotes muscle regeneration by remodeling the stem cell niche > Results > RNA-seq analysis of myofiber-specific OSKM induction mice
plain- Asserted: passes — The authors put it forward as true.
- Checkable: passes — It can be checked against evidence.
- Load-bearing: fails — The paper’s conclusions may not depend on it.
- Based: passes — The paper gives a reason why it holds.
Probably not a substantial claim. The paper’s conclusions may not depend on it. It may state two separate claims as one.
A result the paper reports from its own data — it cites no other source for it, so there is none to check. The quote shows it is in the paper.
In the paper
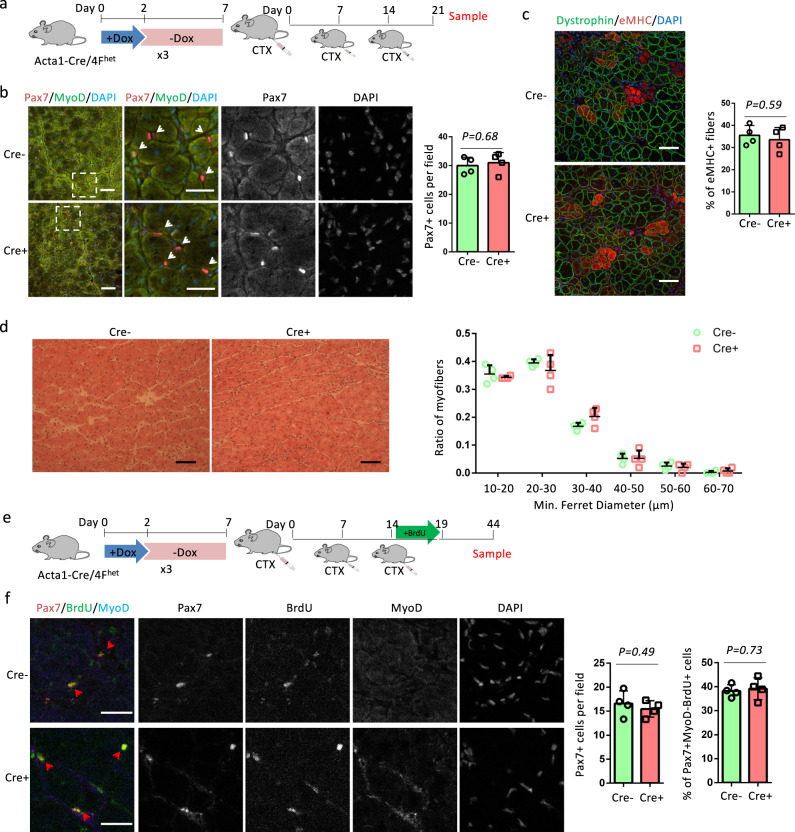
“Consistently, regenerated myofibers in Cre+ muscles were larger than those observed in Cre− muscles, with more myofibers that were 30–40 µm and fewer that were 10–20 µm in diameter (Fig. 2h).”
§ In vivo partial reprogramming of myofibers promotes muscle regeneration by remodeling the stem cell niche > Results > OSKM induction in myofibers accelerates muscle regeneration
plaincorrelational- Asserted: passes — The authors put it forward as true.
- Checkable: passes — It can be checked against evidence.
- Load-bearing: passes — The paper’s conclusions depend on it.
- Based: passes — The paper gives a reason why it holds.
It may state two separate claims as one.
A result the paper reports from its own data — it cites no other source for it, so there is none to check. The quote shows it is in the paper.
In the paper
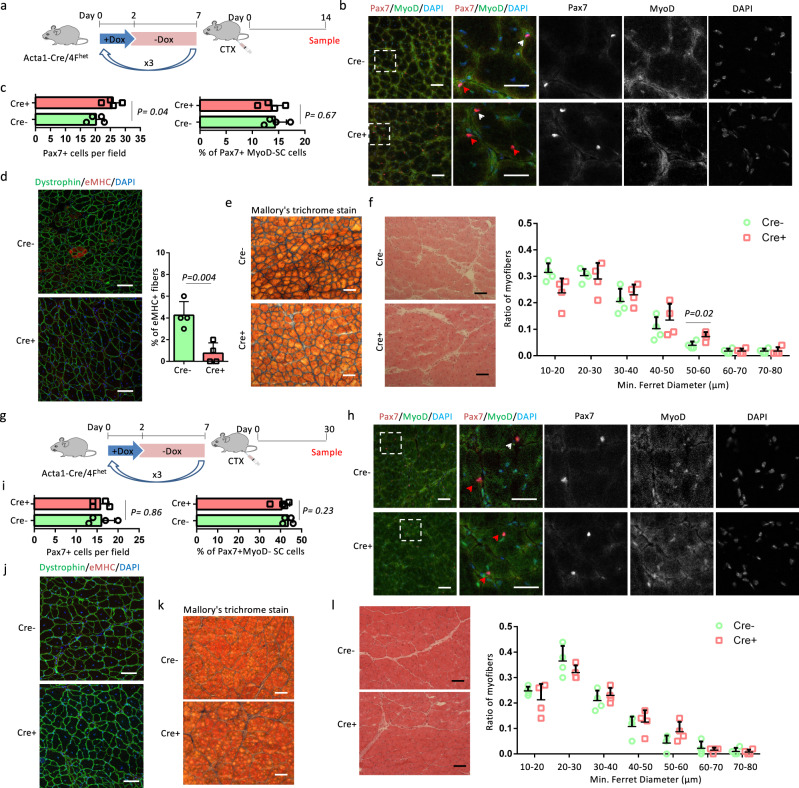
“At 30 days post-injury, the number of Pax7+ cells and the percentage of Pax7+MyoD− SCs were comparable between Cre+ and Cre− muscles (Fig. 4h, i).”
§ In vivo partial reprogramming of myofibers promotes muscle regeneration by remodeling the stem cell niche > Results > OSKM induction in myofibers does not change SC self-renewal
plain- Asserted: passes — The authors put it forward as true.
- Checkable: passes — It can be checked against evidence.
- Load-bearing: passes — The paper’s conclusions depend on it.
- Based: passes — The paper gives a reason why it holds.
It may state two separate claims as one.
A result the paper reports from its own data — it cites no other source for it, so there is none to check. The quote shows it is in the paper.
In the paper
“Muscle structure was restored and there were no eMHC+ myofibers in Cre+ and Cre− muscles (Fig. 4j).”
§ In vivo partial reprogramming of myofibers promotes muscle regeneration by remodeling the stem cell niche > Results > OSKM induction in myofibers does not change SC self-renewal
plain- Asserted: passes — The authors put it forward as true.
- Checkable: passes — It can be checked against evidence.
- Load-bearing: unclear — It is unclear whether the paper’s conclusions depend on it.
- Based: passes — The paper gives a reason why it holds.
It may state two separate claims as one.
A result the paper reports from its own data — it cites no other source for it, so there is none to check. The quote shows it is in the paper.
In the paper
“Fibrosis was similarly low in Cre+ and Cre− muscles (Fig. 4k), and myofiber sizes were comparable between Cre+ and Cre− muscles (Fig. 4l).”
§ In vivo partial reprogramming of myofibers promotes muscle regeneration by remodeling the stem cell niche > Results > OSKM induction in myofibers does not change SC self-renewal
plain- Asserted: passes — The authors put it forward as true.
- Checkable: passes — It can be checked against evidence.
- Load-bearing: unclear — It is unclear whether the paper’s conclusions depend on it.
- Based: passes — The paper gives a reason why it holds.
The quote only partly states this claim.
A result the paper reports from its own data — it cites no other source for it, so there is none to check. The quote shows it is in the paper.
In the paper
“The percentage of eMHC+ regenerating myofibers and myofiber sizes were comparable between Cre+ and Cre− muscles (Fig. 5c, d).”
§ In vivo partial reprogramming of myofibers promotes muscle regeneration by remodeling the stem cell niche > Results > OSKM induction in myofibers does not change SC self-renewal
plain- Asserted: passes — The authors put it forward as true.
- Checkable: passes — It can be checked against evidence.
- Load-bearing: passes — The paper’s conclusions depend on it.
- Based: passes — The paper gives a reason why it holds.
It may state two separate claims as one.
A result the paper reports from its own data — it cites no other source for it, so there is none to check. The quote shows it is in the paper.
In the paper
“In addition, regenerated myofibers in Cre+ muscles were larger than those observed in Cre− muscle, with more myofibers that were 50–60 µm in diameter (Fig. 4f).”
§ In vivo partial reprogramming of myofibers promotes muscle regeneration by remodeling the stem cell niche > Results > OSKM induction in myofibers does not change SC self-renewal
plaincorrelational- Asserted: passes — The authors put it forward as true.
- Checkable: passes — It can be checked against evidence.
- Load-bearing: passes — The paper’s conclusions depend on it.
- Based: passes — The paper gives a reason why it holds.
It may state two separate claims as one.
A result the paper reports from its own data — it cites no other source for it, so there is none to check. The quote shows it is in the paper.
In the paper
“Conversely, the percentage of quiescent (MyoD−) SCs was decreased by half in Cre+ myofibers compared to Cre− myofibers, and there was no difference in the percentage of MyoD+Pax7− cells (Fig. 3h, j).”
§ In vivo partial reprogramming of myofibers promotes muscle regeneration by remodeling the stem cell niche > Results > OSKM induction in myofibers promotes SC proliferation
plain- Asserted: passes — The authors put it forward as true.
- Checkable: passes — It can be checked against evidence.
- Load-bearing: passes — The paper’s conclusions depend on it.
- Based: passes — The paper gives a reason why it holds.
It may state two separate claims as one.
A result the paper reports from its own data — it cites no other source for it, so there is none to check. The quote shows it is in the paper.
In the paper
“In addition, p21 was induced in the SCs of systemic 4F muscles but not in the SCs of Acta-Cre/4Fhet mice (Supplementary Fig. 9 g).”
§ In vivo partial reprogramming of myofibers promotes muscle regeneration by remodeling the stem cell niche > Results > OSKM induction promotes proliferation of SCs in aging mice
plain- Asserted: passes — The authors put it forward as true.
- Checkable: passes — It can be checked against evidence.
- Load-bearing: passes — The paper’s conclusions depend on it.
- Based: passes — The paper gives a reason why it holds.
It may state two separate claims as one.
A result the paper reports from its own data — it cites no other source for it, so there is none to check. The quote shows it is in the paper.
In the paper
“Cre+ muscles had 1.8-fold more Pax7+ cells and 2.8-fold more activated (MyoD+) SCs than Cre− muscles (Supplementary Fig. 8b-d).”
§ In vivo partial reprogramming of myofibers promotes muscle regeneration by remodeling the stem cell niche > Results > OSKM induction promotes proliferation of SCs in aging mice
plaincorrelational- Asserted: passes — The authors put it forward as true.
- Checkable: passes — It can be checked against evidence.
- Load-bearing: passes — The paper’s conclusions depend on it.
- Based: passes — The paper gives a reason why it holds.
It may state two separate claims as one.
A result the paper reports from its own data — it cites no other source for it, so there is none to check. The quote shows it is in the paper.
In the paper
“Moreover, myofibers in Cre+ muscles were larger than those observed in Cre− muscle, with more myofibers that were 30–40 µm and fewer myofibers that were 10–20 µm in diameter (Supplementary Fig. 8 l).”
§ In vivo partial reprogramming of myofibers promotes muscle regeneration by remodeling the stem cell niche > Results > OSKM induction promotes proliferation of SCs in aging mice
plaincorrelational- Asserted: passes — The authors put it forward as true.
- Checkable: passes — It can be checked against evidence.
- Load-bearing: unclear — It is unclear whether the paper’s conclusions depend on it.
- Based: passes — The paper gives a reason why it holds.
It may state two separate claims as one.
A result the paper reports from its own data — it cites no other source for it, so there is none to check. The quote shows it is in the paper.
In the paper
“The number of Pax7+ cells, as well as the percentages of MyoD+ and BrdU+ SCs were all comparable between Cre+ and Cre− muscles (Supplementary Fig. 6e–g), indicating that SC-specific OSKM induction did not lead to the activation and proliferation of SCs.”
§ In vivo partial reprogramming of myofibers promotes muscle regeneration by remodeling the stem cell niche > Results > OSKM induction in SCs does not change muscle regeneration
plain- Asserted: passes — The authors put it forward as true.
- Checkable: passes — It can be checked against evidence.
- Load-bearing: passes — The paper’s conclusions depend on it.
- Based: passes — The paper gives a reason why it holds.
It may state two separate claims as one.
A result the paper reports from its own data — it cites no other source for it, so there is none to check. The quote shows it is in the paper.
In the paper
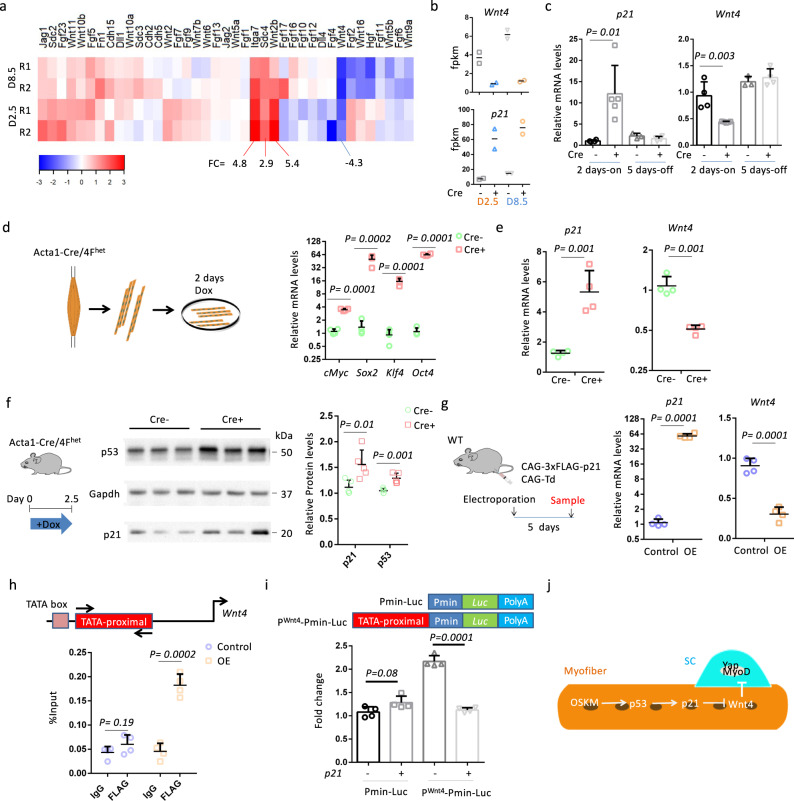
“Expression of four of these genes (Itga7, Sdc4, Wnt2b, and Wnt4) was altered on average over two-fold, and among these, Wnt4 was the only one that was downregulated (Fig. 6a).”
§ In vivo partial reprogramming of myofibers promotes muscle regeneration by remodeling the stem cell niche > Results > OSKM in myofibers inhibits Wnt4 expression through p21
plain- Asserted: passes — The authors put it forward as true.
- Checkable: passes — It can be checked against evidence.
- Load-bearing: passes — The paper’s conclusions depend on it.
- Based: passes — The paper gives a reason why it holds.
It may state two separate claims as one.
A result the paper reports from its own data — it cites no other source for it, so there is none to check. The quote shows it is in the paper.
In the paper
“Electroporation of the CAG-3xFLAG-p21 plasmid increased p21 expression 60-fold, and downregulated Wnt4 levels 3-fold, compared with the control plasmid (CAG-Td) (Fig. 6g).”
§ In vivo partial reprogramming of myofibers promotes muscle regeneration by remodeling the stem cell niche > Results > OSKM in myofibers inhibits Wnt4 expression through p21
plaindirect- Asserted: passes — The authors put it forward as true.
- Checkable: passes — It can be checked against evidence.
- Load-bearing: passes — The paper’s conclusions depend on it.
- Based: passes — The paper gives a reason why it holds.
It may state two separate claims as one.
A result the paper reports from its own data — it cites no other source for it, so there is none to check. The quote shows it is in the paper.
In the paper
“The expression of p21 and Wnt4 were significantly upregulated and downregulated, respectively, in Cre+ myofibers compared to Cre− myofibers (Fig. 6e).”
§ In vivo partial reprogramming of myofibers promotes muscle regeneration by remodeling the stem cell niche > Results > OSKM in myofibers inhibits Wnt4 expression through p21
plaincorrelational- Asserted: passes — The authors put it forward as true.
- Checkable: passes — It can be checked against evidence.
- Load-bearing: passes — The paper’s conclusions depend on it.
- Based: passes — The paper gives a reason why it holds.
It may state two separate claims as one.
A result the paper reports from its own data — it cites no other source for it, so there is none to check. The quote shows it is in the paper.
In the paper
“Levels of p21 and Wnt4 expression were upregulated and downregulated in Cre+ muscles, respectively, following Dox treatment, and returned to control levels (i.e., levels seen in Cre− samples) following Dox withdrawal (Fig. 6c).”
§ In vivo partial reprogramming of myofibers promotes muscle regeneration by remodeling the stem cell niche > Results > OSKM in myofibers inhibits Wnt4 expression through p21
plain- Asserted: passes — The authors put it forward as true.
- Checkable: passes — It can be checked against evidence.
- Load-bearing: passes — The paper’s conclusions depend on it.
- Based: passes — The paper gives a reason why it holds.
It may state two separate claims as one.
A result the paper reports from its own data — it cites no other source for it, so there is none to check. The quote shows it is in the paper.
In the paper
“Both myofiber-specific and systemic OSKM induction increased the activation of SCs.”
§ In vivo partial reprogramming of myofibers promotes muscle regeneration by remodeling the stem cell niche > Discussion
plaindirect- Asserted: passes — The authors put it forward as true.
- Checkable: passes — It can be checked against evidence.
- Load-bearing: passes — The paper’s conclusions depend on it.
- Based: passes — The paper gives a reason why it holds.
It may state two separate claims as one.
In the paper
“Our lab showed that partial reprogramming by short-term expression of reprogramming factors ameliorated aging hallmarks without tumor formation8, opening a possible application of this approach in vivo.”
§ In vivo partial reprogramming of myofibers promotes muscle regeneration by remodeling the stem cell niche > Introduction
What the sources say
- Not checked yetcites [8] Ocampo, A. et al. In vivo amelioration of age-associated hallmarks by partial reprogramming. Cell 167, e1712 (2016). 1719-1733. source
plaindirect- Asserted: passes — The authors put it forward as true.
- Checkable: passes — It can be checked against evidence.
- Load-bearing: passes — The paper’s conclusions depend on it.
- Based: passes — The paper gives a reason why it holds.
It may state two separate claims as one.
None of the sources cited for this claim have been checked yet.
In the paper
“The regenerative capacity of SCs is influenced by both intrinsic modulators and the extrinsic microenvironment13–15.”
§ In vivo partial reprogramming of myofibers promotes muscle regeneration by remodeling the stem cell niche > Introduction
What the sources say
- Not checked yetcites [13] Blau, H. M., Cosgrove, B. D. & Ho, A. T. The central role of muscle stem cells in regenerative failure with aging. Nat. Med. 21, 854–862 (2015). source
- Not checked yetcites [14] Sousa-Victor, P. et al. Geriatric muscle stem cells switch reversible quiescence into senescence. Nature 506, 316–321 (2014). source
- Not checked yetcites [15] Brack, A. S. & Munoz-Canoves, P. The ins and outs of muscle stem cell aging. Skelet. Muscle 6, 1 (2016). source
plaincorrelational- Asserted: passes — The authors put it forward as true.
- Checkable: passes — It can be checked against evidence.
- Load-bearing: passes — The paper’s conclusions depend on it.
- Based: passes — The paper gives a reason why it holds.
Probably not a substantial claim.
A conclusion the paper draws from its own results — it cites no other source for it, so there is none to check. The quote shows it is in the paper.
In the paper
“These results suggest that fast-twitch muscles are a more appropriate model for evaluating the effects of OSKM on muscle regenerative capacity.”
§ In vivo partial reprogramming of myofibers promotes muscle regeneration by remodeling the stem cell niche > Results > RNA-seq analysis of myofiber-specific OSKM induction mice
hedgedcorrelational- Asserted: passes — The authors put it forward as true.
- Checkable: passes — It can be checked against evidence.
- Load-bearing: fails — The paper’s conclusions may not depend on it.
- Based: passes — The paper gives a reason why it holds.
Probably not a substantial claim. The paper’s conclusions may not depend on it.
In the paper
“Muscle regeneration is primarily mediated by muscle stem cells or satellite cells (SCs), which reside in a characteristic niche located between the basal lamina and plasma membrane of myofibers12.”
§ In vivo partial reprogramming of myofibers promotes muscle regeneration by remodeling the stem cell niche > Introduction
What the sources say
- Not checked yetcites [12] Mauro, A. Satellite cell of skeletal muscle fibers. J. Biophys. Biochem. Cytol. 9, 493 (1961). source
plaindirect- Asserted: passes — The authors put it forward as true.
- Checkable: passes — It can be checked against evidence.
- Load-bearing: passes — The paper’s conclusions depend on it.
- Based: passes — The paper gives a reason why it holds.
Probably not a substantial claim.
A conclusion the paper draws from its own results — it cites no other source for it, so there is none to check. The quote shows it is in the paper.
In the paper
“We conclude that partial reprogramming via OSKM can remodel the SC niche to induce SC activation and proliferation and accelerate muscle regeneration.”
§ In vivo partial reprogramming of myofibers promotes muscle regeneration by remodeling the stem cell niche > Introduction
plaindirect- Asserted: passes — The authors put it forward as true.
- Checkable: passes — It can be checked against evidence.
- Load-bearing: passes — The paper’s conclusions depend on it.
- Based: passes — The paper gives a reason why it holds.
It may state two separate claims as one.
A conclusion the paper draws from its own results — it cites no other source for it, so there is none to check. The quote shows it is in the paper.
In the paper
“In contrast, the number of Pax7+MyoD− SCs was comparable in Cre− and Cre+ samples (Fig. 2i), indicating Cre+ samples had an expansion of myoblasts without changing the SCs number.”
§ In vivo partial reprogramming of myofibers promotes muscle regeneration by remodeling the stem cell niche > Results > OSKM induction in myofibers accelerates muscle regeneration
hedgeddirect- Asserted: passes — The authors put it forward as true.
- Checkable: passes — It can be checked against evidence.
- Load-bearing: passes — The paper’s conclusions depend on it.
- Based: passes — The paper gives a reason why it holds.
It may state two separate claims as one.
A conclusion the paper draws from its own results — it cites no other source for it, so there is none to check. The quote shows it is in the paper.
In the paper
“Together, these results suggest that partial reprogramming of myofibers induced the activation and proliferation of SCs.”
§ In vivo partial reprogramming of myofibers promotes muscle regeneration by remodeling the stem cell niche > Results > OSKM induction in myofibers promotes SC proliferation
hedgeddirect- Asserted: passes — The authors put it forward as true.
- Checkable: passes — It can be checked against evidence.
- Load-bearing: passes — The paper’s conclusions depend on it.
- Based: passes — The paper gives a reason why it holds.
It may state two separate claims as one.
A conclusion the paper draws from its own results — it cites no other source for it, so there is none to check. The quote shows it is in the paper.
In the paper
“Collectively, these results prove that partial reprogramming of myofibers induced the activation and proliferation of SCs and the expansion of myoblasts.”
§ In vivo partial reprogramming of myofibers promotes muscle regeneration by remodeling the stem cell niche > Results > OSKM induction in myofibers promotes SC proliferation
boosteddirect- Asserted: passes — The authors put it forward as true.
- Checkable: passes — It can be checked against evidence.
- Load-bearing: passes — The paper’s conclusions depend on it.
- Based: passes — The paper gives a reason why it holds.
It may state two separate claims as one.
In the paper
“OSKM inhibited the expression of MyoD and miR-133a (Supplementary Fig. 7b), which is consistent with the finding that Oct4 represses the expression of MyoD18.”
§ In vivo partial reprogramming of myofibers promotes muscle regeneration by remodeling the stem cell niche > Results > OSKM induction in SCs does not change muscle regeneration
What the sources say
- Not checked yetcites [18] Watanabe, S. et al. MyoD gene suppression by Oct4 is required for reprogramming in myoblasts to produce induced pluripotent stem cells. Stem Cells 29, 505–516 (2011). source
plaindirect- Asserted: passes — The authors put it forward as true.
- Checkable: passes — It can be checked against evidence.
- Load-bearing: fails — The paper’s conclusions may not depend on it.
- Based: passes — The paper gives a reason why it holds.
Probably not a substantial claim. The paper’s conclusions may not depend on it.
A conclusion the paper draws from its own results — it cites no other source for it, so there is none to check. The quote shows it is in the paper.
In the paper
“Together, these results indicate that myofiber-specific OSKM induction promotes SC activation and proliferation and accelerates muscle regeneration independent of aging.”
§ In vivo partial reprogramming of myofibers promotes muscle regeneration by remodeling the stem cell niche > Results > OSKM induction promotes proliferation of SCs in aging mice
hedgeddirect- Asserted: passes — The authors put it forward as true.
- Checkable: passes — It can be checked against evidence.
- Load-bearing: passes — The paper’s conclusions depend on it.
- Based: passes — The paper gives a reason why it holds.
It may state two separate claims as one.
In the paper
“In mouse keratinocytes, p21 inhibits Wnt4 expression by binding to the TATA-proximal region of the Wnt4 promoter in association with E2F transcription factor 1 (E2F-1)24, and levels of p21 expression were negatively correlated with Wnt4 expression in our RNA-seq analysis (Fig. 6b).”
§ In vivo partial reprogramming of myofibers promotes muscle regeneration by remodeling the stem cell niche > Results > OSKM in myofibers inhibits Wnt4 expression through p21
What the sources say
- Not checked yetcites [24] Devgan, V., Mammucari, C., Millar, S. E., Brisken, C. & Dotto, G. P. p21WAF1/Cip1 is a negative transcriptional regulator of Wnt4 expression downstream of Notch1 activation. Genes Dev. 19, 1485–1495 (2005). source
plaindirect- Asserted: passes — The authors put it forward as true.
- Checkable: passes — It can be checked against evidence.
- Load-bearing: passes — The paper’s conclusions depend on it.
- Based: passes — The paper gives a reason why it holds.
Probably not a substantial claim.
In the paper
“Integrin subunit alpha 7 (Itga7) is a laminin-binding protein that connects myofibers to the basal lamina to maintain sarcolemma integrity20.”
§ In vivo partial reprogramming of myofibers promotes muscle regeneration by remodeling the stem cell niche > Results > OSKM in myofibers inhibits Wnt4 expression through p21
What the sources say
- Not checked yetcites [20] Mayer, U. et al. Absence of integrin alpha 7 causes a novel form of muscular dystrophy. Nat. Genet. 17, 318–323 (1997). source
plaindirect- Asserted: passes — The authors put it forward as true.
- Checkable: passes — It can be checked against evidence.
- Load-bearing: fails — The paper’s conclusions may not depend on it.
- Based: passes — The paper gives a reason why it holds.
Probably not a substantial claim. The paper’s conclusions may not depend on it.
In the paper
“Loss of Wnt4 in myofibers induces the activation of SCs and accelerates muscle regeneration23.”
§ In vivo partial reprogramming of myofibers promotes muscle regeneration by remodeling the stem cell niche > Results > OSKM in myofibers inhibits Wnt4 expression through p21
What the sources say
- Not checked yetcites [23] Eliazer, S. et al. Wnt4 from the niche controls the mechano-properties and quiescent state of muscle stem cells. Cell Stem Cell 25, 654–665.e4 (2019). source
plaindirect- Asserted: passes — The authors put it forward as true.
- Checkable: passes — It can be checked against evidence.
- Load-bearing: passes — The paper’s conclusions depend on it.
- Based: passes — The paper gives a reason why it holds.
It may state two separate claims as one.
None of the sources cited for this claim have been checked yet.
In the paper
“Syndecan-4 (Sdc4) is expressed in SCs and is required for SC activation21,22, but a role for Sdc4 in myofibers remains elusive.”
§ In vivo partial reprogramming of myofibers promotes muscle regeneration by remodeling the stem cell niche > Results > OSKM in myofibers inhibits Wnt4 expression through p21
What the sources say
- Not checked yetcites [21] Bentzinger, C. F. et al. Fibronectin regulates Wnt7a signaling and satellite cell expansion. Cell Stem Cell 12, 75–87 (2013). source
- Not checked yetcites [22] Cornelison, D. D. et al. Essential and separable roles for Syndecan-3 and Syndecan-4 in skeletal muscle development and regeneration. Genes Dev. 18, 2231–2236 (2004). source
plaindirect- Asserted: passes — The authors put it forward as true.
- Checkable: passes — It can be checked against evidence.
- Load-bearing: fails — The paper’s conclusions may not depend on it.
- Based: passes — The paper gives a reason why it holds.
Probably not a substantial claim. The paper’s conclusions may not depend on it. It may state two separate claims as one.
None of the sources cited for this claim have been checked yet.
In the paper
“Deletion of collagen VI or laminin-α1 (ECM components) or myofiber-specific deletion of O-fucosyltransferase 1 gene (Pofut1) impairs the self-renewal of SCs36–38, leading to the shrinkage of the SC pool after multiple muscle injuries.”
§ In vivo partial reprogramming of myofibers promotes muscle regeneration by remodeling the stem cell niche > Discussion
What the sources say
- Not checked yetcites [36] Rayagiri, S. S. et al. Basal lamina remodeling at the skeletal muscle stem cell niche mediates stem cell self-renewal. Nat. Commun. 9, 1075 (2018). source
- Not checked yetcites [37] Urciuolo, A. et al. Collagen VI regulates satellite cell self-renewal and muscle regeneration. Nat. Commun. 4, 1964 (2013). source
- Not checked yetcites [38] Zygmunt D. A. et al. Deletion of Pofut1 in mouse skeletal Myofibers induces muscle aging-related phenotypes in cis and in trans. Mol. Cell. Biol. 37, e00426–16 (2017). source
plaindirect- Asserted: passes — The authors put it forward as true.
- Checkable: passes — It can be checked against evidence.
- Load-bearing: passes — The paper’s conclusions depend on it.
- Based: passes — The paper gives a reason why it holds.
It may state two separate claims as one.
A conclusion the paper draws from its own results — it cites no other source for it, so there is none to check. The quote shows it is in the paper.
In the paper
“In contrast, our results suggest an aging-independent effect of reprogramming factors on muscle regeneration through remodeling of the extrinsic niche but not by regulating the intrinsic modulators of SCs.”
§ In vivo partial reprogramming of myofibers promotes muscle regeneration by remodeling the stem cell niche > Discussion
hedgedconditional- Asserted: passes — The authors put it forward as true.
- Checkable: passes — It can be checked against evidence.
- Load-bearing: passes — The paper’s conclusions depend on it.
- Based: passes — The paper gives a reason why it holds.
It may state two separate claims as one.
In the paper
“The increase in activated SCs accelerated muscle regeneration, which may partly explain our previous observation that muscle regeneration was promoted in aging systemic 4F mice8.”
§ In vivo partial reprogramming of myofibers promotes muscle regeneration by remodeling the stem cell niche > Discussion
What the sources say
- Not checked yetcites [8] Ocampo, A. et al. In vivo amelioration of age-associated hallmarks by partial reprogramming. Cell 167, e1712 (2016). 1719-1733. source
hedgedconditional- Asserted: passes — The authors put it forward as true.
- Checkable: passes — It can be checked against evidence.
- Load-bearing: passes — The paper’s conclusions depend on it.
- Based: passes — The paper gives a reason why it holds.
It may state two separate claims as one.
- Rests on an assumption: SC activation is required for muscle regeneration.
A conclusion the paper draws from its own results — it cites no other source for it, so there is none to check. The quote shows it is in the paper.
In the paper
“The aging process is much slower in WT mice compared to progeria mice and longer time may be required to observe the effect of OSKM on SC number in naturally aging mice.”
§ In vivo partial reprogramming of myofibers promotes muscle regeneration by remodeling the stem cell niche > Discussion
hedgedconditional- Asserted: passes — The authors put it forward as true.
- Checkable: passes — It can be checked against evidence.
- Load-bearing: fails — The paper’s conclusions may not depend on it.
- Based: passes — The paper gives a reason why it holds.
Probably not a substantial claim. The paper’s conclusions may not depend on it.
- Rests on an assumption: The aging process is much slower in WT mice compared to progeria mice.
In the paper
“Intrinsic modulators control SC-initiated postnatal myogenesis29.”
§ In vivo partial reprogramming of myofibers promotes muscle regeneration by remodeling the stem cell niche > Discussion
What the sources say
- Not checked yetcites [29] Dumont, N. A., Wang, Y. X. & Rudnicki, M. A. Intrinsic and extrinsic mechanisms regulating satellite cell function. Development 142, 1572–1581 (2015). source
plaindirect- Asserted: passes — The authors put it forward as true.
- Checkable: passes — It can be checked against evidence.
- Load-bearing: fails — The paper’s conclusions may not depend on it.
- Based: passes — The paper gives a reason why it holds.
Probably not a substantial claim. The paper’s conclusions may not depend on it.
None of the sources cited for this claim have been checked yet.
In the paper
“Self-renewal of SCs is maintained by the SC niche, including, but not limited to ECM components and myofibers34,35.”
§ In vivo partial reprogramming of myofibers promotes muscle regeneration by remodeling the stem cell niche > Discussion
What the sources say
- Not checked yetcites [34] Kuang, S., Gillespie, M. A. & Rudnicki, M. A. Niche regulation of muscle satellite cell self-renewal and differentiation. Cell Stem Cell 2, 22–31 (2008). source
- Not checked yetcites [35] Yin, H., Price, F. & Rudnicki, M. A. Satellite cells and the muscle stem cell niche. Physiol. Rev. 93, 23–67 (2013). source
plaindirect- Asserted: passes — The authors put it forward as true.
- Checkable: passes — It can be checked against evidence.
- Load-bearing: passes — The paper’s conclusions depend on it.
- Based: passes — The paper gives a reason why it holds.
Probably not a substantial claim.
None of the sources cited for this claim have been checked yet.
In the paper
“OSKM induction triggers complex cellular changes1–3.”
§ In vivo partial reprogramming of myofibers promotes muscle regeneration by remodeling the stem cell niche > Discussion
What the sources say
- Not checked yetcites [1] Takahashi, K. et al. Induction of pluripotent stem cells from adult human fibroblasts by defined factors. Cell 131, 861–872 (2007). source
- Not checked yetcites [2] Takahashi, K. & Yamanaka, S. Induction of pluripotent stem cells from mouse embryonic and adult fibroblast cultures by defined factors. Cell 126, 663–676 (2006). source
- Not checked yetcites [3] Polo, J. M. et al. A molecular roadmap of reprogramming somatic cells into iPS cells. Cell 151, 1617–1632 (2012). source
plaindirect- Asserted: passes — The authors put it forward as true.
- Checkable: passes — It can be checked against evidence.
- Load-bearing: fails — The paper’s conclusions may not depend on it.
- Based: passes — The paper gives a reason why it holds.
Probably not a substantial claim. The paper’s conclusions may not depend on it.
A conclusion the paper draws from its own results — it cites no other source for it, so there is none to check. The quote shows it is in the paper.
In the paper
“The identification of their effective downstream targets would restrict unwanted outcomes and benefit the development of new approaches to facilitate tissue regeneration.”
§ In vivo partial reprogramming of myofibers promotes muscle regeneration by remodeling the stem cell niche > Discussion
hedgeddirect- Asserted: passes — The authors put it forward as true.
- Checkable: fails — It may be too vague to check against evidence.
- Load-bearing: fails — The paper’s conclusions may not depend on it.
- Based: passes — The paper gives a reason why it holds.
Probably not a substantial claim. It may be too vague to check against evidence. The paper’s conclusions may not depend on it. It may state two separate claims as one.
The paper relies on this without support.
Young mice lack aging-related decline, so any OSKM-induced improvement in muscle regeneration in them cannot be attributed to rejuvenation of aged cells.
“In addition, we chose young mice to investigate whether the improvement of regeneration can be achieved by OSKM induction regardless of its rejuvenating effect.”
The paper relies on this without support.
The aging process is much slower in WT mice compared to progeria mice.
“The aging process is much slower in WT mice compared to progeria mice and longer time may be required to observe the effect of OSKM on SC number in naturally aging mice.”
The paper relies on this without support.
The intrinsic regulatory machinery is efficient in young SCs.
“The intrinsic regulatory machinery is efficient in young SCs, therefore, further improvement of SC quality is limited.”
The paper relies on this without support.
SC activation is required for muscle regeneration.
“SCs activation is required for muscle regeneration, but the activation kinetics is delayed in aged SCs30.”
Claims other papers make about this one
Each is checked against this paper’s own text: does it say what the citing paper says it does?
The cited source doesn’t support the claim as written.
In the citing paper
“They showed increased MuSC activation and proliferation only when the factors are overexpressed before the injury (both in old and young mice) without affecting their self-renewal capability.”
From Mechanisms, pathways and strategies for rejuvenation through epigenetic reprogramming (2023) · cites this paper as [111]
Checked by a reasoning model — may be wrong.
Experimental — accuracy not yet measuredThe source backs part of the claim, not all of it — or backs it for a different population, condition or comparison.
In the citing paper
“suggesting that manipulation of specific pathways may be critical to achieving rejuvenation 111”
From Mechanisms, pathways and strategies for rejuvenation through epigenetic reprogramming (2023) · cites this paper as [111]
Experimental — accuracy not yet measuredThe source backs part of the claim, not all of it — or backs it for a different population, condition or comparison.
In the citing paper
“arguing that the rejuvenation effect on MuSCs is cell nonautonomous and induced by myofibers 111 .”
From Mechanisms, pathways and strategies for rejuvenation through epigenetic reprogramming (2023) · cites this paper as [111]
Experimental — accuracy not yet measuredThe cited source says what the claim attributes to it.
In the citing paper
“the specific overexpression of the factors in MuSCs did not improve muscle regeneration”
From Mechanisms, pathways and strategies for rejuvenation through epigenetic reprogramming (2023) · cites this paper as [111]
The cited source says what the claim attributes to it.
In the citing paper
“This increase in MuSC proliferation upon OKSM overexpression was induced via p53-p21 signaling, which inhibits Wnt4 and contributes to the activation of MyoD and YaP in MuSCs”
From Mechanisms, pathways and strategies for rejuvenation through epigenetic reprogramming (2023) · cites this paper as [111]
In the citing paper
“The beneficial effects of OSKM on muscle function may be not cell autonomous: indeed expression of OSKM in myofibres, but not in MuSCs, promotes regeneration of old muscles232.”
From Ageing and rejuvenation of tissue stem cells and their niches (2023) · cites this paper as [232]
Self-check
Percentages, sums and reported differences re-computed from the paper’s own numbers.
Each contradiction between two passages listed here was confirmed by an independent check.
Rated minor: it would not touch a result — a value no result rests on, a p-value that stays on the same side of the significance level, or a conflict that is clerical, resolved elsewhere in the paper, or outside its own findings.
In the paper
§ In vivo partial reprogramming of myofibers promotes muscle regeneration by remodeling the stem cell niche > Results > Cyclic Wnt4 knockdown facilitates muscle regeneration
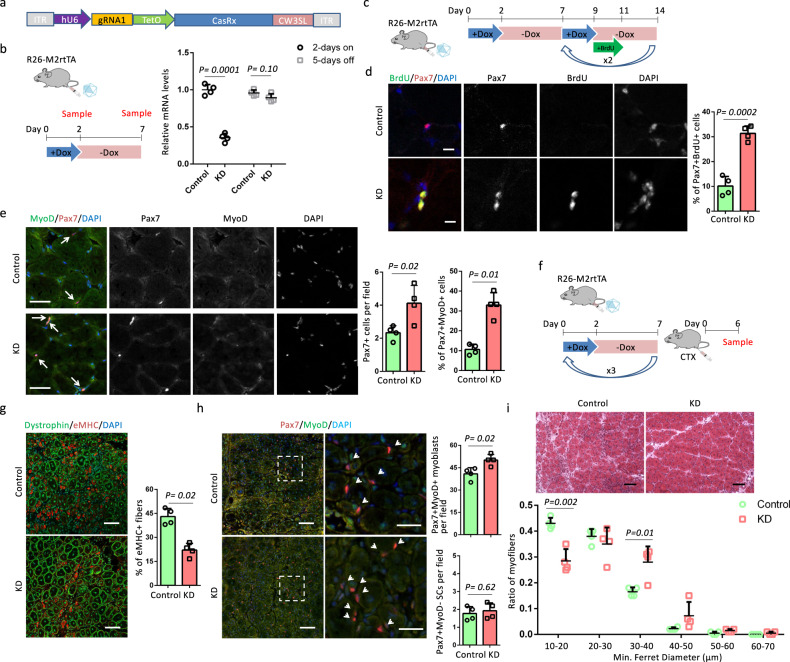
“In contrast, the number of Pax7+MyoD− SCs was comparable in control and KD samples (Fig. 2i), indicating Cre+ samples had an expansion of myoblasts without changing the SCs number.”
§ In vivo partial reprogramming of myofibers promotes muscle regeneration by remodeling the stem cell niche > Results > OSKM induction in myofibers accelerates muscle regeneration
“In contrast, the number of Pax7+MyoD− SCs was comparable in Cre− and Cre+ samples (Fig. 2i), indicating Cre+ samples had an expansion of myoblasts without changing the SCs number.”
Citations
Cites
Moderated estimation of fold change and dispersion for RNA-seq data with DESeq2
Love, M. I., Huber, W., & Anders, S. (2014) · Genome Biology · doi:10.1186/s13059-014-0550-8 · Cited by 95,106
STAR: ultrafast universal RNA-seq aligner
Dobin, A., Davis, C. A., Schlesinger, F., Drenkow, J., Zaleski, C., Jha, S., Batut, P., Chaisson, M., & Gingeras, T. R. (2013) · Bioinformatics · doi:10.1093/bioinformatics/bts635 · Cited by 51,709
Takahashi, K., & Yamanaka, S. (2006) · Cell · doi:10.1016/j.cell.2006.07.024 · Cited by 26,673
Induction of Pluripotent Stem Cells from Adult Human Fibroblasts by Defined Factors
Takahashi, K., Tanabe, K., Ohnuki, M., Narita, M., Ichisaka, T., Tomoda, K., & Yamanaka, S. (2007) · Cell · doi:10.1016/j.cell.2007.11.019 · Cited by 20,221
Heinz, S., Benner, C., Spann, N., Bertolino, E., Lin, Y. C., Laslo, P., Cheng, J. X., Murre, C., Singh, H., & Glass, C. K. (2010) · Molecular Cell · doi:10.1016/j.molcel.2010.05.004 · Cited by 13,382
SATELLITE CELL OF SKELETAL MUSCLE FIBERS
Mauro, A. (1961) · The Journal of Cell Biology · doi:10.1083/jcb.9.2.493 · Cited by 3,683
The role of microRNA-1 and microRNA-133 in skeletal muscle proliferation and differentiation
Chen, J., Mandel, E. M., Thomson, J. M., Wu, Q., Callis, T. E., Hammond, S. M., Conlon, F. L., & Wang, D.-Z. (2005) · Nature Genetics · doi:10.1038/ng1725 · Cited by 2,807
Satellite Cells and the Muscle Stem Cell Niche
Yin, H., Price, F., & Rudnicki, M. A. (2013) · Physiological Reviews · doi:10.1152/physrev.00043.2011 · Cited by 2,166
CHOPCHOP v3: expanding the CRISPR web toolbox beyond genome editing
Labun, K., Montague, T. G., Krause, M., Cleuren, Y. N. T., Tjeldnes, H., & Valen, E. (2019) · Nucleic Acids Research · doi:10.1093/nar/gkz365 · Cited by 2,075
Suppression of induced pluripotent stem cell generation by the p53–p21 pathway
Hong, H., Takahashi, K., Ichisaka, T., Aoi, T., Kanagawa, O., Nakagawa, M., Okita, K., & Yamanaka, S. (2009) · Nature · doi:10.1038/nature08235 · Cited by 1,301
Murphy, M. M., Lawson, J. A., Mathew, S. J., Hutcheson, D. A., & Kardon, G. (2011) · Development · doi:10.1242/dev.064162 · Cited by 1,249
Transcriptome Engineering with RNA-Targeting Type VI-D CRISPR Effectors
Konermann, S., Lotfy, P., Brideau, N. J., Oki, J., Shokhirev, M. N., & Hsu, P. D. (2018) · Cell · doi:10.1016/j.cell.2018.02.033 · Cited by 1,164
Geriatric muscle stem cells switch reversible quiescence into senescence
Sousa-Victor, P., Gutarra, S., García-Prat, L., Rodriguez-Ubreva, J., Ortet, L., Ruiz-Bonilla, V., Jardí, M., Ballestar, E., González, S., Serrano, A. L., et al. (2014) · Nature · doi:10.1038/nature13013 · Cited by 1,010
In Vivo Amelioration of Age-Associated Hallmarks by Partial Reprogramming.
Ocampo, A., Reddy, P., Martinez-Redondo, P., Platero-Luengo, A., Hatanaka, F., Hishida, T., Li, M., Lam, D., Kurita, M., Beyret, E., et al. (2016) · Cell · doi:10.1016/j.cell.2016.11.052 · Cited by 988
Self-citationGene transfer into muscle by electroporation in vivo
Aihara, H., & Miyazaki, J. (1998) · Nature Biotechnology · doi:10.1038/nbt0998-867 · Cited by 945
A Molecular Roadmap of Reprogramming Somatic Cells into iPS Cells
Polo, J. M., Anderssen, E., Walsh, R. M., Schwarz, B. A., Nefzger, C. M., Lim, S. M., Borkent, M., Apostolou, E., Alaei, S., Cloutier, J., et al. (2012) · Cell · doi:10.1016/j.cell.2012.11.039 · Cited by 861
Reprogramming to recover youthful epigenetic information and restore vision
Lu, Y., Brommer, B., Tian, X., Krishnan, A., Meer, M., Wang, C., Vera, D. L., Zeng, Q., Yu, D., Bonkowski, M. S., et al. (2020) · Nature · doi:10.1038/s41586-020-2975-4 · Cited by 820
Self-citationMyostatin negatively regulates satellite cell activation and self-renewal
McCroskery, S., Thomas, M., Maxwell, L., Sharma, M., & Kambadur, R. (2003) · The Journal of Cell Biology · doi:10.1083/jcb.200207056 · Cited by 784
Hochedlinger, K., Yamada, Y., Beard, C., & Jaenisch, R. (2005) · Cell · doi:10.1016/j.cell.2005.02.018 · Cited by 747
Reprogramming in vivo produces teratomas and iPS cells with totipotency features
Abad, M., Mosteiro, L., Pantoja, C., Cañamero, M., Rayon, T., Ors, I., Graña, O., Megías, D., Domínguez, O., Martínez, D., et al. (2013) · Nature · doi:10.1038/nature12586 · Cited by 547
Collagen VI regulates satellite cell self-renewal and muscle regeneration
Urciuolo, A., Quarta, M., Morbidoni, V., Gattazzo, F., Molon, S., Grumati, P., Montemurro, F., Tedesco, F. S., Blaauw, B., Cossu, G., et al. (2013) · Nature Communications · doi:10.1038/ncomms2964 · Cited by 511
Niche Regulation of Muscle Satellite Cell Self-Renewal and Differentiation
Kuang, S., Gillespie, M. A., & Rudnicki, M. A. (2008) · Cell Stem Cell · doi:10.1016/j.stem.2007.12.012 · Cited by 507
Intrinsic and extrinsic mechanisms regulating satellite cell function
Dumont, N. A., Wang, Y. X., & Rudnicki, M. A. (2015) · Development · doi:10.1242/dev.114223 · Cited by 491
[Cellular receptors for animal viruses].
HOMMA, R., & Yasui, K. (1968) · PubMed · Cited by 487
Ohnishi, K., Semi, K., Yamamoto, T., Shimizu, M., Tanaka, A., Mitsunaga, K., Okita, K., Osafune, K., Arioka, Y., Maeda, T., et al. (2014) · Cell · doi:10.1016/j.cell.2014.01.005 · Cited by 460
Absence of integrin α7 causes a novel form of muscular dystrophy
Mayer, U., Saher, G., Fässler, R., Bornemann, A., Echtermeyer, F., Mark, H. V. D., Miosge, N., Pösch, E., & Mark, K. V. D. (1997) · Nature Genetics · doi:10.1038/ng1197-318 · Cited by 451
In vivo target gene activation via CRISPR/Cas9-mediated trans-epigenetic modulation
Liao, H.-K., Hatanaka, F., Araoka, T., Reddy, P., Wu, M.-Z., Sui, Y., Yamauchi, T., Sakurai, M., O’Keefe, D. D., Núñez-Delicado, E., et al. (2017) · Cell · doi:10.1016/j.cell.2017.10.025 · Cited by 451
Self-citationThe central role of muscle stem cells in regenerative failure with aging
Blau, H. M., Cosgrove, B. D., & Ho, A. T. V. (2015) · Nature Medicine · doi:10.1038/nm.3918 · Cited by 437
Fibronectin Regulates Wnt7a Signaling and Satellite Cell Expansion
Bentzinger, C. F., Wang, Y. X., von Maltzahn, J., Soleimani, V. D., Yin, H., & Rudnicki, M. A. (2013) · Cell Stem Cell · doi:10.1016/j.stem.2012.09.015 · Cited by 386
Bélteki, G. (2005) · Nucleic Acids Research · doi:10.1093/nar/gni051 · Cited by 382
Fry, C. S., Kirby, T. J., Kosmac, K., McCarthy, J. J., & Peterson, C. A. (2017) · Cell stem cell · doi:10.1016/j.stem.2016.09.010 · Cited by 372
Verma, M., Asakura, Y., Murakonda, B. S. R., Pengo, T., Latroche, C., Chazaud, B., McLoon, L. K., & Asakura, A. (2018) · Cell stem cell · doi:10.1016/j.stem.2018.09.007 · Cited by 355
Cornelison, D. D. W., Wilcox-Adelman, S. A., Goetinck, P. F., Rauvala, H., Rapraeger, A. C., & Olwin, B. B. (2004) · Genes & Development · doi:10.1101/gad.1214204 · Cited by 317
Sarkar, T. J., Quarta, M., Mukherjee, S., Colville, A., Paine, P., Doan, L., Tran, C. M., Chu, C. R., Horvath, S., Qi, L. S., et al. (2020) · Nature Communications · doi:10.1038/s41467-020-15174-3 · Cited by 308
A reprogrammable mouse strain from gene targeted embryonic stem cells
Stadtfeld, M., Maherali, N., Borkent, M., & Hochedlinger, K. (2009) · Nature Methods · doi:10.1038/nmeth.1409 · Cited by 254
Gene targeting restricted to mouse striated muscle lineage
Miniou, P. (1999) · Nucleic Acids Research · doi:10.1093/nar/27.19.e27 · Cited by 226
Basal lamina remodeling at the skeletal muscle stem cell niche mediates stem cell self-renewal
Rayagiri, S. S., Ranaldi, D., Raven, A., Mohamad Azhar, N. I. F., Lefebvre, O., Zammit, P. S., & Borycki, A.-G. (2018) · Nature Communications · doi:10.1038/s41467-018-03425-3 · Cited by 218
Devgan, V., Mammucari, C., Millar, S. E., Brisken, C., & Dotto, G. P. (2005) · Genes & Development · doi:10.1101/gad.341405 · Cited by 209
Wnt4 from the Niche Controls the Mechano-Properties and Quiescent State of Muscle Stem Cells
Eliazer, S., Muncie, J. M., Christensen, J., Sun, X., D’Urso, R. S., Weaver, V. M., & Brack, A. S. (2019) · Cell Stem Cell · doi:10.1016/j.stem.2019.08.007 · Cited by 171
The ins and outs of muscle stem cell aging
Brack, A. S., & Muñoz-Cánoves, P. (2015) · Skeletal Muscle · doi:10.1186/s13395-016-0072-z · Cited by 166
Niche Cadherins Control the Quiescence-to-Activation Transition in Muscle Stem Cells
Goel, A. J., Rieder, M.-K., Arnold, H.-H., Radice, G. L., & Krauss, R. S. (2017) · Cell Reports · doi:10.1016/j.celrep.2017.10.102 · Cited by 146
Gene Transfer into Muscle by Electroporation In Vivo
Miyazaki, J., & Aihara, H. (2003) · Humana Press eBooks · doi:10.1385/1-59259-141-8:049 · Cited by 140
Macrophage-released ADAMTS1 promotes muscle stem cell activation
Du, H., Shih, C., Wosczyna, M. N., Mueller, A. A., Cho, J., Aggarwal, A., Rando, T. A., & Feldman, B. J. (2017) · Nature Communications · doi:10.1038/s41467-017-00522-7 · Cited by 137
Wang, C., Yue, F., & Kuang, S. (2017) · BIO-PROTOCOL · doi:10.21769/bioprotoc.2279 · Cited by 134
Self-citationReprogrammed Cells for Disease Modeling and Regenerative Medicine
Cherry, A. B. C., & Daley, G. Q. (2013) · Annual Review of Medicine · doi:10.1146/annurev-med-050311-163324 · Cited by 132
Pten is necessary for the quiescence and maintenance of adult muscle stem cells
Yue, F., Bi, P., Wang, C., Shan, T., Nie, Y., Ratliff, T. L., Gavin, T. P., & Kuang, S. (2017) · Nature Communications · doi:10.1038/ncomms14328 · Cited by 125
Self-citationIn Vivo Reprogramming Ameliorates Aging Features in Dentate Gyrus Cells and Improves Memory in Mice.
Rodríguez-Matellán, A., Alcazar, N., Hernández, F., Serrano, M., & Ávila, J. (2020) · Stem Cell Reports · doi:10.1016/j.stemcr.2020.09.010 · Cited by 116
Aging induces aberrant state transition kinetics in murine muscle stem cells
Kimmel, J. C., Hwang, A. B., Scaramozza, A., Marshall, W. F., & Brack, A. S. (2020) · Development · doi:10.1242/dev.183855 · Cited by 95
Nie, Y., Sato, Y., Wang, C., Yue, F., Kuang, S., & Gavin, T. P. (2016) · The FASEB Journal · doi:10.1096/fj.201600529r · Cited by 91
Self-citationLoss of MyoD Promotes Fate Transdifferentiation of Myoblasts Into Brown Adipocytes
Wang, C., Liu, W., Nie, Y., Qaher, M., Horton, H. E., Yue, F., Asakura, A., & Kuang, S. (2017) · EBioMedicine · doi:10.1016/j.ebiom.2017.01.015 · Cited by 78
Self-citationIn vivo reprogramming drives Kras-induced cancer development
Shibata, H., Komura, S., Yamada, Y., Sankoda, N., Tanaka, A., Ukai, T., Kabata, M., Sakurai, S., Kuze, B., Woltjen, K., et al. (2018) · Nature Communications · doi:10.1038/s41467-018-04449-5 · Cited by 76
Okamoto, T., Kurahashi, K., & Fujiwara, M. (1988) · Journal of Pharmacology and Experimental Therapeutics · doi:10.1016/s0022-3565(25)24089-7 · Cited by 56
Pisconti, A., Banks, G. B., Babaeijandaghi, F., Betta, N. D., Rossi, F. M. V., Chamberlain, J. S., & Olwin, B. B. (2016) · Skeletal Muscle · doi:10.1186/s13395-016-0104-8 · Cited by 50
Watanabe, S., Hirai, H., Asakura, Y., Tastad, C., Verma, M., Keller, C., Dutton, J. R., & Asakura, A. (2011) · Stem Cells · doi:10.1002/stem.598 · Cited by 44
Zygmunt, D. A., Singhal, N., Kim, M.-L., Cramer, M. L., Crowe, K. E., Xu, R., Jia, Y., Adair, J., Martinez-Pena y Valenzuela, I., Akaaboune, M., et al. (2017) · Molecular and Cellular Biology · doi:10.1128/mcb.00426-16 · Cited by 15
Cited by
Sorted by citations
Meta-hallmarks of aging and cancer
López-Otín, C., Pietrocola, F., Roiz-Valle, D., Galluzzi, L., & Kroemer, G. (2023) · Cell Metabolism · doi:10.1016/j.cmet.2022.11.001 · Cited by 529
Control of satellite cell function in muscle regeneration and its disruption in ageing
Sousa-Victor, P., García-Prat, L., & Muñoz-Cánoves, P. (2022) · Nature Reviews Molecular Cell Biology · doi:10.1038/s41580-021-00421-2 · Cited by 476
Ageing and rejuvenation of tissue stem cells and their niches
Brunet, A., Goodell, M. A., & Rando, T. A. (2023) · Nature Reviews Molecular Cell Biology · doi:10.1038/s41580-022-00510-w · Cited by 407
Browder, K. C., Reddy, P., Yamamoto, M., Haghani, A., Guillen, I. G., Sahu, S., Wang, C., Luque, Y., Prieto, J., Shi, L., et al. (2022) · Nature Aging · doi:10.1038/s43587-022-00183-2 · Cited by 253
Self-citationHuman organoids-on-chips for biomedical research and applications
Wang, H., Ning, X., Zhao, F. H., Zhao, H., & Li, D. (2024) · Theranostics · doi:10.7150/thno.90492 · Cited by 148
Metadata
- Authors
- Wang, C., Rabadan Ros, R., Martinez-Redondo, P., Ma, Z., Shi, L., Xue, Y., Guillen-Guillen, I., Huang, L., Hishida, T., Liao, H.-K., Nuñez Delicado, E., Rodriguez Esteban, C., Guillen-Garcia, P., Reddy, P., & Izpisua Belmonte, J. C.
- Affiliations
- Salk Institute for Biological Studies (US)
- ORCID
- Venue
- Nature Communications
- Published
- 2021-05-25
- Volume
- 12
- Issue
- 1
- Pages
- 3094-3094
- ISSN
- 2041-1723 (ISSN-L)
- PMC
- PMC8149870
- OpenAlex
- W3165546848
- Cited by
- 119
- References
- 55
- Citations by year
- 2026: 16 · 2025: 24 · 2024: 27 · 2023: 28 · 2022: 17 · 2021: 7
- FWCI
- 6.19
- Type
- journal article
- Language
- en
- Open access
- gold
- doi.org
- Locations
- Nature Communications (publishedVersion, cc-by)
- PubMed Central (publishedVersion, cc-by)
- PubMed (publishedVersion)
- RePEc: Research Papers in Economics (submittedVersion)
- DOAJ (DOAJ: Directory of Open Access Journals) (submittedVersion, cc-by-sa)
- Funders
- This work was supported by Asociación de Futbolistas Españoles (AFE), Fundacion Pedro Guillen, Universidad Católica San Antonio de Murcia (UCAM), The Glenn Foundation, The Moxie Foundation and CIRM
- Topics
- Life Sciences › Biochemistry, Genetics and Molecular Biology › Molecular Biology › Muscle Physiology and Disorders
- Life Sciences › Biochemistry, Genetics and Molecular Biology › Molecular Biology › Pluripotent Stem Cells Research
- Life Sciences › Biochemistry, Genetics and Molecular Biology › Molecular Biology › Congenital heart defects research
- Keywords
- partial reprogramming, Yamanaka factors, OSKM, muscle regeneration, satellite cells, muscle stem cells, stem cell niche, muscle fibers, Wnt4, p21, stem cell quiescence, aging cells, local gene expression
- MeSH terms
- Kruppel-Like Factor 4, Animals, Cell Differentiation, Cells, Cultured, Female, Mice, Transgenic, Myofibrils, Regeneration, Gene Expression, Proto-Oncogene Proteins c-myc, Satellite Cells, Skeletal Muscle, Octamer Transcription Factor-3, Kruppel-Like Transcription Factors, Stem Cell Niche, SOXB1 Transcription Factors, Wnt4 Protein, Cellular Reprogramming
About these checks
Registry, retraction, Cites and statistics results are computed, not judged, with one exception: a printed reference that no index lists is read once by a model before it counts as a citation error. Claims are extracted by a model and kept only when their quote appears verbatim in the text; each cited source is then checked, with a model’s help, for whether it says what the claim relies on. Those verdicts can be wrong — read the claim’s quote and the cited source before relying on one.
A language model drew the claims from the paper on 2026-10-10, under version 3 of the claim definition (model deepseek-v4.1-flash, prompt extract-v3).
A second model labelled each claim on 2026-10-10 (model jev-1.13-20260917, definition revision gold-guideline-v0.2).
Cited sources are checked with a language model’s help (gpt-6-sol).
Statistics and arithmetic are recomputed, not judged.
Confidence bands are shown only for fields calibrated on our annotated test set. None is calibrated yet, so no band is shown.
What counts as a claim ›How we measure confidence ›How we check this ›
Are you an author, or do you see a problem with this page? Request a review
