

The DOI matches its Crossref record; 12 of the 12 references it cites were found in a registry or an index.
Cortical neurons exhibit diverse myelination patterns that scale between mouse brain regions and regenerate after demyelination
Abstract
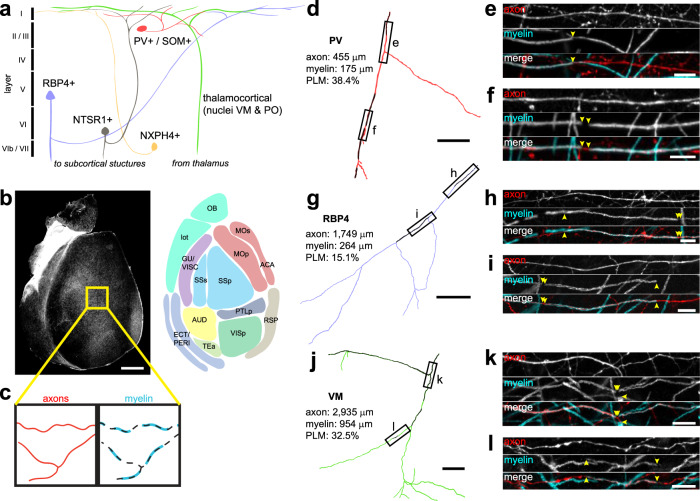
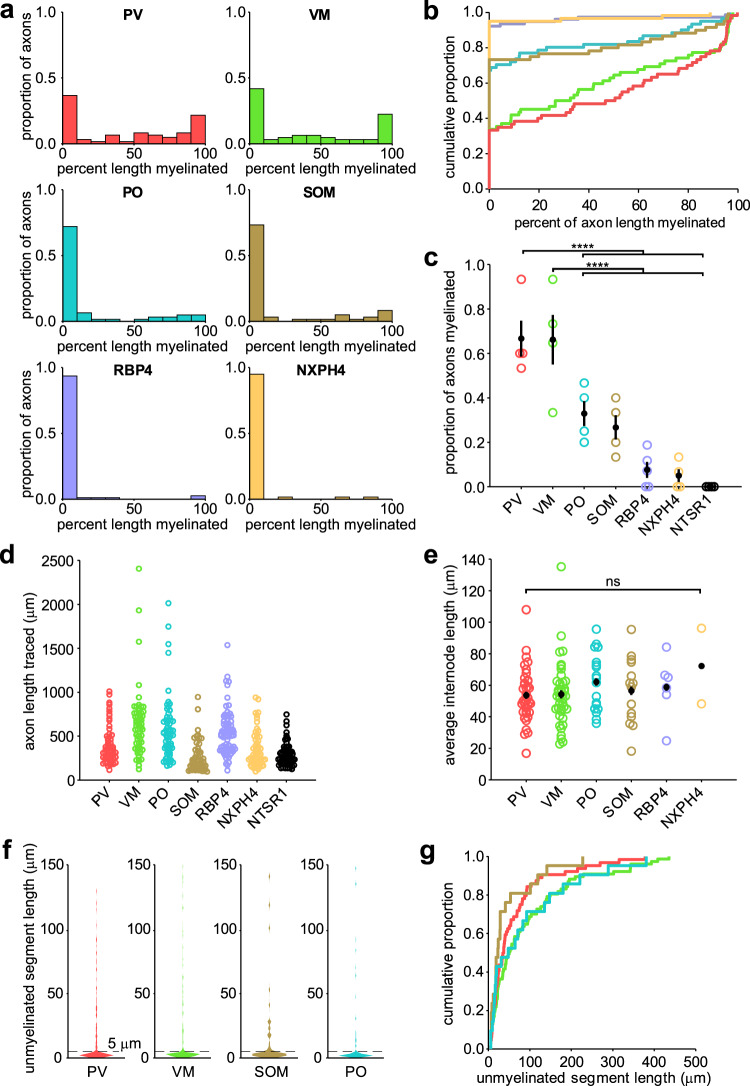
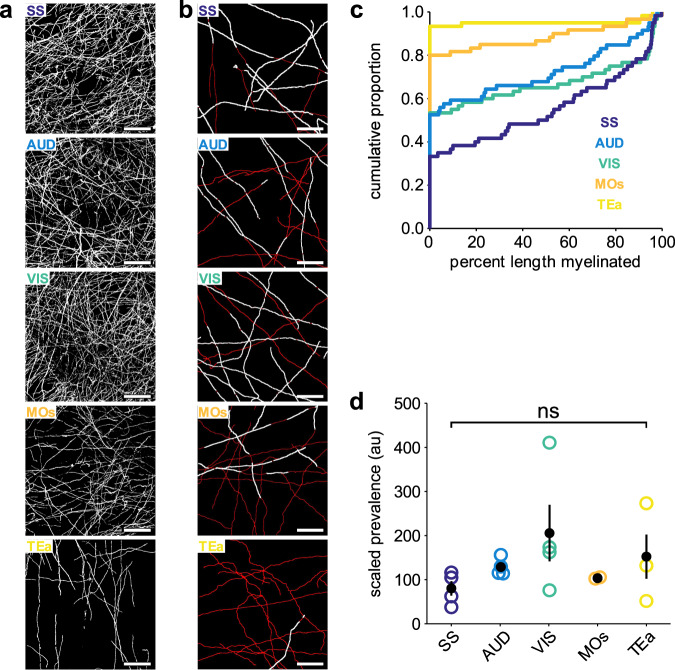
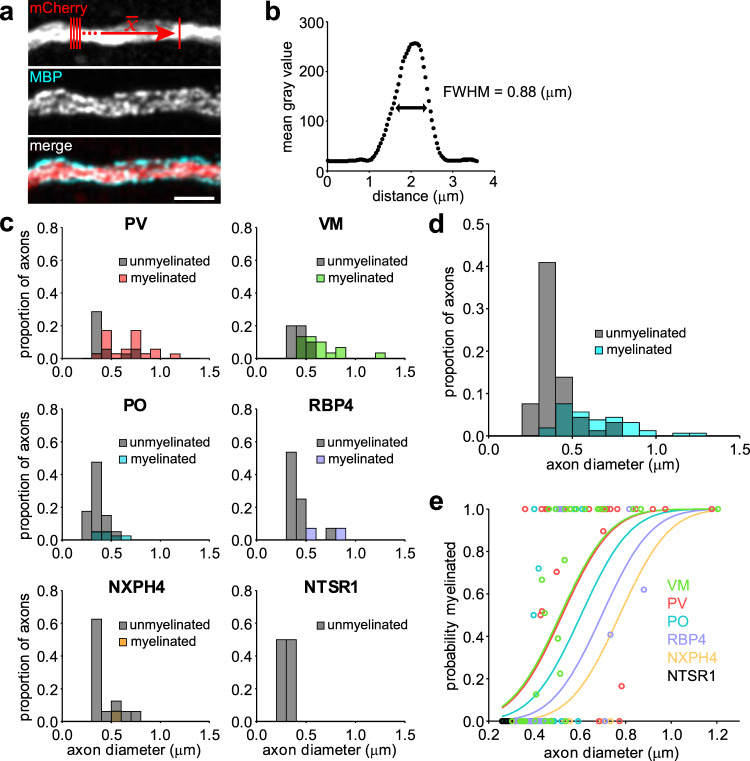
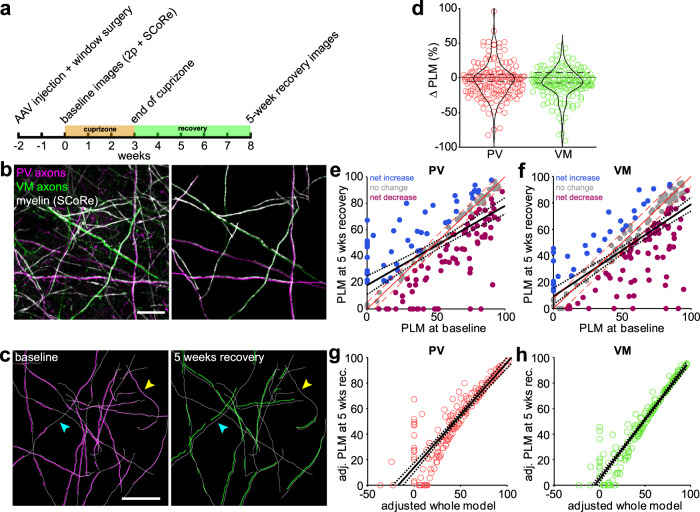
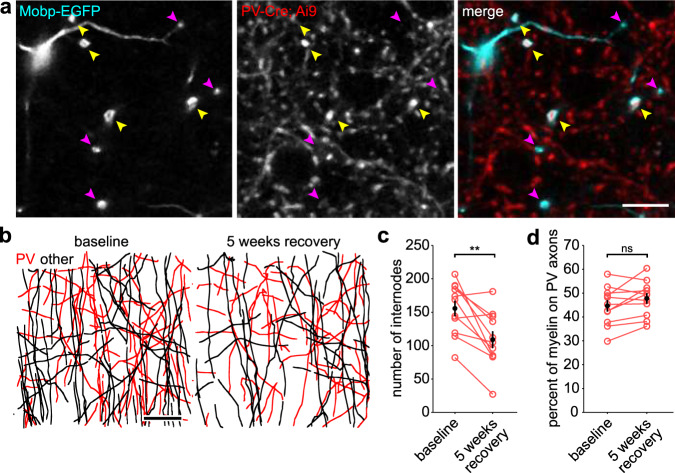
Axons in the cerebral cortex show a broad range of myelin coverage. Oligodendrocytes establish this pattern by selecting a cohort of axons for myelination; however, the distribution of myelin on distinct neurons and extent of internode replacement after demyelination remain to be defined. Here we show that myelination patterns of seven distinct neuron subtypes in somatosensory cortex are influenced by both axon diameter and neuronal identity. Preference for myelination of parvalbumin interneurons was preserved between cortical areas with varying myelin density, suggesting that regional differences in myelin abundance arises through local control of oligodendrogenesis. By imaging loss and regeneration of myelin sheaths in vivo we show that myelin distribution on individual axons was altered but overall myelin content on distinct neuron subtypes was restored. Our findings suggest that local changes in myelination are tolerated, allowing regenerated oligodendrocytes to restore myelin content on distinct neurons through opportunistic selection of axons.
Overview
The claims and statistics of this paper haven’t been checked yet.
Run the check — free, no account needed. It reads the open-access text and checks the sources it cites.
Integrity signals
Registry
Cites
Statistics
Figures
Verification
Claims the paper makes
The claims and statistics of this paper haven’t been checked yet.
Run the check — free, no account needed. It reads the open-access text and checks the sources it cites.
Claims other papers make about this one
Each is checked against this paper’s own text: does it say what the citing paper says it does?
In the citing paper
“different axons exhibit diverse myelination patterns, which are partially reflected by variations in the thickness of myelin sheaths.14,15,16”
From Neurons sequester the cholesterol-inhibiting TFEB in oligodendrocyte cytoplasm to safeguard myelination and neural function (2025) · cites this paper as [16]
Self-check
Percentages, sums and reported differences re-computed from the paper’s own numbers.
The self-check needs the paper’s full text.
Citations
Cites
No evidence that carotenoid pigments boost either immune or antioxidant defenses in a songbird
Koch, R. E., Kavazis, A. N., Hasselquist, D., Hood, W. R., Zhang, Y., Toomey, M. B., & Hill, G. E. (2018) · Nature Communications · doi:10.1038/s41467-018-02974-x · Cited by 1,924
Oligodendrocyte Dynamics in the Healthy Adult CNS: Evidence for Myelin Remodeling
Young, K. M., Psachoulia, K., Tripathi, R. B., Dunn, S.-J., Cossell, L., Attwell, D., Tohyama, K., & Richardson, W. D. (2013) · Neuron · doi:10.1016/j.neuron.2013.01.006 · Cited by 919
Control of local protein synthesis and initial events in myelination by action potentials
Wake, H., Lee, P. R., & Fields, R. D. (2011) · Science · doi:10.1126/science.1206998 · Cited by 636
Gain control by layer six in cortical circuits of vision
Olsen, S. R., Bortone, D. S., Adesnik, H., & Scanziani, M. (2012) · Nature · doi:10.1038/nature10835 · Cited by 539
Age-dependent fate and lineage restriction of single NG2 cells
Zhu, X., Hill, R. A., Dietrich, D., Komitova, M., Suzuki, R., & Nishiyama, A. (2011) · Development · doi:10.1242/dev.047951 · Cited by 464
Role of myelin plasticity in oscillations and synchrony of neuronal activity
Pajevic, S., Basser, P. J., & Fields, R. D. (2014) · Neuroscience · doi:10.1016/j.neuroscience.2013.11.007 · Cited by 378
Myelin plasticity: sculpting circuits in learning and memory
Xin, W., & Chan, J. R. (2020) · Nature Reviews Neuroscience · doi:10.1038/s41583-020-00379-8 · Cited by 329
Cell cycle dynamics of NG2 cells in the postnatal and ageing brain
Psachoulia, K., Jamen, F., Young, K. M., & Richardson, W. D. (2009) · Neuron Glia Biology · doi:10.1017/s1740925x09990354 · Cited by 257
Wake, H., Ortiz, F. C., Woo, D. H., Lee, P. R., Angulo, M. C., & Fields, R. D. (2015) · Nature Communications · doi:10.1038/ncomms8844 · Cited by 244
Cortical remyelination: A new target for repair therapies in multiple sclerosis
Chang, A., Staugaitis, S. M., Dutta, R., Batt, C. E., Easley, K. E., Chomyk, A. M., Yong, V. W., Fox, R. J., Kidd, G. J., & Trapp, B. D. (2012) · Annals of Neurology · doi:10.1002/ana.23693 · Cited by 216
Remyelination alters the pattern of myelin in the cerebral cortex
Orthmann-Murphy, J., Call, C. L., Molina-Castro, G. C., Hsieh, Y. C., Rasband, M. N., Calabresi, P. A., & Bergles, D. E. (2020) · eLife · doi:10.7554/elife.56621 · Cited by 111
Self-citationMyelin replacement triggered by single-cell demyelination in mouse cortex
Snaidero, N., Schifferer, M., Mezydlo, A., Zalc, B., Kerschensteiner, M., & Misgeld, T. (2020) · Nature Communications · doi:10.1038/s41467-020-18632-0 · Cited by 63
Research works printed but not linked: 74
- Cauller, L. Layer I of primary sensory neocortex: where top-down converges upon bottom-up. Behav. Brain Res. 71, 163–170 (1995). · DOI
- Xu, N. L. et al. Nonlinear dendritic integration of sensory and motor input during an active sensing task. Nature. 492, 247–251 (2021). · DOI
- Cruikshank, S. J. et al. Thalamic control of layer 1 circuits in prefrontal cortex. J. Neurosci. 32, 17813–17823 (2012). · DOI · Paper page
- Cauller, L. J., Clancy, B. & Connors, B. W. Backward cortical projections to primary somatosensory cortex in rats extend long horizontal axons in layer I. J. Comp. Neurol. 390, 297–310 (1998). · DOI
- Rubio-Garrido, P., Pérez-De-Manzo, F., Porrero, C., Galazo, M. J. & Clascá, F. Thalamic input to distal apical dendrites in neocortical layer 1 is massive and highly convergent. Cereb. Cortex 19, 2380–2395 (2009). · DOI
- Zilles, K., Palomero-Gallagher, N. & Amunts, K. Myeloarchitecture and maps of the cerebral cortex. In Brain Mapping: An Encyclopedic Reference (ed. Toga, A. W.) Vol. 2 137–156 (Elsevier Inc., 2015). · DOI
- Micheva, K. D. et al. A large fraction of neocortical myelin ensheathes axons of local inhibitory neurons. Elife 5, 1–29 (2016). · DOI
- Stedehouder, J. et al. Fast-spiking parvalbumin interneurons are frequently myelinated in the cerebral cortex of mice and humans. Cereb. Cortex 27, 5001–5013 (2017). · DOI
- Hill, R. A., Li, A. M. & Grutzendler, J. Lifelong cortical myelin plasticity and age-related degeneration in the live mammalian brain. Nat. Neurosci. 21, 683–695 (2018). · DOI · Paper page
- Hughes, E. G., Orthmann-Murphy, J. L., Langseth, A. J. & Bergles, D. E. Myelin remodeling through experience-dependent oligodendrogenesis in the adult somatosensory cortex. Nat. Neurosci. 21, 696–706 (2018). · DOI · Paper page
- Tomassy, G. S. et al. Distinct profiles of myelin distribution along single axons of pyramidal neurons in the neocortex. Science 344, 319–324 (2014). · DOI · Paper page
- Voyvodic, J. T. Target size regulates calibre and myelination of sympathetic axons. Nature 342, 430–433 (1989). · DOI
- Elder, G. A., Friedrich, V. L. & Lazzarini, R. A. Schwann cells and oligodendrocytes read distinct signals in establishing myelin sheath thickness. J. Neurosci. Res. 65, 493–499 (2001). · DOI
- Schröder, J. M., Bohl, J. & Brodda, K. Changes of the ratio between myelin thickness and axon diameter in the human developing sural nerve. Acta Neuropathol. 43, 169–178 (1978). · DOI
- Bechler, M. E., Byrne, L. & Ffrench-Constant, C. CNS myelin sheath lengths are an intrinsic property of oligodendrocytes. Curr. Biol. 25, 2411–2416 (2015). · DOI
- Mayoral, S. R., Etxeberria, A., Shen, Y.-A. A. A. A. & Chan, J. R. Initiation of CNS myelination in the optic nerve is dependent on axon caliber. Cell Rep. 25, 544–550e3 (2018). · DOI
- Remahl, S. & Hildebrand, C. Changing relation between onset of myelination and axon diameter range in developing feline white matter. J. Neurol. Sci. 54, 33–45 (1982). · DOI
- Waxman, S. G. & Sims, T. J. Specificity in central myelination: evidence for local regulation of myelin thickness. Brain Res. 292, 179–185 (1984). · DOI
- Chong, S. Y. C. et al. Neurite outgrowth inhibitor Nogo-A establishes spatial segregation and extent of oligodendrocyte myelination. Proc. Natl Acad. Sci. USA 109, 1299–1304 (2012). · DOI · Paper page
- Demerens, C. et al. Induction of myelination in the central nervous system by electrical activity. Proc. Natl Acad. Sci. USA 93, 9887–9892 (1996). · DOI · Paper page
- Stevens, B., Porta, S., Haak, L. L., Gallo, V. & Fields, R. D. Adenosine: a neuron-glial transmitter promoting myelination in the CNS in response to action potentials. Neuron 36, 855–868 (2002). · DOI
- Gibson, E. M. et al. Neuronal activity promotes oligodendrogenesis and adaptive myelination in the mammalian brain. Science 344, 1252304 (2014). · DOI · Paper page
- Redmond, S. A. et al. Somatodendritic expression of JAM2 inhibits oligodendrocyte myelination. Neuron 91, 824–836 (2016). · DOI
- Bø, L., Vedeler, C. A., Nyland, H. I., Trapp, B. D. & Mørk, S. J. Subpial demyelination in the cerebral cortex of multiple sclerosis patients. J. Neuropathol. Exp. Neurol. 62, 723–732 (2003). · DOI · Paper page
- Howell, O. W. et al. Meningeal inflammation is widespread and linked to cortical pathology in multiple sclerosis. Brain 134, 2755–2771 (2011). · DOI · Paper page
- Kidd, D. et al. Cortical lesions in multiple sclerosis. Brain 122(Part 1), 17–26 (1999). · DOI · Paper page
- Roosendaal, S. et al. Accumulation of cortical lesions in MS: relation with cognitive impairment. Mult. Scler. J. 15, 708–714 (2009). · DOI
- Nielsen, A. S. et al. Contribution of cortical lesion subtypes at 7T MRI to physical and cognitive performance in MS. Neurology 81, 641–649 (2013). · DOI
- Sacco, R. et al. Cognitive impairment and memory disorders in relapsing–remitting multiple sclerosis: the role of white matter, gray matter and hippocampus. J. Neurol. 262, 1691–1697 (2015). · DOI
- Muhlert, N. et al. The grey matter correlates of impaired decision-making in multiple sclerosis. J. Neurol. Neurosurg. Psychiatry 86, 530–536 (2015). · DOI
- Zonouzi, M. et al. Individual oligodendrocytes show bias for inhibitory axons in the neocortex. Cell Reports 27, 2799–2808 (2019). · DOI
- Stedehouder, J. & Kushner, S. A. Myelination of parvalbumin interneurons: a parsimonious locus of pathophysiological convergence in schizophrenia. Mol. Psychiatry 22, 4–12 (2017). · DOI
- Denman, D. J. & Contreras, D. Complex effects on in vivo visual responses by specific projections from mouse cortical layer 6 to dorsal lateral geniculate nucleus. J. Neurosci. 35, 9265–9280 (2015). · DOI
- Bortone, D. S., Olsen, S. R. & Scanziani, M. Translaminar inhibitory cells recruited by layer 6 corticothalamic neurons suppress visual cortex. Neuron 82, 474–485 (2014). · DOI · Paper page
- Viswanathan, S., Sheikh, A., Looger, L. L. & Kanold, P. O. Molecularly defined subplate neurons project both to thalamocortical recipient layers and thalamus. Cereb. Cortex 27, 4759–4768 (2017).
- Clancy, B. & Cauller, L. J. Widespread projections from subgriseal neurons (layer VII) to layer I in adult rat cortex. J. Comp. Neurol. 407, 275–286 (1999). · DOI
- Ibrahim, L. A. et al. Cross-modality sharpening of visual cortical processing through layer-1-mediated inhibition and disinhibition. Neuron 89, 1031–1045 (2016). · DOI
- Madisen, L. et al. A robust and high-throughput Cre reporting and characterization system for the whole mouse brain. Nat. Neurosci. 13, 133–140 (2010). · DOI · Paper page
- Gong, S. et al. Targeting Cre recombinase to specific neuron populations with bacterial artificial chromosome constructs. J. Neurosci. 27, 9817–9823 (2007). · DOI · Paper page
- Harris, J. A. et al. Anatomical characterization of Cre driver mice for neural circuit mapping and manipulation. Front. Neural Circuits. 8, 76 (2014). · DOI · Paper page
- Hunt, B. A. E. et al. Relationships between cortical myeloarchitecture and electrophysiological networks. Proc. Natl Acad. Sci. USA 113, 13510–13515 (2016). · DOI
- Nieuwenhuys, R. & Broere, C. A. J. A detailed comparison of the cytoarchitectonic and myeloarchitectonic maps of the human neocortex produced by the Vogt–Vogt school. Brain Struct. Funct. 1, 3 (2020).
- Whissell, P. D., Cajanding, J. D., Fogel, N. & Kim, J. C. Comparative density of CCK- and PV-GABA cells within the cortex and hippocampus. Front. Neuroanat. 9, 124 (2015). · DOI · Paper page
- Stedehouder, J. et al. Local axonal morphology guides the topography of interneuron myelination in mouse and human neocortex. Elife 8, 1–28 (2019). · DOI
- Bacmeister, C. M. et al. Motor learning promotes remyelination via new and surviving oligodendrocytes. Nat. Neurosci. 23, 819–831 (2020). · DOI
- Schain, A. J., Hill, R. A. & Grutzendler, J. Label-free in vivo imaging of myelinated axons in health and disease with spectral confocal reflectance microscopy. Nat. Med. 20, 443–449 (2014). · DOI
- Stedehouder, J., Brizee, D., Shpak, G. & Kushner, S. A. Activity-dependent myelination of parvalbumin interneurons mediated by axonal morphological plasticity. J. Neurosci. 38, 3631–3642 (2018). · DOI
- Lee, S. et al. A culture system to study oligodendrocyte myelination processes using engineered nanofibers. Nat. Methods 9, 917–922 (2012). · DOI
- Kang, S. H., Fukaya, M., Yang, J. K., Rothstein, J. D. & Bergles, D. E. NG2+ CNS glial progenitors remain committed to the oligodendrocyte lineage in postnatal life and following neurodegeneration. Neuron 68, 668–681 (2010). · DOI
- Almeida, R. G. The rules of attraction in central nervous system myelination. Front. Cell. Neurosci. 12, 367 (2018). · DOI
- Mi, S. et al. LINGO-1 negatively regulates myelination by oligodendrocytes. Nat. Neurosci. 8, 745–751 (2005). · DOI
- Linneberg, C., Harboe, M. & Laursen, L. S. Axo-glia interaction preceding CNS myelination is regulated by bidirectional Eph-ephrin signaling. ASN Neuro 7, 1–17 (2015). · DOI
- Brinkmann, B. G. et al. Neuregulin-1/ErbB signaling serves distinct functions in myelination of the peripheral and central nervous system. Neuron 59, 581–595 (2008). · DOI
- Zuchero, J. B. et al. CNS myelin wrapping is driven by actin disassembly. Dev. Cell 34, 152–167 (2015). · DOI · Paper page
- Snaidero, N. et al. Myelin membrane wrapping of CNS axons by PI(3,4,5)P3-dependent polarized growth at the inner tongue. Cell 156, 277–290 (2014). · DOI
- Ishibashi, T. et al. Astrocytes promote myelination in response to electrical impulses. Neuron 49, 823–832 (2006). · DOI · Paper page
- Mitew, S. et al. Pharmacogenetic stimulation of neuronal activity increases myelination in an axon-specific manner. Nat. Commun. 9, 1–16 (2018). · DOI
- Hines, J. H., Ravanelli, A. M., Schwindt, R., Scott, E. K. & Appel, B. Neuronal activity biases axon selection for myelination in vivo. Nat. Neurosci. 18, 683–689 (2015). · DOI
- Yang, S. M., Michel, K., Jokhi, V., Nedivi, E. & Arlotta, P. Neuron class-specific responses govern adaptive myelin remodeling in the neocortex. Science 370, eabd2109 (2021). · DOI
- Dutta, D. J. et al. Regulation of myelin structure and conduction velocity by perinodal astrocytes. Proc. Natl Acad. Sci. USA 115, 11832–11837 (2018). · DOI
- Hughes, E. G., Kang, S. H., Fukaya, M. & Bergles, D. E. Oligodendrocyte progenitors balance growth with self-repulsion to achieve homeostasis in the adult brain. Nat. Neurosci. 16, 668–676 (2013). · DOI · Paper page
- Ghanbari, L. et al. Cortex-wide neural interfacing via transparent polymer skulls. Nat. Commun. 10, 1500 (2019). · DOI
- Hamada, M. S. & Kole, M. H. P. Myelin loss and axonal ion channel adaptations associated with gray matter neuronal hyperexcitability. J. Neurosci. 35, 7272–7286 (2015). · DOI
- Hamada, M. S., Popovic, M. A. & Kole, M. H. P. Loss of saltation and presynaptic action potential failure in demyelinated axons. Front. Cell. Neurosci. 11, 1–11 (2017). · DOI
- Werneburg, S. et al. Targeted complement inhibition at synapses prevents microglial synaptic engulfment and synapse loss in demyelinating disease. Immunity 52, 167–182.e7 (2020). · DOI · Paper page
- Rankin, K. A. et al. Selective estrogen receptor modulators enhance CNS remyelination independent of estrogen receptors. J. Neurosci. 39, 2184–2194 (2019). · DOI
- Mei, F. et al. Accelerated remyelination during inflammatory demyelination prevents axonal loss and improves functional recovery. Elife 5, e18246 (2016). · DOI
- Mei, F. et al. Identification of the kappa-opioid receptor as a therapeutic target for oligodendrocyte remyelination. J. Neurosci. 36, 7925–7935 (2016). · DOI
- Taniguchi, H. et al. A resource of Cre driver lines for genetic targeting of GABAergic. Neurons Cereb. Cortex Neuron 71, 995–1013 (2011).
- Kang, S. H. et al. Degeneration and impaired regeneration of gray matter oligodendrocytes in amyotrophic lateral sclerosis. Nat. Neurosci. 16, 571–579 (2013). · DOI · Paper page
- Longair, M. H., Baker, D. A. & Armstrong, J. D. Simple Neurite Tracer: open source software for reconstruction, visualization and analysis of neuronal processes. Bioinformatics 27, 2453–2454 (2011). · DOI
- Papadopoulos, G. C., Parnavelas, J. G. & Buijs, R. M. Light and electron microscopic immunocytochemical analysis of the serotonin innervation of the rat visual cortex. J. Neurocytol. 16, 883–892 (1987). · DOI
- Papadopoulos, G. C., Parnavelas, J. G. & Buijs, R. M. Light and electron microscopic immunocytochemical analysis of the noradrenaline innervation of the rat visual cortex. J. Neurocytol. 18, 1–10 (1989). · DOI
- Papadopoulos, G. C., Parnavelas, J. G. & Buijs, R. M. Light and electron microscopic immunocytochemical analysis of the dopamine innervation of the rat visual cortex. J. Neurocytol. 18, 303–310 (1989). · DOI
Cited by
Sorted by citations
Axonal energy metabolism, and the effects in aging and neurodegenerative diseases
Yang, S., Park, J. H., & Lu, H.-C. (2023) · Molecular Neurodegeneration · doi:10.1186/s13024-023-00634-3 · Cited by 94
Kennedy, L., Morland, C., Narum, M., Bergersen, L. H., & Rinholm, J. E. (2025) · eneuro · doi:10.1523/eneuro.0563-24.2025 · Cited by 8
Zhang, Y., Cheng, Z., Huang, S., Sharma, T., Barbosa, D., Yu, G., & Sun, L. O. (2025) · Cell Reports · doi:10.1016/j.celrep.2025.116252 · Cited by 4
Metadata
- Authors
- Call, C. L., & Bergles, D. E.
- ORCID
- Bergles, Dwight E.
- Venue
- Nature Communications
- Published
- 2021-08-06
- Volume
- 12
- Issue
- 1
- ISSN
- 2041-1723
- PMC
- PMC8346564
- Cited by
- 95
- References
- 12
- Language
- en
- Funders
- Dr. Miriam and Sheldon G Adelson Medical Research Foundation
About these checks
Registry, retraction, Cites and statistics results are computed, not judged, with one exception: a printed reference that no index lists is read once by a model before it counts as a citation error. Claims are extracted by a model and kept only when their quote appears verbatim in the text; each cited source is then checked, with a model’s help, for whether it says what the claim relies on. Those verdicts can be wrong — read the claim’s quote and the cited source before relying on one.
Statistics and arithmetic are recomputed, not judged.
Confidence bands are shown only for fields calibrated on our annotated test set. None is calibrated yet, so no band is shown.
What counts as a claim ›How we measure confidence ›How we check this ›
Are you an author, or do you see a problem with this page? Request a review
