

The DOI matches its Crossref record; 70 of the 70 references it cites were found in a registry or an index; 39 of the 70 sources its claims cite were checked for support.
Spatial transcriptomics of healthy and fibrotic human liver at single-cell resolution
Open accessPublished version of a preprint
Abstract
Abstract Single-cell RNA sequencing (scRNA-seq) has advanced our understanding of cell types and their heterogeneity within the human liver, but the spatial organization at single-cell resolution has not yet been described. Here we apply multiplexed error robust fluorescent in situ hybridization (MERFISH) to map the zonal distribution of hepatocytes, resolve subsets of macrophage and mesenchymal populations, and investigate the relationship between hepatocyte ploidy and gene expression within the healthy human liver. We next integrated spatial information from MERFISH with the more complete transcriptome produced by single-nucleus RNA sequencing (snRNA-seq), revealing zonally enriched receptor-ligand interactions. Finally, analysis of fibrotic liver samples identified two hepatocyte populations that are not restricted to zonal distribution and expand with injury. Together these spatial maps of the healthy and fibrotic liver provide a deeper understanding of the cellular and spatial remodeling that drives disease which, in turn, could provide new avenues for intervention and further study.
Overview
AI snapshot
Written from the paper’s full text.
TL;DR
This study combines MERFISH spatial transcriptomics and snRNA-seq to map healthy and fibrotic human liver at single-cell resolution, profiling ~310,000 cells and 317 genes. It defines continuous hepatocyte zonation, spatially distinct macrophage and HSC subsets, zonally enriched receptor-ligand interactions, and two injury-expanded hepatocyte populations without clear zonal distributions.
Key findings
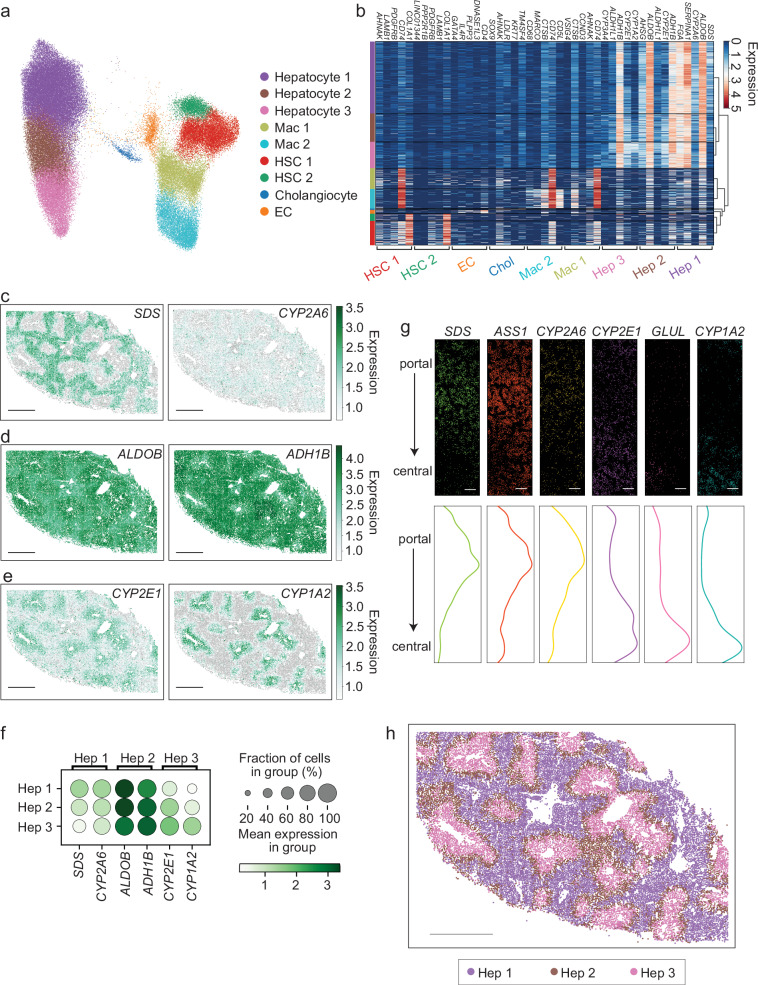
- Healthy liver MERFISH (~90,000 putative cells) resolved three hepatocyte clusters mapping to zones 1–3: SDS/CYP2A6 enriched in zone 1, ALDOB/ADH1B in zone 2, and CYP2E1/CYP1A2 in zone 3. Pseudotime and lobule-level gradients indicated hepatocyte zonation is better described as a continuous portal-to-central variable than as discrete zones.
- Non-parenchymal cells included two macrophage clusters (Mac 1 periportal-enriched; Mac 2 diffuse, CD5L+/MARCO+, Kupffer-like) and two HSC clusters (HSC 1 periportal-enriched; HSC 2 diffuse; differing mainly in CD74). Cholangiocytes were KRT7+ portal cells and ECs were DNASE1L3+ diffuse; no clear non-parenchymal zonation was observed.
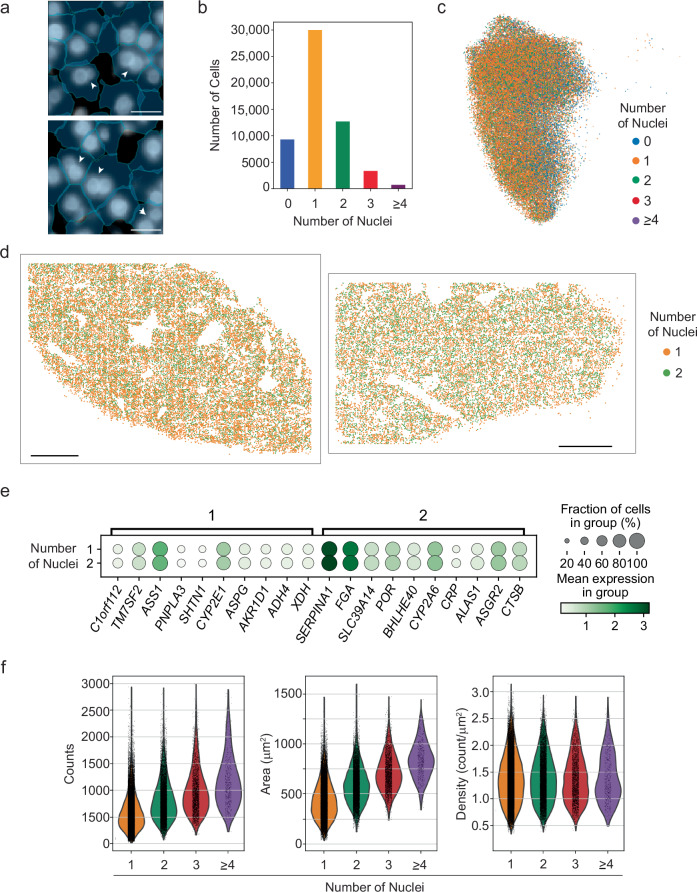
- Approximately one third of hepatocytes were multinucleated; their distribution did not change across zones, and no significant gene-expression differences were found between hepatocytes with one versus two nuclei. Multinucleated hepatocytes were larger and had more total RNA counts, but RNA density did not depend on nuclei number.
- In fibrosis, MERFISH profiled ~220,000 cells and snRNA-seq ~13,500 nuclei. Two hepatocyte populations (Fibrotic Hep 1 and 2) expanded with injury and lacked clear zonal distribution, while portal and central hepatocytes retained zonation; fibrotic macrophages lost MARCO, CD5L, and CD68, and fibrotic HSCs maintained high COL1A1. Urea-pathway genes including CPS1, SLC7A2, and SLC25A15 were enriched with injury.
Methods
- Paired MERFISH and snRNA-seq were performed on the same healthy and fibrotic human liver samples. MERFISH used a 317-gene panel focused on hepatocytes plus non-parenchymal markers, with Na+/K+-ATPase immunofluorescence for cell-boundary staining.
- Healthy tissue came from margins of surgical resections from three adult patients (two female, one male); fibrotic samples came from three additional donors. The study reports ~90,000 healthy MERFISH cells, ~15,000 healthy snRNA-seq nuclei, ~220,000 fibrotic MERFISH cells, and ~13,500 fibrotic snRNA-seq nuclei.
- Cells were segmented with Cellpose and Baysor, analyzed in Scanpy with Harmony batch correction and Leiden clustering, and integrated across MERFISH and snRNA-seq. Receptor-ligand interactions were inferred with CellPhoneDB; differential expression, GO, and GSEA were used for injury comparisons.
Limitations
- Stated in the paper: MERFISH covers only 317 genes, not the full transcriptome; the panel was not designed to explore diverse non-parenchymal pathways across zones, so the absence of observed non-parenchymal zonation may reflect panel content. Receptor-ligand results are hypothesis-generating only. Ploidy was not quantified separately, though the authors predict >80% of multinucleated hepatocytes are 2N. Small sample size precluded considering sex as a variable, and segmentation challenges were noted for HSC/macrophage markers in cholangiocytes. Lymphocyte and neutrophil populations were not defined because of insufficient marker genes in the panel.
- Evident from the text: healthy samples were resection margins without clear signs of acute or chronic injury rather than confirmed disease-free donor liver, and the small donor numbers limit generalizability. The experiments were not randomized and investigators were not blinded.
Model-written summary. Check it against the paper before relying on it.
Integrity signals
Registry
Cites
Statistics
Figures
Verification
Claims the paper makes
99 Own result · 16 Partly supported · 15 Own method · 11 No full text of the sources · 10 Own interpretation · 4 Supported · 3 Couldn’t confirm · 2 No basis given · 1 Supported so far · accuracy not yet measured
The cited sources support only part of this claim — read each source’s verdict below.
In the paper
“KRT7 and SOX9 were enriched in periportal areas consistent with cholangiocytes and include clusters suggestive of longitudinal sections of small bile ducts (Supplementary Fig. 2g–l), while DNASE13 and INMT expression were scattered through the parenchyma consistent with the distribution of ECs10 (Supplementary Fig. 2g–l).”
§ Spatial transcriptomics of healthy and fibrotic human liver at single-cell resolution > Results > Spatial organization of hepatocytes in the human liver
What the sources say
- Partly supportedcites [10] MacParland, S. A. et al. Single cell RNA sequencing of human liver reveals distinct intrahepatic macrophage populations. Nat. Commun. 9, 4383 (2018). sourceExperimental — accuracy not yet measured
The Results section, “Liver endothelial cells” (page unavailable), lists INMT and DNASE1L3 among genes enriched in an endothelial-cell cluster, supporting the endothelial-cell association. It does not show that expression of either gene was scattered through the parenchyma; its spatial staining analysis concerns CD32B. The cited gene is written DNASE1L3, rather than DNASE13, in our copy. (LLM, conf=0.86)
plaincorrelational- Asserted: passes — The authors put it forward as true.
- Checkable: passes — It can be checked against evidence.
- Load-bearing: unclear — It is unclear whether the paper’s conclusions depend on it.
- Based: passes — The paper gives a reason why it holds.
- Partly supported
The cited sources support only part of this claim — read each source’s verdict below.
In the paper
“While sub-populations of macrophages and HSCs in the healthy human liver have been described in single-cell data10–12, these subpopulations, and potential gene expression variations within, have not been resolved within the lobule organization at single-cell resolution in the human liver.”
§ Spatial transcriptomics of healthy and fibrotic human liver at single-cell resolution > Introduction
What the sources say
- Partly supportedcites [10] MacParland, S. A. et al. Single cell RNA sequencing of human liver reveals distinct intrahepatic macrophage populations. Nat. Commun. 9, 4383 (2018). sourceExperimental — accuracy not yet measured
The Introduction reports two distinct liver-resident macrophage populations identified by single-cell RNA sequencing. But the Results section on hepatic stellate cells identifies only one HSC cluster (Cluster 20), not HSC subpopulations. The copy supplies section labels but no page numbers. (LLM, conf=0.88)
- Partly supportedcites [11] Ramachandran, P. et al. Resolving the fibrotic niche of human liver cirrhosis at single-cell level. Nature 38, 1–29 (2019). sourceExperimental — accuracy not yet measured
The Results section on macrophages identifies distinct Kupffer-cell clusters in human liver samples that included healthy livers, supporting the macrophage portion. The Results section on mesenchymal cells identifies one cluster as hepatic stellate cells and distinguishes it from other mesenchymal populations, but does not describe multiple HSC subpopulations in healthy human liver. (LLM, conf=0.84)
- Supportedcites [12] Andrews, T. S. et al. Single‐Cell, Single‐Nucleus, and Spatial RNA Sequencing of the Human Liver Identifies Cholangiocyte and Mesenchymal Heterogeneity. Hepatol. Commun. 6, 821–840 (2021). source
The Results sections on intrahepatic monocytes/macrophages and liver mesenchymal cells describe distinct macrophage populations and identify Mes1 and Mes5 as HSC populations in healthy human liver. The HSC distinction comes chiefly from the paper’s combined single-cell and single-nucleus dataset, with most mesenchymal clusters captured primarily by single-nucleus sequencing. The provided copy gives section labels but no page numbers. (LLM, conf=0.90)
plain- Asserted: passes — The authors put it forward as true.
- Checkable: passes — It can be checked against evidence.
- Load-bearing: passes — The paper’s conclusions depend on it.
- Based: passes — The paper gives a reason why it holds.
- Partly supported
Every source the paper cites for this claim was checked and supports it.
In the paper
“We observed sheets of cells expressing ALDOB, consistent with hepatocytes21 (Supplementary Fig. 2), while CD5L expression was clustered in spaces between hepatocytes consistent with resident macrophages located in sinusoids10 (Supplementary Fig. 2a–f).”
§ Spatial transcriptomics of healthy and fibrotic human liver at single-cell resolution > Results > Spatial organization of hepatocytes in the human liver
What the sources say
- Supportedcites [10] MacParland, S. A. et al. Single cell RNA sequencing of human liver reveals distinct intrahepatic macrophage populations. Nat. Commun. 9, 4383 (2018). source
The Results (Intrahepatic monocytes/macrophages; page unavailable) identify CD5L as enriched in a liver macrophage population. The Discussion’s Fig. 10 description (page unavailable) places macrophages in the sinusoidal liver architecture. The spatial pattern of CD5L expression is the citing authors’ own observation, not a finding attributed to this source. (LLM, conf=0.87)
hedgedcorrelational- Asserted: passes — The authors put it forward as true.
- Checkable: passes — It can be checked against evidence.
- Load-bearing: unclear — It is unclear whether the paper’s conclusions depend on it.
- Based: passes — The paper gives a reason why it holds.
- Supported
The cited sources that could be checked couldn’t confirm or dispute this claim.
In the paper
“We observed sheets of cells expressing ALDOB, consistent with hepatocytes21 (Supplementary Fig. 2), while CD5L expression was clustered in spaces between hepatocytes consistent with resident macrophages located in sinusoids10 (Supplementary Fig. 2a–f).”
§ Spatial transcriptomics of healthy and fibrotic human liver at single-cell resolution > Results > Spatial organization of hepatocytes in the human liver
What the sources say
- Could not verifycites [21] Aizarani, N. et al. A human liver cell atlas reveals heterogeneity and epithelial progenitors. Nature 472, 199–204 (2019). sourceExperimental — accuracy not yet measured
The Zonation of human liver cell types section identifies other hepatocyte-associated genes, including ALB and PCK1, but does not mention ALDOB. Searches of our copy for ALDOB, aldolase B, and hepatocyte sheets found no passage linking ALDOB expression to hepatocytes or describing the sheet-like pattern. (LLM, conf=0.70)
plaincorrelational- Asserted: passes — The authors put it forward as true.
- Checkable: passes — It can be checked against evidence.
- Load-bearing: unclear — It is unclear whether the paper’s conclusions depend on it.
- Based: passes — The paper gives a reason why it holds.
- Could not verify
The cited sources support only part of this claim — read each source’s verdict below.
In the paper
“Collectively, these observations suggest that spatial gene expression in human hepatocytes is better described by a continuous variable determined by the relative distance between the portal and central areas of the lobule, similar to observations in mouse7,26,27.”
§ Spatial transcriptomics of healthy and fibrotic human liver at single-cell resolution > Results > Spatial organization of hepatocytes in the human liver
What the sources say
- Partly supportedcites [7] Droin, C. et al. Space-time logic of liver gene expression at sub-lobular scale. Nat. Metab. 3, 43–58 (2021). sourceExperimental — accuracy not yet measured
The Results section describes spatial gene-expression profiles along the central–portal axis in mouse hepatocytes, supporting the comparison to mouse zonation. The study assigns cells to eight lobule layers using gene-expression landmarks; it does not establish that human hepatocyte expression is better described by a continuous variable determined by relative distance from the portal and central areas. Page numbers are unavailable in our copy. (LLM, conf=0.86)
- Supportedcites [26] Halpern, K. B. et al. Single-cell spatial reconstruction reveals global division of labour in the mammalian liver. Nature 542, 352–356 (2017). source
The main text reports spatial gene-expression gradients along the porto-central lobule axis in fasted mice and says its findings challenge a binary periportal-versus-pericentral classification. This supports the cited comparison to mouse observations; the sentence presents the human finding as the citing authors’ own observation, not as a result of this source. (LLM, conf=0.91)
- Partly supportedcites [27] González-Blas, C. B. et al. Single-cell spatial multi-omics and deep learning dissect enhancer-driven gene regulatory networks in liver zonation. Nat. Cell Biol. 26, 153–167 (2018). sourceExperimental — accuracy not yet measured
The 'Zonation drives cell state heterogeneity in hepatocytes' section reports a gene-expression gradient along the portocentral axis, and Fig. 1 identifies the atlas as mouse liver (page not provided). This supports the mouse comparison, but the cited paper does not establish that the same continuous description applies to human hepatocytes. (LLM, conf=0.87)
hedgedcorrelational- Asserted: passes — The authors put it forward as true.
- Checkable: passes — It can be checked against evidence.
- Load-bearing: passes — The paper’s conclusions depend on it.
- Based: passes — The paper gives a reason why it holds.
- Partly supported
The cited sources support only part of this claim — read each source’s verdict below.
In the paper
“Specifically, we focused this analysis only on receptor-ligand interactions that are uniquely enriched between hepatocytes of specific zones and the cell types in close proximity to these zonated hepatocytes (Fig. 3c, Supplementary Data 3).”
§ Spatial transcriptomics of healthy and fibrotic human liver at single-cell resolution > Results > Hepatocyte zonation shapes interactions with non-parenchymal cells
What the sources say
- Partly supportedcites [31] Vento-Tormo, R. et al. Single-cell reconstruction of the early maternal–fetal interface in humans. Nature 563, 347–353 (2018). sourceExperimental — accuracy not yet measured
The Methods describe CellPhoneDB as a framework for identifying receptor–ligand interactions enriched between cell types. The ‘Cell communication predicted by CellPhoneDB’ section applies it to the maternal–fetal interface, not to zonated hepatocytes or nearby liver cell types. The hepatocyte-specific finding is therefore not supported by this source. (LLM, conf=0.88)
plaincorrelational- Asserted: passes — The authors put it forward as true.
- Checkable: passes — It can be checked against evidence.
- Load-bearing: passes — The paper’s conclusions depend on it.
- Based: passes — The paper gives a reason why it holds.
- Rests on an assumption: Co-expression of receptor-ligand pairs in snRNA-seq data indicates potential cell-cell interactions in situ.
- Partly supported
The cited sources support only part of this claim — read each source’s verdict below.
In the paper
“all of which are evolutionarily conserved markers of Kupffer cells43”
§ Spatial transcriptomics of healthy and fibrotic human liver at single-cell resolution > Discussion
What the sources say
- Partly supportedcites [43] Guilliams, M. et al. Spatial proteogenomics reveals distinct and evolutionarily conserved hepatic macrophage niches. Cell 185, 379–396.e38 (2022). sourceExperimental — accuracy not yet measured
The section “Evolutionarily conserved transcriptomic and proteomic identity of KCs” (p. 11) identifies CD163 as a useful marker of human Kupffer cells. It discusses a conserved Kupffer-cell signature, but our copy does not identify CD163, VCAM1, or TMEM26 as evolutionarily conserved markers; it does not substantiate that qualification for the three named markers. (LLM, conf=0.87)
plaincorrelational- Asserted: passes — The authors put it forward as true.
- Checkable: passes — It can be checked against evidence.
- Load-bearing: passes — The paper’s conclusions depend on it.
- Based: passes — The paper gives a reason why it holds.
- Partly supported
The cited sources support only part of this claim — read each source’s verdict below.
In the paper
“While MERFISH allows to us to define these zones, it is also evident through pseudotime analysis, measurement of gene expression across individual lobules, and transcriptional analysis performed across lobules, that zonation reflects a gradient from periportal to pericentral regions rather than distinct zones.”
§ Spatial transcriptomics of healthy and fibrotic human liver at single-cell resolution > Discussion
What the sources say
- Partly supportedcites [26] Halpern, K. B. et al. Single-cell spatial reconstruction reveals global division of labour in the mammalian liver. Nature 542, 352–356 (2017). sourceExperimental — accuracy not yet measured
The main text reports clear hepatocyte expression gradients and says the findings challenge a binary periportal–pericentral classification. However, it specifies that the zonation profiles studied were from fasted mice, not healthy human liver. The paper therefore supports the gradient interpretation but not the claimed human population. (LLM, conf=0.88)
- Partly supportedcites [27] González-Blas, C. B. et al. Single-cell spatial multi-omics and deep learning dissect enhancer-driven gene regulatory networks in liver zonation. Nat. Cell Biol. 26, 153–167 (2018). sourceExperimental — accuracy not yet measured
The section “Zonation drives cell state heterogeneity in hepatocytes” reports a periportal-to-pericentral hepatocyte gradient in animals, supported by gene expression and chromatin accessibility. But it also identifies three major, overlapping zones. The human-liver analysis reports similar chromatin-accessibility patterns along the axis, not that healthy human hepatocytes form a continuous gradient rather than distinct zones. Page numbers are unavailable in our copy. (LLM, conf=0.86)
plain- Asserted: passes — The authors put it forward as true.
- Checkable: passes — It can be checked against evidence.
- Load-bearing: passes — The paper’s conclusions depend on it.
- Based: passes — The paper gives a reason why it holds.
- Partly supported
The cited sources that could be checked couldn’t confirm or dispute this claim.
In the paper
“most consistent with Kupffer cells”
§ Spatial transcriptomics of healthy and fibrotic human liver at single-cell resolution > Discussion
What the sources say
- Could not verifycites [43] Guilliams, M. et al. Spatial proteogenomics reveals distinct and evolutionarily conserved hepatic macrophage niches. Cell 185, 379–396.e38 (2022). sourceExperimental — accuracy not yet measured
The section “Refined analysis of myeloid cells identifies three subsets of hepatic macrophages” (p. 7) distinguishes Kupffer cells from other macrophage populations, but does not identify a population called “Mac 2.” Searches for “Mac 2,” “Mac2 Kupffer cells,” and “macrophage cluster 2” found no passage linking that label to Kupffer cells. (LLM, conf=0.74)
hedgedcorrelational- Asserted: passes — The authors put it forward as true.
- Checkable: passes — It can be checked against evidence.
- Load-bearing: passes — The paper’s conclusions depend on it.
- Based: passes — The paper gives a reason why it holds.
- Could not verify
The cited sources support only part of this claim — read each source’s verdict below.
In the paper
“we do not observe the increased expression of GPNMB, SPP1, or LGALS1 in Mac 1 cells necessary to link them to lipid associated macrophages (LAMs)”
§ Spatial transcriptomics of healthy and fibrotic human liver at single-cell resolution > Discussion
What the sources say
- Partly supportedcites [43] Guilliams, M. et al. Spatial proteogenomics reveals distinct and evolutionarily conserved hepatic macrophage niches. Cell 185, 379–396.e38 (2022). sourceExperimental — accuracy not yet measured
The section “Refined analysis of myeloid cells” (p. 7) identifies Gpnmb- and Spp1-expressing macrophages as LAM-like, while “LAM location is altered in the steatotic liver” (p. 11) discusses Mac1 separately from LAMs. Our copy does not establish LGALS1 as a required LAM marker. The statement that the citing authors did not observe increased expression in their own Mac 1 cells is their observation, not a finding attributed to this source. (LLM, conf=0.85)
- Partly supportedcites [44] Remmerie, A. et al. Osteopontin Expression Identifies a Subset of Recruited Macrophages Distinct from Kupffer Cells in the Fatty Liver. Immunity 53, 641–657.e14 (2020). sourceExperimental — accuracy not yet measured
In Results, under “Hepatic Lipid-Associated Macs Differentiate in MAFLD” (page unavailable), the paper identifies Mac1 cells as pre-moKCs and Mac2 cells as hepatic LAMs, with Spp1 and Gpnmb enriched in Mac2. This supports using those two genes to distinguish the populations, but our copy does not establish LGALS1 as a LAM marker or say that increased expression of all three is necessary to link cells to LAMs. The citing authors’ observation about their own Mac 1 cells is not a finding attributed to this source. (LLM, conf=0.86)
plain- Asserted: passes — The authors put it forward as true.
- Checkable: passes — It can be checked against evidence.
- Load-bearing: passes — The paper’s conclusions depend on it.
- Based: passes — The paper gives a reason why it holds.
- Partly supported
- Probably not a substantial claim. 30
- It may state two separate claims as one. 73
- The quote only partly states this claim. 2
The cited sources support only part of this claim — read each source’s verdict below.
In the paper
“The liver is composed of parenchymal, non-parenchymal, and immune cells that are organized into anatomic structures called lobules, which are 0.5–1 mm in diameter and defined by sites of portal venous and arterial inflow and central venous outflow1,2.”
§ Spatial transcriptomics of healthy and fibrotic human liver at single-cell resolution > Introduction
What the sources say
- Partly supportedcites [1] Rezania, V., Coombe, D. & Tuszynski, J. A. A physiologically-based flow network model for hepatic drug elimination III: 2D/3D DLA lobule models. Theor. Biol. Med. Model 13, 9 (2016). sourceExperimental — accuracy not yet measured
The Background section, “The liver lobule functional unit” (page unavailable), describes a classic lobule with a central hepatic venule and portal tracts at its corners. The Background also mentions flow from portal vein and hepatic artery segments to a hepatic vein in a model it discusses. Our copy does not give a 0.5–1 mm lobule diameter; its Methods describe a modeled diameter of 1.536 mm. Thus the vascular description is supported, but the stated diameter is not. (LLM, conf=0.85)
- Not checked — no full text of the sourcecites [2] Teutsch, H. F. The modular microarchitecture of human liver. Hepatology 42, 317–325 (2005). source
plain- Asserted: passes — The authors put it forward as true.
- Checkable: passes — It can be checked against evidence.
- Load-bearing: fails — The paper’s conclusions may not depend on it.
- Based: passes — The paper gives a reason why it holds.
Probably not a substantial claim. The paper’s conclusions may not depend on it. It may state two separate claims as one.
- Partly supported
The cited sources support only part of this claim — read each source’s verdict below.
In the paper
“SDS was enriched in zone 1 (periportal), while CYP2E1 expression increased in zone 3 (pericentral), as previously described in mouse24–27 (Fig. 1c, e, f; Supplementary Fig. 5a).”
§ Spatial transcriptomics of healthy and fibrotic human liver at single-cell resolution > Results > Spatial organization of hepatocytes in the human liver
What the sources say
- Supportedcites [24] Braeuning, A. et al. Differential gene expression in periportal and perivenous mouse hepatocytes. Febs J. 273, 5051–5061 (2006). source
The Amino acid degradation section reports preferential periportal expression of serine dehydratase (Sds). The Xenobiotic metabolism section’s table reports a negative perivenous-versus-periportal ratio for Sds and positive ratios for Cyp2e1, supporting periportal Sds and perivenous (pericentral) Cyp2e1 expression in mouse hepatocytes. Page numbers are not available in our copy. (LLM, conf=0.94)
- Not checked — no full text of the sourcecites [25] Saito, K., Negishi, M. & Squires, E. J. Sexual dimorphisms in zonal gene expression in mouse liver. Biochem. Biophys. Res. Commun. 436, 730–735 (2013). source
- Could not verifycites [26] Halpern, K. B. et al. Single-cell spatial reconstruction reveals global division of labour in the mammalian liver. Nature 542, 352–356 (2017). sourceExperimental — accuracy not yet measured
The Extended Data Figure 9 caption reports a pericentral bias for liver detoxification genes, including cytochrome P450 genes, but does not identify CYP2E1. Searches for SDS and CYP2E1 found no passages in our copy stating either gene’s zonation, so the specific mouse findings attributed to this paper cannot be verified. (LLM, conf=0.72)
- Partly supportedcites [27] González-Blas, C. B. et al. Single-cell spatial multi-omics and deep learning dissect enhancer-driven gene regulatory networks in liver zonation. Nat. Cell Biol. 26, 153–167 (2018). sourceExperimental — accuracy not yet measured
In “Zonation drives cell state heterogeneity in hepatocytes” (page unavailable), the paper identifies a Cyp2e1-positive zone encompassing pericentral and mid-lobular mouse hepatocytes, supporting the pericentral part of the claim. The Fig. 1 caption names Sds among genes imaged by smFISH but does not state that it is enriched in periportal zone 1. (LLM, conf=0.84)
plaincorrelational- Asserted: passes — The authors put it forward as true.
- Checkable: passes — It can be checked against evidence.
- Load-bearing: passes — The paper’s conclusions depend on it.
- Based: passes — The paper gives a reason why it holds.
It may state two separate claims as one.
- Supported
The cited sources support only part of this claim — read each source’s verdict below.
In the paper
“Beyond metabolism, morphogen expression, such as that of Wnt-family members, is also shaped by this zonation and can vary in time7.”
§ Spatial transcriptomics of healthy and fibrotic human liver at single-cell resolution > Introduction
What the sources say
- Partly supportedcites [7] Droin, C. et al. Space-time logic of liver gene expression at sub-lobular scale. Nat. Metab. 3, 43–58 (2021). sourceExperimental — accuracy not yet measured
The Results section reports that Wnt2 expression in pericentral non-parenchymal liver cells varies around the clock, supporting the temporal part of the claim. The Discussion describes Wnt ligands as forming a spatial gradient that contributes to zonated Wnt-target expression in hepatocytes; it does not show that hepatocyte zonation shapes morphogen expression. (LLM, conf=0.85)
plaindirect- Asserted: passes — The authors put it forward as true.
- Checkable: passes — It can be checked against evidence.
- Load-bearing: fails — The paper’s conclusions may not depend on it.
- Based: passes — The paper gives a reason why it holds.
Probably not a substantial claim. The paper’s conclusions may not depend on it. It may state two separate claims as one.
- Partly supported
The cited sources support only part of this claim — read each source’s verdict below.
In the paper
“For example, hepatocytes in zone 1 are more involved in gluconeogenesis and beta-oxidation, reflecting the relatively oxygen- and nutrient-rich environment near the portal vein and hepatic artery, whereas hepatocytes in zone 3 are more active in glycolysis and lipogenesis, reflecting the depletion of oxygen and nutrients near the central vein3,4,6.”
§ Spatial transcriptomics of healthy and fibrotic human liver at single-cell resolution > Introduction
What the sources say
- Not checked — no full text of the sourcecites [3] Gebhardt, R. Metabolic zonation of the liver: Regulation and implications for liver function. Pharm. Therapeut 53, 275–354 (1992). source
- Not checked — no full text of the sourcecites [4] Jungermann, K. & Keitzmann, T. Zonation of Parenchymal and Nonparenchymal Metabolism in Liver. Annu Rev. Nutr. 16, 179–203 (1996). source
- Partly supportedcites [6] Kietzmann, T. Metabolic zonation of the liver: The oxygen gradient revisited. Redox Biol. 11, 622–630 (2017). sourceExperimental — accuracy not yet measured
The 'Factors involved in the regulation of zonation' section says oxygen falls toward the perivenous region and that blood flow creates substrate gradients. 'Hedgehog signaling' reports that FASN, a lipogenic enzyme, is perivenous in control mice, supporting the lipogenesis portion. The copy does not establish that zone 3 hepatocytes are more active in glycolysis or that depletion of both oxygen and nutrients explains both activities. (LLM, conf=0.84)
plaindirect- Asserted: passes — The authors put it forward as true.
- Checkable: passes — It can be checked against evidence.
- Load-bearing: fails — The paper’s conclusions may not depend on it.
- Based: passes — The paper gives a reason why it holds.
Probably not a substantial claim. The paper’s conclusions may not depend on it.
The cited sources support only part of this claim — read each source’s verdict below.
In the paper
“For example, hepatocytes in zone 1 are more involved in gluconeogenesis and beta-oxidation, reflecting the relatively oxygen- and nutrient-rich environment near the portal vein and hepatic artery, whereas hepatocytes in zone 3 are more active in glycolysis and lipogenesis, reflecting the depletion of oxygen and nutrients near the central vein3,4,6.”
§ Spatial transcriptomics of healthy and fibrotic human liver at single-cell resolution > Introduction
What the sources say
- Not checked — no full text of the sourcecites [3] Gebhardt, R. Metabolic zonation of the liver: Regulation and implications for liver function. Pharm. Therapeut 53, 275–354 (1992). source
- Not checked — no full text of the sourcecites [4] Jungermann, K. & Keitzmann, T. Zonation of Parenchymal and Nonparenchymal Metabolism in Liver. Annu Rev. Nutr. 16, 179–203 (1996). source
- Partly supportedcites [6] Kietzmann, T. Metabolic zonation of the liver: The oxygen gradient revisited. Redox Biol. 11, 622–630 (2017). sourceExperimental — accuracy not yet measured
The section “Hypoxia, HIFs, and hedgehog signaling: another liaison” says fatty-acid oxidation is more pronounced in periportal hepatocytes under starvation. “Factors involved in the regulation of zonation” describes higher oxygen levels near the portal vein and hepatic artery and gradients of substrates along the blood flow. Our copy does not specifically place gluconeogenesis in zone 1, and the oxidation finding carries a starvation qualifier absent from the claim. (LLM, conf=0.86)
plaindirect- Asserted: passes — The authors put it forward as true.
- Checkable: passes — It can be checked against evidence.
- Load-bearing: fails — The paper’s conclusions may not depend on it.
- Based: passes — The paper gives a reason why it holds.
Probably not a substantial claim. The paper’s conclusions may not depend on it. It may state two separate claims as one.
The cited sources support only part of this claim — read each source’s verdict below.
In the paper
“Collectively, these observations are consistent with the classic zonation described in human and mouse liver4,24–26, supporting our MERFISH measurements.”
§ Spatial transcriptomics of healthy and fibrotic human liver at single-cell resolution > Results > Spatial organization of hepatocytes in the human liver
What the sources say
- Not checked — no full text of the sourcecites [4] Jungermann, K. & Keitzmann, T. Zonation of Parenchymal and Nonparenchymal Metabolism in Liver. Annu Rev. Nutr. 16, 179–203 (1996). source
- Supportedcites [24] Braeuning, A. et al. Differential gene expression in periportal and perivenous mouse hepatocytes. Febs J. 273, 5051–5061 (2006). source
The Expression profiles section reports distinct periportal and perivenous gene expression in mouse hepatocytes, and the Discussion relates those findings to well-established liver zonation. This supports the mouse-liver portion of the multi-cited statement; the MERFISH interpretation is the citing authors’ own. (LLM, conf=0.90)
- Not checked — no full text of the sourcecites [25] Saito, K., Negishi, M. & Squires, E. J. Sexual dimorphisms in zonal gene expression in mouse liver. Biochem. Biophys. Res. Commun. 436, 730–735 (2013). source
- Partly supportedcites [26] Halpern, K. B. et al. Single-cell spatial reconstruction reveals global division of labour in the mammalian liver. Nature 542, 352–356 (2017). sourceExperimental — accuracy not yet measured
The main text describes established liver zonation and reports zonation profiles in mouse liver; it also says those profiles correlated with earlier datasets. This supports the mouse-liver portion of the cited background, but the paper does not establish zonation in human liver. The statement that this supports the citing authors’ MERFISH measurements is their own inference. (LLM, conf=0.84)
plaincorrelational- Asserted: passes — The authors put it forward as true.
- Checkable: passes — It can be checked against evidence.
- Load-bearing: passes — The paper’s conclusions depend on it.
- Based: passes — The paper gives a reason why it holds.
It may state two separate claims as one.
The cited sources that could be checked couldn’t confirm or dispute this claim.
In the paper
“PDGFRB expression was concentrated along the edges of ALDOB-expressing hepatocytes in a distribution expected for HSCs, which are located in the subendothelial space11 (Supplementary Fig. 2a–f).”
§ Spatial transcriptomics of healthy and fibrotic human liver at single-cell resolution > Results > Spatial organization of hepatocytes in the human liver
What the sources say
- Could not verifycites [11] Ramachandran, P. et al. Resolving the fibrotic niche of human liver cirrhosis at single-cell level. Nature 38, 1–29 (2019). sourceExperimental — accuracy not yet measured
The citation is attached to the statement that hepatic stellate cells occupy the subendothelial space. The Results section on mesenchymal cells identifies an HSC population by RGS5 staining, but our copy does not state its subendothelial location. Searches for “subendothelial” and “space of Disse” found no passage establishing that location; the PDGFRB–ALDOB staining is attributed to the citing paper’s supplementary figure. (LLM, conf=0.70)
plaincorrelational- Asserted: passes — The authors put it forward as true.
- Checkable: passes — It can be checked against evidence.
- Load-bearing: unclear — It is unclear whether the paper’s conclusions depend on it.
- Based: passes — The paper gives a reason why it holds.
It may state two separate claims as one.
- Could not verify
Every source the paper cites for this claim was checked and supports it.
In the paper
“We did not note clear patterns of zonation in gene expression within these non-parenchymal populations28–30, suggesting that, if such gradients exist in the human liver, our MERFISH library does not contain the proper genes to capture them.”
§ Spatial transcriptomics of healthy and fibrotic human liver at single-cell resolution > Results > Spatial organization of non-parenchymal cells in the human liver
What the sources say
- Supportedcites [28] Halpern, K. B. et al. Paired-cell sequencing enables spatial gene expression mapping of liver endothelial cells. Nat. Biotechnol. 36, 962–970 (2018). source
The Results section (“Global zonation of LEC gene expression”; page unavailable) reports significant zonation in 475 liver endothelial-cell genes, supporting the citation’s role as an example of zonation in a non-parenchymal population. The absence of clear patterns and the proposed MERFISH-library explanation are the citing authors’ own observations, not findings attributed to this source. (LLM, conf=0.90)
- Supportedcites [29] Dobie, R. et al. Single-Cell Transcriptomics Uncovers Zonation of Function in the Mesenchyme during Liver Fibrosis. Cell Rep. 29, 1832–1847.e8 (2019). source
The citation accompanies the reference to non-parenchymal populations, not the citing authors’ report that their MERFISH analysis found no clear pattern. In Results, “Uncovering HSC Zonation across the Healthy Liver Lobule,” the source reports zonal gene expression in human hepatic stellate cells, a non-parenchymal population. The MERFISH finding and explanation are the citing authors’ own. (LLM, conf=0.91)
- Supportedcites [30] Inverso, D. et al. A spatial vascular transcriptomic, proteomic, and phosphoproteomic atlas unveils an angiocrine Tie–Wnt signaling axis in the liver. Dev. Cell 56, 1677–1693.e10 (2021). source
The Results section, “Transcriptome zonation defines distinct L-EC signatures” (page unavailable), reports 4,943 significantly zonated genes in liver endothelial cells, a non-parenchymal population. This supports citing the paper as evidence that such gradients can exist. The lack of a clear pattern in the human MERFISH data, and the proposed library explanation, are the citing authors’ own observations and inference. (LLM, conf=0.87)
hedged- Asserted: passes — The authors put it forward as true.
- Checkable: passes — It can be checked against evidence.
- Load-bearing: unclear — It is unclear whether the paper’s conclusions depend on it.
- Based: passes — The paper gives a reason why it holds.
It may state two separate claims as one.
- Supported
Every source the paper cites for this claim was checked and supports it.
In the paper
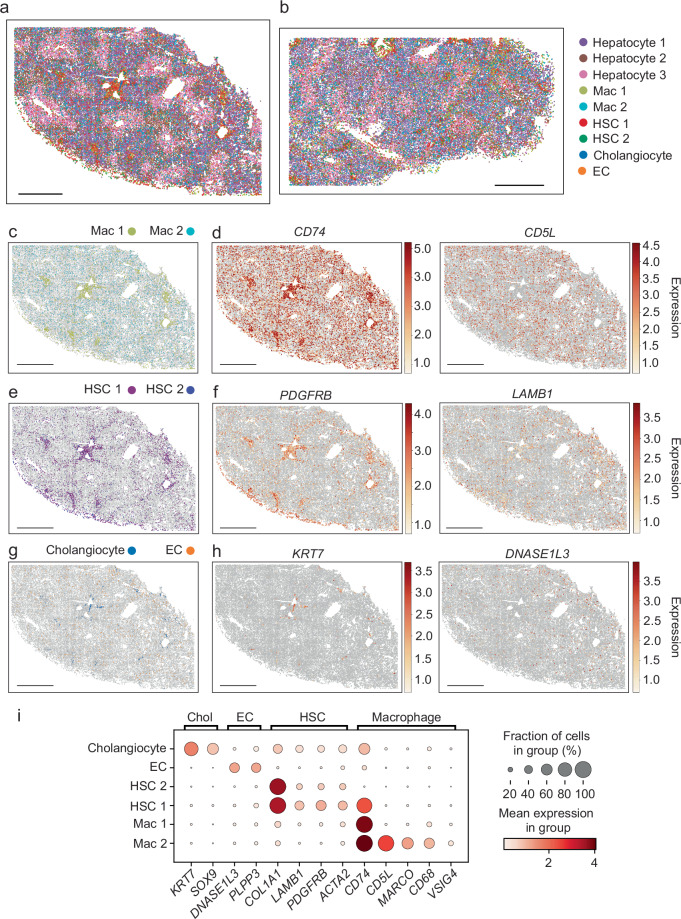
“Both macrophage populations were identified by expression of CD74, while Mac 2 cells also expressed CD5L and MARCO (Fig. 2d, i; Supplementary Fig. 6b), most consistent with non-inflammatory macrophages or Kupffer cells10,11,21.”
§ Spatial transcriptomics of healthy and fibrotic human liver at single-cell resolution > Results > Spatial organization of non-parenchymal cells in the human liver
What the sources say
- Supportedcites [10] MacParland, S. A. et al. Single cell RNA sequencing of human liver reveals distinct intrahepatic macrophage populations. Nat. Commun. 9, 4383 (2018). source
The citation is attached to the interpretation of Mac 2 as non-inflammatory macrophages or Kupffer cells. In Results, the paper identifies a CD5L- and MARCO-enriched macrophage population with tolerance-related pathways and describes MARCO-positive cells as non-inflammatory Kupffer cells. (LLM, conf=0.92)
- Supportedcites [11] Ramachandran, P. et al. Resolving the fibrotic niche of human liver cirrhosis at single-cell level. Nature 38, 1–29 (2019). source
The Results section, “Distinct macrophage subpopulations inhabit the fibrotic niche” (page unavailable), identifies MARCO-enriched clusters as Kupffer cells. This supports the citation’s use of MARCO expression to interpret Mac 2 as Kupffer-like; the citing paper’s own figures, rather than this source, supply the Mac 2, CD74 and CD5L observations. (LLM, conf=0.88)
- Supportedcites [21] Aizarani, N. et al. A human liver cell atlas reveals heterogeneity and epithelial progenitors. Nature 472, 199–204 (2019). source
The 'Human liver immune cell populations' section identifies Kupffer-cell subpopulations, and the Extended Data Figure 4 caption describes one subset as metabolic/immunoregulatory. This supports the cited interpretation of a non-inflammatory macrophage or Kupffer-cell identity; the Mac 2 marker observations are attributed to the citing paper's own figures. (LLM, conf=0.86)
hedgedcorrelational- Asserted: passes — The authors put it forward as true.
- Checkable: passes — It can be checked against evidence.
- Load-bearing: unclear — It is unclear whether the paper’s conclusions depend on it.
- Based: passes — The paper gives a reason why it holds.
It may state two separate claims as one.
- Supported
The sources with a verdict support this claim; the rest weren’t checked yet, have no full text we could read, or their verdicts aren’t rated yet.
In the paper
“CD74 is expressed by HSCs, can be induced by inflammatory signals such as IFN-γ and can promote immune activation through MHC class II-mediated interactions46,47.”
§ Spatial transcriptomics of healthy and fibrotic human liver at single-cell resolution > Discussion
What the sources say
- Supportedcites [46] Maubach, G., Lim, M. C. C., Kumar, S. & Zhuo, L. Expression and upregulation of cathepsin S and other early molecules required for antigen presentation in activated hepatic stellate cells upon IFN-γ treatment. Biochim. Biophys. Acta (BBA) - Mol. Cell Res. 1773, 219–231 (2007). source
Section 3.4 reports CD74 expression in activated HSCs and its significant induction by IFN-γ. The Discussion identifies CD74 as the invariant chain involved in MHC class II assembly, while the Introduction reports that HSCs can activate T cells. Together, these passages support the claim's qualified description of a role in immune activation. (LLM, conf=0.87)
- Not checked — no full text of the sourcecites [47] Viñas, O. et al. Human hepatic stellate cells show features of antigen‐presenting cells and stimulate lymphocyte proliferation. Hepatology 38, 919–929 (2003). source
plaindirect- Asserted: passes — The authors put it forward as true.
- Checkable: passes — It can be checked against evidence.
- Load-bearing: fails — The paper’s conclusions may not depend on it.
- Based: passes — The paper gives a reason why it holds.
Probably not a substantial claim. The paper’s conclusions may not depend on it. It may state two separate claims as one.
- Supported
The cited sources support only part of this claim — read each source’s verdict below.
In the paper
“THRB, which encodes the protein target of resmetirom, a medication shown to be effective in treating nonalcoholic steatohepatitis42”
§ Spatial transcriptomics of healthy and fibrotic human liver at single-cell resolution > Discussion
What the sources say
- Partly supportedcites [42] Harrison, S. A. et al. A Phase 3, Randomized, Controlled Trial of Resmetirom in NASH with Liver Fibrosis. N. Engl. J. Med. 390, 497–509 (2024). sourceExperimental — accuracy not yet measured
The abstract (p. 2) identifies thyroid hormone receptor beta as resmetirom’s target, and the Efficacy section (p. 9) reports better NASH-resolution and fibrosis outcomes than placebo at week 52. Our copy does not state that the THRB gene encodes that receptor, so the gene-to-target part of the claim is not directly supported. (LLM, conf=0.82)
plain- Asserted: passes — The authors put it forward as true.
- Checkable: passes — It can be checked against evidence.
- Load-bearing: fails — The paper’s conclusions may not depend on it.
- Based: passes — The paper gives a reason why it holds.
Probably not a substantial claim. The paper’s conclusions may not depend on it. It may state two separate claims as one.
- Partly supported
The cited sources support only part of this claim — read each source’s verdict below.
In the paper
“which may influence metabolic dysfunction associated steatotic liver disease (MASLD)48”
§ Spatial transcriptomics of healthy and fibrotic human liver at single-cell resolution > Discussion
What the sources say
- Partly supportedcites [48] Zeng, H. et al. CD36 promotes de novo lipogenesis in hepatocytes through INSIG2-dependent SREBP1 processing. Mol. Metab. 57, 101428 (2022). sourceExperimental — accuracy not yet measured
The Introduction and Discussion link CD36 to nonalcoholic fatty liver disease, and the Results report that hepatocyte-specific CD36 deletion protected mice from high-fat-diet-induced steatosis. But the interaction examined in the Results is CD36–INSIG2; our copy does not establish a THBS1/2–CD36 interaction or its effect on liver disease (searched: THBS1, THBS2, thrombospondin). (LLM, conf=0.87)
hedgedconditional- Asserted: passes — The authors put it forward as true.
- Checkable: passes — It can be checked against evidence.
- Load-bearing: fails — The paper’s conclusions may not depend on it.
- Based: passes — The paper gives a reason why it holds.
Probably not a substantial claim. The paper’s conclusions may not depend on it.
- Partly supported
The cited sources support only part of this claim — read each source’s verdict below.
In the paper
“PNPLA3, CPEB4, and ASPG, which are linked to hepatic steatosis, steatohepatitis, and/or fibrosis33,39–41”
§ Spatial transcriptomics of healthy and fibrotic human liver at single-cell resolution > Discussion
What the sources say
- Partly supportedcites [33] Romeo, S. et al. Genetic variation in PNPLA3 confers susceptibility to nonalcoholic fatty liver disease. Nat. Genet. 40, 1461–1465 (2008). sourceExperimental — accuracy not yet measured
The paper reports that a PNPLA3 variant is strongly associated with hepatic fat content and that carriers have elevated markers of liver inflammation (Abstract; page not provided). Our copy does not link CPEB4 or ASPG to these conditions, and it does not establish a PNPLA3 association with fibrosis. (LLM, conf=0.88)
- Supportedcites [39] Valenti, L. et al. Homozygosity for the patatin‐like phospholipase‐3/adiponutrin I148M polymorphism influences liver fibrosis in patients with nonalcoholic fatty liver disease. Hepatology 51, 1209–1217 (2010). source
The Discussion (page unavailable in our copy) reports that PNPLA3 genotype is associated with steatosis, NASH, and fibrosis severity in patients with NAFLD. This supports the PNPLA3 portion of the multiply cited sentence; this source is not being used to establish the links for CPEB4 or ASPG. (LLM, conf=0.93)
- Not checked — no full text of the sourcecites [40] Maillo, C. et al. Circadian- and UPR-dependent control of CPEB4 mediates a translational response to counteract hepatic steatosis under ER stress. Nat. Cell Biol. 19, 94–105 (2017). source
- Could not verifycites [41] Xanthakos, S. A. et al. High Prevalence of Nonalcoholic Fatty Liver Disease in Adolescents Undergoing Bariatric Surgery. Gastroenterology 149, 623–634.e8 (2015). sourceExperimental — accuracy not yet measured
The Results (Hepatic Gene Expression Profiles; page unavailable) report gene-expression differences across NAFLD and NASH groups but do not identify PNPLA3, CPEB4, or ASPG. Searches for those three gene names found no passage in our copy linking them to steatosis, steatohepatitis, or fibrosis. (LLM, conf=0.72)
plaincorrelational- Asserted: passes — The authors put it forward as true.
- Checkable: passes — It can be checked against evidence.
- Load-bearing: fails — The paper’s conclusions may not depend on it.
- Based: passes — The paper gives a reason why it holds.
Probably not a substantial claim. The paper’s conclusions may not depend on it.
- Partly supported
Every source the paper cites for this claim was checked and supports it.
In the paper
“SLC25A15, is an ornithine transporter in the urea cycle38”
§ Spatial transcriptomics of healthy and fibrotic human liver at single-cell resolution > Discussion
What the sources say
- Supportedcites [38] Fiermonte, G. et al. The Mitochondrial Ornithine Transporter Bacterial Expression, Reconstitution, Functional Characterization, And Tissue Distribution Of Two Human Isoforms*. J. Biol. Chem. 278, 32778–32783 (2003). source
The Experimental Procedures identify ORC1 as the product of SLC25A15. The introductory passage describes the ornithine carrier’s exchange of ornithine for citrulline as part of the urea cycle, and the Discussion says ORC1 provides a link in that cycle. (LLM, conf=0.94)
plain- Asserted: passes — The authors put it forward as true.
- Checkable: passes — It can be checked against evidence.
- Load-bearing: fails — The paper’s conclusions may not depend on it.
- Based: passes — The paper gives a reason why it holds.
Probably not a substantial claim. The paper’s conclusions may not depend on it.
- Supported
A result the paper reports from its own data — it cites no other source for it, so there is none to check. The quote shows it is in the paper.
In the paper
“In addition, we found that CYP2A6 and ASS1 were enriched in portal regions similar to SDS, while CYP1A2 and GLUL were enriched in central regions similar to CYP2E1 (Fig. 1c, e, f–g).”
§ Spatial transcriptomics of healthy and fibrotic human liver at single-cell resolution > Results > Spatial organization of hepatocytes in the human liver
plaincorrelational- Asserted: passes — The authors put it forward as true.
- Checkable: passes — It can be checked against evidence.
- Load-bearing: passes — The paper’s conclusions depend on it.
- Based: passes — The paper gives a reason why it holds.
It may state two separate claims as one.
A result the paper reports from its own data — it cites no other source for it, so there is none to check. The quote shows it is in the paper.
In the paper
“Finally, MERFISH and snRNA-seq analysis of fibrotic liver samples identify two hepatocyte populations that expand with injury and do not have clear zonal distributions.”
§ Spatial transcriptomics of healthy and fibrotic human liver at single-cell resolution > Abstract
plaincorrelational- Asserted: passes — The authors put it forward as true.
- Checkable: passes — It can be checked against evidence.
- Load-bearing: passes — The paper’s conclusions depend on it.
- Based: passes — The paper gives a reason why it holds.
It may state two separate claims as one.
A result the paper reports from its own data — it cites no other source for it, so there is none to check. The quote shows it is in the paper.
In the paper
“Mapping hepatocyte clusters 1, 2, and 3 (Fig. 1a) back to tissue sections showed clear zonal distribution, with hepatocyte cluster 1 localizing to zone 1, hepatocyte cluster 3 to zone 3, and hepatocyte cluster 2 to zone 2 (between zone 1 and 3; Fig. 1h, Supplementary Fig. 5b, c).”
§ Spatial transcriptomics of healthy and fibrotic human liver at single-cell resolution > Results > Spatial organization of hepatocytes in the human liver
boostedcorrelational- Asserted: passes — The authors put it forward as true.
- Checkable: passes — It can be checked against evidence.
- Load-bearing: passes — The paper’s conclusions depend on it.
- Based: passes — The paper gives a reason why it holds.
It may state two separate claims as one.
The paper states this without a source or data behind it here, so there is nothing to check it against. The quote shows it is in the paper.
In the paper
“Reflecting both the hepatocyte focus of our MERFISH panel as well as the larger size of hepatocytes, hepatocyte clusters contained more RNA counts and more expressed genes than other clusters (Supplementary Fig. 4b–d).”
§ Spatial transcriptomics of healthy and fibrotic human liver at single-cell resolution > Results > Spatial organization of hepatocytes in the human liver
plaincorrelational- Asserted: passes — The authors put it forward as true.
- Checkable: passes — It can be checked against evidence.
- Load-bearing: unclear — It is unclear whether the paper’s conclusions depend on it.
- Based: passes — The paper gives a reason why it holds.
It may state two separate claims as one.
A result the paper reports from its own data — it cites no other source for it, so there is none to check. The quote shows it is in the paper.
In the paper
“KRT7 and SOX9 were enriched in periportal areas consistent with cholangiocytes and include clusters suggestive of longitudinal sections of small bile ducts (Supplementary Fig. 2g–l), while DNASE13 and INMT expression were scattered through the parenchyma consistent with the distribution of ECs10 (Supplementary Fig. 2g–l).”
§ Spatial transcriptomics of healthy and fibrotic human liver at single-cell resolution > Results > Spatial organization of hepatocytes in the human liver
hedgedcorrelational- Asserted: passes — The authors put it forward as true.
- Checkable: passes — It can be checked against evidence.
- Load-bearing: unclear — It is unclear whether the paper’s conclusions depend on it.
- Based: passes — The paper gives a reason why it holds.
It may state two separate claims as one.
A result the paper reports from its own data — it cites no other source for it, so there is none to check. The quote shows it is in the paper.
In the paper
“Three clusters of hepatocytes were defined along with two HSC clusters, two macrophage clusters, one EC cluster, and one cholangiocyte cluster.”
§ Spatial transcriptomics of healthy and fibrotic human liver at single-cell resolution > Results > Spatial organization of hepatocytes in the human liver
plain- Asserted: passes — The authors put it forward as true.
- Checkable: passes — It can be checked against evidence.
- Load-bearing: passes — The paper’s conclusions depend on it.
- Based: passes — The paper gives a reason why it holds.
It may state two separate claims as one.
A result the paper reports from its own data — it cites no other source for it, so there is none to check. The quote shows it is in the paper.
In the paper
“ALDOB and ADH1B were expressed in all hepatocytes but were enriched in zone 2, with ALDOB expression shifted towards zones 1 and 2 and ADH1B expression shifted towards zones 2 and 3 (Fig. 1d, f).”
§ Spatial transcriptomics of healthy and fibrotic human liver at single-cell resolution > Results > Spatial organization of hepatocytes in the human liver
plaincorrelational- Asserted: passes — The authors put it forward as true.
- Checkable: passes — It can be checked against evidence.
- Load-bearing: passes — The paper’s conclusions depend on it.
- Based: passes — The paper gives a reason why it holds.
It may state two separate claims as one.
A result the paper reports from its own data — it cites no other source for it, so there is none to check. The quote shows it is in the paper.
In the paper
“To address this limitation, we next performed snRNA-seq analysis for the same human liver samples analyzed by MERFISH, profiling ~15,000 nuclei after filtering (Supplementary Fig. 7a).”
§ Spatial transcriptomics of healthy and fibrotic human liver at single-cell resolution > Results > Integration of MERFISH with snRNA-seq data
plain- Asserted: passes — The authors put it forward as true.
- Checkable: passes — It can be checked against evidence.
- Load-bearing: passes — The paper’s conclusions depend on it.
- Based: passes — The paper gives a reason why it holds.
Probably not a substantial claim.
A result the paper reports from its own data — it cites no other source for it, so there is none to check. The quote shows it is in the paper.
In the paper
“Macrophage (Mac) cluster 1 was enriched in the periportal area and also dispersed through the lobules, while cells from Mac 2 were scattered more diffusely through the lobules.”
§ Spatial transcriptomics of healthy and fibrotic human liver at single-cell resolution > Results > Spatial organization of non-parenchymal cells in the human liver
plaincorrelational- Asserted: passes — The authors put it forward as true.
- Checkable: passes — It can be checked against evidence.
- Load-bearing: unclear — It is unclear whether the paper’s conclusions depend on it.
- Based: passes — The paper gives a reason why it holds.
It may state two separate claims as one.
A result the paper reports from its own data — it cites no other source for it, so there is none to check. The quote shows it is in the paper.
In the paper
“We leveraged the same protocols as described above to image and segment cells and, in total, imaged ~220,000 cells (Supplementary Fig. 9).”
§ Spatial transcriptomics of healthy and fibrotic human liver at single-cell resolution > Results > Applying spatial transcriptomics in liver fibrosis
plain- Asserted: passes — The authors put it forward as true.
- Checkable: passes — It can be checked against evidence.
- Load-bearing: fails — The paper’s conclusions may not depend on it.
- Based: passes — The paper gives a reason why it holds.
Probably not a substantial claim. The paper’s conclusions may not depend on it. The quote only partly states this claim.
A result the paper reports from its own data — it cites no other source for it, so there is none to check. The quote shows it is in the paper.
In the paper
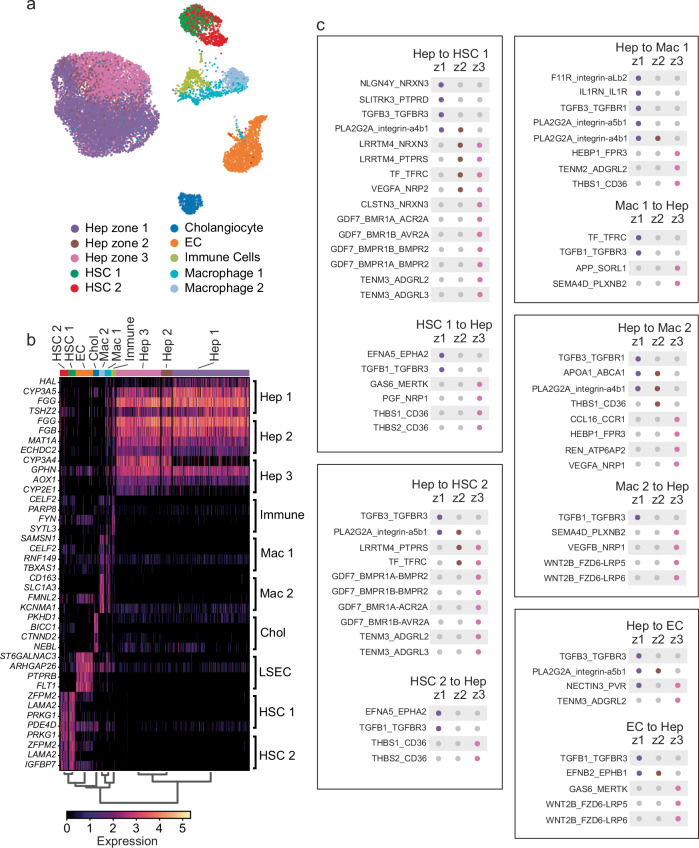
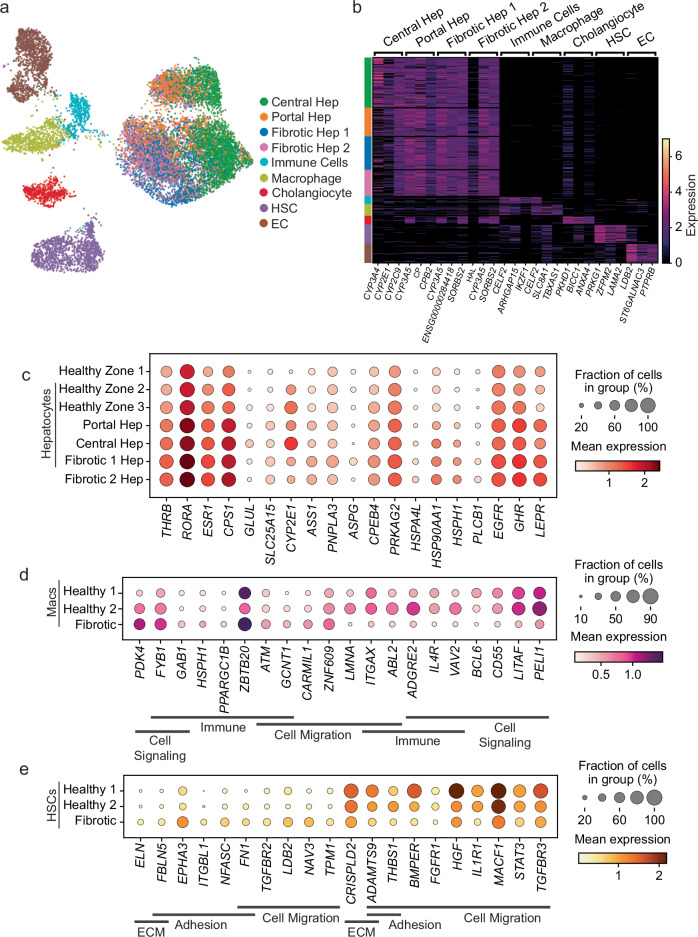
“Visualization of the snRNA-seq data after this integration showed that we could identify hepatocytes zones 1, 2, and 3 as seen in the MERFISH data, but the axis of zonation within hepatocytes was not as clear in the snRNA-seq data as it was in the MERFISH measurements (Fig. 1a; Fig. 3a).”
§ Spatial transcriptomics of healthy and fibrotic human liver at single-cell resolution > Results > Integration of MERFISH with snRNA-seq data
plain- Asserted: passes — The authors put it forward as true.
- Checkable: passes — It can be checked against evidence.
- Load-bearing: passes — The paper’s conclusions depend on it.
- Based: passes — The paper gives a reason why it holds.
It may state two separate claims as one.
A result the paper reports from its own data — it cites no other source for it, so there is none to check. The quote shows it is in the paper.
In the paper
“To expand our analysis transcriptome-wide, we next performed snRNA-seq on the same samples characterized with MERFISH, collecting ~13,500 nuclei across these three samples (Fig. 6; Supplementary Fig. 11).”
§ Spatial transcriptomics of healthy and fibrotic human liver at single-cell resolution > Results > Transcriptome-wide expression changes in fibrosis
plainn = 3- Asserted: passes — The authors put it forward as true.
- Checkable: passes — It can be checked against evidence.
- Load-bearing: passes — The paper’s conclusions depend on it.
- Based: passes — The paper gives a reason why it holds.
Probably not a substantial claim.
A result the paper reports from its own data — it cites no other source for it, so there is none to check. The quote shows it is in the paper.
In the paper
“TF produced by Mac 1 cells can signal to TFRC on periportal hepatocytes, while HSC 1 and ECs expressed EFNA5 and EFNB2, respectively to signal to portal hepatocytes through EPHA2 and EPHB1.”
§ Spatial transcriptomics of healthy and fibrotic human liver at single-cell resolution > Results > Hepatocyte zonation shapes interactions with non-parenchymal cells
plaindirect- Asserted: passes — The authors put it forward as true.
- Checkable: passes — It can be checked against evidence.
- Load-bearing: unclear — It is unclear whether the paper’s conclusions depend on it.
- Based: passes — The paper gives a reason why it holds.
It may state two separate claims as one.
- Rests on an assumption: Co-expression of receptor-ligand pairs in snRNA-seq data indicates potential cell-cell interactions in situ.
A result the paper reports from its own data — it cites no other source for it, so there is none to check. The quote shows it is in the paper.
In the paper
“Leveraging the snRNA-seq alone, we also defined two populations of HSCs, two populations of macrophages, a population of cholangiocytes, and a population of ECs (Fig. 3a, b; Supplementary Data 2).”
§ Spatial transcriptomics of healthy and fibrotic human liver at single-cell resolution > Results > Integration of MERFISH with snRNA-seq data
plain- Asserted: passes — The authors put it forward as true.
- Checkable: passes — It can be checked against evidence.
- Load-bearing: unclear — It is unclear whether the paper’s conclusions depend on it.
- Based: passes — The paper gives a reason why it holds.
It may state two separate claims as one.
A result the paper reports from its own data — it cites no other source for it, so there is none to check. The quote shows it is in the paper.
In the paper
“VEGFA, expressed by pericentral hepatocytes is recognized by NRP2, expressed by HSC 1 cells and NRP1 expressed by Mac 2 cells.”
§ Spatial transcriptomics of healthy and fibrotic human liver at single-cell resolution > Results > Hepatocyte zonation shapes interactions with non-parenchymal cells
plaincorrelational- Asserted: passes — The authors put it forward as true.
- Checkable: passes — It can be checked against evidence.
- Load-bearing: passes — The paper’s conclusions depend on it.
- Based: passes — The paper gives a reason why it holds.
It may state two separate claims as one.
- Rests on an assumption: Co-expression of receptor-ligand pairs in snRNA-seq data indicates potential cell-cell interactions in situ.
A result the paper reports from its own data — it cites no other source for it, so there is none to check. The quote shows it is in the paper.
In the paper
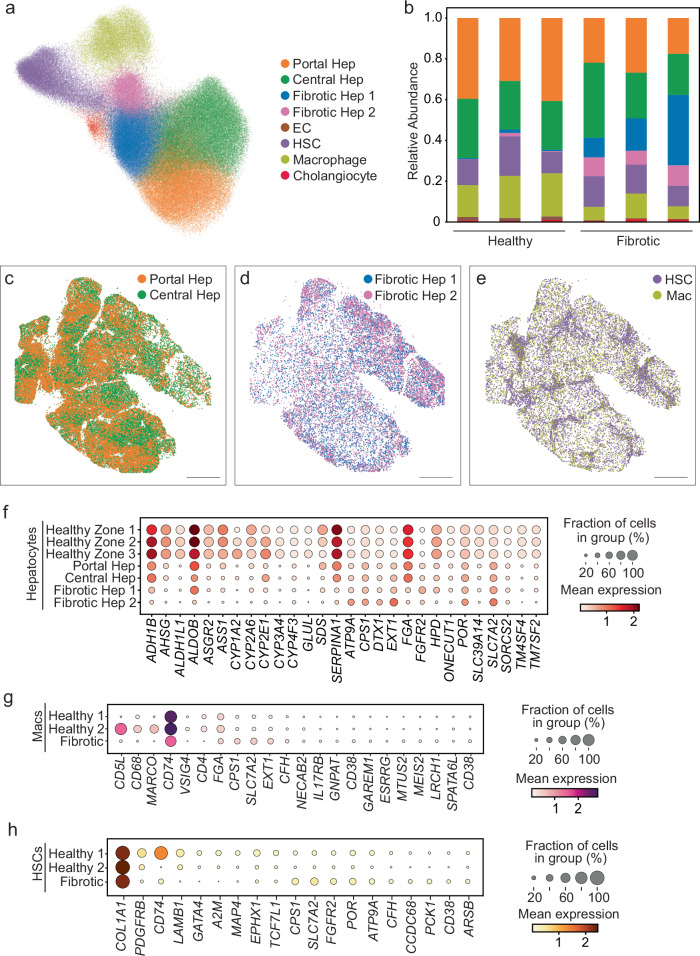
“Portal and central hepatocytes from the fibrotic liver retain the same zonal expression of marker genes as healthy zone 1, 2, and 3 and are characterized primarily by a reduction in expression of these genes.”
§ Spatial transcriptomics of healthy and fibrotic human liver at single-cell resolution > Results > Applying spatial transcriptomics in liver fibrosis
plain- Asserted: passes — The authors put it forward as true.
- Checkable: passes — It can be checked against evidence.
- Load-bearing: passes — The paper’s conclusions depend on it.
- Based: passes — The paper gives a reason why it holds.
It may state two separate claims as one.
A result the paper reports from its own data — it cites no other source for it, so there is none to check. The quote shows it is in the paper.
In the paper
“GAS6 produced by HSC 1 and ECs can signal to pericentral hepatocytes through MERTK, while SEMA4D expressed by Mac 1 and Mac 2 cells, and VEGFB produced by Mac 2 cells can be recognized by PLXNB2 and NRP1, respectively, both of which are expressed by pericentral hepatocytes.”
§ Spatial transcriptomics of healthy and fibrotic human liver at single-cell resolution > Results > Hepatocyte zonation shapes interactions with non-parenchymal cells
plaincorrelational- Asserted: passes — The authors put it forward as true.
- Checkable: passes — It can be checked against evidence.
- Load-bearing: passes — The paper’s conclusions depend on it.
- Based: passes — The paper gives a reason why it holds.
It may state two separate claims as one.
- Rests on an assumption: Co-expression of receptor-ligand pairs in snRNA-seq data indicates potential cell-cell interactions in situ.
A result the paper reports from its own data — it cites no other source for it, so there is none to check. The quote shows it is in the paper.
In the paper
“For example, fibrotic macrophages showed a loss of MARCO, CD5L, CD68 and retained an expression pattern that more closely matched Mac 1 cells in normal liver (Fig. 5g), while fibrotic HSCs maintained high levels of COL1A1 expression without a clear positive signature from the other genes included in the MERFISH panel (Fig. 5h).”
§ Spatial transcriptomics of healthy and fibrotic human liver at single-cell resolution > Results > Applying spatial transcriptomics in liver fibrosis
plaincorrelational- Asserted: passes — The authors put it forward as true.
- Checkable: passes — It can be checked against evidence.
- Load-bearing: unclear — It is unclear whether the paper’s conclusions depend on it.
- Based: passes — The paper gives a reason why it holds.
It may state two separate claims as one.
A result the paper reports from its own data — it cites no other source for it, so there is none to check. The quote shows it is in the paper.
In the paper
“Instead of three zones of hepatocytes, this joint analysis produced two: a periportal cluster of hepatocytes (Portal Hep) and a pericentral cluster of hepatocytes (Central Hep), which collectively contained zone 1, 2 and 3 hepatocytes from healthy liver (Fig. 5a, Supplementary Fig. 9b-d, Supplementary Fig. 10, Supplementary Data 2).”
§ Spatial transcriptomics of healthy and fibrotic human liver at single-cell resolution > Results > Applying spatial transcriptomics in liver fibrosis
plain- Asserted: passes — The authors put it forward as true.
- Checkable: passes — It can be checked against evidence.
- Load-bearing: passes — The paper’s conclusions depend on it.
- Based: passes — The paper gives a reason why it holds.
It may state two separate claims as one.
A result the paper reports from its own data — it cites no other source for it, so there is none to check. The quote shows it is in the paper.
In the paper
“Cholangiocytes and ECs were also identified by MERFISH and followed predicted distributions (Fig. 2a, b, g; Supplementary Fig. 6e).”
§ Spatial transcriptomics of healthy and fibrotic human liver at single-cell resolution > Results > Spatial organization of non-parenchymal cells in the human liver
plaincorrelational- Asserted: passes — The authors put it forward as true.
- Checkable: passes — It can be checked against evidence.
- Load-bearing: unclear — It is unclear whether the paper’s conclusions depend on it.
- Based: passes — The paper gives a reason why it holds.
It may state two separate claims as one.
A result the paper reports from its own data — it cites no other source for it, so there is none to check. The quote shows it is in the paper.
In the paper
“However, we did note some evidence of lower HSC and macrophage marker expression in the cholangiocytes seen with snRNA-seq relative to those seen with MERFISH, consistent with modest segmentation challenges with these cells (Supplementary Fig. 8d).”
§ Spatial transcriptomics of healthy and fibrotic human liver at single-cell resolution > Results > Integration of MERFISH with snRNA-seq data
hedgedcorrelational- Asserted: passes — The authors put it forward as true.
- Checkable: passes — It can be checked against evidence.
- Load-bearing: unclear — It is unclear whether the paper’s conclusions depend on it.
- Based: passes — The paper gives a reason why it holds.
It may state two separate claims as one.
A result the paper reports from its own data — it cites no other source for it, so there is none to check. The quote shows it is in the paper.
In the paper
“These cells also displayed different spatial distributions, with cells from HSC 1 enriched in periportal regions and spread through the lobules, while cells from HSC 2 were scattered more diffusely through the lobules without periportal enrichment.”
§ Spatial transcriptomics of healthy and fibrotic human liver at single-cell resolution > Results > Spatial organization of non-parenchymal cells in the human liver
plaincorrelational- Asserted: passes — The authors put it forward as true.
- Checkable: passes — It can be checked against evidence.
- Load-bearing: unclear — It is unclear whether the paper’s conclusions depend on it.
- Based: passes — The paper gives a reason why it holds.
It may state two separate claims as one.
A result the paper reports from its own data — it cites no other source for it, so there is none to check. The quote shows it is in the paper.
In the paper
“ECs and Mac 2 cells also produce WNT2B, which can be recognized by FZD6-LRP5/6 in periportal hepatocytes, with the highest interaction scores observed between ECs and zone 3 hepatocytes (Supplementary Data 3).”
§ Spatial transcriptomics of healthy and fibrotic human liver at single-cell resolution > Results > Hepatocyte zonation shapes interactions with non-parenchymal cells
plaincorrelational- Asserted: passes — The authors put it forward as true.
- Checkable: passes — It can be checked against evidence.
- Load-bearing: unclear — It is unclear whether the paper’s conclusions depend on it.
- Based: passes — The paper gives a reason why it holds.
It may state two separate claims as one.
- Rests on an assumption: Co-expression of receptor-ligand pairs in snRNA-seq data indicates potential cell-cell interactions in situ.
A result the paper reports from its own data — it cites no other source for it, so there is none to check. The quote shows it is in the paper.
In the paper
“HSCs displayed bands of cells across lobules, while macrophages were spread more diffusely through the lobules (Fig. 5e).”
§ Spatial transcriptomics of healthy and fibrotic human liver at single-cell resolution > Results > Applying spatial transcriptomics in liver fibrosis
plain- Asserted: passes — The authors put it forward as true.
- Checkable: passes — It can be checked against evidence.
- Load-bearing: unclear — It is unclear whether the paper’s conclusions depend on it.
- Based: passes — The paper gives a reason why it holds.
It may state two separate claims as one.
A result the paper reports from its own data — it cites no other source for it, so there is none to check. The quote shows it is in the paper.
In the paper
“Two macrophage populations were visualized in the healthy liver and showed different patterns of distribution (Fig. 2a, b, c, Supplementary Fig. 6a).”
§ Spatial transcriptomics of healthy and fibrotic human liver at single-cell resolution > Results > Spatial organization of non-parenchymal cells in the human liver
plain- Asserted: passes — The authors put it forward as true.
- Checkable: passes — It can be checked against evidence.
- Load-bearing: unclear — It is unclear whether the paper’s conclusions depend on it.
- Based: passes — The paper gives a reason why it holds.
It may state two separate claims as one.
A result the paper reports from its own data — it cites no other source for it, so there is none to check. The quote shows it is in the paper.
In the paper
“Cholangiocytes were localized to portal regions and were identified by expression of KRT7 (Fig. 2h, left; Supplementary Fig. 6f, left), while ECs, many of which line the sinusoids, were identified more diffusely through the liver, and expressed DNASE1L3 (Fig. 2h, right; Supplementary Fig. 6f, right).”
§ Spatial transcriptomics of healthy and fibrotic human liver at single-cell resolution > Results > Spatial organization of non-parenchymal cells in the human liver
plaincorrelational- Asserted: passes — The authors put it forward as true.
- Checkable: passes — It can be checked against evidence.
- Load-bearing: unclear — It is unclear whether the paper’s conclusions depend on it.
- Based: passes — The paper gives a reason why it holds.
It may state two separate claims as one.
A result the paper reports from its own data — it cites no other source for it, so there is none to check. The quote shows it is in the paper.
In the paper
“Cholangiocytes were localized to portal regions and were identified by expression of KRT7 (Fig. 2h, left; Supplementary Fig. 6f, left), while ECs, many of which line the sinusoids, were identified more diffusely through the liver, and expressed DNASE1L3 (Fig. 2h, right; Supplementary Fig. 6f, right).”
§ Spatial transcriptomics of healthy and fibrotic human liver at single-cell resolution > Results > Spatial organization of non-parenchymal cells in the human liver
plaincorrelational- Asserted: passes — The authors put it forward as true.
- Checkable: passes — It can be checked against evidence.
- Load-bearing: passes — The paper’s conclusions depend on it.
- Based: passes — The paper gives a reason why it holds.
It may state two separate claims as one.
A result the paper reports from its own data — it cites no other source for it, so there is none to check. The quote shows it is in the paper.
In the paper
“A single cluster of HSCs and a single cluster of macrophages were also identified (Fig. 5a, b; Supplementary Data 2).”
§ Spatial transcriptomics of healthy and fibrotic human liver at single-cell resolution > Results > Applying spatial transcriptomics in liver fibrosis
plain- Asserted: passes — The authors put it forward as true.
- Checkable: passes — It can be checked against evidence.
- Load-bearing: unclear — It is unclear whether the paper’s conclusions depend on it.
- Based: passes — The paper gives a reason why it holds.
It may state two separate claims as one.
A result the paper reports from its own data — it cites no other source for it, so there is none to check. The quote shows it is in the paper.
In the paper
“While our analysis revealed that hepatocytes can be separated into three populations, we noted that these populations are contained within a single group of cells in the UMAP representation of the data (Fig. 1a).”
§ Spatial transcriptomics of healthy and fibrotic human liver at single-cell resolution > Results > Spatial organization of hepatocytes in the human liver
plain- Asserted: passes — The authors put it forward as true.
- Checkable: passes — It can be checked against evidence.
- Load-bearing: passes — The paper’s conclusions depend on it.
- Based: passes — The paper gives a reason why it holds.
It may state two separate claims as one.
A result the paper reports from its own data — it cites no other source for it, so there is none to check. The quote shows it is in the paper.
In the paper
“Importantly, this analysis revealed nuclei in the snRNA-seq data that were similar to the two fibrotic hepatocyte clusters (Fibrotic Hep 1 and Fibrotic Hep 2) seen in the MERFISH measurements, supporting the emergence of these two disease-associated populations (Supplementary Fig. 12a, b).”
§ Spatial transcriptomics of healthy and fibrotic human liver at single-cell resolution > Results > Transcriptome-wide expression changes in fibrosis
plaincorrelationaln = 3- Asserted: passes — The authors put it forward as true.
- Checkable: passes — It can be checked against evidence.
- Load-bearing: passes — The paper’s conclusions depend on it.
- Based: passes — The paper gives a reason why it holds.
It may state two separate claims as one.
A result the paper reports from its own data — it cites no other source for it, so there is none to check. The quote shows it is in the paper.
In the paper
“These two populations differed primarily in the levels of CD74 expression, while both populations expressed PDGFRB and LAMB1 (Fig. 2f, i; Supplementary Fig. 6d).”
§ Spatial transcriptomics of healthy and fibrotic human liver at single-cell resolution > Results > Spatial organization of non-parenchymal cells in the human liver
plaincorrelational- Asserted: passes — The authors put it forward as true.
- Checkable: passes — It can be checked against evidence.
- Load-bearing: unclear — It is unclear whether the paper’s conclusions depend on it.
- Based: passes — The paper gives a reason why it holds.
It may state two separate claims as one.
A result the paper reports from its own data — it cites no other source for it, so there is none to check. The quote shows it is in the paper.
In the paper
“Nonetheless, the total RNA counts per cell increased with nuclei number (Fig. 4f, left) as did the cell area (Fig. 4f, center), such that multinucleated hepatocytes tended to be larger and contain proportionally more RNA transcripts, but RNA density was not dependent on the number of nuclei (Fig. 4f, right).”
§ Spatial transcriptomics of healthy and fibrotic human liver at single-cell resolution > Results > Effect of nuclear content on gene expression in hepatocytes
plaincorrelational- Asserted: passes — The authors put it forward as true.
- Checkable: passes — It can be checked against evidence.
- Load-bearing: unclear — It is unclear whether the paper’s conclusions depend on it.
- Based: passes — The paper gives a reason why it holds.
It may state two separate claims as one.
A result the paper reports from its own data — it cites no other source for it, so there is none to check. The quote shows it is in the paper.
In the paper
“THBS1/2 is detected at the highest level in HSCs and can signal to CD36 expressed by pericentral hepatocytes (Supplementary Data 3), while the THBS1-CD36 receptor-ligand pair is also enriched between pericentral hepatocytes and macrophages.”
§ Spatial transcriptomics of healthy and fibrotic human liver at single-cell resolution > Results > Hepatocyte zonation shapes interactions with non-parenchymal cells
plaindirect- Asserted: passes — The authors put it forward as true.
- Checkable: passes — It can be checked against evidence.
- Load-bearing: passes — The paper’s conclusions depend on it.
- Based: passes — The paper gives a reason why it holds.
It may state two separate claims as one.
- Rests on an assumption: Co-expression of receptor-ligand pairs in snRNA-seq data indicates potential cell-cell interactions in situ.
A result the paper reports from its own data — it cites no other source for it, so there is none to check. The quote shows it is in the paper.
In the paper
“By combining MERFISH with snRNA-seq, we extended the transcriptional profiles of cell types in these spatial maps to understand unique receptor-ligand interactions involving hepatocytes and non-parenchymal cells across hepatocyte zones and defined changes in gene expression in spatially-resolved hepatocyte populations with injury.”
§ Spatial transcriptomics of healthy and fibrotic human liver at single-cell resolution > Discussion
plaincorrelational- Asserted: passes — The authors put it forward as true.
- Checkable: passes — It can be checked against evidence.
- Load-bearing: passes — The paper’s conclusions depend on it.
- Based: passes — The paper gives a reason why it holds.
It may state two separate claims as one.
A result the paper reports from its own data — it cites no other source for it, so there is none to check. The quote shows it is in the paper.
In the paper
“With the development of fibrotic injury, the macrophage population lost expression of MARCO, CD5L, and CD68 in the MERFISH data, and snRNA-seq analysis also showed reduction in MARCO and CD5L as well as VCAM1 and CD163.”
§ Spatial transcriptomics of healthy and fibrotic human liver at single-cell resolution > Discussion
plaindirect- Asserted: passes — The authors put it forward as true.
- Checkable: passes — It can be checked against evidence.
- Load-bearing: passes — The paper’s conclusions depend on it.
- Based: passes — The paper gives a reason why it holds.
It may state two separate claims as one.
A result the paper reports from its own data — it cites no other source for it, so there is none to check. The quote shows it is in the paper.
In the paper
“Both Fibrotic Hep 1 and Fibrotic Hep 2 continue to show enriched expression of the nuclear receptors THRB, RORA, and ESR1 (Fig. 6c, Supplementary Data 4 and Supplementary Data 6) and maintain increased expression of CPS1 and SLC25A15.”
§ Spatial transcriptomics of healthy and fibrotic human liver at single-cell resolution > Results > Transcriptome-wide expression changes in fibrosis
plaincorrelational- Asserted: passes — The authors put it forward as true.
- Checkable: passes — It can be checked against evidence.
- Load-bearing: unclear — It is unclear whether the paper’s conclusions depend on it.
- Based: passes — The paper gives a reason why it holds.
It may state two separate claims as one.
A result the paper reports from its own data — it cites no other source for it, so there is none to check. The quote shows it is in the paper.
In the paper
“Mac 2 cells were identified as MARCO+, CD5L+, and CD68+ with increased expression of VISG4 compared to Mac 1 cells and were located more diffusely through the lobule”
§ Spatial transcriptomics of healthy and fibrotic human liver at single-cell resolution > Discussion
plaincorrelational- Asserted: passes — The authors put it forward as true.
- Checkable: passes — It can be checked against evidence.
- Load-bearing: passes — The paper’s conclusions depend on it.
- Based: passes — The paper gives a reason why it holds.
It may state two separate claims as one.
A result the paper reports from its own data — it cites no other source for it, so there is none to check. The quote shows it is in the paper.
In the paper
“Two populations of macrophages were identified by MERFISH and show different distribution patterns through the lobule.”
§ Spatial transcriptomics of healthy and fibrotic human liver at single-cell resolution > Discussion
plaincorrelational- Asserted: passes — The authors put it forward as true.
- Checkable: passes — It can be checked against evidence.
- Load-bearing: passes — The paper’s conclusions depend on it.
- Based: passes — The paper gives a reason why it holds.
It may state two separate claims as one.
A result the paper reports from its own data — it cites no other source for it, so there is none to check. The quote shows it is in the paper.
In the paper
“The transmembrane receptor EGFR is increased in Fibrotic Hep 1 and Fibrotic Hep 2 cells, while the transmembrane receptor GHR is increased in all injured hepatocyte populations, and LEPR is enriched in injured Portal Heps and Fibrotic Hep 1 and Fibrotic Hep 2 populations (Fig. 6c, Supplementary Data 4 and Supplementary Data 6).”
§ Spatial transcriptomics of healthy and fibrotic human liver at single-cell resolution > Results > Transcriptome-wide expression changes in fibrosis
plaincorrelational- Asserted: passes — The authors put it forward as true.
- Checkable: passes — It can be checked against evidence.
- Load-bearing: unclear — It is unclear whether the paper’s conclusions depend on it.
- Based: passes — The paper gives a reason why it holds.
It may state two separate claims as one.
A result the paper reports from its own data — it cites no other source for it, so there is none to check. The quote shows it is in the paper.
In the paper
“Most of the transcripts identified in hepatocytes are cytoplasmic, but transcripts are also present in the nucleus.”
§ Spatial transcriptomics of healthy and fibrotic human liver at single-cell resolution > Discussion
plain- Asserted: passes — The authors put it forward as true.
- Checkable: passes — It can be checked against evidence.
- Load-bearing: unclear — It is unclear whether the paper’s conclusions depend on it.
- Based: passes — The paper gives a reason why it holds.
It may state two separate claims as one.
A result the paper reports from its own data — it cites no other source for it, so there is none to check. The quote shows it is in the paper.
In the paper
“the MHC class II chaperone CD7445 showed the greatest differential expression between the two HSC populations, with highest expression observed in HSC 1 cells.”
§ Spatial transcriptomics of healthy and fibrotic human liver at single-cell resolution > Discussion
plaincorrelational- Asserted: passes — The authors put it forward as true.
- Checkable: passes — It can be checked against evidence.
- Load-bearing: unclear — It is unclear whether the paper’s conclusions depend on it.
- Based: passes — The paper gives a reason why it holds.
It may state two separate claims as one.
A result the paper reports from its own data — it cites no other source for it, so there is none to check. The quote shows it is in the paper.
In the paper
“In addition, multinucleated hepatocytes also tend to be larger in size, such that mRNA levels were proportional to cell size.”
§ Spatial transcriptomics of healthy and fibrotic human liver at single-cell resolution > Discussion
plaincorrelational- Asserted: passes — The authors put it forward as true.
- Checkable: passes — It can be checked against evidence.
- Load-bearing: unclear — It is unclear whether the paper’s conclusions depend on it.
- Based: passes — The paper gives a reason why it holds.
It may state two separate claims as one.
A result the paper reports from its own data — it cites no other source for it, so there is none to check. The quote shows it is in the paper.
In the paper
“Taken together, our study applied MERFISH to create spatial transcriptomic maps of the healthy and fibrotic liver at single-cell resolution to define spatially and transcriptionally distinct sub-populations of hepatocytes, macrophages, and HSCs within hepatic lobules and distinct hepatocyte sub-populations that expand with fibrotic injury.”
§ Spatial transcriptomics of healthy and fibrotic human liver at single-cell resolution > Discussion
plaincorrelational- Asserted: passes — The authors put it forward as true.
- Checkable: passes — It can be checked against evidence.
- Load-bearing: passes — The paper’s conclusions depend on it.
- Based: passes — The paper gives a reason why it holds.
It may state two separate claims as one.
A result the paper reports from its own data — it cites no other source for it, so there is none to check. The quote shows it is in the paper.
In the paper
“The ligase CPS1 is increased in both populations, and GLUL remains more restricted to Central Heps and ASS1 to Portal Heps with injury.”
§ Spatial transcriptomics of healthy and fibrotic human liver at single-cell resolution > Results > Transcriptome-wide expression changes in fibrosis
plaindirect- Asserted: passes — The authors put it forward as true.
- Checkable: passes — It can be checked against evidence.
- Load-bearing: unclear — It is unclear whether the paper’s conclusions depend on it.
- Based: passes — The paper gives a reason why it holds.
It may state two separate claims as one.
A result the paper reports from its own data — it cites no other source for it, so there is none to check. The quote shows it is in the paper.
In the paper
“we identified signaling interactions including a thrombospondin signal (THBS1/2) from HSCs to CD36 in zone 3 hepatocytes, which may influence metabolic dysfunction associated steatotic liver disease (MASLD)48, and the interaction of WNT2B, expressed by ECs and Mac 2 cells, with FZD6 and LPR5/6 expressed by zone 3 hepatocytes49,50 helps validate this analysis.”
§ Spatial transcriptomics of healthy and fibrotic human liver at single-cell resolution > Discussion
plaincorrelational- Asserted: passes — The authors put it forward as true.
- Checkable: passes — It can be checked against evidence.
- Load-bearing: passes — The paper’s conclusions depend on it.
- Based: passes — The paper gives a reason why it holds.
It may state two separate claims as one.
A result the paper reports from its own data — it cites no other source for it, so there is none to check. The quote shows it is in the paper.
In the paper
“HSC 1 was enriched in the portal areas compared to HSC 2, and both populations were found distributed through the lobules.”
§ Spatial transcriptomics of healthy and fibrotic human liver at single-cell resolution > Discussion
plaincorrelational- Asserted: passes — The authors put it forward as true.
- Checkable: passes — It can be checked against evidence.
- Load-bearing: unclear — It is unclear whether the paper’s conclusions depend on it.
- Based: passes — The paper gives a reason why it holds.
It may state two separate claims as one.
A result the paper reports from its own data — it cites no other source for it, so there is none to check. The quote shows it is in the paper.
In the paper
“While we did not observe a change in relative gene expression with increase in nuclear content, we did observe an increase in RNA transcripts.”
§ Spatial transcriptomics of healthy and fibrotic human liver at single-cell resolution > Discussion
plaincorrelational- Asserted: passes — The authors put it forward as true.
- Checkable: passes — It can be checked against evidence.
- Load-bearing: unclear — It is unclear whether the paper’s conclusions depend on it.
- Based: passes — The paper gives a reason why it holds.
It may state two separate claims as one.
A result the paper reports from its own data — it cites no other source for it, so there is none to check. The quote shows it is in the paper.
In the paper
“Finally, by evaluating nuclear content, we found that multinucleated hepatocytes do not show differences in relative gene expression compared to mono-nucleated hepatocytes, but tend to be larger and produce more total transcripts.”
§ Spatial transcriptomics of healthy and fibrotic human liver at single-cell resolution > Discussion
plain- Asserted: passes — The authors put it forward as true.
- Checkable: passes — It can be checked against evidence.
- Load-bearing: unclear — It is unclear whether the paper’s conclusions depend on it.
- Based: passes — The paper gives a reason why it holds.
It may state two separate claims as one.
A result the paper reports from its own data — it cites no other source for it, so there is none to check. The quote shows it is in the paper.
In the paper
“Within the hepatic populations that emerge with fibrotic injury and do not show zonal distribution (Fibrotic Hep 1 and 2, Fig. 5d), we again observe an enrichment in metabolic pathways, primarily those involving fatty acids and amino acids, while pathways involving RNA processing and ribosome biosynthesis are reduced (Supplementary Fig 13a, b).”
§ Spatial transcriptomics of healthy and fibrotic human liver at single-cell resolution > Results > Transcriptome-wide expression changes in fibrosis
plaincorrelational- Asserted: passes — The authors put it forward as true.
- Checkable: passes — It can be checked against evidence.
- Load-bearing: unclear — It is unclear whether the paper’s conclusions depend on it.
- Based: passes — The paper gives a reason why it holds.
It may state two separate claims as one.
A result the paper reports from its own data — it cites no other source for it, so there is none to check. The quote shows it is in the paper.
In the paper
“Fibrotic Hep 2 cells show relative enrichment in expression of hydrolases, heat shock proteins (HSPH1 and HSP90AA1, while HSPH1 is enriched in both Fibrotic Hep 1 and 2), and PLCB1 compared to Fibrotic Hep 1 cells.”
§ Spatial transcriptomics of healthy and fibrotic human liver at single-cell resolution > Results > Transcriptome-wide expression changes in fibrosis
plaincorrelational- Asserted: passes — The authors put it forward as true.
- Checkable: passes — It can be checked against evidence.
- Load-bearing: unclear — It is unclear whether the paper’s conclusions depend on it.
- Based: passes — The paper gives a reason why it holds.
It may state two separate claims as one.
A result the paper reports from its own data — it cites no other source for it, so there is none to check. The quote shows it is in the paper.
In the paper
“Further comparisons of gene expression between Mac1 and Mac 2 with snRNA-seq confirmed these expression patterns along with increased CD163, VCAM1, and TMEM26 in Mac 2 cells (Supplementary Data 2)”
§ Spatial transcriptomics of healthy and fibrotic human liver at single-cell resolution > Discussion
plaincorrelational- Asserted: passes — The authors put it forward as true.
- Checkable: passes — It can be checked against evidence.
- Load-bearing: passes — The paper’s conclusions depend on it.
- Based: passes — The paper gives a reason why it holds.
It may state two separate claims as one.
A result the paper reports from its own data — it cites no other source for it, so there is none to check. The quote shows it is in the paper.
In the paper
“Mac 1 cells were MARCO- and CD5L- with lower levels of CD68. While Mac 1 cells were also found through the lobule, they did exhibit a distinct enrichment in portal areas in contrast to Mac 2 cells.”
§ Spatial transcriptomics of healthy and fibrotic human liver at single-cell resolution > Discussion
plaincorrelational- Asserted: passes — The authors put it forward as true.
- Checkable: passes — It can be checked against evidence.
- Load-bearing: passes — The paper’s conclusions depend on it.
- Based: passes — The paper gives a reason why it holds.
It may state two separate claims as one.
A result the paper reports from its own data — it cites no other source for it, so there is none to check. The quote shows it is in the paper.
In the paper
“A similar effect was also observed in the snRNA-seq data.”
§ Spatial transcriptomics of healthy and fibrotic human liver at single-cell resolution > Discussion
plaincorrelational- Asserted: passes — The authors put it forward as true.
- Checkable: passes — It can be checked against evidence.
- Load-bearing: unclear — It is unclear whether the paper’s conclusions depend on it.
- Based: passes — The paper gives a reason why it holds.
The quote only partly states this claim.
A result the paper reports from its own data — it cites no other source for it, so there is none to check. The quote shows it is in the paper.
In the paper
“IL18 expression was maintained, and gene expression remained distinct from the Mac 1 population (Fig. 6d).”
§ Spatial transcriptomics of healthy and fibrotic human liver at single-cell resolution > Discussion
plain- Asserted: passes — The authors put it forward as true.
- Checkable: passes — It can be checked against evidence.
- Load-bearing: unclear — It is unclear whether the paper’s conclusions depend on it.
- Based: passes — The paper gives a reason why it holds.
It may state two separate claims as one.
A result the paper reports from its own data — it cites no other source for it, so there is none to check. The quote shows it is in the paper.
In the paper
“While oxygenases increase in both Portal and Central Heps with injury, CYP2E1 shows the highest expression in Central Heps with injury (Fig. 6c, Supplementary Data 4 and Supplementary Data 6).”
§ Spatial transcriptomics of healthy and fibrotic human liver at single-cell resolution > Results > Transcriptome-wide expression changes in fibrosis
plaindirect- Asserted: passes — The authors put it forward as true.
- Checkable: passes — It can be checked against evidence.
- Load-bearing: unclear — It is unclear whether the paper’s conclusions depend on it.
- Based: passes — The paper gives a reason why it holds.
It may state two separate claims as one.
A claim is checked only against the cited paper’s full text, never its abstract, and none is available for its sources.
In the paper
“Specifically, hepatocytes in the adult liver can either be single or multinucleated, and nuclei themselves can vary in ploidy.”
§ Spatial transcriptomics of healthy and fibrotic human liver at single-cell resolution > Introduction
What the sources say
- Not checked — no full text of the sourcecites [14] Kudryavtsev, B. N., Kudryavtseva, M. V., Sakuta, G. A. & Stein, G. I. Human hepatocyte polyploidization kinetics in the course of life cycle. Virchows Arch. B 64, 387–393 (1993). source
- Not checked — no full text of the sourcecites [15] Watanabe, T. & Tanaka, Y. Age-related alterations in the size of human hepatocytes. Virchows Arch. B 39, 9–20 (1982). source
- Not checked — no full text of the sourcecites [16] Saeter, G. et al. Changes in ploidy distributions in human liver carcinogenesis. J. Natl Cancer Inst. 80, 1480–1485 (1988). source
plain- Asserted: passes — The authors put it forward as true.
- Checkable: passes — It can be checked against evidence.
- Load-bearing: passes — The paper’s conclusions depend on it.
- Based: passes — The paper gives a reason why it holds.
Probably not a substantial claim. It may state two separate claims as one.
A claim is checked only against the cited paper’s full text, never its abstract, and none is available for its sources.
In the paper
“Within the lobule, hepatocytes are classically organized into three zones, with zone 1 proximal to the portal vein and hepatic artery, zone 3 proximal to the central vein, and zone 2 in the intermediate region3,4.”
§ Spatial transcriptomics of healthy and fibrotic human liver at single-cell resolution > Introduction
What the sources say
- Not checked — no full text of the sourcecites [3] Gebhardt, R. Metabolic zonation of the liver: Regulation and implications for liver function. Pharm. Therapeut 53, 275–354 (1992). source
- Not checked — no full text of the sourcecites [4] Jungermann, K. & Keitzmann, T. Zonation of Parenchymal and Nonparenchymal Metabolism in Liver. Annu Rev. Nutr. 16, 179–203 (1996). source
plain- Asserted: passes — The authors put it forward as true.
- Checkable: passes — It can be checked against evidence.
- Load-bearing: passes — The paper’s conclusions depend on it.
- Based: passes — The paper gives a reason why it holds.
Probably not a substantial claim. It may state two separate claims as one.
In the paper
“Hepatocyte zonation matches function to the physiologic environment in both space and time5.”
§ Spatial transcriptomics of healthy and fibrotic human liver at single-cell resolution > Introduction
What the sources say
- Not checked — no full text of the sourcecites [5] Martini, T., Naef, F. & Tchorz, J. S. Spatiotemporal Metabolic Liver Zonation and Consequences on Pathophysiology. Annu. Rev. Pathol.: Mech. Dis. 18, 439–466 (2023). source
plaindirect- Asserted: passes — The authors put it forward as true.
- Checkable: passes — It can be checked against evidence.
- Load-bearing: fails — The paper’s conclusions may not depend on it.
- Based: passes — The paper gives a reason why it holds.
Probably not a substantial claim. The paper’s conclusions may not depend on it.
What the paper did — it cites no source for this, so there is none to check. The quote shows it is in the paper.
In the paper
“Each cluster was defined by established markers, supporting our cluster assignment (Fig. 1b; Supplementary Data 2), and limited evidence of marker gene expression outside of the cell types they define was observed, supporting our segmentation (Supplementary Fig. 3c).”
§ Spatial transcriptomics of healthy and fibrotic human liver at single-cell resolution > Results > Spatial organization of hepatocytes in the human liver
plain- Asserted: passes — The authors put it forward as true.
- Checkable: passes — It can be checked against evidence.
- Load-bearing: passes — The paper’s conclusions depend on it.
- Based: passes — The paper gives a reason why it holds.
It may state two separate claims as one.
A claim is checked only against the cited paper’s full text, never its abstract, and none is available for its sources.
In the paper
“Early in life, most human hepatocytes are diploid and contain a single nucleus; ploidy increases with age such that in adults, about a third of hepatocytes are multinucleated, or their nuclei contain more than two copies of each chromosome14–16.”
§ Spatial transcriptomics of healthy and fibrotic human liver at single-cell resolution > Introduction
What the sources say
- Not checked — no full text of the sourcecites [14] Kudryavtsev, B. N., Kudryavtseva, M. V., Sakuta, G. A. & Stein, G. I. Human hepatocyte polyploidization kinetics in the course of life cycle. Virchows Arch. B 64, 387–393 (1993). source
- Not checked — no full text of the sourcecites [15] Watanabe, T. & Tanaka, Y. Age-related alterations in the size of human hepatocytes. Virchows Arch. B 39, 9–20 (1982). source
- Not checked — no full text of the sourcecites [16] Saeter, G. et al. Changes in ploidy distributions in human liver carcinogenesis. J. Natl Cancer Inst. 80, 1480–1485 (1988). source
plaindirect- Asserted: passes — The authors put it forward as true.
- Checkable: passes — It can be checked against evidence.
- Load-bearing: fails — The paper’s conclusions may not depend on it.
- Based: passes — The paper gives a reason why it holds.
Probably not a substantial claim. The paper’s conclusions may not depend on it.
A claim is checked only against the cited paper’s full text, never its abstract, and none is available for its sources.
In the paper
“The liver is also composed of non-parenchymal cells, which include hepatic stellate cells (HSCs), resident macrophages, endothelial cells (ECs), and cholangiocytes8,9.”
§ Spatial transcriptomics of healthy and fibrotic human liver at single-cell resolution > Introduction
What the sources say
- Not checked — no full text of the sourcecites [8] Damm, G. et al. Human parenchymal and non-parenchymal liver cell isolation, culture and characterization. Hepatol. Int. 7, 951–958 (2013). source
- Not checked — no full text of the sourcecites [9] Roberts, S., Ludwig, J. & Larusso, N. The pathobiology of biliary epithelia. Gastroenterology 112, 269–279 (1997). source
plain- Asserted: passes — The authors put it forward as true.
- Checkable: passes — It can be checked against evidence.
- Load-bearing: passes — The paper’s conclusions depend on it.
- Based: passes — The paper gives a reason why it holds.
Probably not a substantial claim.
A conclusion the paper draws from its own results — it cites no other source for it, so there is none to check. The quote shows it is in the paper.
In the paper
“Thus, we find that hepatocyte zonation is at least partially maintained with fibrotic injury, while two injury-related hepatocyte states are enriched that do not appear to retain zonation.”
§ Spatial transcriptomics of healthy and fibrotic human liver at single-cell resolution > Results > Applying spatial transcriptomics in liver fibrosis
hedgedcorrelational- Asserted: passes — The authors put it forward as true.
- Checkable: passes — It can be checked against evidence.
- Load-bearing: passes — The paper’s conclusions depend on it.
- Based: passes — The paper gives a reason why it holds.
It may state two separate claims as one.
A conclusion the paper draws from its own results — it cites no other source for it, so there is none to check. The quote shows it is in the paper.
In the paper
“These results suggest that multinucleated hepatocytes may contain more RNA transcripts within proportionally larger cells, which may underscore an increased metabolic capacity.”
§ Spatial transcriptomics of healthy and fibrotic human liver at single-cell resolution > Results > Effect of nuclear content on gene expression in hepatocytes
hedgedconditional- Asserted: passes — The authors put it forward as true.
- Checkable: passes — It can be checked against evidence.
- Load-bearing: unclear — It is unclear whether the paper’s conclusions depend on it.
- Based: passes — The paper gives a reason why it holds.
It may state two separate claims as one.
A conclusion the paper draws from its own results — it cites no other source for it, so there is none to check. The quote shows it is in the paper.
In the paper
“However, this increase does not appear to be associated with differential gene expression or location of hepatocytes within the lobule, suggesting that these cells do not have distinct functional roles in the healthy liver, at least within the pathways we explored with MERFISH.”
§ Spatial transcriptomics of healthy and fibrotic human liver at single-cell resolution > Results > Effect of nuclear content on gene expression in hepatocytes
hedged- Asserted: passes — The authors put it forward as true.
- Checkable: passes — It can be checked against evidence.
- Load-bearing: passes — The paper’s conclusions depend on it.
- Based: passes — The paper gives a reason why it holds.
It may state two separate claims as one.
A claim is checked only against the cited paper’s full text, never its abstract, and none is available for its sources.
In the paper
“Hepatocytes have the capacity to replicate their nuclei without dividing, generating polyploid and multinucleated cells14–16.”
§ Spatial transcriptomics of healthy and fibrotic human liver at single-cell resolution > Results > Effect of nuclear content on gene expression in hepatocytes
What the sources say
- Not checked — no full text of the sourcecites [14] Kudryavtsev, B. N., Kudryavtseva, M. V., Sakuta, G. A. & Stein, G. I. Human hepatocyte polyploidization kinetics in the course of life cycle. Virchows Arch. B 64, 387–393 (1993). source
- Not checked — no full text of the sourcecites [15] Watanabe, T. & Tanaka, Y. Age-related alterations in the size of human hepatocytes. Virchows Arch. B 39, 9–20 (1982). source
- Not checked — no full text of the sourcecites [16] Saeter, G. et al. Changes in ploidy distributions in human liver carcinogenesis. J. Natl Cancer Inst. 80, 1480–1485 (1988). source
plaindirect- Asserted: passes — The authors put it forward as true.
- Checkable: passes — It can be checked against evidence.
- Load-bearing: passes — The paper’s conclusions depend on it.
- Based: passes — The paper gives a reason why it holds.
Probably not a substantial claim.
What the paper did — it cites no source for this, so there is none to check. The quote shows it is in the paper.
In the paper
“The gene expression profiles of the snRNA-seq clusters identified with this analysis had expression profiles consistent with the corresponding MERFISH clusters, supporting their assignment, cross validating the expression profiles measured with both techniques, and providing further support for the MERFISH segmentation (Supplementary Fig. 8b-d).”
§ Spatial transcriptomics of healthy and fibrotic human liver at single-cell resolution > Results > Integration of MERFISH with snRNA-seq data
plaincorrelational- Asserted: passes — The authors put it forward as true.
- Checkable: passes — It can be checked against evidence.
- Load-bearing: passes — The paper’s conclusions depend on it.
- Based: passes — The paper gives a reason why it holds.
It may state two separate claims as one.
What the paper did — it cites no source for this, so there is none to check. The quote shows it is in the paper.
In the paper
“All liver samples were collected from excess surgical tissue at Massachusetts General Hospital in accordance with protocols approved by the Mass General Brigham (MGB) or Dana Farber Cancer Institute (DFCI) Institutional Review Boards (IRBs) including approval to provide data on age by decade and sex.”
§ Spatial transcriptomics of healthy and fibrotic human liver at single-cell resolution > Methods > Tissue collection
plain- Asserted: passes — The authors put it forward as true.
- Checkable: passes — It can be checked against evidence.
- Load-bearing: fails — The paper’s conclusions may not depend on it.
- Based: passes — The paper gives a reason why it holds.
Probably not a substantial claim. The paper’s conclusions may not depend on it. It may state two separate claims as one.
What the paper did — it cites no source for this, so there is none to check. The quote shows it is in the paper.
In the paper
“No data that met the described criteria were excluded from the analyses.”
§ Spatial transcriptomics of healthy and fibrotic human liver at single-cell resolution > Methods > Statistics and reproducibility
plain- Asserted: passes — The authors put it forward as true.
- Checkable: passes — It can be checked against evidence.
- Load-bearing: fails — The paper’s conclusions may not depend on it.
- Based: passes — The paper gives a reason why it holds.
Probably not a substantial claim. The paper’s conclusions may not depend on it.
What the paper did — it cites no source for this, so there is none to check. The quote shows it is in the paper.
In the paper
“The experiments were not randomized.”
§ Spatial transcriptomics of healthy and fibrotic human liver at single-cell resolution > Methods > Statistics and reproducibility
plain- Asserted: passes — The authors put it forward as true.
- Checkable: passes — It can be checked against evidence.
- Load-bearing: fails — The paper’s conclusions may not depend on it.
- Based: passes — The paper gives a reason why it holds.
Probably not a substantial claim. The paper’s conclusions may not depend on it.
What the paper did — it cites no source for this, so there is none to check. The quote shows it is in the paper.
In the paper
“We removed two clusters from the healthy dataset and two from the fibrotic injury dataset where greater than 15% of cells contained fewer than three MALAT1 reads.”
§ Spatial transcriptomics of healthy and fibrotic human liver at single-cell resolution > Methods > Analysis
plaindirect- Asserted: passes — The authors put it forward as true.
- Checkable: passes — It can be checked against evidence.
- Load-bearing: fails — The paper’s conclusions may not depend on it.
- Based: passes — The paper gives a reason why it holds.
Probably not a substantial claim. The paper’s conclusions may not depend on it.
What the paper did — it cites no source for this, so there is none to check. The quote shows it is in the paper.
In the paper
“All MERFISH and snRNA-seq data presented within are from matched samples.”
§ Spatial transcriptomics of healthy and fibrotic human liver at single-cell resolution > Methods > Tissue collection
plain- Asserted: passes — The authors put it forward as true.
- Checkable: passes — It can be checked against evidence.
- Load-bearing: passes — The paper’s conclusions depend on it.
- Based: passes — The paper gives a reason why it holds.
Probably not a substantial claim.
In the paper
“These findings are consistent with the interpretation that cells with more nuclei are both larger15 and express higher levels of RNA.”
§ Spatial transcriptomics of healthy and fibrotic human liver at single-cell resolution > Discussion
What the sources say
- Not checked — no full text of the sourcecites [15] Watanabe, T. & Tanaka, Y. Age-related alterations in the size of human hepatocytes. Virchows Arch. B 39, 9–20 (1982). source
hedgedcorrelational- Asserted: passes — The authors put it forward as true.
- Checkable: passes — It can be checked against evidence.
- Load-bearing: unclear — It is unclear whether the paper’s conclusions depend on it.
- Based: passes — The paper gives a reason why it holds.
It may state two separate claims as one.
A conclusion the paper draws from its own results — it cites no other source for it, so there is none to check. The quote shows it is in the paper.
In the paper
“These results show the metabolic impact of chronic injury on hepatocytes, including common activation of nuclear hormone receptors and genes that regulate the urea pathway, and more restricted induction of transmembrane receptors, heat shock proteins, and the phospholipase PNPLA3.”
§ Spatial transcriptomics of healthy and fibrotic human liver at single-cell resolution > Results > Transcriptome-wide expression changes in fibrosis
boosteddirect- Asserted: passes — The authors put it forward as true.
- Checkable: passes — It can be checked against evidence.
- Load-bearing: passes — The paper’s conclusions depend on it.
- Based: passes — The paper gives a reason why it holds.
It may state two separate claims as one.
What the paper did — it cites no source for this, so there is none to check. The quote shows it is in the paper.
In the paper
“Sex was not considered as a variable due to the small sample size.”
§ Spatial transcriptomics of healthy and fibrotic human liver at single-cell resolution > Methods > Tissue collection
plain- Asserted: passes — The authors put it forward as true.
- Checkable: passes — It can be checked against evidence.
- Load-bearing: fails — The paper’s conclusions may not depend on it.
- Based: passes — The paper gives a reason why it holds.
Probably not a substantial claim. The paper’s conclusions may not depend on it.
What the paper did — it cites no source for this, so there is none to check. The quote shows it is in the paper.
In the paper
“The Investigators were not blinded to allocation during experiments and outcome assessment.”
§ Spatial transcriptomics of healthy and fibrotic human liver at single-cell resolution > Methods > Statistics and reproducibility
plain- Asserted: passes — The authors put it forward as true.
- Checkable: passes — It can be checked against evidence.
- Load-bearing: fails — The paper’s conclusions may not depend on it.
- Based: passes — The paper gives a reason why it holds.
Probably not a substantial claim. The paper’s conclusions may not depend on it.
What the paper did — it cites no source for this, so there is none to check. The quote shows it is in the paper.
In the paper
“No statistical method was used to predetermine sample size for MERFISH or snRNA-seq.”
§ Spatial transcriptomics of healthy and fibrotic human liver at single-cell resolution > Methods > Statistics and reproducibility
plain- Asserted: passes — The authors put it forward as true.
- Checkable: passes — It can be checked against evidence.
- Load-bearing: fails — The paper’s conclusions may not depend on it.
- Based: passes — The paper gives a reason why it holds.
Probably not a substantial claim. The paper’s conclusions may not depend on it.
What the paper did — it cites no source for this, so there is none to check. The quote shows it is in the paper.
In the paper
“Patients were consented under MGB protocol 2019P001245 (AM-061) or DFCI protocol 02-240 (all other samples).”
§ Spatial transcriptomics of healthy and fibrotic human liver at single-cell resolution > Methods > Tissue collection
plain- Asserted: passes — The authors put it forward as true.
- Checkable: passes — It can be checked against evidence.
- Load-bearing: fails — The paper’s conclusions may not depend on it.
- Based: passes — The paper gives a reason why it holds.
Probably not a substantial claim. The paper’s conclusions may not depend on it. It may state two separate claims as one.
In the paper
“CPS1 (Carbamoyl phosphate synthetase I) is responsible for converting ammonia to carbamoyl phosphate to enter the urea cycle35”
§ Spatial transcriptomics of healthy and fibrotic human liver at single-cell resolution > Discussion
What the sources say
- Not checked — no full text of the sourcecites [35] Martínez, A. I., Pérez-Arellano, I., Pekkala, S., Barcelona, B. & Cervera, J. Genetic, structural and biochemical basis of carbamoyl phosphate synthetase 1 deficiency. Mol. Genet. Metab. 101, 311–323 (2010). source
plaindirect- Asserted: passes — The authors put it forward as true.
- Checkable: passes — It can be checked against evidence.
- Load-bearing: fails — The paper’s conclusions may not depend on it.
- Based: passes — The paper gives a reason why it holds.
Probably not a substantial claim. The paper’s conclusions may not depend on it.
A claim is checked only against the cited paper’s full text, never its abstract, and none is available for its sources.
In the paper
“SCL7A2 encodes an arginine/ornithine/lysine transporter and provides ornithine (either directly or through conversion of arginine) to interact with carbamoyl phosphate to form citrulline36,37”
§ Spatial transcriptomics of healthy and fibrotic human liver at single-cell resolution > Discussion
What the sources say
- Not checked — no full text of the sourcecites [36] Matsumoto, S. et al. Urea cycle disorders—update. J. Hum. Genet. 64, 833–847 (2019). source
- Not checked — no full text of the sourcecites [37] Yahyaoui, R. et al. A new metabolic disorder in human cationic amino acid transporter‐2 that mimics arginase 1 deficiency in newborn screening. J. Inherit. Metab. Dis. 42, 407–413 (2019). source
plaindirect- Asserted: passes — The authors put it forward as true.
- Checkable: passes — It can be checked against evidence.
- Load-bearing: fails — The paper’s conclusions may not depend on it.
- Based: passes — The paper gives a reason why it holds.
Probably not a substantial claim. The paper’s conclusions may not depend on it. It may state two separate claims as one.
What the paper did — it cites no source for this, so there is none to check. The quote shows it is in the paper.
In the paper
“we leveraged the 15 not used to encode RNAs as ‘blank’ barcode controls, not assigned to an RNA (Supplementary Data 1).”
§ Spatial transcriptomics of healthy and fibrotic human liver at single-cell resolution > Methods > MERFISH library preparation
plain- Asserted: passes — The authors put it forward as true.
- Checkable: passes — It can be checked against evidence.
- Load-bearing: fails — The paper’s conclusions may not depend on it.
- Based: passes — The paper gives a reason why it holds.
Probably not a substantial claim. The paper’s conclusions may not depend on it.
The paper relies on this without support.
The spatial organization of the human liver at single-cell resolution has not yet been described.
“Single-cell RNA sequencing (scRNA-seq) has advanced our understanding of cell types and their heterogeneity within the human liver, but the spatial organization at single-cell resolution has not yet been described.”
The paper relies on this without support.
The spatial organization of multinucleated hepatocytes and the impact of nuclear content on gene expression remain poorly understood.
“Yet the spatial organization of multinucleated hepatocytes and the impact of nuclear content on gene expression remains poorly understood17.”
The paper relies on this without support.
Many details of hepatocyte zonation, including how hepatocytes adjust gene expression along the portal-central vein axis and the function of this potential spatial fine tuning, remain unclear in the human liver.
“However, many details of this zonation, including how hepatocytes adjust their gene expression along the portal-central vein axis and the function of this potential spatial fine tuning remain unclear in the human liver, as current single-cell analyses of the human liver have either measured gene expression without spatial data or evaluated spatial data without”
The paper relies on this without support.
Subpopulations of macrophages and HSCs, and potential gene expression variations within, have not been resolved within the lobule organization at single-cell resolution in the human liver.
“While sub-populations of macrophages and HSCs in the healthy human liver have been described in single-cell data10–12, these subpopulations, and potential gene expression variations within, have not been resolved within the lobule organization at single-cell resolution in the human liver.”
The paper relies on this without support.
It is not clear if additional nuclear content leads to defined gene expression changes that could modulate function, or to what degree zonation influences nuclear content in the human liver.
“It is not clear if additional nuclear content leads to defined gene expression changes that could modulate function, or to what degree zonation influences nuclear content in the human liver.”
The paper relies on this without support.
Co-expression of receptor-ligand pairs in snRNA-seq data indicates potential cell-cell interactions in situ.
“To explore this possibility, we leveraged CellPhoneDB31 with our snRNA-seq data to explore potential modes of cell-cell interactions that could be shaped by liver zonation (Methods; Supplementary Data 3).”
The paper relies on this without support.
The fibrotic liver samples are representative of chronic liver injury and fibrosis.
“In order to explore the spatial and cellular remodeling that occurs in the context of disease, we next performed MERFISH on human liver samples from patients with liver injury and fibrosis (Supplementary Table 1 and Supplementary Fig. 1).”
The paper relies on this without support.
The liver samples analyzed are representative of healthy and fibrotic human liver.
“profiling ~310,000 cells in both healthy and diseased liver”
Self-check
Percentages, sums and reported differences re-computed from the paper’s own numbers.
Each contradiction between two passages listed here was confirmed by an independent check.
Rated major: it would touch a result — a value a result rests on, reported and recomputed p-values on opposite sides of the significance level, two passages that conflict with no sign which is right, or a cited work retracted before this paper was published.
In the paper
§ Spatial transcriptomics of healthy and fibrotic human liver at single-cell resolution > Methods > MERFISH staining
“To clear samples, they were embedded in a polyacrylamide gel and then digested for two days with proteinase K, as described previously19,20,51.”
§ Spatial transcriptomics of healthy and fibrotic human liver at single-cell resolution > Methods > MERFISH staining
“After the gel polymerized for 2 hours, samples were covered with a digestion solution (1% proteinase K, 20% v/v SDS [ThermoFisher, AM9823], 0.25% v/v triton-X [Sigma, T8787] in 2X SSC) and incubated at 37 °C for 24 hours.”
Citations
Cites
Fast, sensitive and accurate integration of single-cell data with Harmony
Korsunsky, I., Millard, N., Fan, J., Slowikowski, K., Zhang, F., Wei, K., Baglaenko, Y., Brenner, M., Loh, P.-R., & Raychaudhuri, S. (2019) · Nature Methods · doi:10.1038/s41592-019-0619-0 · Cited by 10,488
SCANPY: large-scale single-cell gene expression data analysis
Wolf, F. A., Angerer, P., & Theis, F. J. (2018) · Genome Biology · doi:10.1186/s13059-017-1382-0 · Cited by 8,881
McGinnis, C. S., Murrow, L. M., & Gartner, Z. J. (2019) · Cell Systems · doi:10.1016/j.cels.2019.03.003 · Cited by 4,521
Cellpose: a generalist algorithm for cellular segmentation
Stringer, C., Wang, T., Michaelos, M., & Pachitariu, M. (2021) · Nature Methods · doi:10.1038/s41592-020-01018-x · Cited by 4,369
Genetic variation in PNPLA3 confers susceptibility to nonalcoholic fatty liver disease
Romeo, S., Kozlitina, J., Xing, C., Pertsemlidis, A., Cox, D., Pennacchio, L. A., Boerwinkle, E., Cohen, J. C., & Hobbs, H. H. (2008) · Nature Genetics · doi:10.1038/ng.257 · Cited by 3,416
Spatially resolved, highly multiplexed RNA profiling in single cells
Chen, K. H., Boettiger, A. N., Moffitt, J. R., Wang, S., & Zhuang, X. (2015) · Science · doi:10.1126/science.aaa6090 · Cited by 2,969
Self-citationSingle-cell reconstruction of the early maternal–fetal interface in humans
Vento-Tormo, R., Efremova, M., Botting, R. A., Turco, M. Y., Vento-Tormo, M., Meyer, K. B., Park, J.-E., Stephenson, E., Polański, K., Goncalves, A., et al. (2018) · Nature · doi:10.1038/s41586-018-0698-6 · Cited by 2,358
A phase 3, randomized, controlled trial of resmetirom in NASH with liver fibrosis
Harrison, S. A., Bedossa, P., Guy, C. D., Schattenberg, J. M., Loomba, R., Taub, R., Labriola, D., Moussa, S. E., Neff, G. W., Rinella, M. E., et al. (2024) · New England Journal of Medicine · doi:10.1056/nejmoa2309000 · Cited by 2,084
Resolving the fibrotic niche of human liver cirrhosis at single-cell level
Ramachandran, P., Dobie, R., Wilson-Kanamori, J. R., Dora, E. F., Henderson, B. E. P., Luu, N. T., Portman, J. R., Matchett, K. P., Brice, M., Marwick, J. A., et al. (2019) · Nature · doi:10.1038/s41586-019-1631-3 · Cited by 1,784
SoupX removes ambient RNA contamination from droplet-based single-cell RNA sequencing data
Young, M. D., & Behjati, S. (2020) · GigaScience · doi:10.1093/gigascience/giaa151 · Cited by 1,619
Cited by
Sorted by citations
Schwabe, R. F., & Brenner, D. A. (2025) · Nature Reviews Gastroenterology & Hepatology · doi:10.1038/s41575-025-01068-6 · Cited by 112
The spatial and temporal activation of macrophages during fibrosis
Behmoaras, J. V., Mulder, K., Ginhoux, F., & Petretto, E. G. (2025) · Nature reviews. Immunology · doi:10.1038/s41577-025-01186-x · Cited by 75
Decoding organ fibrosis: mechanistic insights and emerging therapeutic strategies
Chen, X., Zhang, J., Guo, L., Wu, C., Zhou, J., Xu, M., Mo, L., Li, Y., & He, J. (2026) · Signal Transduction and Targeted Therapy · doi:10.1038/s41392-025-02532-0 · Cited by 40
Hepatic stellate cell heterogeneity: Functional aspects and therapeutic implications
Geng, Y., & Schwabe, R. F. (2025) · Hepatology · doi:10.1097/hep.0000000000001386 · Cited by 34
Spatial architecture of development and disease
Lázár, E., & Lundeberg, J. (2025) · Nature Reviews Genetics · doi:10.1038/s41576-025-00892-5 · Cited by 38
The emerging role of tissue regulatory T cells in tissue repair and regeneration
Raheem, A., Khan, I., Ahmad, I., Wajid, A., Alshahrani, M. Y., Alzahrani, F. M., Alzahrani, K. J., Qadeer, A., Liao, I., & Chen, C. (2025) · Frontiers in Immunology · doi:10.3389/fimmu.2025.1640113 · Cited by 28
Human assembloids recapitulate periportal liver tissue in vitro
Yuan, L., Dawka, S., Kim, Y., Liebert, A., Rost, F., Arnes‐Benito, R., Baenke, F., Götz, C., Tsang, D., Schuhmann, A., et al. (2025) · Nature · doi:10.1038/s41586-025-09884-1 · Cited by 31
A spatial atlas of the healthy human liver from live donors
Yakubovsky, O., Halpern, K. B., Shir, S., Novoselsky, R., Afriat, A., Egozi, A., Barkai, T., Harnik, Y., Hoefflin, R., Kohanim, Y. K., et al. (2026) · Nature · doi:10.1038/s41586-026-10377-y · Cited by 25
Kakazu, E., Mino, M., & Kanto, T. (2025) · Clinical and Molecular Hepatology · doi:10.3350/cmh.2025.0048 · Cited by 24
Unravelling tumour spatiotemporal heterogeneity using spatial multimodal data
Zuo, C., Zhu, J., Zou, J., & Chen, L. (2025) · Clinical and Translational Medicine · doi:10.1002/ctm2.70331 · Cited by 24
Dissecting the mechanisms of MASLD fibrosis in the era of single-cell and spatial omics
Colella, F., Henderson, N. C., & Ramachandran, P. (2025) · Journal of Clinical Investigation · doi:10.1172/jci186421 · Cited by 25
Weiss, C. A. M., Brown, L. A., Miranda, L., Pellizzoni, P., Steigerwald, S., Remmert, K., Hernandez, J. M., Borgwardt, K. M., Kleiner, D. E., Ben‐Moshe, S., et al. (2026) · Nature Metabolism · doi:10.1038/s42255-026-01459-2 · Cited by 27
Decoding the resistin-CAP1 pathway in intermediate monocytes mediating liver allograft rejection
Yang, P., Wang, X., Wu, W., Yuan, J., Wang, X., Ding, R., Cao, W., Li, C., Wang, Y., Xi, Z., et al. (2025) · Journal of Hepatology · doi:10.1016/j.jhep.2025.04.037 · Cited by 20
Zonation, Zonation, Zonation: The Real Estate of the Liver
Yasaka, T. M., Kim, C., Meadows, V., & Monga, S. P. (2025) · Annual Review of Pathology Mechanisms of Disease · doi:10.1146/annurev-pathmechdis-042624-091820 · Cited by 28
Molecular phenotypes and spatial archetypes: A new framework for cancer-associated fibroblasts
Liu, Y., Chen, X., Dai, Y., Jia, Y., Kieffer, Y., Xie, L., Zhou, Z., Tyler, L. A., Kim, A. C., Biffi, G., et al. (2026) · Cancer Cell · doi:10.1016/j.ccell.2026.06.001 · Cited by 19
Beyond M1/M2: The role of reactive oxygen species in liver fibrosis and immune modulation
Lu, H., Huang, J., Wang, Y.-C., Casals, E., Casals, G., & Zeng, M. (2025) · Redox Biology · doi:10.1016/j.redox.2025.103933 · Cited by 19
Wen, W., Liu, Z., Tan, W., Tan, Y., Li, W., Wan, J., Hu, H., Jiang, Z., Tang, X., Yang, J., et al. (2026) · npj Digital Medicine · doi:10.1038/s41746-026-02352-8 · Cited by 18
Novel regulators of hepatic macrophages in liver fibrosis
Tang, X., Bai, M., Du, X., Wang, H., Liu, M., Fu, X., Zhang, H., Liang, S., & Wang, L. (2025) · Frontiers in Immunology · doi:10.3389/fimmu.2025.1705503 · Cited by 12
Nevi, L., Aiello, C., Molinaro, F., Altomare, A., Musarra, T., Gallo, P., Taffon, C., Guarino, M. P. L., Gentilucci, U. V., Baiocchini, A., et al. (2025) · npj gut and liver. · doi:10.1038/s44355-025-00038-8 · Cited by 13
A comprehensive molecular atlas of the mesenchymal cell types in the mouse liver
Pietilä, R. S., Genové, G., Mocci, G., Miao, Y., Liu, J., Leptidis, S., Gaudio, F. D., Uhrbom, M., Vázquez-Liébanas, E., Gustafsson, S., et al. (2025) · EMBO Reports · doi:10.1038/s44319-025-00580-9 · Cited by 18
The emerging role of multiomics in aging research
Ruden, D. M. (2025) · Epigenomics · doi:10.1080/17501911.2025.2533111 · Cited by 12
Vu, H., Sun, Y., Xiong, Z., Tan, X., Radford‐Smith, D. E., Causer, A., Dickens, A. M., Hyötyläinen, T., Evstafev, I., Orešič, M., et al. (2025) · JHEP Reports · doi:10.1016/j.jhepr.2025.101657 · Cited by 13
Kern, C., Zhang, Q., Lu, Y., Eschbach, J., Zeng, Z., Farah, E. N., Tai, C., Yang, K.-F., Jenie, I., Yao, F., et al. (2025) · SSRN Electronic Journal · doi:10.1101/2025.11.02.686137 · Cited by 11
Human PSC-derived liver cells and their applications for disease models and drug discovery
Koui, Y., Tanaka, M., & Kido, T. (2025) · Pharmacology & Therapeutics · doi:10.1016/j.pharmthera.2025.108907 · Cited by 10
Spatial genomics: Mapping the landscape of fibrosis
Velu, P. P., Abhari, R. E., & Henderson, N. C. (2025) · Science Translational Medicine · doi:10.1126/scitranslmed.adm6783 · Cited by 8
Spatial transcriptomics: integrating platforms and computational approaches for clinical insights
Song, W., Wang, D., Li, J., & Zhang, R. (2025) · Biotechnology Advances · doi:10.1016/j.biotechadv.2025.108791 · Cited by 8
Choi, S., & Jeong, J. (2026) · International Journal of Molecular Sciences · doi:10.3390/ijms27020619 · Cited by 11
Multi-Scale Transcriptomics Redefining the Tumor Immune Microenvironment
Sun, J., Xiao, Y., Xie, L., Qin, D., Zou, Y., Liu, Y., Zhai, Y., Zhang, M., Li, T., Hao, Y., et al. (2026) · BioTech · doi:10.3390/biotech15010007 · Cited by 10
Zhu, S., 邹梦洁, Wu, Q., Zou, Y., Tan, T., Huang, Z., Gong, Z., Luo, H., & Dong, X. (2026) · The FASEB Journal · doi:10.1096/fj.202503607rr · Cited by 8
Beyond ADME: The Endogenous Functions of Drug Transporters and Its Impact on Human Disease
Blaze, C., & Shu, Y. (2025) · Pharmaceutics · doi:10.3390/pharmaceutics17060685 · Cited by 6
Hong, X., Ye, Y., Lin, C., Zheng, M., Lin, F., Xiong, Q., Xu, W., Huang, L., Zhang, Y., & Zheng, H. (2025) · Frontiers in Immunology · doi:10.3389/fimmu.2025.1665648 · Cited by 6
Hepatic Fibrosis and Liver Cancer
Anton, A., Friedman, S. L., & Cogliati, B. (2025) · Seminars in Liver Disease · doi:10.1055/a-2779-4937 · Cited by 10
Spatial transcriptomics in bone research: navigating hype and hurdles
Sokolowskei, D., Shah, A., Trostle, A. J., Juan, C., Sammarco, M. C., & Tower, R. J. (2025) · Pathology · doi:10.1016/j.pathol.2025.10.003 · Cited by 6
Xu, X., Du, W., Yang, R., et al. (2025) · Chemical Engineering Journal · doi:10.1016/j.cej.2025.167047 · Cited by 4
Towards a reference cell atlas of liver diversity over the human lifespan
Taylor, S. A., Bader, G. D., MacParland, S. A., Mullen, A. C., Andrews, T. S., Cuenca, A. G., DasGupta, R., Gehring, A. J., Grün, D., Guilliams, M., et al. (2025) · Nature Reviews Gastroenterology & Hepatology · doi:10.1038/s41575-025-01114-3 · Cited by 5
Self-citationNew perspectives in the treatment of liver cirrhosis: targeting macrophage regulatory mechanisms
Zheng, S., Li, S., Wang, Q., Zao, X., Li, X., Qi, W., Cheng, F., Yuexiao, G. E. N. G., Zhang, P., Shi, X., et al. (2025) · Journal of Translational Medicine · doi:10.1186/s12967-025-07239-y · Cited by 5
When imaging technology meets single-cell omics: new paradigm in developmental biology
Wang, C., Zhang, X. E., Zhang, Y., & Liu, F. (2025) · Cell Regeneration · doi:10.1186/s13619-025-00276-4 · Cited by 4
Lu, W., Xu, J., Xu, Y., Zhou, Y., Que, S., & Liu, Z. (2026) · Frontiers in Cellular and Infection Microbiology · doi:10.3389/fcimb.2025.1686649 · Cited by 5
Paolini, E., Meroni, M., Longo, M., Badiali, S., Maggioni, M., Fracanzani, A. L., & Dongiovanni, P. (2026) · International Journal of Molecular Sciences · doi:10.3390/ijms27031601 · Cited by 4
The gene regulatory networks shaping macrophage plasticity and altered function in fibrosis
Kolostyák, Z., & Nagy, L. (2026) · Frontiers in Immunology · doi:10.3389/fimmu.2026.1767954 · Cited by 5
Understanding HBV immunopathogenesis to inform future immune-based therapies
Bossis, M., Le, P.-H., Asselah, T., Baumert, T. F., & Tonnerre, P. (2026) · Antiviral Research · doi:10.1016/j.antiviral.2026.106424 · Cited by 4
The plastisphere: from microbial pollution to biodegradable solution
Lin, W., Yang, K., Lu, T., Kang, X., Xing, X., Korzeniewska, E., Ivleva, N. P., Ju, F., Qian, H., Cui, L., et al. (2026) · ENGINEERING Environment · doi:10.1007/s11783-026-2234-5 · Cited by 6
Protocol optimization improves the performance of multiplexed RNA imaging
Luce, J. J., Reardon-Lochbaum, C. A., Cadinu, P., Xu, R. J., Aceves-Salvador, J., Semizoglou, E., Wong, B., Lopez, I., Cantor, A. B., Renthal, W. R., et al. (2025) · Scientific Reports · doi:10.1038/s41598-025-17477-1 · Cited by 4
Self-citationKambhampati, S., D’Alessio, L., Grab, F., Fleming, S. J., Liu, S., Raichur, R., Chen, F., & Babadi, M. (2025) · Cell Systems · doi:10.1016/j.cels.2025.101394 · Cited by 4
Diagnosing Autoimmune Hepatitis: Histological Correlations and Emerging Technologies
Cazzaniga, G., Bolis, F., Caime, C., Piazza, R., Žigutytė, L., Kather, J. N., Pagni, F., Invernizzi, P., Carbone, M., & Gerussi, A. (2025) · Liver International · doi:10.1111/liv.70377 · Cited by 3
Cheng, J., Chow, P. K. H., & Liu, N. (2026) · NAR Genomics and Bioinformatics · doi:10.1093/nargab/lqag039 · Cited by 3
Fan, Z., Wei, W., & Chen, W. (2026) · Medicine in Novel Technology and Devices · doi:10.1016/j.medntd.2025.100425 · Cited by 2
Stereo-cell deciphers the spatial and functional heterogeneity of polyploid hepatocytes
Yang, Y., Luo, J., Cai, Y., Guo, P., Guo, Q., Wu, H., Liu, L., & Hao, S. (2026) · GigaScience · doi:10.1093/gigascience/giag023 · Cited by 1
Zhang, F., Li, R., Wang, T., Zhang, J., Wu, Z., You, Q., Liu, X., Xiao, C., Zhang, J., Chen, H., et al. (2026) · Advanced Science · doi:10.1002/advs.202522891 · Cited by 2
Wang, F., Ren, J., Zhou, Y., Huo, W., Liu, H., Qin, M., Jing, Y., Yin, Z., Shi, T., Shan, H., et al. (2026) · Nature Communications · doi:10.1038/s41467-026-72642-y · Cited by 2
Gene regulatory mechanisms underlying sex- and age-dependent pathophysiology of MASLD
Morral, N. (2026) · Clinical Science · doi:10.1042/cs20250052 · Cited by 2
Mapping mesenchymal diversity in the developing human intestine and organoidsPreprint
Johnson, K. F., Dong, X., Tsai, Y.-H., et al. (2025) · bioRxiv (Cold Spring Harbor Laboratory) · doi:10.1101/2025.07.22.665939 · Cited by 2
Genetic Architecture of Circulating Metabolic Biomarkers Across Ancestral PopulationsPreprint
Takeuchi, Y., Koido, M., He, Y., Nakamura, S., Liu, X., Itokawa, N., Tsuru, H., Sagiya, Y., Nagai, A., Morisaki, T., et al. (2025) · medRxiv · doi:10.64898/2025.12.03.25341540 · Cited by 2
RNA Sequencing Reveals Effects of a New Complex Bath Additive on Cultured Cells
Otani, N., Nguyen, K. D. M., Wan, J., Kanki, Y., & Sugasawa, T. (2025) · Cosmetics · doi:10.3390/cosmetics12030098 · Cited by 1
CellSP enables module discovery and visualization for subcellular spatial transcriptomics data
Aggarwal, B., & Sinha, S. (2025) · Communications Biology · doi:10.1038/s42003-025-08891-2 · Cited by 1
Somatic mutations impose an entropic upper bound on human lifespan
Efimov, E., Fedotov, V., Malaev, L. G., Khrameeva, E. E., & Kriukov, D. V. (2026) · npj Aging · doi:10.1038/s41514-026-00421-6 · Cited by 2
Diploid hepatocytes resist acetaminophen-induced liver injury through suppressed JNK signaling
Wilson, S. R., Delgado, E. R., Alencastro, F., Loewenstein, R. L., Leek, M. P., Peters, L. R., Kamel, K., Wilkinson, P. D., Jain, S., Locker, J. D., et al. (2026) · Cell Death and Disease · doi:10.1038/s41419-026-08448-z · Cited by 1
Kim, H., & Lachmann, N. (2026) · Frontiers in Immunology · doi:10.3389/fimmu.2026.1767691 · Cited by 2
Sex biases in ILC1 phenotypes do not alter immune control of cytomegalovirus
Marrocco, R., Nguyen, M. U., Balcan, A., et al. (2026) · Stacks. · doi:10.60102/stacks-26004 · Cited by 1
Lin, G. W., Lin, Z., Su, Q. Y., et al. (2026) · Frontiers in Immunology · doi:10.3389/fimmu.2026.1813173 · Cited by 1
Epigenetic reprogramming of hepatic antigen presenting cells in chronic liver disease
Ángel‐Gomis, E., Juanola, O., Caparrós, E., & Francés, R. (2026) · Frontiers in Immunology · doi:10.3389/fimmu.2026.1783588 · Cited by 1
Targeting lipid–fibrotic signaling crosstalk for antifibrotic therapy
Kn, S., & Shetty, S. S. (2026) · Toxicology Mechanisms and Methods · doi:10.1080/15376516.2026.2659870 · Cited by 1
Zinc Finger Proteins as Regulators of Organ Fibrosis
Boonkaew, B., Srivongtrakul, W., & Ariyachet, C. (2026) · Journal of Cellular Biochemistry · doi:10.1002/jcb.70103 · Cited by 1
Liver Macrophages in the Pathogenesis of Viral Hepatitis
Tsomidis, I., Tsakou, A., Voumvouraki, A., & Kouroumalis, E. (2026) · Current Issues in Molecular Biology · doi:10.3390/cimb48070687 · Cited by 2
Macrophage FOLR2 drives liver fibrosis via intercellular engagement of TGFβRII.
Yuan, M.-M., Zheng, B., Wang, J.-L., Xu, S.-Q., Wang, S., Tan, Y., Feng, Y., Dong, X., Zhu, Q.-H., Yan, J., et al. (2026) · Acta Pharmacologica Sinica · doi:10.1038/s41401-026-01878-7 · Cited by 1
Yoon, S. J., Eom, J. A., & Suk, K. T. (2026) · Frontiers in Immunology · doi:10.3389/fimmu.2026.1864805 · Cited by 1
Padvitski, T., Avila, P. U., Chen, H., Özel, C., Braun, F., Kroll, M.-K., Vossen, C., Wienand, P., Butt, L., Unnersjö‐Jess, D., et al. (2026) · Cell Genomics · doi:10.1016/j.xgen.2026.101337 · Cited by 2
Cai, X., Zhang, L., & Li, T. (2025) · Clinical and Molecular Hepatology · doi:10.3350/cmh.2025.0731 · Cited by 1
Exploiting pair correlation function to describe biological tissue structurePreprint
Mangane, F., Casanova, R., Borgman, K. J. E., de Koning, L., Haberecker, M., Pauli, C., Dettwiler, S., Roman‐Roman, S., Bodenmiller, B., Rodrigues, M. J., et al. (2025) · bioRxiv (Cold Spring Harbor Laboratory) · doi:10.64898/2025.12.19.695425 · Cited by 2
BellaVista: Open-Source Visualization for Imaging-Based Spatial TranscriptomicsPreprint
Coles, A. M., Liu, Y., & Kosuri, P. (2025) · bioRxiv (Cold Spring Harbor Laboratory) · doi:10.1101/2025.01.07.631783
A comprehensive molecular atlas of the cell types in the mouse liverPreprint
Pietilä, R. S., Genové, G., Mocci, G., Miao, Y., Liu, J., Leptidis, S., Gaudio, F. D., Uhrbom, M., Vázquez-Liébanas, E., Gustafsson, S., et al. (2025) · bioRxiv (Cold Spring Harbor Laboratory) · doi:10.1101/2025.01.24.634721
Quin, J. E., Iturritza, M. U., Mosquera, K. D., Hildebrandt, F., Barrenäs, F., & Ankarklev, J. (2025) · bioRxiv (Cold Spring Harbor Laboratory) · doi:10.1101/2025.03.17.643687
Vu, H., Sun, Y., Xiong, Z., Radford‐Smith, D. E., Causer, A., Nefzger, C. M., O'Sullivan, E. D., Watt, M. J., Ramm, G. A., Clouston, A. D., et al. (2025) · bioRxiv (Cold Spring Harbor Laboratory) · doi:10.1101/2025.03.20.644239
Defining Keypoints to Align H&E Images and Xenium DAPI-Stained Images Automatically
Lin, Y., Wang, Y., Wang, J., Raina, M., Ferreira, R. M., Eadon, M. T., Liang, Y., & Xu, D. H. (2025) · Cells · doi:10.3390/cells14131000
Zhang, C. X., Li, J., Luo, O., Fu, X., Andrews, T. S., Steinberg, G. R., & Wang, D. (2026) · bioRxiv (Cold Spring Harbor Laboratory) · doi:10.64898/2026.02.07.704573
Cheng, J., Li, S., Kim, S., Ang, C. H., Chew, S. C., Chow, P. K.-H., & Liu, N. (2026) · BMC Bioinformatics · doi:10.64898/2026.03.01.708931
You, W.-J., Ji, J.-F., Nguyen, N., Esp, L., & Sun, X.-L. (2026) · Journal of Lipid Research · doi:10.1016/j.jlr.2026.101022
Wang, Y., Zhao, R., Yuan, Z., Zhai, L., Ning, X., Lv, M., Jin, Z., Iqbal, H., Ur-Rehman, U., Yi, Z., et al. (2026) · iScience · doi:10.1016/j.isci.2026.115389 · Cited by 2
Sun, J., Yang, R., Liu, M., et al. (2026) · Acta Pharmaceutica Sinica B · doi:10.1016/j.apsb.2026.03.045
AI in multi-omics analysis of liver diseases
Ansari, H. R., Rehan, M., & Ahmed, F. (2026) · Progress in molecular biology and translational science · doi:10.1016/bs.pmbts.2026.02.004
Marine Bioactives in Liver Aging: Mechanistic Insights and Translational Potential
Traspas, R. M., & Tman, Z. (2026) · Marine Drugs · doi:10.3390/md24040138 · Cited by 1
Decoding Condition-Specific Cellular Crosstalk in Spatial Omics via Bilinear Edge ClassificationPreprint
Karin, J., Friedman, R., & Nitzan, M. (2026) · bioRxiv (Cold Spring Harbor Laboratory) · doi:10.64898/2026.05.03.722470
Recent advances in engineered exosomes for targeted microRNA delivery to reverse liver fibrosis
Miyanroodan, S. M., & Sohail, M. (2026) · Journal of Drug Delivery Science and Technology · doi:10.1016/j.jddst.2026.108447
Chen, L., Zhang, N., Huang, Y., Qu, J., Fang, Y., Yuan, Y., Fu, J., Wan, D., Zhang, Q., Chen, L., et al. (2026) · Journal of Nanobiotechnology · doi:10.1186/s12951-026-04499-8
Shared mechanisms of organ fibrosis
Humphreys, B. D. (2026) · JCI Insight · doi:10.1172/jci.insight.200952
Travers, P. M., Wang, Y., Yan, Y., Zou, J., Halder, N., Clift, K. E., Cai, X., Kruse, R. L., Kumbhari, V., Ji, B., et al. (2026) · Livers · doi:10.3390/livers6040055
Su, Z., Yin, S., & Wu, Y. (2026) · Computers in Biology and Medicine · doi:10.1016/j.compbiomed.2026.111838
G-LATO: Inference of Spatial Latent Ordering via Deep Gaussian ProcessesPreprint
Zago, M., Mukherjee, S., Schleicher, J., Bürkner, P., Tabatabai, G., & Claassen, M. (2026) · bioRxiv (Cold Spring Harbor Laboratory) · doi:10.64898/2026.06.23.734031
Phytocarbon Dots as an Oral Nano-Degrader of ENO1 for Alleviating Hepatic FibrosisPreprint
Gao, L., Liu, T., Li, Y.-K., Huang, P., Li, J. Y., Gao, H., Li, J., Zheng, J.-X., & Lu, Z. (2026) · Research Square · doi:10.21203/rs.3.rs-10125058/v1
HLiCA: An integrated cell atlas of the healthy human liverPreprint
Edgar, R. D., Portman, J. R., Hu, H., Pouyabahar, D., Rahman, R. R., Stueckmann, D., Choi, Y., Neavin, D. R., Atif, J., Clarke, Z. A., et al. (2026) · bioRxiv (Cold Spring Harbor Laboratory) · doi:10.64898/2026.06.30.735539
Self-citationBurks, E., Copes, J., Nguyen, K., Tawil-Brown, A., & Yan, S. (2026) · Autophagy Reports · doi:10.1080/27694127.2026.2698350 · Cited by 1
Hepatocyte-derived soluble Tim-3 contributes to alleviating acetaminophen-induced liver injury
Huang, C., Li, J., Chen, S., et al. (2026) · Immunity & Inflammation · doi:10.1007/s44466-026-00047-z
Wang, Z., Yang, C., Tang, X., Yin, E., Yao, Y., Luo, Y., He, J., & Sun, N. (2026) · Genome Medicine · doi:10.1186/s13073-026-01713-y
The Biological Clock–Mitochondria Axis in the Liver: From Molecular Mechanisms to Metabolic Disease
Manuti, V., Murgo, E., Saponaro, A. A., Sfregola, U., Sangineto, M., Villani, R., Serviddio, G., Mazzoccoli, G., & Colangelo, T. (2026) · Biology · doi:10.3390/biology15141197
Mapping mesenchymal diversity in the human small intestine and organoids
Johnson, K. F., Dong, X., Tsai, Y.-H., Wu, A., Clark, S. G., Vallie, A., Huang, S., Childs, C. J., Zwick, R. K., Glass, I. A., et al. (2026) · Nature Cell Biology · doi:10.1038/s41556-026-02027-2 · Cited by 2
Mi, J., Su, K., Wang, R., Zhou, J., Yan, F., & Liu, O. (2026) · Drug Discovery Today · doi:10.1016/j.drudis.2026.104753
MASLD: Spatial Mechanisms and New Therapeutics
Stoess, C., Onyuru, J., Hu, Y., Jiang, Y., Xin, Z., Panchal, A., & Hartmann, P. (2026) · Biomolecules · doi:10.3390/biom16081129
Völker, L. A., & Ceccon, G. S. (2026) · Springer eBooks · doi:10.1007/978-3-476-06005-1_55-1
LiverDCP: A Disease–Cell–Protein Framework for Multi-scale Modeling of Disease BiologyPreprint
Shi, Z., Song, Z., Steveson-Lerner, H., Dong, B., & Zhao, H. (2026) · bioRxiv (Cold Spring Harbor Laboratory) · doi:10.64898/2026.08.07.743628 · Cited by 1
A practical toolbox for modelling fibrosis in vitro
Morsink, M. A. J., Fleischer, S., Nash, T. R., Falcucci, T., Leonard‐Duke, J., Li, V. Y., Pinezich, M. R., Sahoo, J. K., Hasturk, O., Lee, A., et al. (2026) · Nature Biomedical Engineering · doi:10.1038/s41551-026-01749-w
Metadata
- Authors
- Watson, B. R., Paul, B., Rahman, R. U., Amir-Zilberstein, L., Segerstolpe, Å., Epstein, E. T., Murphy, S., Geistlinger, L., Lee, T., Shih, A., Deguine, J., Xavier, R. J., Moffitt, J. R., & Mullen, A. C.
- Affiliations
- Boston Children's Hospital (US)
- University of Massachusetts Chan Medical School (US)
- Broad Institute (US)
- Massachusetts General Hospital (US)
- Harvard University (US)
- Corresponding author
- Moffitt, Jeffrey R.
- Mullen, Alan C.
- ORCID
- Venue
- Nature Communications
- Published
- 2025-01-02
- Volume
- 16
- Issue
- 1
- Pages
- 319-319
- ISSN
- 2041-1723 (ISSN-L)
- PMC
- PMC11697218
- OpenAlex
- W4406016593
- Semantic Scholar
- 40a7d19ca7efac7a59e9c929fab221b8cc653eed
- Cited by
- 123
- References
- 69
- Citations by year
- 2026: 80 · 2025: 43
- FWCI
- 30.97
- Type
- journal article
- Language
- en
- Open access
- gold
- doi.org
- Licence
- Locations
- Nature Communications (publishedVersion, cc-by-nc-nd)
- bioRxiv (Cold Spring Harbor Laboratory) (acceptedVersion, cc-by-nc-nd)
- PubMed (publishedVersion)
- PubMed Central (submittedVersion, cc-by-nc-nd)
- RePEc: Research Papers in Economics (submittedVersion)
- DOAJ (DOAJ: Directory of Open Access Journals) (submittedVersion, cc-by-sa)
- Funders
- Chan Zuckerberg Initiative Seed Project
- Topics
- Life Sciences › Biochemistry, Genetics and Molecular Biology › Molecular Biology › Single-cell and spatial transcriptomics
- Health Sciences › Medicine › Hepatology › Liver physiology and pathology
- Health Sciences › Medicine › Hepatology › Liver Disease Diagnosis and Treatment
- Keywords
- liver fibrosis, hepatocytes, hepatocyte ploidy, liver zonation, spatial transcriptomics, MERFISH, single-nucleus RNA sequencing, hepatic macrophages, mesenchymal cells, ligand-receptor interactions, liver injury, hepatocyte heterogeneity
- MeSH terms
- Adult, Female, Humans, Liver, Liver Cirrhosis, Macrophages, Male, In Situ Hybridization, Fluorescence, Sequence Analysis, RNA, Gene Expression Profiling, Hepatocytes, Single-Cell Analysis, Transcriptome
About these checks
Registry, retraction, Cites and statistics results are computed, not judged, with one exception: a printed reference that no index lists is read once by a model before it counts as a citation error. Claims are extracted by a model and kept only when their quote appears verbatim in the text; each cited source is then checked, with a model’s help, for whether it says what the claim relies on. Those verdicts can be wrong — read the claim’s quote and the cited source before relying on one.
A language model drew the claims from the paper on 2026-10-22, under version 3 of the claim definition (model deepseek-v4.1-flash, prompt extract-v3).
A second model labelled each claim on 2026-10-22 (model jev-1.13-20260917, definition revision gold-guideline-v0.2).
Cited sources are checked with a language model’s help (gpt-6-sol).
Statistics and arithmetic are recomputed, not judged.
Confidence bands are shown only for fields calibrated on our annotated test set. None is calibrated yet, so no band is shown.
What counts as a claim ›How we measure confidence ›How we check this ›
Are you an author, or do you see a problem with this page? Request a review
