

The DOI matches its Crossref record; 64 of the 64 references it cites were found in a registry or an index; none of the 35 sources its claims cite is checked for support yet.
Naturally enhanced neutralizing breadth against SARS-CoV-2 one year after infection
Open accessPublished version of a preprint
Abstract
More than one year after its inception, the coronavirus disease 2019 (COVID-19) pandemic caused by severe acute respiratory syndrome coronavirus 2 (SARS-CoV-2) remains difficult to control despite the availability of several working vaccines. Progress in controlling the pandemic is slowed by the emergence of variants that appear to be more transmissible and more resistant to antibodies 1,2 . Here we report on a cohort of 63 individuals who have recovered from COVID-19 assessed at 1.3, 6.2 and 12 months after SARS-CoV-2 infection, 41% of whom also received mRNA vaccines 3,4 . In the absence of vaccination, antibody reactivity to the receptor binding domain (RBD) of SARS-CoV-2, neutralizing activity and the number of RBD-specific memory B cells remain relatively stable between 6 and 12 months after infection. Vaccination increases all components of the humoral response and, as expected, results in serum neutralizing activities against variants of concern similar to or greater than the neutralizing activity against the original Wuhan Hu-1 strain achieved by vaccination of naive individuals 2,5–8 . The mechanism underlying these broad-based responses involves ongoing antibody somatic mutation, memory B cell clonal turnover and development of monoclonal antibodies that are exceptionally resistant to SARS-CoV-2 RBD mutations, including those found in the variants of concern 4,9 . In addition, B cell clones expressing broad and potent antibodies are selectively retained in the repertoire over time and expand markedly after vaccination. The data suggest that immunity in convalescent individuals will be very long lasting and that convalescent individuals who receive available mRNA vaccines will produce antibodies and memory B cells that should be protective against circulating SARS-CoV-2 variants.
Overview
AI snapshot
Written from the paper’s full text.
TL;DR
In a longitudinal cohort of 63 SARS-CoV-2 convalescent individuals, antibody reactivity, neutralizing activity, and RBD-specific memory B cells remained relatively stable between 6 and 12 months after infection in the absence of vaccination, while mRNA vaccination boosted humoral responses by roughly 30- to 50-fold. Over time, memory B cells continued to evolve through somatic mutation and clonal turnover, producing antibodies with increased potency and breadth against SARS-CoV-2 variants.
Key findings
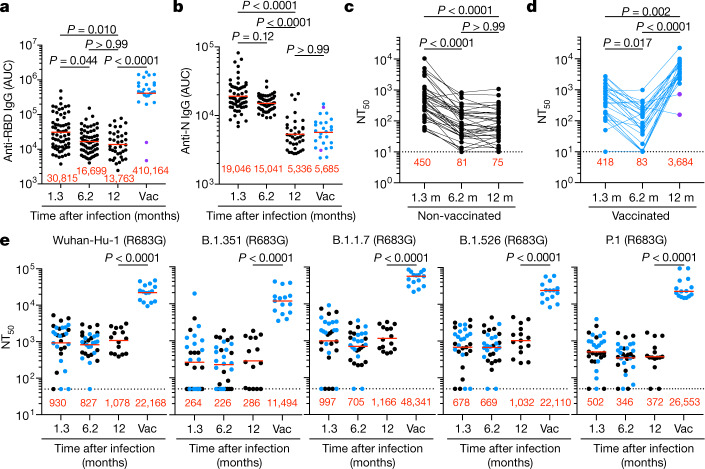
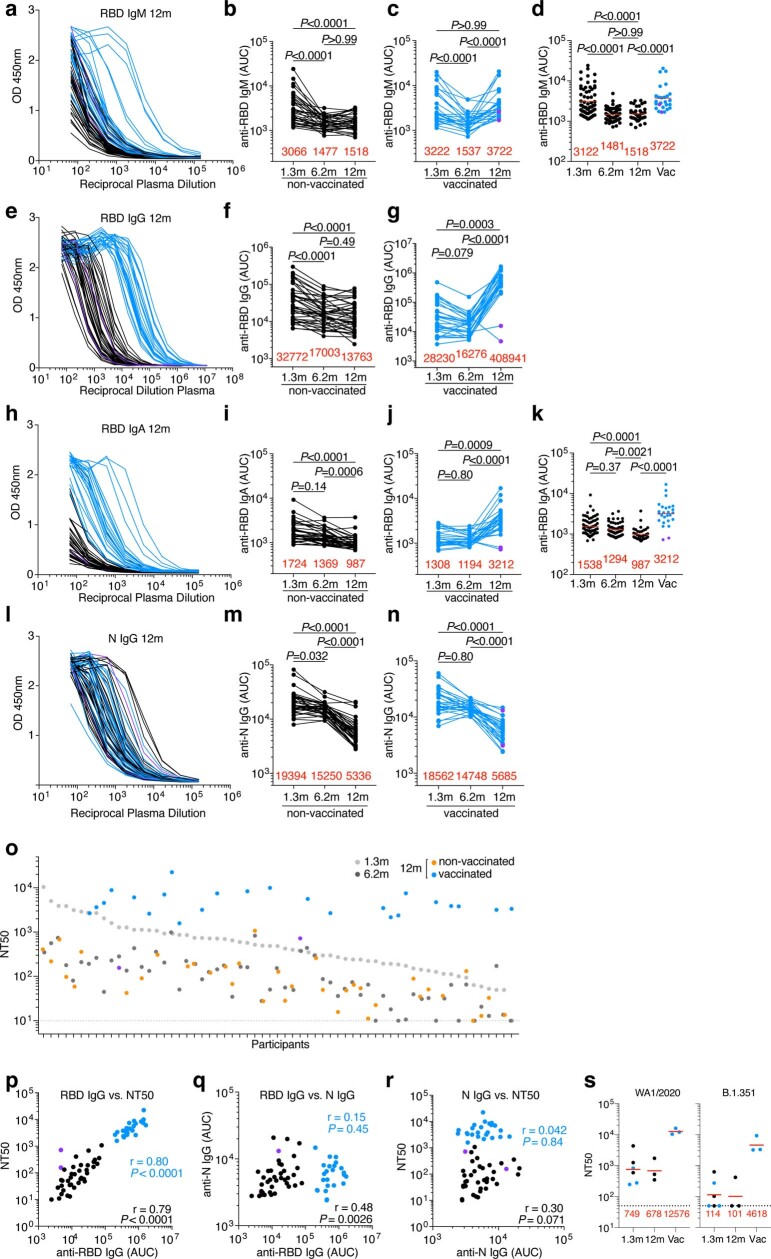
- Among unvaccinated convalescent individuals, anti-RBD IgM, IgG, and IgA titres were maintained at 103%, 82%, and 72% between 6 and 12 months, whereas anti-N titres decreased significantly; vaccination increased anti-RBD IgG titres nearly 30-fold.
- At 12 months, unvaccinated individuals had a geometric mean neutralizing titre (NT50) of 75, not significantly different from 6.2 months; vaccinated individuals had a geometric mean NT50 of 3,684, nearly 50-fold higher. After vaccination, geometric mean NT50 values against variants were 11,493 for B.1.351, 48,341 for B.1.1.7, 22,109 for B.1.526, and 26,553 for P.1.
- RBD-specific memory B cells were 1.35-fold lower at 12 versus 6.2 months in unvaccinated individuals (P = 0.027), but vaccinated individuals showed an average 8.6-fold increase. Among 89 clones detected at 12 months, 61% were not previously detected and 39% were present at an earlier time point.
- Of 174 monoclonal antibodies tested at 12 months, 173 bound RBD; geometric mean ELISA EC50 was 2.6 ng ml−1, lower than at 6 months. Neutralizing IC50 improved from 171 ng ml−1 at 1.3 months to 116 ng ml−1 at 6 months to 79 ng ml−1 at 12 months. For matched clonal antibody pairs, 10 of 15 antibodies at 12 months neutralized all tested mutants versus 1 of 15 at 1.3 months, with IC50 values as low as 1 ng ml−1 against K417N/E484K/N501Y.
Methods
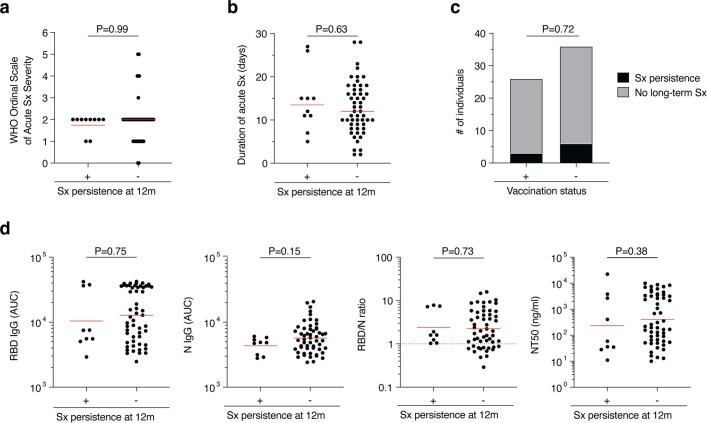
- Longitudinal cohort of 63 adults aged 26–73 years (median 47; 43% female; 10% hospitalized) assessed at 1.3, 6.2, and 12 months after SARS-CoV-2 infection; 26 participants (41%) had received at least one dose of Moderna mRNA-1273 or Pfizer-BioNTech BNT162b2, on average 40 days before the visit (range 2–82 days) and 311 days after illness onset (range 272–373 days). All tested negative for active infection by saliva PCR at 12 months.
- Plasma ELISAs measured RBD and N antibody binding; neutralizing activity was measured with HIV-1 pseudotyped with SARS-CoV-2 spike and with authentic SARS-CoV-2 WA1/2020 and B.1.351. Flow cytometry counted RBD-specific memory B cells; single-cell sorting, antibody sequencing, cloning, and expression generated monoclonal antibodies. Biolayer interferometry assessed epitope competition and affinity; computational analyses assessed clonal relationships, somatic hypermutation, and phylogenetics.
- Statistical comparisons used Kruskal–Wallis with Dunn’s multiple comparisons, Friedman, Mann–Whitney, Wilcoxon, and Spearman tests as indicated. The paper states that no statistical methods were used to predetermine sample size, experiments were not randomized, and investigators were not blinded.
Limitations
- Stated in the paper: no statistical methods were used to predetermine sample size; experiments were not randomized; investigators were not blinded to allocation during experiments and outcome assessment.
- Evident from the text: the cohort was small (n = 63), mostly had mild initial infections (only 10% hospitalized), and 41% had received mRNA vaccination, with vaccination occurring at variable times before the 12-month visit (range 2–82 days).
- Evident from the text: follow-up ends at 12 months, so conclusions about very long-lasting immunity and protection against future variants are inferred from this interval and from in vitro antibody measurements rather than direct clinical protection data.
Model-written summary. Check it against the paper before relying on it.
Integrity signals
Registry
Cites
Statistics
Figures
Verification
Claims the paper makes
22 Own result · 13 Not checked yet · 10 Own method · 9 Own interpretation
A result the paper reports from its own data — it cites no other source for it, so there is none to check. The quote shows it is in the paper.
In the paper
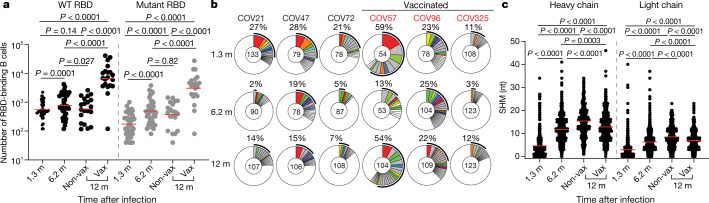
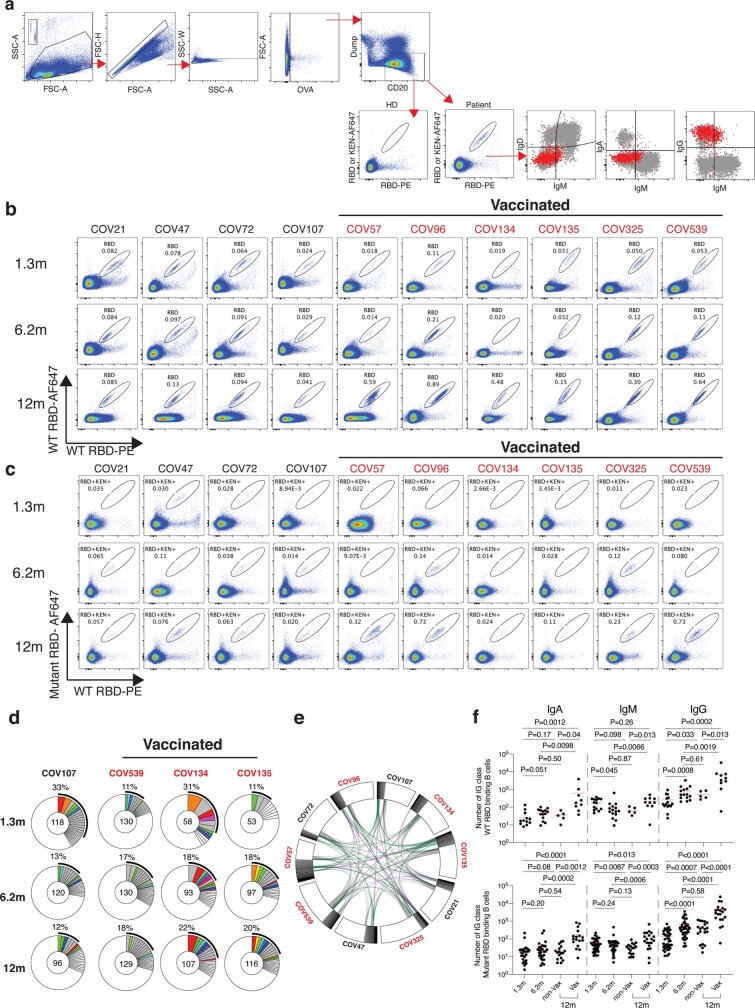
“Without vaccination, the number of RBD-specific memory B cells present 12 months after infection was 1.35-fold lower than the earlier 6.2-month time point (P = 0.027, Fig. 2a).”
§ Naturally enhanced neutralizing breadth against SARS-CoV-2 one year after infection > Memory B cells
plain- Asserted: passes — The authors put it forward as true.
- Checkable: passes — It can be checked against evidence.
- Load-bearing: unclear — It is unclear whether the paper’s conclusions depend on it.
- Based: passes — The paper gives a reason why it holds.
A result the paper reports from its own data — it cites no other source for it, so there is none to check. The quote shows it is in the paper.
In the paper
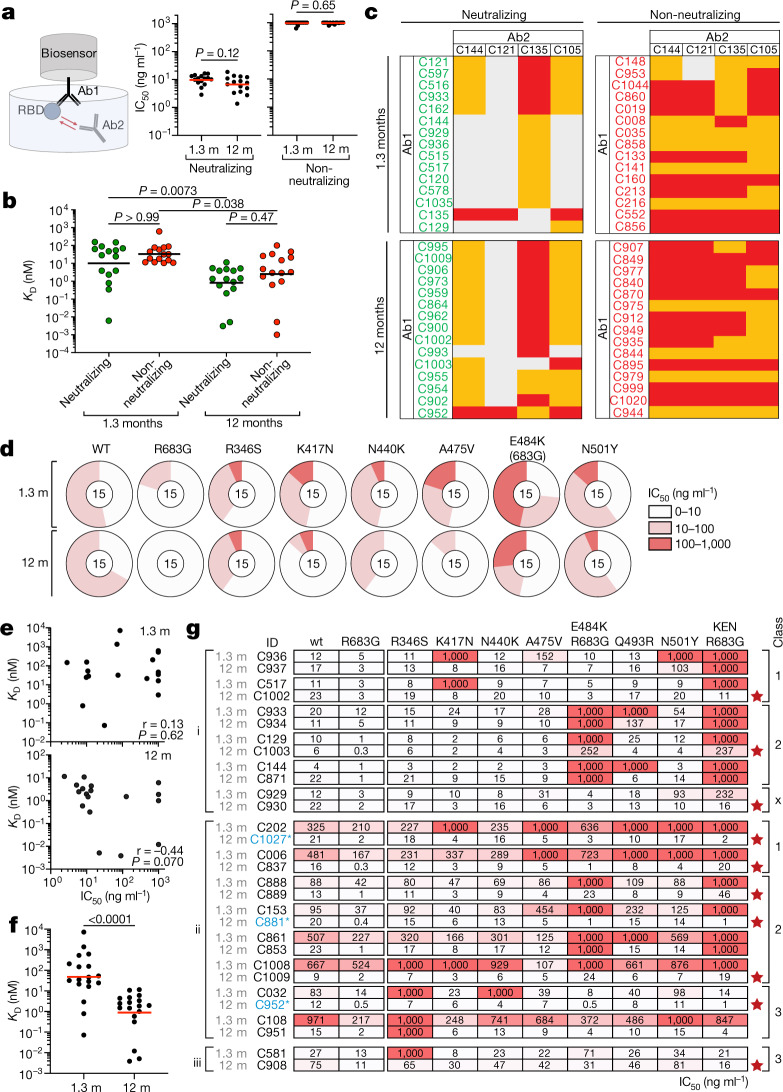
“However, neutralizing breadth increased between 1.3 and 12 months for all 15 pairs, even when neutralizing activity against the wild-type was unchanged or decreased (Fig. 4g, Supplementary Table 8).”
§ Naturally enhanced neutralizing breadth against SARS-CoV-2 one year after infection > Epitopes and breadth of neutralization
plaindirect- Asserted: passes — The authors put it forward as true.
- Checkable: passes — It can be checked against evidence.
- Load-bearing: passes — The paper’s conclusions depend on it.
- Based: passes — The paper gives a reason why it holds.
A result the paper reports from its own data — it cites no other source for it, so there is none to check. The quote shows it is in the paper.
In the paper
“After vaccination the geometric mean NT50 increased to 11,493, 48,341, 22,109 and 26,553 against B.1.351, B.1.1.7, B.1.526 and P.1, respectively.”
§ Naturally enhanced neutralizing breadth against SARS-CoV-2 one year after infection > Plasma SARS-CoV-2 antibody reactivity
plaindirect- Asserted: passes — The authors put it forward as true.
- Checkable: passes — It can be checked against evidence.
- Load-bearing: passes — The paper’s conclusions depend on it.
- Based: passes — The paper gives a reason why it holds.
A result the paper reports from its own data — it cites no other source for it, so there is none to check. The quote shows it is in the paper.
In the paper
“Increased activity was evident against K417N, N440K, A475V, E484K and N501Y (Fig. 4d, Supplementary Table 6).”
§ Naturally enhanced neutralizing breadth against SARS-CoV-2 one year after infection > Epitopes and breadth of neutralization
plain- Asserted: passes — The authors put it forward as true.
- Checkable: passes — It can be checked against evidence.
- Load-bearing: passes — The paper’s conclusions depend on it.
- Based: passes — The paper gives a reason why it holds.
None of the sources cited for this claim have been checked yet.
In the paper
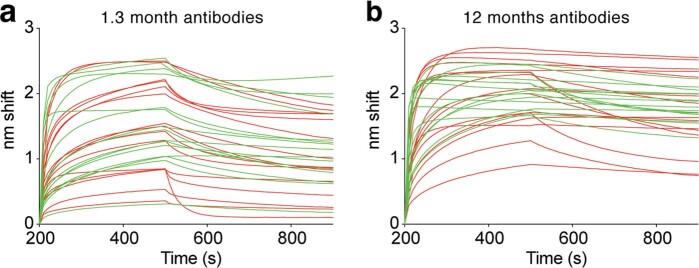
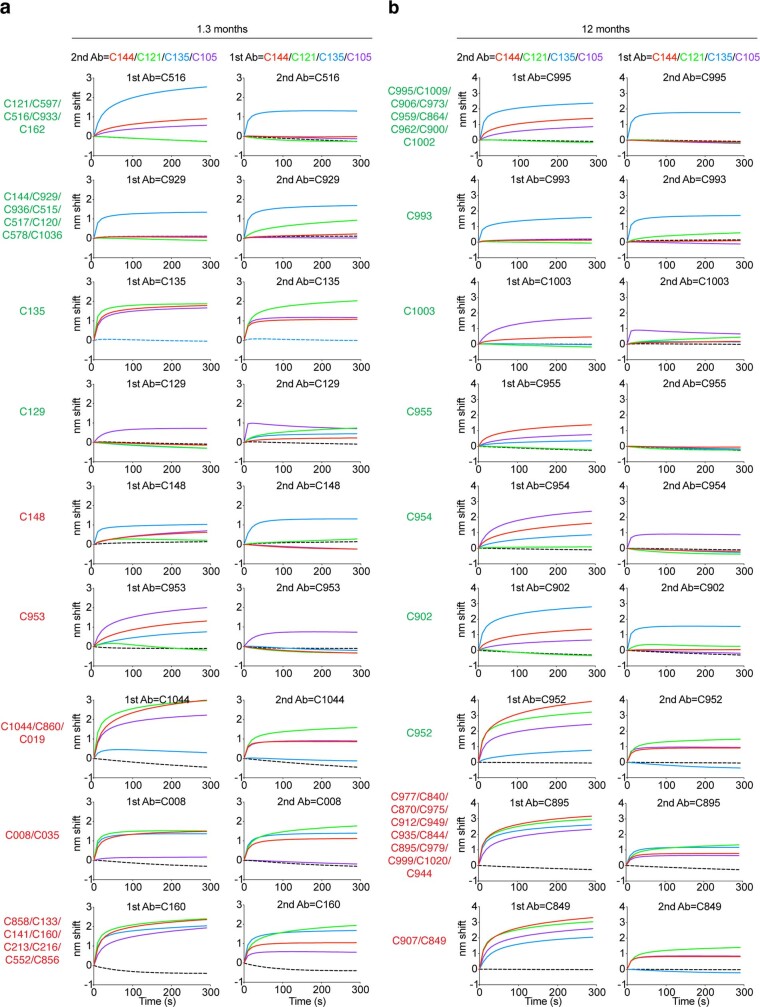
“In contrast to the earlier time point, 13 of 15 neutralizing antibodies obtained after 12 months interfered only with C121, a class 2 antibody3,23 (Fig. 4c, Extended Data Fig. 9).”
§ Naturally enhanced neutralizing breadth against SARS-CoV-2 one year after infection > Epitopes and breadth of neutralization
What the sources say
- Not checked yetcites [3] Robbiani, D. F. et al. Convergent antibody responses to SARS-CoV-2 in convalescent individuals. Nature 584, 437–442 (2020). source
- Not checked yetcites [23] Barnes, C. O. et al. SARS-CoV-2 neutralizing antibody structures inform therapeutic strategies. Nature 588, 682–687 (2020). source
plain- Asserted: passes — The authors put it forward as true.
- Checkable: passes — It can be checked against evidence.
- Load-bearing: passes — The paper’s conclusions depend on it.
- Based: passes — The paper gives a reason why it holds.
A result the paper reports from its own data — it cites no other source for it, so there is none to check. The quote shows it is in the paper.
In the paper
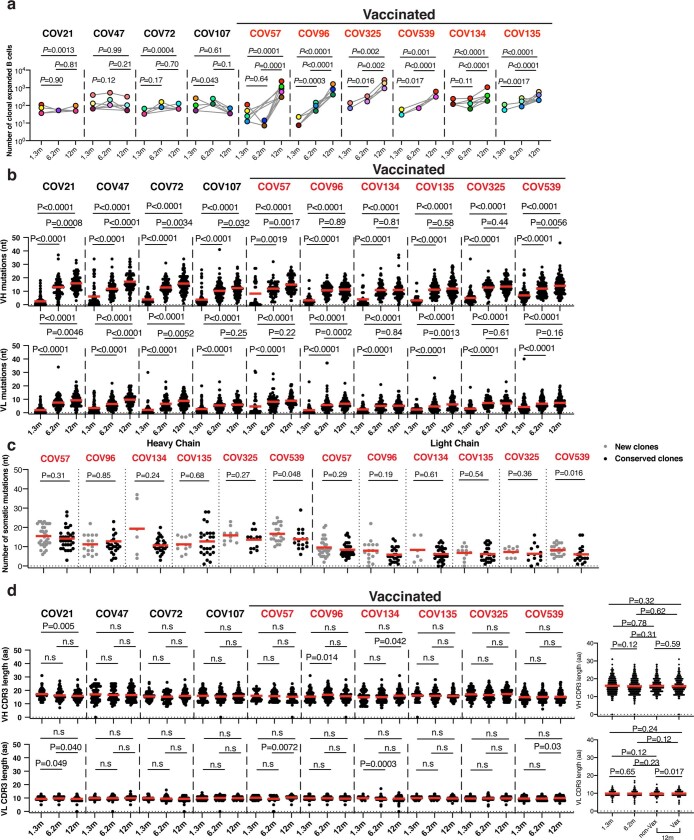
“Somatic hypermutation of antibody genes continued between 6 and 12 months after infection (Fig. 2c).”
§ Naturally enhanced neutralizing breadth against SARS-CoV-2 one year after infection > Memory B cells
plain- Asserted: passes — The authors put it forward as true.
- Checkable: passes — It can be checked against evidence.
- Load-bearing: passes — The paper’s conclusions depend on it.
- Based: passes — The paper gives a reason why it holds.
A result the paper reports from its own data — it cites no other source for it, so there is none to check. The quote shows it is in the paper.
In the paper
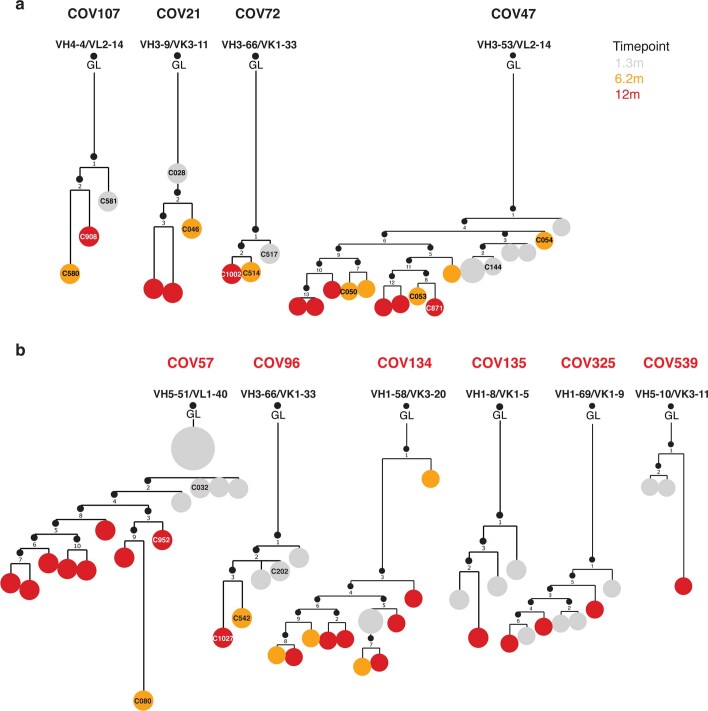
“All individuals assayed at 12 months showed expansion of RBD-binding memory cell clones that expressed closely related IGHV and IGLV genes (Fig. 2b, Extended Data Fig. 3d, e).”
§ Naturally enhanced neutralizing breadth against SARS-CoV-2 one year after infection > Memory B cells
plaincorrelational- Asserted: passes — The authors put it forward as true.
- Checkable: passes — It can be checked against evidence.
- Load-bearing: passes — The paper’s conclusions depend on it.
- Based: passes — The paper gives a reason why it holds.
A result the paper reports from its own data — it cites no other source for it, so there is none to check. The quote shows it is in the paper.
In the paper
“Thus, RBD-specific memory B cell clones were re-expanded upon vaccination in all six convalescent individuals examined (Fig. 2b, Extended Data Figs. 3d, 5a).”
§ Naturally enhanced neutralizing breadth against SARS-CoV-2 one year after infection > Memory B cells
plaindirectn = 6- Asserted: passes — The authors put it forward as true.
- Checkable: passes — It can be checked against evidence.
- Load-bearing: unclear — It is unclear whether the paper’s conclusions depend on it.
- Based: passes — The paper gives a reason why it holds.
A result the paper reports from its own data — it cites no other source for it, so there is none to check. The quote shows it is in the paper.
In the paper
“In contrast to anti-RBD antibody titres that were relatively stable, anti-N antibody titres decreased significantly between 6 and 12 months in this assay, independently of vaccination status (Fig. 1b, Extended Data Fig. 2l–n).”
§ Naturally enhanced neutralizing breadth against SARS-CoV-2 one year after infection > Plasma SARS-CoV-2 antibody reactivity
plaindirect- Asserted: passes — The authors put it forward as true.
- Checkable: passes — It can be checked against evidence.
- Load-bearing: unclear — It is unclear whether the paper’s conclusions depend on it.
- Based: passes — The paper gives a reason why it holds.
A result the paper reports from its own data — it cites no other source for it, so there is none to check. The quote shows it is in the paper.
In the paper
“Only 1 out of the 15 antibodies obtained after 1.3 months neutralized all the mutants tested (Fig. 4g).”
§ Naturally enhanced neutralizing breadth against SARS-CoV-2 one year after infection > Epitopes and breadth of neutralization
plain- Asserted: passes — The authors put it forward as true.
- Checkable: passes — It can be checked against evidence.
- Load-bearing: passes — The paper’s conclusions depend on it.
- Based: passes — The paper gives a reason why it holds.
- It may state two separate claims as one. 23
- Probably not a substantial claim. 11
A result the paper reports from its own data — it cites no other source for it, so there is none to check. The quote shows it is in the paper.
In the paper
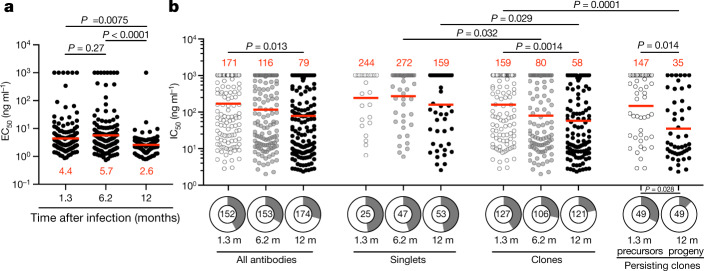
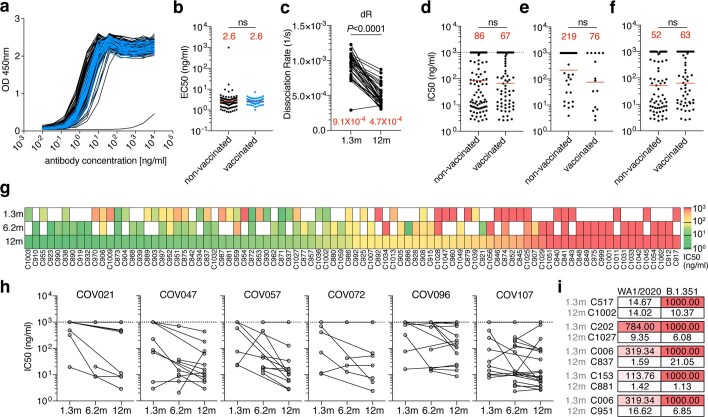
“When compared with the earlier time points from the same individuals, the geometric mean half-maximal inhibitory concentration (IC50) improved from 171 ng ml−1 (at 1.3 months) to 116 ng ml−1 (at 6 months) to 79 ng ml−1 (at 12 months), with no significant difference between vaccinated and non-vaccinated individuals (Fig. 3b, Extended Data Fig. 7d, Supplementary Table 4).”
§ Naturally enhanced neutralizing breadth against SARS-CoV-2 one year after infection > Neutralizing activity of monoclonal antibodies
plaincorrelational- Asserted: passes — The authors put it forward as true.
- Checkable: passes — It can be checked against evidence.
- Load-bearing: passes — The paper’s conclusions depend on it.
- Based: passes — The paper gives a reason why it holds.
It may state two separate claims as one.
A result the paper reports from its own data — it cites no other source for it, so there is none to check. The quote shows it is in the paper.
In the paper
“Twelve months after infection, neutralizing activity against the variants was generally lower than against wild-type SARS-CoV-2 virus in the same assay, with the greatest loss of activity against B.1.351 (Fig. 1e).”
§ Naturally enhanced neutralizing breadth against SARS-CoV-2 one year after infection > Plasma SARS-CoV-2 antibody reactivity
plain- Asserted: passes — The authors put it forward as true.
- Checkable: passes — It can be checked against evidence.
- Load-bearing: passes — The paper’s conclusions depend on it.
- Based: passes — The paper gives a reason why it holds.
It may state two separate claims as one.
A result the paper reports from its own data — it cites no other source for it, so there is none to check. The quote shows it is in the paper.
In the paper
“Neutralizing activity was directly correlated with IgG anti-RBD (Extended Data Fig. 2p) but not with anti-N titres (Extended Data Fig. 2q, r).”
§ Naturally enhanced neutralizing breadth against SARS-CoV-2 one year after infection > Plasma SARS-CoV-2 antibody reactivity
plaincorrelationaln = 63- Asserted: passes — The authors put it forward as true.
- Checkable: passes — It can be checked against evidence.
- Load-bearing: unclear — It is unclear whether the paper’s conclusions depend on it.
- Based: passes — The paper gives a reason why it holds.
It may state two separate claims as one.
A result the paper reports from its own data — it cites no other source for it, so there is none to check. The quote shows it is in the paper.
In the paper
“The number of B cells cross-reacting with variant RBD was directly proportional to and 1.6- to 3.2-fold lower than the number of B cells binding to wild-type RBD (Fig. 2a).”
§ Naturally enhanced neutralizing breadth against SARS-CoV-2 one year after infection > Memory B cells
plaincorrelational- Asserted: passes — The authors put it forward as true.
- Checkable: passes — It can be checked against evidence.
- Load-bearing: passes — The paper’s conclusions depend on it.
- Based: passes — The paper gives a reason why it holds.
It may state two separate claims as one.
A result the paper reports from its own data — it cites no other source for it, so there is none to check. The quote shows it is in the paper.
In the paper
“Twelve months after infection, the geometric mean half-maximal neutralizing titre (NT50) for the 37 individuals who had not been vaccinated was 75, which was not significantly different from the NT50 for the same individuals at 6.2 months after infection (Fig. 1c).”
§ Naturally enhanced neutralizing breadth against SARS-CoV-2 one year after infection > Plasma SARS-CoV-2 antibody reactivity
plainn = 37- Asserted: passes — The authors put it forward as true.
- Checkable: passes — It can be checked against evidence.
- Load-bearing: passes — The paper’s conclusions depend on it.
- Based: passes — The paper gives a reason why it holds.
It may state two separate claims as one.
A result the paper reports from its own data — it cites no other source for it, so there is none to check. The quote shows it is in the paper.
In the paper
“By contrast, 10 out of the 15 antibodies obtained from the same clones 12 months after infection neutralized all variants tested, with IC50 values as low as 1 ng ml−1 against the RBD triple mutant K417N/E484K/N501Y found in B.1.351 (Fig. 4g, Supplementary Table 8).”
§ Naturally enhanced neutralizing breadth against SARS-CoV-2 one year after infection > Epitopes and breadth of neutralization
plain- Asserted: passes — The authors put it forward as true.
- Checkable: passes — It can be checked against evidence.
- Load-bearing: passes — The paper’s conclusions depend on it.
- Based: passes — The paper gives a reason why it holds.
It may state two separate claims as one.
A result the paper reports from its own data — it cites no other source for it, so there is none to check. The quote shows it is in the paper.
In the paper
“The geometric mean ELISA half-maximal concentration (EC50) of the antibodies obtained 12 months after infection was 2.6 ng ml−1, which was significantly lower than after 6 months, independently of vaccination status and suggestive of an increase in affinity (Fig. 3a, Extended Data Fig. 7a, b, Supplementary Tables 4, 5).”
§ Naturally enhanced neutralizing breadth against SARS-CoV-2 one year after infection > Neutralizing activity of monoclonal antibodies
plaincorrelational- Asserted: passes — The authors put it forward as true.
- Checkable: passes — It can be checked against evidence.
- Load-bearing: passes — The paper’s conclusions depend on it.
- Based: passes — The paper gives a reason why it holds.
It may state two separate claims as one.
A result the paper reports from its own data — it cites no other source for it, so there is none to check. The quote shows it is in the paper.
In the paper
“Among the 89 clones found 12 months after infection, 61% were not previously detected and 39% were present at one of the earlier time points (Fig. 2b, Extended Data Fig. 3d).”
§ Naturally enhanced neutralizing breadth against SARS-CoV-2 one year after infection > Memory B cells
plain- Asserted: passes — The authors put it forward as true.
- Checkable: passes — It can be checked against evidence.
- Load-bearing: passes — The paper’s conclusions depend on it.
- Based: passes — The paper gives a reason why it holds.
It may state two separate claims as one.
None of the sources cited for this claim have been checked yet.
In the paper
“Consistent with previous reports5–8, vaccination increased the plasma RBD antibody levels, with IgG titres increasing by nearly 30-fold compared with unvaccinated individuals (Fig. 1a, right).”
§ Naturally enhanced neutralizing breadth against SARS-CoV-2 one year after infection > Plasma SARS-CoV-2 antibody reactivity
What the sources say
- Not checked yetcites [5] Goel, R. R. et al. Distinct antibody and memory B cell responses in SARS-CoV-2 naïve and recovered individuals following mRNA vaccination. Sci. Immunol. 6, eabi6950 (2021). 10 source
- Not checked yetcites [6] Saadat, S. et al. Binding and neutralization antibody titers after a single vaccine dose in health care workers previously infected with SARS-CoV-2. J. Am. Med. Assoc. 325, 1467–1469 (2021). source
- Not checked yetcites [7] Krammer, F. et al. Antibody responses in seropositive persons after a single dose of SARS-CoV-2 mRNA vaccine. N. Engl. J. Med. 384, 1372–1374 (2021). source
- Not checked yetcites [8] Reynolds, C. J. et al. Prior SARS-CoV-2 infection rescues B and T cell responses to variants after first vaccine dose. Science eabh1282 (2021).
plaindirect- Asserted: passes — The authors put it forward as true.
- Checkable: passes — It can be checked against evidence.
- Load-bearing: passes — The paper’s conclusions depend on it.
- Based: passes — The paper gives a reason why it holds.
It may state two separate claims as one.
A result the paper reports from its own data — it cites no other source for it, so there is none to check. The quote shows it is in the paper.
In the paper
“The overall increase in neutralizing activity among conserved clones was owing to accumulation of clones expressing antibodies with potent neutralizing activity and simultaneous loss of clones expressing antibodies with no measurable activity (P = 0.028) (Fig. 3b, bottom right).”
§ Naturally enhanced neutralizing breadth against SARS-CoV-2 one year after infection > Neutralizing activity of monoclonal antibodies
plaindirect- Asserted: passes — The authors put it forward as true.
- Checkable: passes — It can be checked against evidence.
- Load-bearing: passes — The paper’s conclusions depend on it.
- Based: passes — The paper gives a reason why it holds.
It may state two separate claims as one.
None of the sources cited for this claim have been checked yet.
In the paper
“The persistent clones expand without accumulating large numbers of additional mutations, indicating that clonal expansion of human memory B cells does not require re-entry into germinal centres and occurs in the activated B cell compartment17,27–31.”
§ Naturally enhanced neutralizing breadth against SARS-CoV-2 one year after infection > Discussion
What the sources say
- Not checked yetcites [17] Viant, C. et al. Antibody affinity shapes the choice between memory and germinal center B cell fates. Cell 183, 1298–1311 (2020). source
- Not checked yetcites [27] Elsner, R. A. & Shlomchik, M. J. Germinal center and extrafollicular b cell responses in vaccination, immunity, and autoimmunity. Immunity 53, 1136–1150 (2020). source
- Not checked yetcites [28] Lau, A. W. & Brink, R. Selection in the germinal center. Curr. Opin. Immunol. 63, 29–34 (2020). source
- Not checked yetcites [29] Victora, G. D. & Nussenzweig, M. C. Germinal centers. Annu. Rev. Immunol. 30, 429–457 (2012). source
- Not checked yetcites [30] Inoue, T., Moran, I., Shinnakasu, R., Phan, T. G. & Kurosaki, T. Generation of memory B cells and their reactivation. Immunol. Rev. 283, 138–149 (2018). source
- Not checked yetcites [31] Taylor, J. J., Pape, K. A., Steach, H. R. & Jenkins, M. K. Humoral immunity. Apoptosis and antigen affinity limit effector cell differentiation of a single naïve B cell. Science 347, 784–787 (2015 source
hedgeddirect- Asserted: passes — The authors put it forward as true.
- Checkable: passes — It can be checked against evidence.
- Load-bearing: passes — The paper’s conclusions depend on it.
- Based: passes — The paper gives a reason why it holds.
It may state two separate claims as one.
A conclusion the paper draws from its own results — it cites no other source for it, so there is none to check. The quote shows it is in the paper.
In the paper
“If memory responses evolve in a similar manner in naive individuals who receive vaccines, additional appropriately timed boosting with available vaccines should lead to protective immunity against circulating variants.”
§ Naturally enhanced neutralizing breadth against SARS-CoV-2 one year after infection > Discussion
hedgedconditional- Asserted: passes — The authors put it forward as true.
- Checkable: fails — It may be too vague to check against evidence.
- Load-bearing: passes — The paper’s conclusions depend on it.
- Based: fails — The paper may give no reason why it holds.
Probably not a substantial claim. It may be too vague to check against evidence. The paper may give no reason why it holds. It may state two separate claims as one.
- Rests on an assumption: The 63 convalescent participants are representative of the broader population of individuals who have recovered from COVID-19.
- Rests on an assumption: Neutralizing antibody titres are a correlate of protection against SARS-CoV-2 variants in vivo.
- Rests on an assumption: In vitro neutralization breadth measured with pseudotyped viruses predicts protection against authentic circulating SARS-CoV-2 variants.
A conclusion the paper draws from its own results — it cites no other source for it, so there is none to check. The quote shows it is in the paper.
In the paper
“In conclusion, continued clonal evolution of anti-SARS-CoV-2 antibodies over 12 months favours increasing potency and breadth, resulting in monoclonal antibodies with exceptional activity against a wide group of variants.”
§ Naturally enhanced neutralizing breadth against SARS-CoV-2 one year after infection > Epitopes and breadth of neutralization
plaindirect- Asserted: passes — The authors put it forward as true.
- Checkable: passes — It can be checked against evidence.
- Load-bearing: passes — The paper’s conclusions depend on it.
- Based: passes — The paper gives a reason why it holds.
It may state two separate claims as one.
What the paper did — it cites no source for this, so there is none to check. The quote shows it is in the paper.
In the paper
“Among the 174 antibodies tested, 173 bound to RBD, indicating that the flow cytometry method used to identify B cells expressing anti-RBD antibodies was efficient (Supplementary Tables 4, 5).”
§ Naturally enhanced neutralizing breadth against SARS-CoV-2 one year after infection > Neutralizing activity of monoclonal antibodies
hedgeddirect- Asserted: passes — The authors put it forward as true.
- Checkable: passes — It can be checked against evidence.
- Load-bearing: unclear — It is unclear whether the paper’s conclusions depend on it.
- Based: passes — The paper gives a reason why it holds.
It may state two separate claims as one.
A conclusion the paper draws from its own results — it cites no other source for it, so there is none to check. The quote shows it is in the paper.
In the paper
“SARS-CoV-2 infection produces a memory compartment that continues to evolve more than 12 months after infection with accumulation of somatic mutations, emergence of new clones and increasing affinity, all of which are consistent with long-term persistence of germinal centres.”
§ Naturally enhanced neutralizing breadth against SARS-CoV-2 one year after infection > Discussion
plaindirect- Asserted: passes — The authors put it forward as true.
- Checkable: passes — It can be checked against evidence.
- Load-bearing: passes — The paper’s conclusions depend on it.
- Based: passes — The paper gives a reason why it holds.
It may state two separate claims as one.
- Rests on an assumption: Antibody sequences obtained from 10 individuals are representative of the memory B cell repertoire.
A conclusion the paper draws from its own results — it cites no other source for it, so there is none to check. The quote shows it is in the paper.
In the paper
“We conclude that neutralizing antibodies are retained and non-neutralizing antibodies targeting RBD surfaces that do not interact with ACE2 are removed from the repertoire over time.”
§ Naturally enhanced neutralizing breadth against SARS-CoV-2 one year after infection > Epitopes and breadth of neutralization
plaindirect- Asserted: passes — The authors put it forward as true.
- Checkable: passes — It can be checked against evidence.
- Load-bearing: passes — The paper’s conclusions depend on it.
- Based: passes — The paper gives a reason why it holds.
It may state two separate claims as one.
None of the sources cited for this claim have been checked yet.
In the paper
“Although antibodies to the N-terminal domain and other parts of S can also be neutralizing, we limited our analysis to memory B cells that produce anti-RBD antibodies because they are the most numerous and potent18,19.”
§ Naturally enhanced neutralizing breadth against SARS-CoV-2 one year after infection > Memory B cells
What the sources say
- Not checked yetcites [18] Rogers, T. F. et al. Isolation of potent SARS-CoV-2 neutralizing antibodies and protection from disease in a small animal model. Science 369, 956–963 (2020). source
- Not checked yetcites [19] Kreer, C. et al. Longitudinal isolation of potent near-germline SARS-CoV-2-neutralizing antibodies from COVID-19 patients. Cell 182, 1663–1673 (2020). source
plain- Asserted: passes — The authors put it forward as true.
- Checkable: passes — It can be checked against evidence.
- Load-bearing: passes — The paper’s conclusions depend on it.
- Based: passes — The paper gives a reason why it holds.
Probably not a substantial claim. It may state two separate claims as one.
What the paper did — it cites no source for this, so there is none to check. The quote shows it is in the paper.
In the paper
“the investigators were not blinded to allocation during experiments and outcome assessment”
§ Naturally enhanced neutralizing breadth against SARS-CoV-2 one year after infection > Methods > Data reporting
plain- Asserted: passes — The authors put it forward as true.
- Checkable: passes — It can be checked against evidence.
- Load-bearing: fails — The paper’s conclusions may not depend on it.
- Based: passes — The paper gives a reason why it holds.
Probably not a substantial claim. The paper’s conclusions may not depend on it.
None of the sources cited for this claim have been checked yet.
In the paper
“Consistent with the longevity of bone marrow plasma cells, infection with SARS-CoV-2 leads to persistent anti-RBD antibodies in serum, and corresponding neutralizing responses.”
§ Naturally enhanced neutralizing breadth against SARS-CoV-2 one year after infection > Discussion
What the sources say
- Not checked yetcites [33] Petersen, M. S. et al. SARS-CoV-2 natural antibody response persists up to 12 months in a nationwide study from the Faroe Islands. Preprint at https://doi.org/10.1101/2021.04.19.21255720 (2021). source
- Not checked yetcites [34] Li, C. et al. Twelve-month specific IgG response to SARS-CoV-2 receptor-binding domain among COVID-19 convalescent plasma donors in Wuhan. Preprint at https://doi.org/10.1101/2021.04.05.437224 (2021). source
plaindirect- Asserted: passes — The authors put it forward as true.
- Checkable: passes — It can be checked against evidence.
- Load-bearing: passes — The paper’s conclusions depend on it.
- Based: passes — The paper gives a reason why it holds.
It may state two separate claims as one.
What the paper did — it cites no source for this, so there is none to check. The quote shows it is in the paper.
In the paper
“The experiments were not randomized”
§ Naturally enhanced neutralizing breadth against SARS-CoV-2 one year after infection > Methods > Data reporting
plain- Asserted: passes — The authors put it forward as true.
- Checkable: passes — It can be checked against evidence.
- Load-bearing: fails — The paper’s conclusions may not depend on it.
- Based: passes — The paper gives a reason why it holds.
Probably not a substantial claim. The paper’s conclusions may not depend on it.
In the paper
“Continued antibody evolution in germinal centres requires antigen, which can be retained in these structures over long periods of time29.”
§ Naturally enhanced neutralizing breadth against SARS-CoV-2 one year after infection > Discussion
What the sources say
- Not checked yetcites [29] Victora, G. D. & Nussenzweig, M. C. Germinal centers. Annu. Rev. Immunol. 30, 429–457 (2012). source
plaindirect- Asserted: passes — The authors put it forward as true.
- Checkable: passes — It can be checked against evidence.
- Load-bearing: passes — The paper’s conclusions depend on it.
- Based: passes — The paper gives a reason why it holds.
It may state two separate claims as one.
What the paper did — it cites no source for this, so there is none to check. The quote shows it is in the paper.
In the paper
“All experiments were performed at least in duplicate.”
§ Naturally enhanced neutralizing breadth against SARS-CoV-2 one year after infection > Plasma SARS-CoV-2 antibody reactivity
plain- Asserted: passes — The authors put it forward as true.
- Checkable: passes — It can be checked against evidence.
- Load-bearing: fails — The paper’s conclusions may not depend on it.
- Based: passes — The paper gives a reason why it holds.
Probably not a substantial claim. The paper’s conclusions may not depend on it.
What the paper did — it cites no source for this, so there is none to check. The quote shows it is in the paper.
In the paper
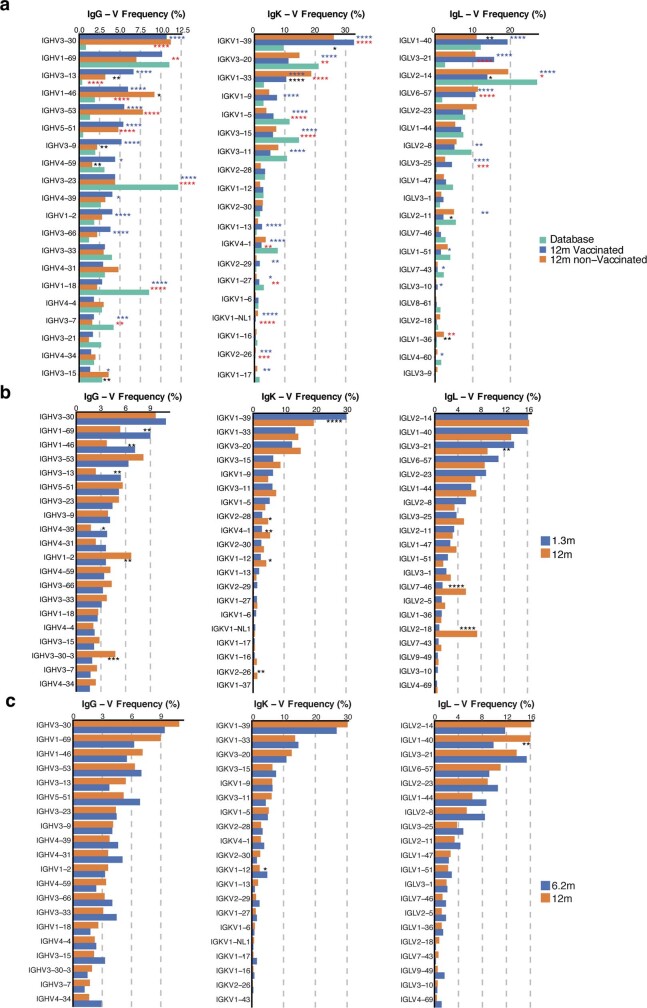
“We used the two-sided binomial test to check whether the number of sequences belonging to a specific IgHV or IgLV gene in the repertoire is different according to the frequency of the same IgV gene in the database. Adjusted P values were calculated using the false discovery rate (FDR) correction.”
§ Naturally enhanced neutralizing breadth against SARS-CoV-2 one year after infection > Methods > Computational analyses of antibody sequences
plainn = 10- Asserted: passes — The authors put it forward as true.
- Checkable: passes — It can be checked against evidence.
- Load-bearing: fails — The paper’s conclusions may not depend on it.
- Based: passes — The paper gives a reason why it holds.
Probably not a substantial claim. The paper’s conclusions may not depend on it. It may state two separate claims as one.
What the paper did — it cites no source for this, so there is none to check. The quote shows it is in the paper.
In the paper
“No statistical methods were used to predetermine sample size.”
§ Naturally enhanced neutralizing breadth against SARS-CoV-2 one year after infection > Methods > Data reporting
plain- Asserted: passes — The authors put it forward as true.
- Checkable: passes — It can be checked against evidence.
- Load-bearing: fails — The paper’s conclusions may not depend on it.
- Based: passes — The paper gives a reason why it holds.
Probably not a substantial claim. The paper’s conclusions may not depend on it.
None of the sources cited for this claim have been checked yet.
In the paper
“The memory B cell compartment accumulates mutations and undergoes clonal evolution over the initial six months after infection4,9,21,22.”
§ Naturally enhanced neutralizing breadth against SARS-CoV-2 one year after infection > Memory B cells
What the sources say
- Not checked yetcites [4] Gaebler, C. et al. Evolution of antibody immunity to SARS-CoV-2. Nature 591, 639–644 (2021). source
- Not checked yetcites [9] Muecksch, F. et al. Development of potency, breadth and resilience to viral escape mutations in SARS-CoV-2 neutralizing antibodies. Preprint at https://doi.org/10.1101/2021.03.07.434227 (2021). source
- Not checked yetcites [21] Sokal, A. et al. Maturation and persistence of the anti-SARS-CoV-2 memory B cell response. Cell 184, 1201–1213 (2021). source
- Not checked yetcites [22] Sakharkar, M. et al. Prolonged evolution of the human B cell response to SARS-CoV-2 infection. Sci. Immunol. 6, eabg6916 (2021). source
plaindirect- Asserted: passes — The authors put it forward as true.
- Checkable: passes — It can be checked against evidence.
- Load-bearing: passes — The paper’s conclusions depend on it.
- Based: passes — The paper gives a reason why it holds.
It may state two separate claims as one.
What the paper did — it cites no source for this, so there is none to check. The quote shows it is in the paper.
In the paper
“The obtained relative luminescence units were normalized to those derived from cells infected with SARS-CoV-2 pseudotyped virus in the absence of plasma or monoclonal antibodies.”
§ Naturally enhanced neutralizing breadth against SARS-CoV-2 one year after infection > Methods > Pseudotyped virus neutralization assay
plain- Asserted: passes — The authors put it forward as true.
- Checkable: passes — It can be checked against evidence.
- Load-bearing: passes — The paper’s conclusions depend on it.
- Based: passes — The paper gives a reason why it holds.
Probably not a substantial claim.
In the paper
“In addition, SARS-CoV-2 protein and nucleic acids have been reported to remain in the gut for at least two months after infection4.”
§ Naturally enhanced neutralizing breadth against SARS-CoV-2 one year after infection > Discussion
What the sources say
- Not checked yetcites [4] Gaebler, C. et al. Evolution of antibody immunity to SARS-CoV-2. Nature 591, 639–644 (2021). source
plain- Asserted: passes — The authors put it forward as true.
- Checkable: passes — It can be checked against evidence.
- Load-bearing: fails — The paper’s conclusions may not depend on it.
- Based: passes — The paper gives a reason why it holds.
Probably not a substantial claim. The paper’s conclusions may not depend on it.
What the paper did — it cites no source for this, so there is none to check. The quote shows it is in the paper.
In the paper
“a positive control (plasma from participant COV72, diluted 66.6-fold and seven additional threefold serial dilutions in PBS) was added to every assay plate for validation. The average of its signal was used for normalization of all of the other values on the same plate”
§ Naturally enhanced neutralizing breadth against SARS-CoV-2 one year after infection > Methods > ELISAs
plainSingle case- Asserted: passes — The authors put it forward as true.
- Checkable: passes — It can be checked against evidence.
- Load-bearing: fails — The paper’s conclusions may not depend on it.
- Based: passes — The paper gives a reason why it holds.
Probably not a substantial claim. The paper’s conclusions may not depend on it. It may state two separate claims as one.
What the paper did — it cites no source for this, so there is none to check. The quote shows it is in the paper.
In the paper
“Reverse-transcribed cDNA was amplified using primers and probes validated by the CDC or by Columbia University Personalized Medicine Genomics Laboratory, respectively and approved by the FDA under the Emergency Use Authorization.”
§ Naturally enhanced neutralizing breadth against SARS-CoV-2 one year after infection > Methods > SARS-CoV-2 molecular tests
plain- Asserted: passes — The authors put it forward as true.
- Checkable: passes — It can be checked against evidence.
- Load-bearing: fails — The paper’s conclusions may not depend on it.
- Based: passes — The paper gives a reason why it holds.
Probably not a substantial claim. The paper’s conclusions may not depend on it. It may state two separate claims as one.
The paper relies on this without support.
The 63 convalescent participants are representative of the broader population of individuals who have recovered from COVID-19.
“Here we report on a cohort of 63 individuals who have recovered from COVID-19 assessed at 1.3, 6.2 and 12 months after SARS-CoV-2 infection, 41% of whom also received mRNA vaccines3,4.”
The paper relies on this without support.
Neutralizing antibody titres are a correlate of protection against SARS-CoV-2 variants in vivo.
“The data suggest that immunity in convalescent individuals will be very long lasting and that convalescent individuals who receive available mRNA vaccines will produce antibodies and memory B cells that should be protective against circulating SARS-CoV-2 variants.”
The paper relies on this without support.
In vitro neutralization breadth measured with pseudotyped viruses predicts protection against authentic circulating SARS-CoV-2 variants.
“Plasma neutralizing activity in 63 participants was measured using a human immunodeficiency virus 1 (HIV-1) pseudotyped with the SARS-CoV-2 spike (S) protein3,4,13”
The paper relies on this without support.
The mRNA vaccines used (Moderna mRNA-1273 and Pfizer-BioNTech BNT162b2) are representative of available mRNA vaccines.
“26 (41%) had received at least one dose of either the Moderna (mRNA-1273) or Pfizer-BioNTech (BNT162b2) vaccines”
The paper relies on this without support.
Antibody sequences obtained from 10 individuals are representative of the memory B cell repertoire.
“we obtained 1,105 paired antibody heavy- and light-chain sequences from 10 individuals who were also assessed at the earlier time points, 6 of whom were vaccinated”
Claims other papers make about this one
Each is checked against this paper’s own text: does it say what the citing paper says it does?
The source backs part of the claim, not all of it — or backs it for a different population, condition or comparison.
In the citing paper
“In addition, the mRNA vaccines appear to often elicit memory B cells that undergo somatic hypermutation, which should broaden the response to viruses with variant spike proteins 239,240 .”
From The biological and clinical significance of emerging SARS-CoV-2 variants (2021) · cites this paper as [239]
Experimental — accuracy not yet measuredIn the citing paper
“As reported previously by our group and others, mRNA vaccines induced robust circulating antibody responses to the SARS-CoV-2 spike protein and spike RBD with distinct patterns of early response in SARS-CoV-2–naïve and –recovered individuals (Fig. 1B) (16, 34–36).”
From mRNA vaccines induce durable immune memory to SARS-CoV-2 and variants of concern (2021) · cites this paper as [36]
In the citing paper
“The levels of neutralizing mAbs elicited by the mRNA vaccines has been high and in most persons are likely to be maintained for many months above the levels required for protection against even the most resistant circulating variants 164,239,240 .”
From The biological and clinical significance of emerging SARS-CoV-2 variants (2021) · cites this paper as [239]
In the citing paper
“Convalescent individuals develop B cell lineages that mature over time, increasing their activity against SARS-CoV-2 variants (27).”
From Durability of mRNA-1273 vaccine–induced antibodies against SARS-CoV-2 variants (2021) · cites this paper as [27]
Self-check
Percentages, sums and reported differences re-computed from the paper’s own numbers.
Each contradiction between two passages listed here was confirmed by an independent check.
Rated minor: it would not touch a result — a value no result rests on, a p-value that stays on the same side of the significance level, or a conflict that is clerical, resolved elsewhere in the paper, or outside its own findings.
In the paper
§ Naturally enhanced neutralizing breadth against SARS-CoV-2 one year after infection > Neutralizing activity of monoclonal antibodies
“Among the 174 antibodies tested, 173 bound to RBD”
§ Naturally enhanced neutralizing breadth against SARS-CoV-2 one year after infection > Neutralizing activity of monoclonal antibodies
“All 174 RBD binding antibodies obtained from the 12-month time point were tested for neutralizing activity in a SARS-CoV-2 pseudotype-neutralization assay.”
Rated minor: it would not touch a result — a value no result rests on, a p-value that stays on the same side of the significance level, or a conflict that is clerical, resolved elsewhere in the paper, or outside its own findings.
In the paper
§ Naturally enhanced neutralizing breadth against SARS-CoV-2 one year after infection > Memory B cells
“individuals who recovered from COVID-19 and received mRNA vaccines showed an average increase of 8.6-fold in the number of circulating RBD-specific memory B cells”
§ Naturally enhanced neutralizing breadth against SARS-CoV-2 one year after infection > Discussion
“Vaccination after SARS-CoV-2 infection increases the number of RBD-binding memory cells by more than an order of magnitude”
Citations
Cites
Single-Step Method of RNA Isolation by Acid Guanidinium Thiocyanate–Phenol–Chloroform Extraction
Chomczynski, P., & Sacchi, N. (1987) · Analytical Biochemistry · doi:10.1006/abio.1987.9999 · Cited by 65,515
Hoffmann, M., Kleine-Weber, H., Schroeder, S., Krüger, N., Herrler, T., Erichsen, S., Schiergens, T. S., Herrler, G., Wu, N.-H., Nitsche, A., et al. (2020) · Cell · doi:10.1016/j.cell.2020.02.052 · Cited by 20,286
A new coronavirus associated with human respiratory disease in China
Wu, F., Zhao, S., Yu, B., Chen, Y.-M., Wang, W., Song, Z.-G., Hu, Y., Tao, Z.-W., Tian, J.-H., Pei, Y.-Y., et al. (2020) · Nature · doi:10.1038/s41586-020-2008-3 · Cited by 11,688
Grifoni, A., Weiskopf, D., Ramirez, S. I., Mateus, J., Dan, J. M., Moderbacher, C. R., Rawlings, S. A., Sutherland, A., Premkumar, L., Jadi, R. S., et al. (2020) · Cell · doi:10.1016/j.cell.2020.05.015 · Cited by 3,595
Estimated transmissibility and impact of SARS-CoV-2 lineage B.1.1.7 in England
Davies, N. G., Abbott, S., Barnard, R. C., Jarvis, C. I., Kucharski, A. J., Munday, J. D., Pearson, C. A. B., Russell, T. W., Tully, D. C., Washburne, A. D., et al. (2021) · Science · doi:10.1126/science.abg3055 · Cited by 2,581
Estimated transmissibility and impact of SARS-CoV-2 lineage B.1.1.7 in England
Davies, N. G., Abbott, S., Barnard, R. C., Jarvis, C. I., Kucharski, A. J., Munday, J. D., Pearson, C. A. B., Russell, T. W., Tully, D. C., Washburne, A. D., et al. (2020) · doi:10.1101/2020.12.24.20248822 · Cited by 2,557
Detection of a SARS-CoV-2 variant of concern in South Africa
Tegally, H., Wilkinson, E., Giovanetti, M., Iranzadeh, A., Fonseca, V., Giandhari, J., Doolabh, D., Pillay, S., San, E. J., Msomi, N., et al. (2021) · Nature · doi:10.1038/s41586-021-03402-9 · Cited by 2,510
Victora, G. D., & Nussenzweig, M. C. (2012) · Annual Review of Immunology · doi:10.1146/annurev-immunol-020711-075032 · Cited by 1,878
Self-citationConvergent Antibody Responses to SARS-CoV-2 in Convalescent Individuals
Robbiani, D. F., Gaebler, C., Muecksch, F., Lorenzi, J. C. C., Wang, Z., Cho, A., Agudelo, M., Barnes, C. O., Gazumyan, A., Finkin, S., et al. (2020) · Nature · doi:10.1038/s41586-020-2456-9 · Cited by 1,853
Self-citationA serological assay to detect SARS-CoV-2 seroconversion in humans
Amanat, F., Stadlbauer, D., Strohmeier, S., Nguyen, T. H. O., Chromikova, V., McMahon, M., Jiang, K., Arunkumar, G. A., Jurczyszak, D., Polanco, J., et al. (2020) · Nature Medicine · doi:10.1038/s41591-020-0913-5 · Cited by 1,769
Cited by
Sorted by citations
Items 701–800 of 800
Adverse reactions following COVID-19 immunization in children of elementary school age
Yusuf, Y., Junaedi, A. A., Mutmainnah, M., et al. (2024) · Berita Kedokteran Masyarakat · doi:10.22146/bkm.v40i02.9712
Byazrova, M. G., Kulemzin, S. V., Astakhova, E. A., Николаевна, Б. Т., Efimov, G. A., Chikaev, A. N., Kolotygin, I. O., Gorchakov, A. A., Taranin, A. V., & Filatov, A. V. (2021) · SSRN Electronic Journal · doi:10.2139/ssrn.3918293
El-Orfali, Y., Mansour, R., Alkalamouni, H., Jabbour, Z. C., Fayad, A. G. A., Saba, E. S., Khawaja, G., & Massaad, M. J. (2025) · Journal of Allergy and Clinical Immunology · doi:10.1016/j.jaci.2025.10.001 · Cited by 1
Bennett, B., Freckelton, I. R., & Wolf, G. (2023) · Oxford University Press eBooks · doi:10.1093/oso/9780192896742.002.0011
Cytokine response against coronavirus
Upreti, S., Samant, M., Sharma, N., & Mahara, K. (2025) · Elsevier eBooks · doi:10.1016/b978-0-443-15283-2.00008-7
Bennett, B., Freckelton, I. R., & Wolf, G. (2023) · Oxford University Press eBooks · doi:10.1093/oso/9780192896742.002.0010
de Oliveira, J. R. (2023) · Digital Library of Theses and Dissertations (Universidade de São Paulo) · doi:10.11606/t.5.2023.tde-24082023-110203
Khan, R. A., Chen, J., Donius, L. R., Reinherz, E. L., & Kim, M. (2026) · npj Vaccines · doi:10.1038/s41541-026-01371-6
Risk, Impact, and Disadvantage
Bennett, B., Freckelton, I. R., & Wolf, G. (2023) · Oxford University Press eBooks · doi:10.1093/oso/9780192896742.003.0007
Kim, J. H., Kikuchi, R., Suzuki, A., 理佳, 度., Goto, K., Okumura, Y., & Matsushita, T. (2023) · Research Square · doi:10.21203/rs.3.rs-2412517/v1
Fiori, M., Bello, G., Wschebor, N., Lecumberry, F., Ferragut, A., & Mordecki, E. (2021) · medRxiv · doi:10.1101/2021.09.16.21263701v1
Law, Regulation, and Rights: Reflections on the COVID-19 Pandemic
Bennett, B., Freckelton, I. R., & Wolf, G. (2023) · Oxford University Press eBooks · doi:10.1093/oso/9780192896742.003.0013
What are the prospects for durable immune control?
Lelièvre, J., & Bauer, J. (2022) · Infectious Diseases Now · doi:10.1016/j.idnow.2022.09.010
High antibody and reduced cellular response in children up to one year after SARS-CoV-2 infectionPreprint
Jacobsen, E., Fabricius, D., Class, M., et al. (2022) · Research Square · doi:10.21203/rs.3.rs-1325055/v1
Jagadeesan, N., Kumar, P., Gowda, N. M. P., et al. (2024) · European Journal of Chemistry · doi:10.5155/eurjchem.15.3.274-281.2553
Smith, C. P., Hartman, R. M., Kugler, A. M., Little, V., Baker, O. R., Fairlie, T. A., Fernández, R. E., Hagen, M. B., Honie, E., Laeyendecker, O. B., et al. (2024) · Viruses · doi:10.3390/v16101573
Bennett, B., Freckelton, I. R., & Wolf, G. (2023) · Oxford University Press eBooks · doi:10.1093/oso/9780192896742.003.0001
COVID-19 and Workplace and Occupational Health and Safety
Bennett, B., Freckelton, I. R., & Wolf, G. (2023) · Oxford University Press eBooks · doi:10.1093/oso/9780192896742.003.0010
Huguet, M., Boigués, M., Sorigué, M., Blanco, J., Quirant‐Sánchez, B., Ferra, C. M., Huguet, M., Boigués, M., Morgades, M., Felip, E., et al. (2023) · Medicina Clínica · doi:10.1016/j.medcli.2023.10.016
Early functional maturation of anti-Spike antibodies predicts efficient SARS-CoV-2 RNA clearance
Rodrigues, D., de Araujo, B. G., Pestana, J., de Freitas, L., Ramos, B. N., da Costa, L. C., Andrade, M. V., Raposo, L. M., Bozza, V. B. T., Conde, L., et al. (2026) · Frontiers in Immunology · doi:10.3389/fimmu.2026.1948045
Baran, J., Kuryk, Ł., Mariangela, G., et al. (2024) · Research Square · doi:10.21203/rs.3.rs-4699723/v1
Bennett, B., Freckelton, I. R., & Wolf, G. (2023) · Oxford University Press eBooks · doi:10.1093/oso/9780192896742.003.0003
B cell responses to SARS-CoV-2
Zaidi, A. K., Bajpai, S., & Dehgani‐Mobaraki, P. (2023) · Progress in molecular biology and translational science · doi:10.1016/bs.pmbts.2023.11.006
Yuan, Y., Zeng, Y., Zhu, M., Sun, Z., Xu, W., 胡慭然, Liu, G., Shen, M., Yang, C., & Gao, D. (2026) · Vaccines · doi:10.3390/vaccines14080708
Simeon, J. O., Tosin, J. O., & Zubairu, S. A. (2023) · Asian Journal of Applied Sciences · doi:10.3923/ajaps.2023.64.71
Niu, C., Huang, X., Yan, Q., Liu, B., Gao, X., Song, Y., Wang, J. Y., Wang, L., Li, Z., Zheng, H., et al. (2025) · bioRxiv (Cold Spring Harbor Laboratory) · doi:10.64898/2025.12.19.695307
Seroprevalence of immunoglobulin G antibodies against SARS-CoV-2 in CyprusPreprint
Papaneophytou, C. P., Nicolaou, A., Pieri, M., et al. (2022) · Research Square · doi:10.21203/rs.3.rs-1294394/v1
Evaluation of COVID-19 Biokit IgG/IgM Clinical Effectiveness in COVID-19 Vaccinated Individuals
Kim, M. J., Sun, H. Y., & Yoo, B. W. (2022) · Daehan imsang geon-gang jeungjin hakoeji/Daehan imsang geon'gang jeungjin haghoeji · doi:10.15384/kjhp.2022.22.2.62
Sun, P., Ramos, I., Coelho, C. H., Grifoni, A., Balinsky, C. A., Vangeti, S., Tarke, A., Bloom, N. I., Jani, V., Jakubski, S., et al. (2022) · SSRN Electronic Journal · doi:10.2139/ssrn.4137687
Discovery in clinical and translational medicine
Wang, D. C., & Wang, X. (2021) · Clinical and Translational Discovery · doi:10.1002/ctd2.6
Leveraging SARS-CoV-2-induced pre-existing humoral and cellular immunity for tumor elimination
Chen, L., Yu, Q., Duan, S., Mao, Q., Han, Y., Tang, S., Yao, W., Gao, X., & Tian, H. W. (2026) · International Immunopharmacology · doi:10.1016/j.intimp.2025.116114
Simeon, J. O., & Tosin, J. O. (2023) · International Journal of Epidemiology and Health Sciences · doi:10.51757/ijehs.4.2023.696940
Bennett, B., Freckelton, I. R., & Wolf, G. (2023) · Oxford University Press eBooks · doi:10.1093/oso/9780192896742.002.0009
da Silva, E. S., Servais, J.-Y., Kohnen, M., Arendt, V., Gilson, G., Staub, T., Seguin‐Devaux, C., & Perez-Bercoff, D. (2022) · bioRxiv (Cold Spring Harbor Laboratory) · doi:10.1101/2022.10.24.513415
Past Legal and Regulatory Responses to Infectious Diseases
Bennett, B., Freckelton, I. R., & Wolf, G. (2023) · Oxford University Press eBooks · doi:10.1093/oso/9780192896742.003.0002
Chuang, C.-H., Huang, C., Huang, C., Chen, Y.-C., Kung, Y.-A., Chen, C., Chuang, T.-C., Liu, C.-C., Huang, P.-W., Yang, S.-L., et al. (2022) · SSRN Electronic Journal · doi:10.2139/ssrn.4191606
Chuang, C.-H., Huang, C., Huang, C., Chen, Y.-C., Kung, Y.-A., Chen, C., Chuang, T.-C., Liu, C.-C., Huang, P.-W. D., Yang, S.-L., et al. (2022) · medRxiv · doi:10.1101/2022.06.14.22276236
Homan, T., Fortunato, F., Corso, G., Lopalco, P. L., Prato, R., & Martinelli, D. (2021) · Infectious Diseases and Therapy · doi:10.1007/s40121-021-00582-9
Suntronwong, N., Yorsaeng, R., Auphimai, C., Thongmee, T., Vichaiwattana, P., Kanokudom, S., Assawakosri, S., Nilyanimit, P., Srimuan, D., Thatsanatorn, T., et al. (2022) · medRxiv · doi:10.1101/2022.01.03.22268704
Zhou, L., 余志立, Lin, S., Jiang, Y., Gao, J., Ma, Y., Jiang, W., Liang, S., Chen, Y., Zhang, Y., et al. (2026) · Cell Reports · doi:10.1016/j.celrep.2026.117582
Scales, Pseudoscales, the Human Factor, and a Way Forward
Mueller, S. (2022) · Springer eBooks · doi:10.1007/978-3-031-18903-6_7
Development of COVID-19 Treatments and Vaccines
Bennett, B., Freckelton, I. R., & Wolf, G. (2023) · Oxford University Press eBooks · doi:10.1093/oso/9780192896742.003.0011
Fiori, M., Bello, G., Wschebor, N., et al. (2021) · medRxiv · doi:10.1101/2021.09.16.21263701
Immune Responses to Severe Acute Respiratory Syndrome Coronavirus-2
Kaushal, H., & Mittal, P. (2026) · Springer eBooks · doi:10.1007/978-3-032-26000-0_9
Misra, P., Medigeshi, G. R., Kant, S., Jaiswal, A., Ahmad, M., Rahman, A., Guleria, R., Kumar, S., Deori, T. J., Mandal, S., et al. (2024) · Journal of Clinical Medicine · doi:10.3390/jcm13030762
Criminal Justice Issues and the COVID-19 Pandemic
Bennett, B., Freckelton, I. R., & Wolf, G. (2023) · Oxford University Press eBooks · doi:10.1093/oso/9780192896742.003.0008
Successive pandemic waves with more virulent strains, and the effects of vaccination for SARS-CoV-2Preprint
Silva, A. C. E., Bernardes, A. T., Barbosa, E. A. G., et al. (2021) · medRxiv · doi:10.1101/2021.09.21.21263901
Impact of Covid 19 Vaccine on Male and Female Fertility
Mujahid, A. Y., Haider, W., Khan, A., Yaseen, T., Sajjad, M., Anwar, A., Naqvi, S. Z. H., & Rehman, N. (2024) · Developmental medico-life-sciences · doi:10.69750/dmls.01.04.043
Walking down the memory lane with SARS‐CoV‐2 B cells
Freund, N. T., Gerlic, M., & Croker, B. A. (2021) · Immunology and Cell Biology · doi:10.1111/imcb.12494
Sulcebe, G., Ylli, A., Cenko, F., Kurti-Prifti, M., Shyti, E., Dashi-Pasholli, J., Lazri, E., Seferi-Qendro, I., & Perry, M. J. (2024) · IJID Regions · doi:10.1016/j.ijregi.2024.100440
Recent SARS‐CoV ‐2 infection: too early to vaccinate?
Li, J., Sutton, K., Ong, L. T. C., et al. (2022) · The Medical Journal of Australia · doi:10.5694/mja2.51499
Memory B cell Development in Response to mRNA SARS-CoV-2 and Nanoparticle Immunization in MicePreprint
Wiatr, M., wang, Z., Canis, M., et al. (2025) · bioRxiv (Cold Spring Harbor Laboratory) · doi:10.1101/2025.10.01.679787
Self-citationBalachandran, H., Phetsouphanh, C., Agapiou, D., et al. (2021) · SSRN Electronic Journal · doi:10.2139/ssrn.3920641
Kothadiya, S., Holden, K. G., Cutshaw, G., Jones, T. C., de Almeida, C. B., Sirotiak, Z., Meyer, J. D., Bardhan, R., & Kohut, M. (2026) · Brain Behavior & Immunity - Health · doi:10.1016/j.bbih.2026.101310
Chappert, P., Mahévas, M., Reynaud, C., & Weill, J. (2025) · Elsevier eBooks · doi:10.1016/b978-0-12-824465-4.00258-1
Deshpande, S., Ansari, M. Y., Sutar, J., et al. (2022) · bioRxiv (Cold Spring Harbor Laboratory) · doi:10.1101/2022.10.19.512979
SARS-CoV-2 Delta derivatives impact on neutralization of Covishield recipient seraPreprint
Sahay, R. R., Patil, D. Y., Sapkal, G. N., et al. (2021) · bioRxiv (Cold Spring Harbor Laboratory) · doi:10.1101/2021.11.30.470521
Kim, E., Shin, J., Ferrari, A., et al. (2023) · bioRxiv (Cold Spring Harbor Laboratory) · doi:10.1101/2023.10.05.561047
Étude de la réponse humorale lors de l'infection par le SARS-CoV-2
Marot, S. (2023) · theses.fr (ABES) · doi:10.70675/7d41e61azd818z408dzb17cz1c0cf0738b83
Miyakawa, K., Kubo, S., Jeremiah, S. S., et al. (2021) · medRxiv · doi:10.1101/2021.09.27.21264013
Production, Regulation, and Distribution of COVID-19 Treatments and Vaccines
Bennett, B., Freckelton, I. R., & Wolf, G. (2023) · Oxford University Press eBooks · doi:10.1093/oso/9780192896742.003.0012
Vallejo, A., Vizcarra, P., Martín-Hondarza, A., et al. (2022) · Research Square · doi:10.21203/rs.3.rs-1846124/v1
Chowdhury, S. R., Chakrabarty, S., Chakraborti, M., & Das, A. K. (2023) · Elsevier eBooks · doi:10.1016/b978-0-323-85730-7.00009-6
The impact of Omicron infection on antibody response and attenuation: a six-month follow-up study
Wu, Y., Guo, S., Zhang, S., Wang, W., Deng, P., Zhao, B. T., Wang, X., Xiao, S., & Yang, L. (2025) · BMC Infectious Diseases · doi:10.1186/s12879-025-11845-y
Litigation and Legal Challenges to Emergency Orders
Bennett, B., Freckelton, I. R., & Wolf, G. (2023) · Oxford University Press eBooks · doi:10.1093/oso/9780192896742.003.0006
Ahmed, J. I., Krosta, S. J., Reimer, M. N., Cheung, W., Mesa, C., Lopez, C., Chua, R. J., Alsattari, F., Robinson, A., Manguiat, K., et al. (2025) · Frontiers in Immunology · doi:10.3389/fimmu.2025.1529134
Lin, Y., Jiang, X., Cao, J.-X., Guo, Q., Wu, M., Wu, S., Duan, L., Shen, Y. L., Zhan, B., Lin, J., et al. (2025) · Vaccine X · doi:10.1016/j.jvacx.2025.100718
Bennett, B., Freckelton, I. R., & Wolf, G. (2023) · Oxford University Press eBooks · doi:10.1093/oso/9780192896742.002.0004
Bennett, B., Freckelton, I. R., & Wolf, G. (2023) · Oxford University Press eBooks · doi:10.1093/oso/9780192896742.002.0005
Li, L., Wang, F., He, X., Pei, T., Lu, J., Zhang, Z., Zhao, P., Xue, J., Zhu, L., Chen, X., et al. (2024) · Viruses · doi:10.3390/v16050672
Cai, J., Yang, J., Deng, X., Cheng, P., Chen, X., Wu, Q., Liu, H., Zhang, J., Zheng, W., Zou, J., et al. (2021) · SSRN Electronic Journal · doi:10.2139/ssrn.3929961
Self-citationBruhn, M., Obara, M., Chiyyeadu, A., et al. (2023) · Research Square · doi:10.21203/rs.3.rs-2733470/v1
The Impact of Coronavirus Disease 2019 Vaccines on the Immune System: A Narrative Review
Urazayeva, S. T., & Tussupkaliyeva, K. (2025) · West Kazakhstan Public Health Journal · doi:10.4103/wkpj.wkpj_3_26
Bramer, L., Hontz, R. D., Eisfeld, A. J., et al. (2022) · medRxiv · doi:10.1101/2022.04.26.22274196
Comparative IgG responses to SARS-CoV-2 after natural infection or vaccinationPreprint
Olds, K. M., Humphreys, D. P., Gavin, K. M., Wyllie, A. L., & Bauer, T. A. (2022) · medRxiv · doi:10.1101/2022.09.28.22280476
The Covid-19 and TB Syndemic: Differences and Similarities
Kaufmann, S. H. E., Sher, A., Sigal, A., & Sawitzki, B. (2023) · Frontiers research topics · doi:10.3389/978-2-8325-4116-6
Effectiveness and Safety of COVID-19 Vaccine
Nishi, J. (2021) · TRENDS IN THE SCIENCES · doi:10.5363/tits.26.10_18
Chua, J. X., Durrant, L. G., Chok, Y. L., & Lai, O. M. (2022) · SSRN Electronic Journal · doi:10.2139/ssrn.4062765
Impact of COVID-19 on Patients with Beta-Thalassemia Major: An Observational Study
Vacca, N., Locci, C., Serra, F., Chicconi, E., Puci, M. V., Sotgiu, G., Amadu, A. M., & Antonucci, R. (2024) · Acta Haematologica · doi:10.1159/000537912
Kasson, P. M. (2021) · The Conversation · doi:10.64628/aai.55qjukrnr
Protective characteristics of COVID-19 convalescent and post-vaccination IgG antibodiesPreprint
Klegerman, M. E., Peng, T., Seferovich, I., Rahbar, M. H., Hessabi, M., Tahanan, A., Wanger, A. R., Grimes, C. Z., Ostrosky‐Zeichner, L., Koster, K. J., et al. (2021) · medRxiv · doi:10.1101/2021.11.19.21266547
Skelly, A. N., Fan, C., Keeffe, J. R., Ökten, A. B., Gavor, E., Newby, M. L., Allen, J. D., Kreider, E. F., Ding, W., Osbaldeston, R. A., et al. (2026) · Proceedings of the National Academy of Sciences · doi:10.1073/pnas.2536870123
Poor immune response to inactivated COVID-19 vaccine in patients with hypertensionPreprint
Yang, L., Zhang, Z., Guo, Q., et al. (2023) · Research Square · doi:10.21203/rs.3.rs-2767071/v1
Khan, R. A., Chen, J., Donius, L. R., et al. (2025) · bioRxiv (Cold Spring Harbor Laboratory) · doi:10.1101/2025.04.23.650289
Hisamatsu, D., Ikeda, A., Ito, L., et al. (2022) · medRxiv · doi:10.1101/2022.08.03.22278353
Hybrid immunity: the immune response of COVID-19 survivors to vaccination
Gancino, M., & Vispo, N. S. (2021) · Bionatura · doi:10.21931/rb/2021.06.03.1
Gostin, L. O. (2023) · Oxford University Press eBooks · doi:10.1093/oso/9780192896742.002.0006
Rodrigues, D., Araujo, B., Pestana, J., da Costa, L. C., Andrade, M. V., de Freitas, L., Nery, B., Bozza, V. B. T., Conde, L., Raposo, L., et al. (2026) · medRxiv · doi:10.64898/2026.04.30.26352163
Vacunación contra SARS-COV-2: un año después de iniciada en Colombia
Pinzón, J. E. D. (2022) · Revista Repertorio de Medicina y Cirugía · doi:10.31260/repertmedcir.01217372.1350
Wu, B. Y., Yu, Y., & Feng, X. L. (2021) · SSRN Electronic Journal · doi:10.2139/ssrn.3911364
Roy, Á., Saade, C., Josset, L., et al. (2023) · medRxiv · doi:10.1101/2023.01.14.23284558
Avaliação da resposta imunológica contra SARS-CoV-2 em grupos de risco vacinados com CoronaVac
de Medeiros, G. X. (2023) · Digital Library of Theses and Dissertations (Universidade de São Paulo) · doi:10.11606/t.5.2023.tde-24042024-170719
Persistence of Antibody Response Against SARS-CoV-2 After Vaccination
Bekti, H. S., Habibah, N., Dharmawati, I. G. A. A., Merdekawati, F., & Noviar, G. (2023) · JURNAL INFO KESEHATAN · doi:10.31965/infokes.vol21.iss4.1066
Does Herd Immunity Reduce the Risk of Contracting COVID-19?
Li, E. (2024) · Journal of Biosciences and Medicines · doi:10.4236/jbm.2024.129003
Bennett, B., Freckelton, I. R., & Wolf, G. (2023) · Oxford University Press eBooks · doi:10.1093/oso/9780192896742.002.0003
Игнатьева, Е. В., Анатольевич, Р. О., & Казаков, С. П. (2024) · Clinical oncohematology · doi:10.21320/2500-2139-2024-17-4-415-421
Metadata
- Authors
- Wang, Z., Muecksch, F., Schaefer-Babajew, D., Finkin, S., Viant, C., Gaebler, C., Hoffmann, H. H., Barnes, C. O., Cipolla, M., Ramos, V., Oliveira, T. Y., Cho, A., Schmidt, F., Da Silva, J., Bednarski, E., Aguado, L., Yee, J., Daga, M., Turroja, M., Millard, K. G., Jankovic, M., Gazumyan, A., Zhao, Z., Rice, C. M., Bieniasz, P. D., Caskey, M., Hatziioannou, T., & Nussenzweig, M. C.
- Affiliations
- Rockefeller University (US)
- California Institute of Technology (US)
- Weill Cornell Medicine (US)
- Howard Hughes Medical Institute (US)
- Corresponding author
- Bieniasz, Paul D.
- Caskey, Marina
- Nussenzweig, Michel C.
- ORCID
- Wang, Zijun
- Muecksch, Frauke
- Schaefer-Babajew, Dennis
- Finkin, Shlomo
- Viant, Charlotte
- Gaebler, Christian
- Barnes, Christopher O.
- Cipolla, Melissa
- Ramos, Victor
- Oliveira, Thiago Y.
- Cho, Alice
- Schmidt, Fabian
- Bednarski, Eva
- Aguado, Lauren
- Yee, Jim
- Daga, Mridushi
- Turroja, Martina
- Millard, Katrina G.
- Gazumyan, Anna
- Zhao, Zhen
- Rice, Charles M.
- Bieniasz, Paul D.
- Caskey, Marina
- Hatziioannou, Theodora
- Nussenzweig, Michel C.
- Venue
- Nature
- Published
- 2021-06-14
- Volume
- 595
- Issue
- 7867
- Pages
- 426-431
- ISSN
- 0028-0836 (ISSN-L)
- 1476-4687
- PMC
- PMC8277577
- OpenAlex
- W3167555428
- Semantic Scholar
- 0f7808971438f11ba057dd2209a3aa8f4c8d28c8
- Cited by
- 721
- References
- 63
- Citations by year
- 2026: 23 · 2025: 41 · 2024: 71 · 2023: 150 · 2022: 281 · 2021: 154
- FWCI
- 51.89
- Type
- journal article
- Language
- en
- Open access
- hybrid
- doi.org
- Locations
- Nature (publishedVersion, cc-by)
- bioRxiv (Cold Spring Harbor Laboratory) (acceptedVersion)
- PubMed Central (publishedVersion, cc-by)
- PubMed (publishedVersion)
- PubMed Central (submittedVersion)
- CaltechAUTHORS (California Institute of Technology) (submittedVersion, cc-by)
- RePEc: Research Papers in Economics (submittedVersion)
- Funders
- Howard Hughes Medical Institute (UL1TR001866)
- George Mason University (3 R01-AI091707-10S1)
- California Institute of Technology
- Wellcome Trust
- Fast Grants
- National Institutes of Health (P01-AI138398-S1, COVID-19, TR001866, UL1TR001866)
- Beckman Institute, California Institute of Technology
- National Institute of Allergy and Infectious Diseases (R01AI091707, R01AI078788, U19AI111825, R37AI064003)
- National Center for Advancing Translational Sciences (TR001866)
- Topics
- Health Sciences › Medicine › Infectious Diseases › SARS-CoV-2 and COVID-19 Research
- Life Sciences › Immunology and Microbiology › Immunology › Immune responses and vaccinations
- Life Sciences › Biochemistry, Genetics and Molecular Biology › Molecular Biology › vaccines and immunoinformatics approaches
- Keywords
- SARS-CoV-2, COVID-19 pandemic, natural immunity, convalescent patients, neutralizing antibodies, receptor binding domain, memory B cells, mRNA vaccines, variants of concern, monoclonal antibodies
About these checks
Registry, retraction, Cites and statistics results are computed, not judged, with one exception: a printed reference that no index lists is read once by a model before it counts as a citation error. Claims are extracted by a model and kept only when their quote appears verbatim in the text; each cited source is then checked, with a model’s help, for whether it says what the claim relies on. Those verdicts can be wrong — read the claim’s quote and the cited source before relying on one.
A language model drew the claims from the paper on 2026-10-06, under version 3 of the claim definition (model deepseek-v4.1-flash, prompt extract-v3).
A second model labelled each claim on 2026-10-06 (model jev-1.13-20260917, definition revision gold-guideline-v0.2).
Statistics and arithmetic are recomputed, not judged.
Confidence bands are shown only for fields calibrated on our annotated test set. None is calibrated yet, so no band is shown.
What counts as a claim ›How we measure confidence ›How we check this ›
Are you an author, or do you see a problem with this page? Request a review
