

The DOI matches its Crossref record; 115 of the 115 references it cites were found in a registry or an index; 44 of the 74 sources its claims cite were checked for support.
Dissection of artifactual and confounding glial signatures by single-cell sequencing of mouse and human brain
Open accessPublished version of a preprint
Abstract
A key aspect of nearly all single-cell sequencing experiments is dissociation of intact tissues into single-cell suspensions. While many protocols have been optimized for optimal cell yield, they have often overlooked the effects that dissociation can have on ex vivo gene expression. Here, we demonstrate that use of enzymatic dissociation on brain tissue induces an aberrant ex vivo gene expression signature, most prominently in microglia, which is prevalent in published literature and can substantially confound downstream analyses. To address this issue, we present a rigorously validated protocol that preserves both in vivo transcriptional profiles and cell-type diversity and yield across tissue types and species. We also identify a similar signature in postmortem human brain single-nucleus RNA-sequencing datasets, and show that this signature is induced in freshly isolated human tissue by exposure to elevated temperatures ex vivo. Together, our results provide a methodological solution for preventing artifactual gene expression changes during fresh tissue digestion and a reference for future deeper analysis of the potential confounding states present in postmortem human samples.
Overview
AI snapshot
Written from the paper’s full text.
TL;DR
Enzymatic dissociation of mouse brain induces an aberrant ex vivo transcriptional signature, most prominently in microglia, that is widespread in published single-cell datasets and can confound downstream analyses. The authors provide an inhibitor-based protocol that prevents this signature and show a similar signature in human postmortem microglia/astrocytes that can be induced by delayed freezing.
Key findings
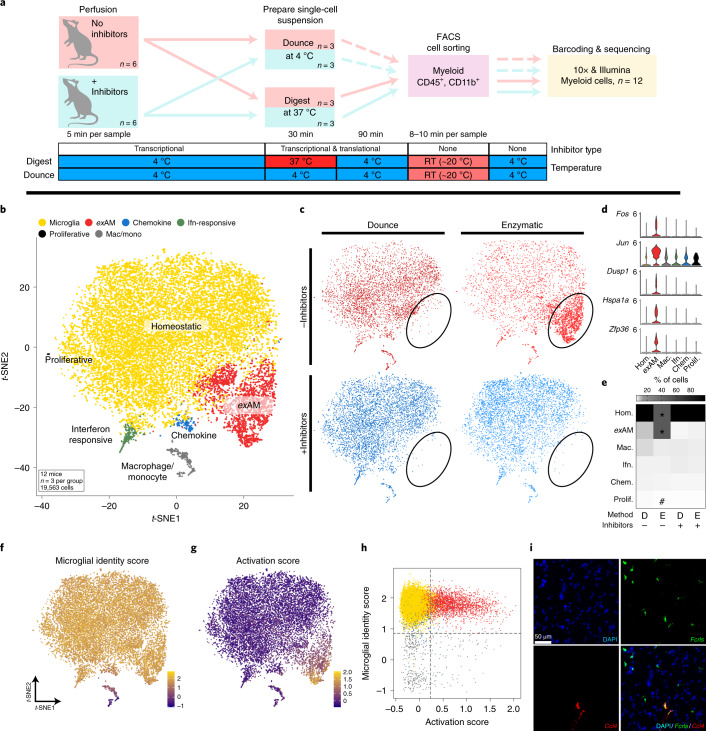
- In sorted mouse microglia, enzymatic digestion without inhibitors produced an ex vivo “activated” microglia (exAM) cluster enriched for immediate early, stress and immune genes; ENZ-NONE samples had a significant decrease in homeostatic cluster proportion and increase in exAM proportion (*FDR ≤ 0.004; ENZ-NONE versus all other groups; 19,563 cells from n = 12 mice, n = 3 per condition).
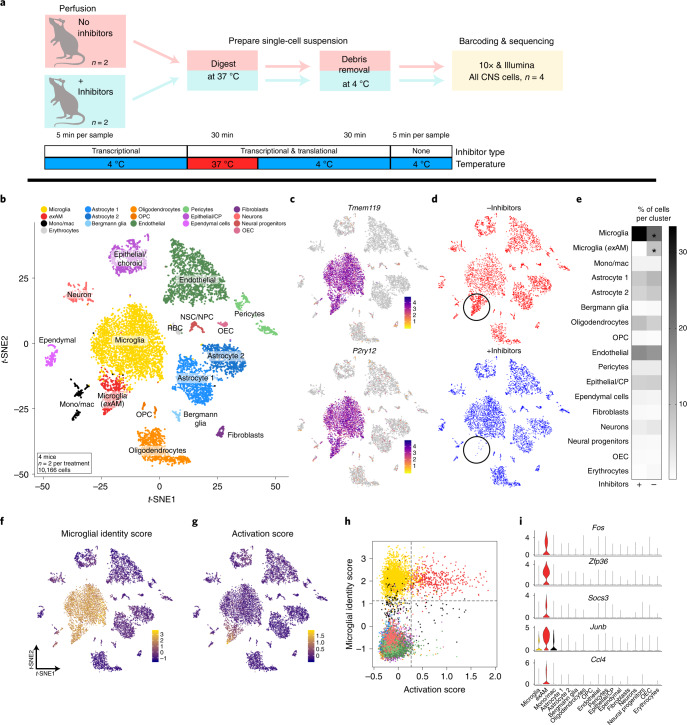
- Adding transcriptional/translational inhibitors eliminated the artifact: DNC-NONE versus DNC-INHIB showed no significant DEGs, and in all-CNS scRNA-seq (10,166 cells, n = 2 per group) only 18 genes were significantly upregulated and none downregulated without inhibitors.
- Reanalysis of published datasets found the exAM signature across technologies, enzymes and brain regions; overlap was 19 of 25 genes with Van Hove et al., 16 genes with mouse muscle and 11 genes with kidney dissociation signatures.
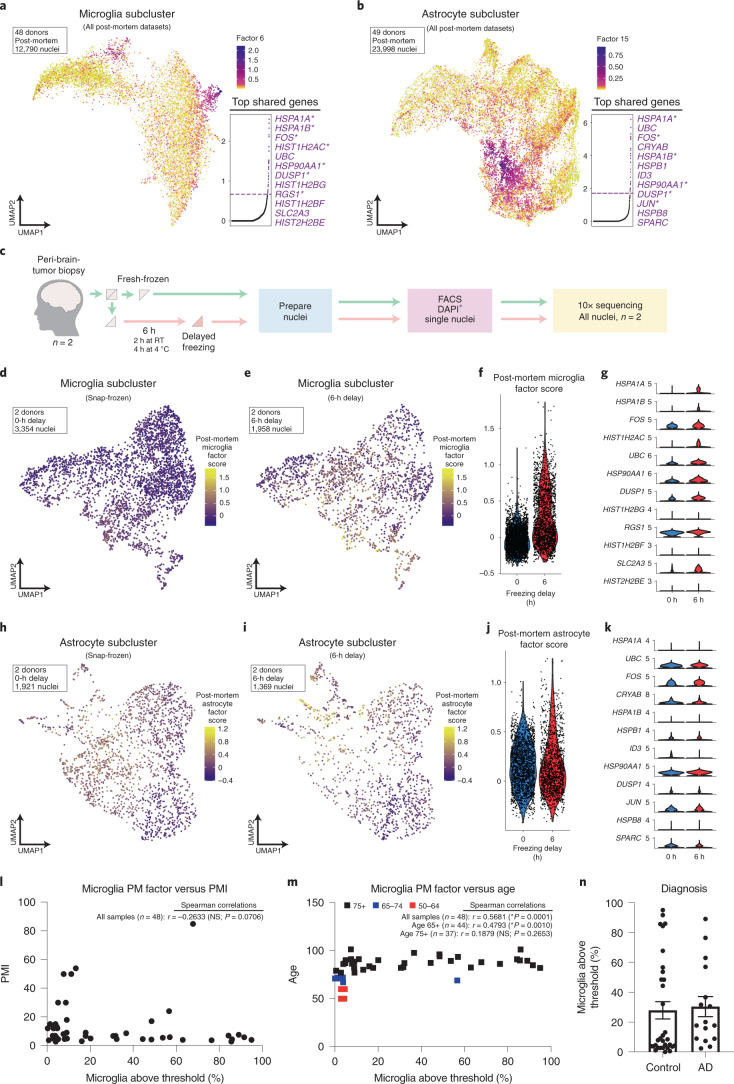
- Human postmortem snRNA-seq (47,505 nuclei, three donors) showed enrichment in microglia and some astrocytes; LIGER factors overlapped 79% (30 of 38) for microglia and 44% (12 of 27) for astrocytes, and a 6-h freezing delay induced the microglial factor (P < 3.2 × 10−215; 31 of 38 genes) but weaker astrocyte changes (P < 0.05; 4 of 27 genes).
Methods
- Mouse scRNA-seq compared cold mechanical dissociation with enzymatic digestion ± an inhibitor cocktail, using FACS-sorted CD45+/CD11b+ myeloid cells and unsorted all-CNS preparations; analyses used Seurat, DESeq2 on pseudobulk “Metacells,” MAST and speckle.
- Human snRNA-seq used postmortem brain and acutely resected peri-tumor tissue, with nuclei isolation/sorting and 10X Genomics 3′ v.3; analyses used LIGER/iNMF, gene module scoring and comparison of snap-frozen versus 6-h delayed-freezing samples.
- The study also reanalyzed published mouse and human datasets and performed RNAscope smFISH for Ccl4/Fcrls validation.
Limitations
- Stated: the human postmortem signature was highly variable across donors and did not correlate with PMI or most available metadata; an age correlation (Spearman r = 0.3208, *P = 0.0001, n = 48) was not robust in donors aged 75+ (r = 0.1879, P = 0.2653, n = 37), and more middle-aged samples are needed.
- Stated: current human snRNA-seq datasets are limited by microglia proportion and lower sensitivity of earlier chemistries/nuclei isolation, and the authors caution against overinterpreting biological significance of similar signatures.
- Evident from the text: mouse scRNA-seq used male mice at P89–90 with small group sizes (n = 2–3 per group), human PBMC mock digestion used one healthy 35-year-old male, and acute human tissue was peri-tumor rather than normal brain; the authors also note that one proliferative-cluster abundance result should be interpreted cautiously because it represented only 0.1% of cells (27 of 19,563).
Model-written summary. Check it against the paper before relying on it.
Integrity signals
Registry
Cites
Statistics
Figures
Verification
Claims the paper makes
54 Own result · 18 Own method · 15 Own interpretation · 13 Partly supported · 6 Supported · 5 No full text of the sources · 4 Supported so far · 4 No basis given · 1 Couldn’t confirm · 1 Not checked yet · accuracy not yet measured
Every source the paper cites for this claim was checked and supports it.
In the paper
“Previously, we optimized a cold mechanical dissociation protocol to isolate microglia for scRNA-seq with minimal ex vivo transcriptional alterations15.”
§ Dissection of artifactual and confounding glial signatures by single-cell sequencing of mouse and human brain > Results > scRNA-seq reveals that mouse microglia are highly sensitive to ex vivo alterations
What the sources say
- Supportedcites [15] Hammond, T. R. et al. Single-cell RNA sequencing of microglia throughout the mouse lifespan and in the injured brain reveals complex cell-state changes. Immunity 50, 253–271.e6 (2019). source
The Results section, “Isolation of microglia to minimize ex vivo activation,” says the authors generated single-cell suspensions under consistently cold conditions to minimize ex vivo activation and transcriptional activity. The STAR Methods describe cold mincing and Dounce homogenization, followed by purification of microglia for sequencing. No page number is provided in our copy. (LLM, conf=0.90)
plaindirect- Asserted: passes — The authors put it forward as true.
- Checkable: passes — It can be checked against evidence.
- Load-bearing: passes — The paper’s conclusions depend on it.
- Based: passes — The paper gives a reason why it holds.
- Supported
Every source the paper cites for this claim was checked and supports it.
In the paper
“As the tissue-resident macrophages of the brain, microglia are highly sensitive to perturbations in their environment13,14.”
§ Dissection of artifactual and confounding glial signatures by single-cell sequencing of mouse and human brain > Results > scRNA-seq reveals that mouse microglia are highly sensitive to ex vivo alterations
What the sources say
- Supportedcites [13] Gosselin, D. et al. An environment-dependent transcriptional network specifies human microglia identity. Science 356, (2017). source
The Abstract reports rapid and extensive changes in microglia-specific gene expression after transfer from brain tissue to culture. The Discussion likewise describes rapid, profound changes within six hours, supporting the claim that microglia are highly sensitive to changes in their environment. (LLM, conf=0.93)
- Supportedcites [14] Bohlen, C. J. et al. Diverse requirements for microglial survival, specification, and function revealed by defined-medium cultures. Neuron 94, 759–773.e8 (2017). source
The Discussion (“Microglial fate is continuously instructed by CNS-specific cues”) says microglial signature genes change extremely rapidly after isolation and that microglia quickly accommodate different tissue contexts. The Results (“Microglial specification requires sustained CNS instruction”) report a marked decline in signature-gene expression within four hours of isolation, supporting sensitivity to environmental change. Page numbers are not provided in our copy. (LLM, conf=0.93)
plain- Asserted: passes — The authors put it forward as true.
- Checkable: passes — It can be checked against evidence.
- Load-bearing: passes — The paper’s conclusions depend on it.
- Based: passes — The paper gives a reason why it holds.
- Supported
Every source the paper cites for this claim was checked and supports it.
In the paper
“In line with our previous work15, we find that adult microglia are largely homogenous.”
§ Dissection of artifactual and confounding glial signatures by single-cell sequencing of mouse and human brain > Results > scRNA-seq reveals that mouse microglia are highly sensitive to ex vivo alterations
What the sources say
- Supportedcites [15] Hammond, T. R. et al. Single-cell RNA sequencing of microglia throughout the mouse lifespan and in the injured brain reveals complex cell-state changes. Immunity 50, 253–271.e6 (2019). source
In the Results section on microglial states across development (page not provided), the paper reports considerably less diversity in adult (P100) microglia than in early development. It also says adult microglia were largely assigned to three central clusters without unique defining genes, supporting the characterization “largely homogenous,” rather than completely uniform. (LLM, conf=0.90)
plainn = 12- Asserted: passes — The authors put it forward as true.
- Checkable: passes — It can be checked against evidence.
- Load-bearing: unclear — It is unclear whether the paper’s conclusions depend on it.
- Based: passes — The paper gives a reason why it holds.
- Supported
The cited sources support only part of this claim — read each source’s verdict below.
In the paper
“Of note, we observed substantial loss of some cell-surface receptors following enzymatic digestion, in line with previous work in peripheral immunology (Supplementary Fig. 1d–f and Supplementary Note 1)3,5–9.”
§ Dissection of artifactual and confounding glial signatures by single-cell sequencing of mouse and human brain > Results > scRNA-seq reveals that mouse microglia are highly sensitive to ex vivo alterations
What the sources say
- Not checked — no full text of the sourcecites [3] Abuzakouk, M., Feighery, C. & O’Farrelly, C. Collagenase and Dispase enzymes disrupt lymphocyte surface molecules. J. Immunol. Methods 194, 211–216 (1996). source
- Not checked — no full text of the sourcecites [5] Grange, C. et al. Phenotypic characterization and functional analysis of human tumor immune infiltration after mechanical and enzymatic disaggregation. J. Immunol. Methods 372, 119–126 (2011). source
- Supportedcites [6] Autengruber, A., Gereke, M., Hansen, G., Hennig, C. & Bruder, D. Impact of enzymatic tissue disintegration on the level of surface molecule expression and immune cell function. Eur. J. Microbiol. Immunol. (Bp) 2, 112–120 (2012). source
In “Enzymatic digestion affects expression level of surface molecules on immune cells” (page not provided), the paper reports dramatic decreases in several surface markers after dispase digestion of splenocytes. It also notes that collagenase had only minor effects on most markers, so the finding applies particularly to dispase. (LLM, conf=0.93)
- Supportedcites [7] Botting, R. A. et al. Phenotypic and functional consequences of different isolation protocols on skin mononuclear phagocytes. J. Leukoc. Biol. 101, 1393–1403 (2017). source
The Results section, “Effect of collagenase and skin culture on expression of surface markers and pathogen-binding receptors,” reports that trypsin cleaved several surface markers and pathogen-binding receptors, while collagenase blends cleaved other receptors. The Discussion describes cleavage of many CLRs and Siglecs by type IV collagenase as dramatic, supporting the claim that enzymatic digestion can cause substantial loss of some cell-surface receptors. (LLM, conf=0.94)
- Supportedcites [8] Schreurs, R. R. C. E. et al. Quantitative comparison of human intestinal mononuclear leukocyte isolation techniques for flow cytometric analyses. J. Immunol. Methods 445, 45–52 (2017). source
Section 3.3 reports reduced CD4 expression after Liberase TL digestion, to the point that the CD4+ T-cell subset could no longer be identified. It also reports reduced CD28 expression on PBMC CD4+ T cells after Liberase TL treatment. The effect was marker- and enzyme-specific; many other markers were unaffected. (LLM, conf=0.88)
- Partly supportedcites [9] Reichard, A. & Asosingh, K. Best practices for preparing a single cell suspension from solid tissues for flow cytometry. Cytometry A 95, 219–226 (2019). sourceExperimental — accuracy not yet measured
The Tissue Disaggregation > Enzymes section says dispase can cleave specific cell-surface molecules or antigens relevant to T-cell analysis. The Enzymatic and Mechanical Dissociation section also warns that strong or concentrated enzymes may compromise surface markers. These passages support loss of some markers, but do not establish that the loss is substantial or occurs with enzymatic digestion generally. (LLM, conf=0.84)
plaindirect- Asserted: passes — The authors put it forward as true.
- Checkable: passes — It can be checked against evidence.
- Load-bearing: passes — The paper’s conclusions depend on it.
- Based: passes — The paper gives a reason why it holds.
The cited sources support only part of this claim — read each source’s verdict below.
In the paper
“We also found a high concordance between genes that were upregulated in ‘digested’ PBMCs and those that were observed as upregulated in tissue-resident cells following tissue digestion in the Pasciuto et al.42 and Crinier et al.46 studies (Supplementary Fig. 13f).”
§ Dissection of artifactual and confounding glial signatures by single-cell sequencing of mouse and human brain > Results > Artifactual signature is shared by other immune populations and tissues
What the sources say
- Partly supportedcites Pasciuto et al.42 Pasciuto, E. et al. Microglia require CD4 T cells to complete the fetal-to-adult transition. Cell 182, 625–640.e24 (2020). sourceExperimental — accuracy not yet measured
The STAR★Methods (Method Details; page unavailable) describe digestion of brain tissue to prepare single-cell suspensions, and the Results report differentially expressed genes in isolated microglia. The copy does not show that those genes were upregulated because of digestion, or compare digested with undigested tissue. The claimed high concordance is the citing authors’ own finding, not a result attributed to Pasciuto et al. (LLM, conf=0.76)
- Partly supportedcites Crinier et al.46 Crinier, A. et al. High-dimensional single-cell analysis identifies organ-specific signatures and conserved NK cell subsets in humans and mice. Immunity 49, 971–986.e5 (2018). sourceExperimental — accuracy not yet measured
The Results report genes expressed more strongly in splenic than blood NK cells, supporting the use of Crinier et al. as a source for a tissue-cell gene signature. But the STAR Methods say the spleen specimens were mechanically disrupted, not digested; the paper therefore does not support describing those genes as upregulated following tissue digestion. The high-concordance comparison is the citing authors’ own finding, not one attributed to Crinier et al. (LLM, conf=0.86)
plaincorrelational- Asserted: passes — The authors put it forward as true.
- Checkable: passes — It can be checked against evidence.
- Load-bearing: passes — The paper’s conclusions depend on it.
- Based: passes — The paper gives a reason why it holds.
- Partly supported
The cited sources support only part of this claim — read each source’s verdict below.
In the paper
“revealed that ex vivo activation resulted in mis-annotation of exAMs as extra microglial clusters (Supplementary Note 3)37,39.”
§ Dissection of artifactual and confounding glial signatures by single-cell sequencing of mouse and human brain > Results > Presence of artifactual microglia signature is common across multiple experimental parameters
What the sources say
- Could not verifycites [37] Zeisel, A. et al. Molecular architecture of the mouse nervous system. Cell 174, 999–1014.e22 (2018). sourceExperimental — accuracy not yet measured
The STAR★Methods section discusses over-split clusters in general, but does not connect them to ex vivo activation or microglia. Searches for “exAMs,” “ex vivo,” and activated microglia found no passage in our copy addressing the claimed mis-annotation. (LLM, conf=0.72)
- Partly supportedcites [39] Mizrak, D. et al. Single-cell analysis of regional differences in adult V-SVZ neural stem cell lineages. Cell Rep. 26, 394–406.e5 (2019). sourceExperimental — accuracy not yet measured
The Results section, “Major Cell Types in the Adult V-SVZ” (page unavailable), identifies two microglial subtypes, one likely representing an activated state. It does not say that ex vivo activation caused that state or that exAMs were mis-annotated as extra clusters. (LLM, conf=0.82)
plaindirect- Asserted: passes — The authors put it forward as true.
- Checkable: passes — It can be checked against evidence.
- Load-bearing: passes — The paper’s conclusions depend on it.
- Based: passes — The paper gives a reason why it holds.
- Could not verify
The sources with a verdict support this claim; the rest weren’t checked yet, have no full text we could read, or their verdicts aren’t rated yet.
In the paper
“Previous reports comparing cell isolation protocols or cells postisolation have often focused on aspects such as cell viability and/or yield4,62 over whether the isolated cells are truly reflective of their in vivo state13,14.”
§ Dissection of artifactual and confounding glial signatures by single-cell sequencing of mouse and human brain > Discussion
What the sources say
- Not checked — no full text of the sourcecites [4] Cardona, A. E., Huang, D., Sasse, M. E. & Ransohoff, R. M. Isolation of murine microglial cells for RNA analysis or flow cytometry. Nat. Protoc. 1, 1947–1951 (2006). source
- Not checked — no full text of the sourcecites [62] de Haas, A. H., Boddeke, H. W., Brouwer, N. & Biber, K. Optimized isolation enables ex vivo analysis of microglia from various central nervous system regions. Glia 55, 1374–1384 (2007). source
- Supportedcites [13] Gosselin, D. et al. An environment-dependent transcriptional network specifies human microglia identity. Science 356, (2017). source
This source is cited for the question of whether isolated cells reflect their in vivo state, not for the preceding claim about other reports’ focus on viability or yield. The Discussion reports rapid, profound gene-expression changes in microglia after transfer to culture and identifies this as a limitation of studying microglia outside the brain environment. (LLM, conf=0.89)
- Supportedcites [14] Bohlen, C. J. et al. Diverse requirements for microglial survival, specification, and function revealed by defined-medium cultures. Neuron 94, 759–773.e8 (2017). source
The citation to this paper is attached to whether isolated cells reflect their in vivo state, not to the preceding claim about viability and yield. The Results section, “Microglia change gene expression profiles in culture” (page unavailable), reports extensive differences between cultured and freshly isolated microglia; the Discussion, “Microglial fate is continuously instructed by CNS-specific cues” (page unavailable), adds that even acutely isolated cells have shortcomings as models of their native state. (LLM, conf=0.90)
plain- Asserted: passes — The authors put it forward as true.
- Checkable: passes — It can be checked against evidence.
- Load-bearing: passes — The paper’s conclusions depend on it.
- Based: passes — The paper gives a reason why it holds.
The cited sources support only part of this claim — read each source’s verdict below.
In the paper
“Our inhibitor-based protocol offers much greater experimental and tissue-/cell-type flexibility than previously developed experimental and computational solutions for this pervasive issue (see additional discussion of some alternative methods in Supplementary Note 7)33,34,45,65,67,68.”
§ Dissection of artifactual and confounding glial signatures by single-cell sequencing of mouse and human brain > Discussion
What the sources say
- Partly supportedcites [33] Saunders, A. et al. Molecular diversity and specializations among the cells of the adult mouse brain. Cell 174, 1015–1030.e16 (2018). sourceExperimental — accuracy not yet measured
STAR Methods (Method Details; page unavailable) describes a prior tissue-dissociation protocol with digestion times optimized by brain region. STAR Methods (Quantification and Statistical Analysis; page unavailable) also describes identifying computational components associated with digest-time artifacts. These passages support citing the paper as an example of earlier approaches, but they do not compare those approaches with the citing authors’ inhibitor-based protocol or establish its greater flexibility. (LLM, conf=0.82)
- Partly supportedcites [34] Mattei, D. et al. Enzymatic dissociation induces transcriptional and proteotype bias in brain cell populations. Int. J. Mol. Sci. 21 (2020). sourceExperimental — accuracy not yet measured
The Discussion (page unavailable) describes limitations of earlier approaches: single-nucleus sequencing is unsuitable for some fresh-cell studies, and transcription/translation blockers do not prevent degradation of existing RNAs and proteins. Those passages provide context for comparing methods, but this paper does not evaluate the citing authors’ inhibitor-based protocol or establish that it offers greater experimental and tissue-/cell-type flexibility than previous experimental and computational solutions. (LLM, conf=0.78)
- Supportedcites [45] Denisenko, E. et al. Systematic assessment of tissue dissociation and storage biases in single-cell and single-nucleus RNA-seq workflows. Genome Biol. 21, 130 (2020). source
The Results (Comparison of tissue dissociation protocols) identify cold-active protease dissociation as a previously developed experimental approach and report that it is less damaging than warm dissociation. This supports citing the paper as an example of an alternative method; the statement about the citing authors’ inhibitor protocol being more flexible is their own comparison, not a finding attributed to this source. (LLM, conf=0.84)
- Not checked — no full text of the sourcecites [65] Adam, M., Potter, A. S. & Potter, S. S. Psychrophilic proteases dramatically reduce single-cell RNA-seq artifacts: a molecular atlas of kidney development. Development 144, 3625–3632 (2017). source
- Not checked — no full text of the sourcecites [67] Sankowski, R. et al. Mapping microglia states in the human brain through the integration of high-dimensional techniques. Nat. Neurosci. 22, 2098–2110 (2019). source
- Not checked — no full text of the sourcecites [68] Pombo Antunes, A. R. et al. Single-cell profiling of myeloid cells in glioblastoma across species and disease stage reveals macrophage competition and specialization. Nat. Neurosci. 24, 595-610 (2021). source
plaindirect- Asserted: passes — The authors put it forward as true.
- Checkable: passes — It can be checked against evidence.
- Load-bearing: passes — The paper’s conclusions depend on it.
- Based: passes — The paper gives a reason why it holds.
- Partly supported
The sources with a verdict support this claim; the rest weren’t checked yet, have no full text we could read, or their verdicts aren’t rated yet.
In the paper
“Consistent with the reports from other tissues in mice, we found that typical enzymatic digestion of mouse brain tissue induced a host of transcriptional alterations34,43,44,65.”
§ Dissection of artifactual and confounding glial signatures by single-cell sequencing of mouse and human brain > Discussion
What the sources say
- Supportedcites [34] Mattei, D. et al. Enzymatic dissociation induces transcriptional and proteotype bias in brain cell populations. Int. J. Mol. Sci. 21 (2020). source
The section “Enzymatic tissue digestion induces transcriptional biases in brain cells” reports significant transcriptional changes across multiple cell types after enzymatic digestion of mouse hippocampal tissue, compared with mechanical dissociation. It lists hundreds of deregulated genes in neurons, glia, and other brain cells, supporting the claim of a host of alterations. (LLM, conf=0.94)
- Not checked — no full text of the sourcecites [43] Van Hove, H. et al. A single-cell atlas of mouse brain macrophages reveals unique transcriptional identities shaped by ontogeny and tissue environment. Nat. Neurosci. 22, 1021–1035 (2019). source
- Not checked — no full text of the sourcecites [44] van den Brink, S. C. et al. Single-cell sequencing reveals dissociation-induced gene expression in tissue subpopulations. Nat. Methods 14, 935–936 (2017). source
- Not checked — no full text of the sourcecites [65] Adam, M., Potter, A. S. & Potter, S. S. Psychrophilic proteases dramatically reduce single-cell RNA-seq artifacts: a molecular atlas of kidney development. Development 144, 3625–3632 (2017). source
plaindirect- Asserted: passes — The authors put it forward as true.
- Checkable: passes — It can be checked against evidence.
- Load-bearing: passes — The paper’s conclusions depend on it.
- Based: passes — The paper gives a reason why it holds.
- Supported
The cited sources support only part of this claim — read each source’s verdict below.
In the paper
“However, few studies have examined the human brain for cell-type-specific differences in transcriptional states as a result of tissue handling or acute pre/postmortem processes12, and to our knowledge none have done so in a cell-type-specific manner using snRNA-seq.”
§ Dissection of artifactual and confounding glial signatures by single-cell sequencing of mouse and human brain > Main
What the sources say
- Partly supportedcites [12] Jaffe, A. E. Postmortem human brain genomics in neuropsychiatric disorders—how far can we go? Curr. Opin. Neurobiol. 36, 107–111 (2016). sourceExperimental — accuracy not yet measured
The ‘Functional genomics in the human brain’ section says agonal state and the time between death and tissue processing can affect observed gene expression. ‘Moving towards interrogating individual cell populations’ describes cell-type-specific analysis of postmortem human brain as a challenge. Neither passage establishes that few studies have examined cell-type-specific transcriptional responses to tissue handling or acute pre/postmortem processes. (LLM, conf=0.82)
plain- Asserted: passes — The authors put it forward as true.
- Checkable: passes — It can be checked against evidence.
- Load-bearing: passes — The paper’s conclusions depend on it.
- Based: passes — The paper gives a reason why it holds.
- Rests on an assumption: No prior study has examined the human brain for cell-type-specific differences in transcriptional states using snRNA-seq.
- Partly supported
- Probably not a substantial claim. 27
- It may state two separate claims as one. 26
- The quote only partly states this claim. 1
The sources with a verdict support this claim; the rest weren’t checked yet, have no full text we could read, or their verdicts aren’t rated yet.
In the paper
“However, emerging results from other tissues/cell types have begun to characterize dissociation artifacts following enzymatic digestion43–45,65,66.”
§ Dissection of artifactual and confounding glial signatures by single-cell sequencing of mouse and human brain > Discussion
What the sources say
- Not checked — no full text of the sourcecites [43] Van Hove, H. et al. A single-cell atlas of mouse brain macrophages reveals unique transcriptional identities shaped by ontogeny and tissue environment. Nat. Neurosci. 22, 1021–1035 (2019). source
- Not checked — no full text of the sourcecites [44] van den Brink, S. C. et al. Single-cell sequencing reveals dissociation-induced gene expression in tissue subpopulations. Nat. Methods 14, 935–936 (2017). source
- Supportedcites [45] Denisenko, E. et al. Systematic assessment of tissue dissociation and storage biases in single-cell and single-nucleus RNA-seq workflows. Genome Biol. 21, 130 (2020). source
The Results (Comparison of tissue dissociation protocols; page unavailable) report stress-response gene expression and changes in cell-type abundance after warm enzymatic dissociation of mouse kidney. The Discussion (page unavailable) explicitly describes these as artifacts of proteolytic tissue digestion at 37 °C. (LLM, conf=0.93)
- Not checked — no full text of the sourcecites [65] Adam, M., Potter, A. S. & Potter, S. S. Psychrophilic proteases dramatically reduce single-cell RNA-seq artifacts: a molecular atlas of kidney development. Development 144, 3625–3632 (2017). source
- Supportedcites [66] Machado, L. et al. Tissue damage induces a conserved stress response that initiates quiescent muscle stem cell activation. Cell Stem Cell 28, 1125–1135.e7 (2021). source
The section “Definition of a core stress signature in muscle and liver in response to cell dissociation” (p. 4) compares intact and dissociated muscle and liver across multiple cell types and reports strong transcriptional changes. Figure 1 (p. 12) specifies that the tissues underwent enzymatic dissociation, so the paper directly characterizes the artifacts described in the claim. (LLM, conf=0.93)
plaincorrelational- Asserted: passes — The authors put it forward as true.
- Checkable: passes — It can be checked against evidence.
- Load-bearing: fails — The paper’s conclusions may not depend on it.
- Based: passes — The paper gives a reason why it holds.
Probably not a substantial claim. The paper’s conclusions may not depend on it.
The cited sources support only part of this claim — read each source’s verdict below.
In the paper
“Finally, there were three genes that overlapped between the microglial and astrocyte factors that were not a part of consensus mouse gene lists (UBC, DDIT4 and HSPB1), but which unsurprisingly are also part of cellular stress and damage response machinery52–55.”
§ Dissection of artifactual and confounding glial signatures by single-cell sequencing of mouse and human brain > Results > Analysis of human postmortem snRNA-seq identifies similar gene signatures in both microglia and astrocytes
What the sources say
- Not checked — no full text of the sourcecites [52] Concannon, C. G., Gorman, A. M. & Samali, A. On the role of Hsp27 in regulating apoptosis. Apoptosis 8, 61–70 (2003). source
- Partly supportedcites [53] Wang, Z. et al. Dexamethasone-induced gene 2 (dig2) is a novel pro-survival stress gene induced rapidly by diverse apoptotic signals. J. Biol. Chem. 278, 27053–27058 (2003). sourceExperimental — accuracy not yet measured
The Discussion identifies dig2 as a stress-response gene induced by diverse cellular stressors, supporting the stress-response characterization of the gene studied here. Our copy does not identify dig2 as DDIT4, so it does not establish that this paper supports the claim specifically about DDIT4. The microglial–astrocyte overlap is the citing authors’ finding, not a finding attributed to this source. (LLM, conf=0.78)
- Supportedcites [54] Ryu, K. Y. et al. The mouse polyubiquitin gene UbC is essential for fetal liver development, cell-cycle progression and stress tolerance. EMBO J. 26, 2693–2706 (2007). source
The Introduction identifies UbC as a stress-regulated polyubiquitin gene, and the Discussion describes increased UbC expression under several cellular stresses. This supports the paper’s role in the grouped citations: identifying UBC as part of cellular stress-response machinery. The paper does not address the citing authors’ microglial–astrocyte gene-list overlap. (LLM, conf=0.90)
- Supportedcites [55] Bianchi, M., Crinelli, R., Arbore, V. & Magnani, M. Induction of ubiquitin C (UBC) gene transcription is mediated by HSF1: role of proteotoxic and oxidative stress. FEBS Open Bio 8, 1471–1485 (2018). source
The Abstract identifies UBC as a stress-responsive gene that helps provide extra ubiquitin under stressful conditions. The Discussion reports UBC upregulation in cells exposed to arsenite and a proteasome inhibitor. This supports the cited paper’s contribution to the multi-citation statement: UBC’s role in cellular stress response, not the gene-list overlap or the roles of DDIT4 and HSPB1. (LLM, conf=0.92)
plaincorrelational- Asserted: passes — The authors put it forward as true.
- Checkable: passes — It can be checked against evidence.
- Load-bearing: unclear — It is unclear whether the paper’s conclusions depend on it.
- Based: passes — The paper gives a reason why it holds.
It may state two separate claims as one.
The cited sources support only part of this claim — read each source’s verdict below.
In the paper
“Some experimental conditions may dictate the need for greater yield, especially for older or less-sensitive approaches (including many older bulk RNA-sequencing (RNA-seq) studies or protein-based analyses), which is likely why many widely used and widely cited protocols for microglial isolation continue to include enzymatic digestion4,63,64.”
§ Dissection of artifactual and confounding glial signatures by single-cell sequencing of mouse and human brain > Discussion
What the sources say
- Not checked — no full text of the sourcecites [4] Cardona, A. E., Huang, D., Sasse, M. E. & Ransohoff, R. M. Isolation of murine microglial cells for RNA analysis or flow cytometry. Nat. Protoc. 1, 1947–1951 (2006). source
- Partly supportedcites [63] Grabert, K. & McColl, B. W. Isolation and phenotyping of adult mouse microglial cells. Methods Mol. Biol. 1784, 77–86 (2018). sourceExperimental — accuracy not yet measured
The Introduction describes a microglial-isolation protocol that uses enzymatic dissociation, and Notes (Note 3) reports that digestion improved microglial yield. Our copy does not establish that many widely used protocols include digestion, or that a need for greater yield explains their use of it, particularly for older RNA-seq or protein-based analyses. (LLM, conf=0.83)
- Partly supportedcites [64] Bordt, E. A. et al. Isolation of microglia from mouse or human tissue. STAR Protoc. 1, (2020). sourceExperimental — accuracy not yet measured
The Limitations section (‘Warm versus Cold Tissue Dissociation’; page unavailable) reports that warm enzymatic digestion yielded 2–3 times as many cells as cold mechanical dissociation. The Step-by-Step Method Details also include an enzyme digestion mix. These passages support the yield rationale and provide an example of such a protocol, but they do not establish that many widely used protocols include enzymatic digestion or that greater yield is why they do. (LLM, conf=0.84)
hedgedconditional- Asserted: passes — The authors put it forward as true.
- Checkable: passes — It can be checked against evidence.
- Load-bearing: fails — The paper’s conclusions may not depend on it.
- Based: passes — The paper gives a reason why it holds.
Probably not a substantial claim. The paper’s conclusions may not depend on it.
The cited sources support only part of this claim — read each source’s verdict below.
In the paper
“One recent study proposed a modified mechanical method to isolate all CNS cell types and appeared to succeed in significantly increasing neuronal cell yields during dissociation. However, the study lacked biological replicates needed to perform proper analysis of cell-type abundance and reproducibility34.”
§ Dissection of artifactual and confounding glial signatures by single-cell sequencing of mouse and human brain > Discussion
What the sources say
- Partly supportedcites [34] Mattei, D. et al. Enzymatic dissociation induces transcriptional and proteotype bias in brain cell populations. Int. J. Mol. Sci. 21 (2020). sourceExperimental — accuracy not yet measured
The Brain Dissociation and Cell Isolation section describes the mechanical protocol and reports a higher proportion of adult mouse hippocampal neurons than with enzymatic digestion. Our copy does not establish that the cell-type-abundance comparison lacked biological replicates or could not be assessed for reproducibility. It reports four biological replicates per group for a separate proteotype analysis (Figure 3 legend), so that result does not settle the replication claim about cell-type abundance. (LLM, conf=0.85)
hedgeddirect- Asserted: passes — The authors put it forward as true.
- Checkable: passes — It can be checked against evidence.
- Load-bearing: unclear — It is unclear whether the paper’s conclusions depend on it.
- Based: passes — The paper gives a reason why it holds.
It may state two separate claims as one.
- Partly supported
Every source the paper cites for this claim was checked and supports it.
In the paper
“While most studies report very common postmortem factors (for example, age at death, PMI), many variables are often not provided and could have significant impacts, such as RNA integrity number (RIN), which has been shown to confound analyses of dementia-related DEGs77.”
§ Dissection of artifactual and confounding glial signatures by single-cell sequencing of mouse and human brain > Discussion
What the sources say
- Supportedcites [77] Miller, J. A. et al. Neuropathological and transcriptomic characteristics of the aged brain. eLife 6, e31126 (2017). source
The Results section (‘Dementia-related gene expression associated with variation in RNA quality’; page not supplied) reports that omitting RIN adjustment yielded many apparent dementia-related differentially expressed genes, while an analysis matching donors for RIN found very few. It also says only a few earlier studies corrected for RIN. The paper cautions that RIN does not explain all dementia-related expression differences. (LLM, conf=0.91)
hedgeddirect- Asserted: passes — The authors put it forward as true.
- Checkable: passes — It can be checked against evidence.
- Load-bearing: passes — The paper’s conclusions depend on it.
- Based: passes — The paper gives a reason why it holds.
It may state two separate claims as one.
- Supported
Every source the paper cites for this claim was checked and supports it.
In the paper
“The MAST framework uses a two-part generalized linear model to test for DE while controlling for specified covariates.”
§ Dissection of artifactual and confounding glial signatures by single-cell sequencing of mouse and human brain > Methods > Cluster comparison analysis
What the sources say
- Supportedcites [90] Finak, G. et al. MAST: a flexible statistical framework for assessing transcriptional changes and characterizing heterogeneity in single-cell RNA sequencing data. Genome Biol. 16, 278 (2015). source
The Results and discussion section states that MAST models single-cell gene expression with a two-part generalized linear model. The Background section says this framework enables differential gene expression analysis while controlling for covariates in both parts of the model. (LLM, conf=0.94)
plain- Asserted: passes — The authors put it forward as true.
- Checkable: passes — It can be checked against evidence.
- Load-bearing: fails — The paper’s conclusions may not depend on it.
- Based: passes — The paper gives a reason why it holds.
Probably not a substantial claim. The paper’s conclusions may not depend on it.
- Supported
The cited sources support only part of this claim — read each source’s verdict below.
In the paper
“A recent comparative analysis found that pseudobulk analysis methods are among the best-performing methods for differential state analysis and for making sample-level comparisons from single-cell data, and help to overcome some of the inherent sparsity in scRNA-seq data19,89.”
§ Dissection of artifactual and confounding glial signatures by single-cell sequencing of mouse and human brain > Methods > Metacell DE analysis (mouse)
What the sources say
- Partly supportedcites [19] Crowell, H. L. et al. muscat detects subpopulation-specific state transitions from multi-sample multi-condition single-cell transcriptomics data. Nat. Commun. 11, 6077 (2020). sourceExperimental — accuracy not yet measured
The Discussion (page not provided) says aggregation methods were fast and performed among the best in the paper’s differential-state comparison. The Methods describe pseudobulk data assembled by subpopulation and sample for sample-level inference. Although the Results describe the starting single-cell expression matrix as sparse, our copy does not state that pseudobulk analysis helps overcome that sparsity. (LLM, conf=0.86)
- Partly supportedcites [89] Lun, A. T., Bach, K. & Marioni, J. C. Pooling across cells to normalize single-cell RNA sequencing data with many zero counts. Genome Biol. 17, 75 (2016). sourceExperimental — accuracy not yet measured
The Background says pooling counts across cells reduces problematic zeroes, supporting the sparsity point. But the paper evaluates pooled-count normalization and deconvolution, not pseudobulk methods for differential state analysis or sample-level comparisons; it does not establish that those methods are among the best-performing. (LLM, conf=0.86)
plaindirect- Asserted: passes — The authors put it forward as true.
- Checkable: passes — It can be checked against evidence.
- Load-bearing: passes — The paper’s conclusions depend on it.
- Based: passes — The paper gives a reason why it holds.
Probably not a substantial claim. It may state two separate claims as one.
- Partly supported
The cited sources that could be checked couldn’t confirm or dispute this claim.
In the paper
“No explicit statistical methods were used to predetermine sample sizes but our sample sizes exceed those reported in previous publications32,34,43.”
§ Dissection of artifactual and confounding glial signatures by single-cell sequencing of mouse and human brain > Methods > Statistics
What the sources say
- Not checked — no full text of the sourcecites [32] Wu, Y. E., Pan, L., Zuo, Y., Li, X. & Hong, W. Detecting activated cell populations using single-cell RNA-seq. Neuron 96, 313–329.e6 (2017). source
- Could not verifycites [34] Mattei, D. et al. Enzymatic dissociation induces transcriptional and proteotype bias in brain cell populations. Int. J. Mol. Sci. 21 (2020). sourceExperimental — accuracy not yet measured
The cited paper’s Introduction discusses previously published datasets, and its methods describe cell numbers and statistical analyses, but neither section compares its sample sizes with those of previous publications. The statement about not predetermining sample sizes refers to the citing authors’ own study, not to this source. Searches for sample-size comparisons and power analysis found no passage establishing the attributed comparison. (LLM, conf=0.72)
- Not checked — no full text of the sourcecites [43] Van Hove, H. et al. A single-cell atlas of mouse brain macrophages reveals unique transcriptional identities shaped by ontogeny and tissue environment. Nat. Neurosci. 22, 1021–1035 (2019). source
plain- Asserted: passes — The authors put it forward as true.
- Checkable: passes — It can be checked against evidence.
- Load-bearing: fails — The paper’s conclusions may not depend on it.
- Based: passes — The paper gives a reason why it holds.
Probably not a substantial claim. The paper’s conclusions may not depend on it. It may state two separate claims as one.
Every source the paper cites for this claim was checked and supports it.
In the paper
“The advent of snRNA-seq has unlocked the ability to unbiasedly assess transcriptional states of the human brain at single-cell resolution10,11.”
§ Dissection of artifactual and confounding glial signatures by single-cell sequencing of mouse and human brain > Discussion
What the sources say
- Supportedcites [10] Lake, B. B. et al. Neuronal subtypes and diversity revealed by single-nucleus RNA sequencing of the human brain. Science 352, 1586–1590 (2016). source
The Main Text describes single-neuron expression profiles as a way to gain unbiased insights into subtypes and reports a scalable pipeline for analyzing nuclear transcriptomes from post-mortem human brain. The study demonstrates that capability for neuronal nuclei sampled from six cortical regions, rather than surveying every cell type or region of the brain. (LLM, conf=0.88)
- Supportedcites [11] Habib, N. et al. Massively parallel single-nucleus RNA-seq with DroNc-seq. Nat. Methods 14, 955–958 (2017). source
The Abstract reports profiling individual nuclei from archived human brain tissue and describes unbiased classification of cell types. Its discussion of human samples reports cell-type-specific expression signatures and pathways, supporting assessment of transcriptional states at single-nucleus resolution. (LLM, conf=0.88)
plaindirect- Asserted: passes — The authors put it forward as true.
- Checkable: passes — It can be checked against evidence.
- Load-bearing: passes — The paper’s conclusions depend on it.
- Based: passes — The paper gives a reason why it holds.
Probably not a substantial claim.
- Supported
The sources with a verdict support this claim; the rest weren’t checked yet, have no full text we could read, or their verdicts aren’t rated yet.
In the paper
“Due to the issues mentioned above with statistical analysis performed between clusters using the same data used to generate clustering24,25, we did not employ any statistical cutoff or use these lists in any downstream module scoring or analysis.”
§ Dissection of artifactual and confounding glial signatures by single-cell sequencing of mouse and human brain > Methods > Cluster comparison analysis
What the sources say
- Not checked — no full text of the sourcecites [24] Gao, L. L., Bien, J. & Witten, D. Selective Inference for Hierarchical Clustering. Preprint at https://arxiv.org/abs/2012.02936 (2020). source
- Supportedcites [25] Lähnemann, D. et al. Eleven grand challenges in single-cell data science. Genome Biol. 21, 31 (2020). source
Challenge II, under Status (page unavailable), identifies the problem of using the same data for clustering and differential testing between the resulting clusters. The decision not to apply a statistical cutoff or use the lists downstream is the citing authors’ own methodological choice, not a claim attributed to this source. (LLM, conf=0.93)
plaindirect- Asserted: passes — The authors put it forward as true.
- Checkable: passes — It can be checked against evidence.
- Load-bearing: fails — The paper’s conclusions may not depend on it.
- Based: passes — The paper gives a reason why it holds.
Probably not a substantial claim. The paper’s conclusions may not depend on it. It may state two separate claims as one.
A result the paper reports from its own data — it cites no other source for it, so there is none to check. The quote shows it is in the paper.
In the paper
“To address this issue, we present a rigorously validated protocol that preserves both in vivo transcriptional profiles and cell-type diversity and yield across tissue types and species.”
§ Dissection of artifactual and confounding glial signatures by single-cell sequencing of mouse and human brain > Abstract
boosteddirect- Asserted: passes — The authors put it forward as true.
- Checkable: passes — It can be checked against evidence.
- Load-bearing: passes — The paper’s conclusions depend on it.
- Based: passes — The paper gives a reason why it holds.
It may state two separate claims as one.
A result the paper reports from its own data — it cites no other source for it, so there is none to check. The quote shows it is in the paper.
In the paper
“Comparison of our consensus exAM gene list with those studies yielded overlap of 16 and 11 genes, respectively (Supplementary Table 21b,c).”
§ Dissection of artifactual and confounding glial signatures by single-cell sequencing of mouse and human brain > Results > Artifactual signature is shared by other immune populations and tissues
plaincorrelational- Asserted: passes — The authors put it forward as true.
- Checkable: passes — It can be checked against evidence.
- Load-bearing: passes — The paper’s conclusions depend on it.
- Based: passes — The paper gives a reason why it holds.
It may state two separate claims as one.
A result the paper reports from its own data — it cites no other source for it, so there is none to check. The quote shows it is in the paper.
In the paper
“The Metacell DEGs exhibited significant overlap with the previously identified DEG list from the microglia-only analysis, confirming that enzymatic digestion, not FACS, was the key factor in the induction of this aberrant response.”
§ Dissection of artifactual and confounding glial signatures by single-cell sequencing of mouse and human brain > Results > Mouse microglia are especially sensitive to ex vivo alterations in gene expression compared with other CNS cell types
boosteddirect- Asserted: passes — The authors put it forward as true.
- Checkable: passes — It can be checked against evidence.
- Load-bearing: passes — The paper’s conclusions depend on it.
- Based: passes — The paper gives a reason why it holds.
It may state two separate claims as one.
A result the paper reports from its own data — it cites no other source for it, so there is none to check. The quote shows it is in the paper.
In the paper
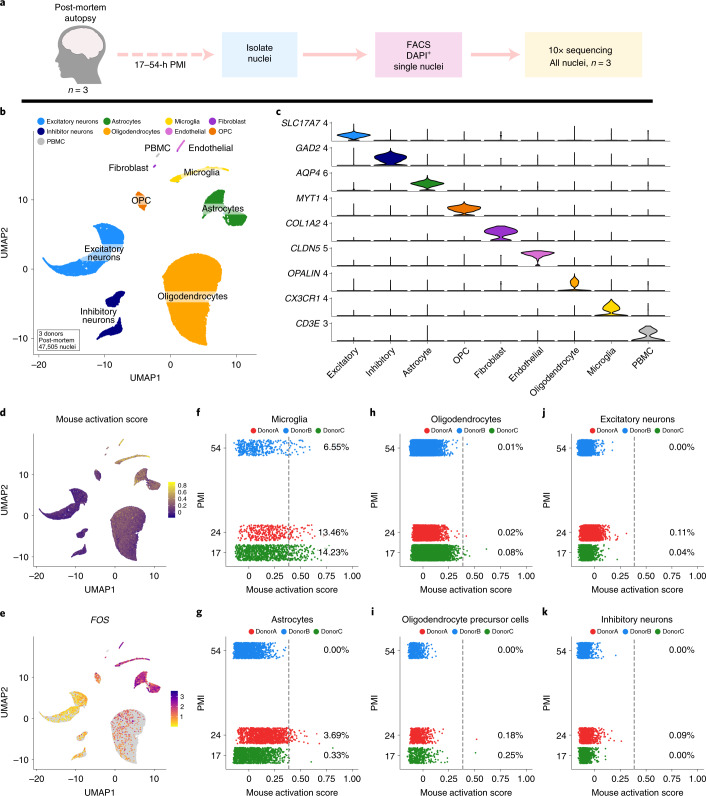
“Similar to mice, human postmortem microglia exhibited significant enrichment of this signature, as did a small number of astrocytes (Fig. 3d,e).”
§ Dissection of artifactual and confounding glial signatures by single-cell sequencing of mouse and human brain > Results > Analysis of human postmortem snRNA-seq identifies similar gene signatures in both microglia and astrocytes
plaincorrelational- Asserted: passes — The authors put it forward as true.
- Checkable: passes — It can be checked against evidence.
- Load-bearing: passes — The paper’s conclusions depend on it.
- Based: passes — The paper gives a reason why it holds.
It may state two separate claims as one.
A result the paper reports from its own data — it cites no other source for it, so there is none to check. The quote shows it is in the paper.
In the paper
“We found that ENZ-NONE samples exhibited a significant decrease in the proportion of cells in the homeostatic cluster and a concomitant increase in proportion of cells in the exAM cluster (*false discovery rate (FDR) ≤ 0.004; ENZ-NONE versus all other groups; Methods) (Fig. 1e and Supplementary Table 3).”
§ Dissection of artifactual and confounding glial signatures by single-cell sequencing of mouse and human brain > Results > scRNA-seq reveals that mouse microglia are highly sensitive to ex vivo alterations
plaincorrelational- Asserted: passes — The authors put it forward as true.
- Checkable: passes — It can be checked against evidence.
- Load-bearing: passes — The paper’s conclusions depend on it.
- Based: passes — The paper gives a reason why it holds.
It may state two separate claims as one.
A result the paper reports from its own data — it cites no other source for it, so there is none to check. The quote shows it is in the paper.
In the paper
“Analysis of Dounce without inhibitors (DNC-NONE) versus Dounce with inhibitors (DNC-INHIB) groups found no significant DEGs between the groups (Supplementary Tables 9 and 12), indicating that the use of inhibitors in current scRNA-seq pipeline(s) appears to have negligible adverse effect on gene expression.”
§ Dissection of artifactual and confounding glial signatures by single-cell sequencing of mouse and human brain > Results > scRNA-seq reveals that mouse microglia are highly sensitive to ex vivo alterations
hedged- Asserted: passes — The authors put it forward as true.
- Checkable: passes — It can be checked against evidence.
- Load-bearing: passes — The paper’s conclusions depend on it.
- Based: passes — The paper gives a reason why it holds.
It may state two separate claims as one.
A result the paper reports from its own data — it cites no other source for it, so there is none to check. The quote shows it is in the paper.
In the paper
“This analysis demonstrated that microglia and some astrocytes exhibited the greatest enrichment of human orthologs of the mouse signature genes and that the percentage of nuclei above threshold per sample was both highly variable and did not correlate with PMI (Fig. 3f–k).”
§ Dissection of artifactual and confounding glial signatures by single-cell sequencing of mouse and human brain > Results > Analysis of human postmortem snRNA-seq identifies similar gene signatures in both microglia and astrocytes
boosted- Asserted: passes — The authors put it forward as true.
- Checkable: passes — It can be checked against evidence.
- Load-bearing: passes — The paper’s conclusions depend on it.
- Based: passes — The paper gives a reason why it holds.
It may state two separate claims as one.
A result the paper reports from its own data — it cites no other source for it, so there is none to check. The quote shows it is in the paper.
In the paper
“characterized by expression of several immediate early genes (IEGs) (for example, Fos, Jun), stress-induced (Hspa1a, Dusp1) and immune-signaling genes (Ccl3, Ccl4)”
§ Dissection of artifactual and confounding glial signatures by single-cell sequencing of mouse and human brain > Results > scRNA-seq reveals that mouse microglia are highly sensitive to ex vivo alterations
plaincorrelational- Asserted: passes — The authors put it forward as true.
- Checkable: passes — It can be checked against evidence.
- Load-bearing: passes — The paper’s conclusions depend on it.
- Based: passes — The paper gives a reason why it holds.
It may state two separate claims as one.
A result the paper reports from its own data — it cites no other source for it, so there is none to check. The quote shows it is in the paper.
In the paper
“We found a significant enrichment of the iNMF microglial factor at the 6-h timepoint compared with the 0-h timepoint (P < 3.2 × 10−215) (Fig. 4d–f), corresponding to 31 of 38 genes from the factor being significantly different (Fig. 4g and Supplementary Table 23).”
§ Dissection of artifactual and confounding glial signatures by single-cell sequencing of mouse and human brain > Results > Freezing delay of acutely isolated human tissue is sufficient to induce similar microglial but not astrocyte gene signatures
plaincorrelational- Asserted: passes — The authors put it forward as true.
- Checkable: passes — It can be checked against evidence.
- Load-bearing: passes — The paper’s conclusions depend on it.
- Based: passes — The paper gives a reason why it holds.
It may state two separate claims as one.
In the paper
“In line with previous work on the response of CNS cells to stress35, we found that induction of this ex vivo signature occurred only in microglia and other brain-associated myeloid cells, but, while not significant, we found that other cell types may show initial signs of this response, which could become significant under different conditions.”
§ Dissection of artifactual and confounding glial signatures by single-cell sequencing of mouse and human brain > Discussion
What the sources say
- Not checked — no full text of the sourcecites [35] Satoh, J. & Kim, S. U. HSP72 induction by heat stress in human neurons and glial cells in culture. Brain Res. 653, 243–250 (1994). source
hedged- Asserted: passes — The authors put it forward as true.
- Checkable: passes — It can be checked against evidence.
- Load-bearing: passes — The paper’s conclusions depend on it.
- Based: passes — The paper gives a reason why it holds.
It may state two separate claims as one.
The paper states this without a source or data behind it here, so there is nothing to check it against. The quote shows it is in the paper.
In the paper
“The other major drawback to our mechanical dissociation protocol is that while it purifies microglia, the combination of the tight pestle during the Dounce process and Percoll centrifugation leads to depletion of the majority of other CNS cell types.”
§ Dissection of artifactual and confounding glial signatures by single-cell sequencing of mouse and human brain > Discussion
plaindirect- Asserted: passes — The authors put it forward as true.
- Checkable: passes — It can be checked against evidence.
- Load-bearing: passes — The paper’s conclusions depend on it.
- Based: passes — The paper gives a reason why it holds.
It may state two separate claims as one.
None of the sources cited for this claim have been checked yet.
In the paper
“We also confirm, through reanalysis of the CNS literature, that induction of this aberrant ex vivo response is extremely widespread, and not specific to the enzyme, sequencing technology or specifics of the isolation/tissue processing protocol, and some of the signature appears to be inducible even just by the presence of prolonged room-temperature steps during otherwise favorable mechanical dis”
§ Dissection of artifactual and confounding glial signatures by single-cell sequencing of mouse and human brain > Discussion
hedgeddirect- Asserted: passes — The authors put it forward as true.
- Checkable: passes — It can be checked against evidence.
- Load-bearing: passes — The paper’s conclusions depend on it.
- Based: passes — The paper gives a reason why it holds.
It may state two separate claims as one.
A result the paper reports from its own data — it cites no other source for it, so there is none to check. The quote shows it is in the paper.
In the paper
“While signatures in postmortem microglia and astrocytes correlated with age across the entire dataset, the correlation was not robust across post hoc subgroup comparisons.”
§ Dissection of artifactual and confounding glial signatures by single-cell sequencing of mouse and human brain > Discussion
plaincorrelational- Asserted: passes — The authors put it forward as true.
- Checkable: passes — It can be checked against evidence.
- Load-bearing: passes — The paper’s conclusions depend on it.
- Based: passes — The paper gives a reason why it holds.
It may state two separate claims as one.
A result the paper reports from its own data — it cites no other source for it, so there is none to check. The quote shows it is in the paper.
In the paper
“This human signature was highly variable across donors and was not correlated with PMI or most other available postmortem meta variables.”
§ Dissection of artifactual and confounding glial signatures by single-cell sequencing of mouse and human brain > Discussion
plain- Asserted: passes — The authors put it forward as true.
- Checkable: passes — It can be checked against evidence.
- Load-bearing: passes — The paper’s conclusions depend on it.
- Based: passes — The paper gives a reason why it holds.
It may state two separate claims as one.
In the paper
“These results are in agreement with previous in vitro work which found that microglial reaction to heat stress was significantly faster than for other CNS cell types35, although that does not preclude such artifacts being present in other cell types, depending on the details of cell isolation33.”
§ Dissection of artifactual and confounding glial signatures by single-cell sequencing of mouse and human brain > Results > Mouse microglia are especially sensitive to ex vivo alterations in gene expression compared with other CNS cell types
What the sources say
- Not checked — no full text of the sourcecites [35] Satoh, J. & Kim, S. U. HSP72 induction by heat stress in human neurons and glial cells in culture. Brain Res. 653, 243–250 (1994). source
plaincorrelational- Asserted: passes — The authors put it forward as true.
- Checkable: passes — It can be checked against evidence.
- Load-bearing: fails — The paper’s conclusions may not depend on it.
- Based: passes — The paper gives a reason why it holds.
Probably not a substantial claim. The paper’s conclusions may not depend on it.
A conclusion the paper draws from its own results — it cites no other source for it, so there is none to check. The quote shows it is in the paper.
In the paper
“Our reanalyses demonstrate that induction of the exAM signature can occur differentially across experimental conditions and may impact downstream analyses.”
§ Dissection of artifactual and confounding glial signatures by single-cell sequencing of mouse and human brain > Results > Presence of artifactual microglia signature is common across multiple experimental parameters
boostedconditionaln = 2- Asserted: passes — The authors put it forward as true.
- Checkable: passes — It can be checked against evidence.
- Load-bearing: passes — The paper’s conclusions depend on it.
- Based: passes — The paper gives a reason why it holds.
It may state two separate claims as one.
The paper states this without a source or data behind it here, so there is nothing to check it against. The quote shows it is in the paper.
In the paper
“However, these biological discoveries rest on single-cell technologies being able to faithfully measure cell-type-specific expression patterns ex vivo.”
§ Dissection of artifactual and confounding glial signatures by single-cell sequencing of mouse and human brain > Discussion
plaindirect- Asserted: passes — The authors put it forward as true.
- Checkable: passes — It can be checked against evidence.
- Load-bearing: passes — The paper’s conclusions depend on it.
- Based: fails — The paper may give no reason why it holds.
Probably not a substantial claim. The paper may give no reason why it holds.
What the paper did — it cites no source for this, so there is none to check. The quote shows it is in the paper.
In the paper
“CX3CR1 was excluded as a parameter used for cell sorting due to differences in staining between isolation methods as the result of cleavage of extracellular epitopes by enzymes (Supplementary Fig. 1d,e).”
§ Dissection of artifactual and confounding glial signatures by single-cell sequencing of mouse and human brain > Methods > FACS
plaindirect- Asserted: passes — The authors put it forward as true.
- Checkable: passes — It can be checked against evidence.
- Load-bearing: fails — The paper’s conclusions may not depend on it.
- Based: passes — The paper gives a reason why it holds.
Probably not a substantial claim. The paper’s conclusions may not depend on it.
A conclusion the paper draws from its own results — it cites no other source for it, so there is none to check. The quote shows it is in the paper.
In the paper
“We also demonstrate how lack of widespread understanding of this signature both in the CNS and periphery has resulted in the pervasiveness of this signature in the current literature and can confound interpretations of results and conclusions of such studies.”
§ Dissection of artifactual and confounding glial signatures by single-cell sequencing of mouse and human brain > Discussion
boosteddirect- Asserted: passes — The authors put it forward as true.
- Checkable: unclear — It is unclear whether it could be checked against evidence.
- Load-bearing: passes — The paper’s conclusions depend on it.
- Based: passes — The paper gives a reason why it holds.
It may state two separate claims as one.
- Rests on an assumption: The majority of studies have utilized enzymatic dissociation to study all CNS populations at single-cell resolution.
A conclusion the paper draws from its own results — it cites no other source for it, so there is none to check. The quote shows it is in the paper.
In the paper
“It is also critical to note that acute premortem factors such as these are not ‘artificial’ as they reflect the true biology associated with agonal state, medication, comorbidities, cause of death and so on, but nonetheless these signatures do confound the ability to perform analysis between desired experimental variables/groups (for example, disease status, cognitive function and so on) when not”
§ Dissection of artifactual and confounding glial signatures by single-cell sequencing of mouse and human brain > Discussion
plainconditional- Asserted: passes — The authors put it forward as true.
- Checkable: passes — It can be checked against evidence.
- Load-bearing: passes — The paper’s conclusions depend on it.
- Based: passes — The paper gives a reason why it holds.
It may state two separate claims as one.
What the paper did — it cites no source for this, so there is none to check. The quote shows it is in the paper.
In the paper
“Consequently, the sample was transferred between room temperature and ice twice for a total time at room temperature of approximately 20 min (Supplementary Note 2).”
§ Dissection of artifactual and confounding glial signatures by single-cell sequencing of mouse and human brain > Methods > FACS
plainSingle case- Asserted: passes — The authors put it forward as true.
- Checkable: passes — It can be checked against evidence.
- Load-bearing: fails — The paper’s conclusions may not depend on it.
- Based: passes — The paper gives a reason why it holds.
Probably not a substantial claim. The paper’s conclusions may not depend on it. It may state two separate claims as one.
A conclusion the paper draws from its own results — it cites no other source for it, so there is none to check. The quote shows it is in the paper.
In the paper
“In conclusion, we provide a method by which to eliminate ex vivo transcriptional activation during enzymatic digestion that is easy to implement, is functional across different tissue types and species, and therefore should require minimal effort to incorporate into existing protocols.”
§ Dissection of artifactual and confounding glial signatures by single-cell sequencing of mouse and human brain > Discussion
plaindirect- Asserted: passes — The authors put it forward as true.
- Checkable: passes — It can be checked against evidence.
- Load-bearing: passes — The paper’s conclusions depend on it.
- Based: passes — The paper gives a reason why it holds.
It may state two separate claims as one.
In the paper
“Most currently available human snRNA-seq datasets are limited by both the proportion of microglia per sample81 and the dramatically lower sensitivity of earlier single-cell chemistries/nuclei isolation protocols (Supplementary Note 6).”
§ Dissection of artifactual and confounding glial signatures by single-cell sequencing of mouse and human brain > Discussion
What the sources say
- Not checked — no full text of the sourcecites [81] Liddelow, S. A., Marsh, S. E. & Stevens, B. Microglia and astrocytes in disease: dynamic duo or partners in crime? Trends Immunol. 41, 820–835 (2020). source
plaindirect- Asserted: passes — The authors put it forward as true.
- Checkable: passes — It can be checked against evidence.
- Load-bearing: passes — The paper’s conclusions depend on it.
- Based: passes — The paper gives a reason why it holds.
It may state two separate claims as one.
What the paper did — it cites no source for this, so there is none to check. The quote shows it is in the paper.
In the paper
“All sample processing was performed in random order.”
- Also stated in: § Postmortem human brain · plain
“All sample processing was performed in random order.”
- Also stated in: § Human PBMCs · plain
“All sample processing was performed in random order.”
§ Dissection of artifactual and confounding glial signatures by single-cell sequencing of mouse and human brain > Methods > Acute human tissue
plain- Asserted: passes — The authors put it forward as true.
- Checkable: passes — It can be checked against evidence.
- Load-bearing: passes — The paper’s conclusions depend on it.
- Based: passes — The paper gives a reason why it holds.
Probably not a substantial claim. The quote only partly states this claim.
- Also stated in: § Postmortem human brain · plain
What the paper did — it cites no source for this, so there is none to check. The quote shows it is in the paper.
In the paper
“We intentionally set a liberal gate of any CD11b+/CD45+ cells so as not to bias our scRNA-seq due to changes in cell-surface receptor expression (Supplementary Fig. 1b,c).”
§ Dissection of artifactual and confounding glial signatures by single-cell sequencing of mouse and human brain > Methods > FACS
plaindirect- Asserted: passes — The authors put it forward as true.
- Checkable: passes — It can be checked against evidence.
- Load-bearing: passes — The paper’s conclusions depend on it.
- Based: passes — The paper gives a reason why it holds.
Probably not a substantial claim.
What the paper did — it cites no source for this, so there is none to check. The quote shows it is in the paper.
In the paper
“All sample processing was performed in alternating order by experimental group.”
§ Dissection of artifactual and confounding glial signatures by single-cell sequencing of mouse and human brain > Methods > Animals
plain- Asserted: passes — The authors put it forward as true.
- Checkable: passes — It can be checked against evidence.
- Load-bearing: fails — The paper’s conclusions may not depend on it.
- Based: passes — The paper gives a reason why it holds.
Probably not a substantial claim. The paper’s conclusions may not depend on it.
What the paper did — it cites no source for this, so there is none to check. The quote shows it is in the paper.
In the paper
“smFISH experiments and imaging were performed blind.”
§ Dissection of artifactual and confounding glial signatures by single-cell sequencing of mouse and human brain > Methods > Statistics
plain- Asserted: passes — The authors put it forward as true.
- Checkable: passes — It can be checked against evidence.
- Load-bearing: fails — The paper’s conclusions may not depend on it.
- Based: passes — The paper gives a reason why it holds.
Probably not a substantial claim. The paper’s conclusions may not depend on it.
What the paper did — it cites no source for this, so there is none to check. The quote shows it is in the paper.
In the paper
“Experimental collection and processing of samples were not performed blind due to the conditions of the experiment.”
§ Dissection of artifactual and confounding glial signatures by single-cell sequencing of mouse and human brain > Methods > Statistics
plain- Asserted: passes — The authors put it forward as true.
- Checkable: passes — It can be checked against evidence.
- Load-bearing: fails — The paper’s conclusions may not depend on it.
- Based: passes — The paper gives a reason why it holds.
Probably not a substantial claim. The paper’s conclusions may not depend on it.
What the paper did — it cites no source for this, so there is none to check. The quote shows it is in the paper.
In the paper
“Datasets were additionally quality controlled at this step by checking for and removing doublets on the basis of dual cell-type marker gene expression.”
§ Dissection of artifactual and confounding glial signatures by single-cell sequencing of mouse and human brain > Methods > Initial quality control and clustering (mouse datasets)
plaindirect- Asserted: passes — The authors put it forward as true.
- Checkable: passes — It can be checked against evidence.
- Load-bearing: passes — The paper’s conclusions depend on it.
- Based: passes — The paper gives a reason why it holds.
Probably not a substantial claim.
What the paper did — it cites no source for this, so there is none to check. The quote shows it is in the paper.
In the paper
“We then downsampled each dataset so that all of the major cell classes had the same number of cells, so that cell number/proportion did not influence outlier detection.”
§ Dissection of artifactual and confounding glial signatures by single-cell sequencing of mouse and human brain > Methods > Gene module score thresholding (human postmortem)
plain- Asserted: passes — The authors put it forward as true.
- Checkable: passes — It can be checked against evidence.
- Load-bearing: passes — The paper’s conclusions depend on it.
- Based: passes — The paper gives a reason why it holds.
Probably not a substantial claim.
What the paper did — it cites no source for this, so there is none to check. The quote shows it is in the paper.
In the paper
“scRNA-seq/snRNA-seq were not performed blind but using automated and appropriate field standard analysis techniques that require metadata to be present.”
§ Dissection of artifactual and confounding glial signatures by single-cell sequencing of mouse and human brain > Methods > Statistics
plain- Asserted: passes — The authors put it forward as true.
- Checkable: passes — It can be checked against evidence.
- Load-bearing: fails — The paper’s conclusions may not depend on it.
- Based: passes — The paper gives a reason why it holds.
Probably not a substantial claim. The paper’s conclusions may not depend on it.
What the paper did — it cites no source for this, so there is none to check. The quote shows it is in the paper.
In the paper
“Some datasets required additional rounds of analysis and subclustering to completely remove likely doublet nuclei that were not found during the first round.”
§ Dissection of artifactual and confounding glial signatures by single-cell sequencing of mouse and human brain > Methods > Doublet/low-quality nuclei filtering (human datasets)
plain- Asserted: passes — The authors put it forward as true.
- Checkable: passes — It can be checked against evidence.
- Load-bearing: fails — The paper’s conclusions may not depend on it.
- Based: passes — The paper gives a reason why it holds.
Probably not a substantial claim. The paper’s conclusions may not depend on it.
What the paper did — it cites no source for this, so there is none to check. The quote shows it is in the paper.
In the paper
“The only datapoints that were excluded from this analysis were those cells defined as low-quality (see above scRNA-seq/snRNA-seq analyses sections and GitHub code repository) or those that were defined as doublets using manual annotation of doublet cells by the experimenter”
§ Dissection of artifactual and confounding glial signatures by single-cell sequencing of mouse and human brain > Methods > Statistics
plain- Asserted: passes — The authors put it forward as true.
- Checkable: passes — It can be checked against evidence.
- Load-bearing: fails — The paper’s conclusions may not depend on it.
- Based: passes — The paper gives a reason why it holds.
Probably not a substantial claim. The paper’s conclusions may not depend on it.
What the paper did — it cites no source for this, so there is none to check. The quote shows it is in the paper.
In the paper
“To detect and filter doublets and/or low-quality cells in snRNA-seq datasets, we performed iterative rounds of clustering using LIGER.”
§ Dissection of artifactual and confounding glial signatures by single-cell sequencing of mouse and human brain > Methods > Doublet/low-quality nuclei filtering (human datasets)
plaindirect- Asserted: passes — The authors put it forward as true.
- Checkable: passes — It can be checked against evidence.
- Load-bearing: passes — The paper’s conclusions depend on it.
- Based: passes — The paper gives a reason why it holds.
Probably not a substantial claim.
What the paper did — it cites no source for this, so there is none to check. The quote shows it is in the paper.
In the paper
“For the datasets in Supplementary Fig. 9 that were composed of different genotypes or treatments, only cells from WT or control mice were included in downstream analysis.”
§ Dissection of artifactual and confounding glial signatures by single-cell sequencing of mouse and human brain > Methods > Reanalysis of publicly available datasets (mouse myeloid/microglia)
plain- Asserted: passes — The authors put it forward as true.
- Checkable: passes — It can be checked against evidence.
- Load-bearing: passes — The paper’s conclusions depend on it.
- Based: passes — The paper gives a reason why it holds.
Probably not a substantial claim.
What the paper did — it cites no source for this, so there is none to check. The quote shows it is in the paper.
In the paper
“To enhance confidence in subclustering analysis, only cell classes with greater than 80 cells per replicate (>300 cells total) were considered for subclustering.”
§ Dissection of artifactual and confounding glial signatures by single-cell sequencing of mouse and human brain > Methods > Subclustering (mouse)
plaindirect- Asserted: passes — The authors put it forward as true.
- Checkable: passes — It can be checked against evidence.
- Load-bearing: passes — The paper’s conclusions depend on it.
- Based: passes — The paper gives a reason why it holds.
Probably not a substantial claim.
What the paper did — it cites no source for this, so there is none to check. The quote shows it is in the paper.
In the paper
“All datasets were then further subclustered to manually examine and remove any remaining doublets.”
§ Dissection of artifactual and confounding glial signatures by single-cell sequencing of mouse and human brain > Methods > Reanalysis of publicly available datasets (mouse myeloid/microglia)
plain- Asserted: passes — The authors put it forward as true.
- Checkable: passes — It can be checked against evidence.
- Load-bearing: passes — The paper’s conclusions depend on it.
- Based: passes — The paper gives a reason why it holds.
Probably not a substantial claim.
What the paper did — it cites no source for this, so there is none to check. The quote shows it is in the paper.
In the paper
“All filtering was performed using field standard techniques as described in the analysis subsections above.”
§ Dissection of artifactual and confounding glial signatures by single-cell sequencing of mouse and human brain > Methods > Statistics
plain- Asserted: passes — The authors put it forward as true.
- Checkable: passes — It can be checked against evidence.
- Load-bearing: fails — The paper’s conclusions may not depend on it.
- Based: passes — The paper gives a reason why it holds.
Probably not a substantial claim. The paper’s conclusions may not depend on it.
What the paper did — it cites no source for this, so there is none to check. The quote shows it is in the paper.
In the paper
“Doublet identification was then performed using a combination of marker gene expression and shared LIGER ‘factors’ to identify nuclei that expressed markers or combinations of markers that are exclusive to two different cell classes.”
§ Dissection of artifactual and confounding glial signatures by single-cell sequencing of mouse and human brain > Methods > Doublet/low-quality nuclei filtering (human datasets)
plain- Asserted: passes — The authors put it forward as true.
- Checkable: passes — It can be checked against evidence.
- Load-bearing: passes — The paper’s conclusions depend on it.
- Based: passes — The paper gives a reason why it holds.
Probably not a substantial claim.
The paper relies on this without support.
No prior study has examined the human brain for cell-type-specific differences in transcriptional states using snRNA-seq.
“and to our knowledge none have done so in a cell-type-specific manner using snRNA-seq”
The paper relies on this without support.
The majority of studies have utilized enzymatic dissociation to study all CNS populations at single-cell resolution.
“Consequently, the majority of studies have utilized enzymatic dissociation to study all CNS populations at single-cell resolution.”
Claims other papers make about this one
Each is checked against this paper’s own text: does it say what the citing paper says it does?
The source backs part of the claim, not all of it — or backs it for a different population, condition or comparison.
In the citing paper
“For example, conventional cell dissociation protocols often compromise the integrity of neurons through mechanical shearing or induce the activation of glia[6, 8–12].”
From Comparative analysis of nuclei isolation methods for brain single-nucleus RNA sequencing (2026) · cites this paper as [10]
Experimental — accuracy not yet measuredThe source backs part of the claim, not all of it — or backs it for a different population, condition or comparison.
In the citing paper
“Notably, all three methods typically involve enzymatic digestion, which can potentially activate certain cell types, introducing a common source of potential bias[10].”
From Comparative analysis of nuclei isolation methods for brain single-nucleus RNA sequencing (2026) · cites this paper as [10]
Experimental — accuracy not yet measuredThe source backs part of the claim, not all of it — or backs it for a different population, condition or comparison.
In the citing paper
“Many cell types, such as microglia, are especially sensitive to dissociation-induced activation, which is a known challenge in single-cell studies[9, 10].”
From Comparative analysis of nuclei isolation methods for brain single-nucleus RNA sequencing (2026) · cites this paper as [10]
Experimental — accuracy not yet measuredThe source backs part of the claim, not all of it — or backs it for a different population, condition or comparison.
In the citing paper
“Note that 5 μM ActD was kept during collection and enzymatic dissociation of the tissue to preserve transcriptional state and prevent artificial induction stress-response genes during tissue dissociation (Marsh et al, 2022; Perocchi et al, 2007).”
From APOE from astrocytes restores Alzheimer’s Aβ-pathology and DAM-like responses in APOE deficient microglia (2024) · cites this paper as Marsh et al, 2022
Experimental — accuracy not yet measuredThe cited source says what the claim attributes to it.
In the citing paper
“Potential ex vivo activation was inhibited as described in a previous study25 (Supplementary Fig. 7c).”
From Blockade of STING Activation Alleviates Microglial Dysfunction and a Broad Spectrum of Alzheimer's Disease Pathologies (2024) · cites this paper as [25]
The cited source says what the claim attributes to it.
In the citing paper
“the interferon-responsive microglial state has been steadily reported, and this state is not an artifact of ex vivo activation25.”
From Blockade of STING Activation Alleviates Microglial Dysfunction and a Broad Spectrum of Alzheimer's Disease Pathologies (2024) · cites this paper as [25]
The check wasn’t confident either way, so it gives no verdict — never disputed.
In the citing paper
“Multiple approaches have highlighted inositol polyphosphate-5-phosphatase D (INPP5D) as an AD risk gene, and its expression in the brain is restricted to microglia.4–6”
From Microglial INPP5D limits plaque formation and glial reactivity in the PSAPP mouse model of Alzheimer's disease (2023) · cites this paper as [6]
Experimental — accuracy not yet measuredThe check wasn’t confident either way, so it gives no verdict — never disputed.
In the citing paper
“Multiple approaches have highlighted inositol polyphosphate-5-phosphatase D (INPP5D) as an AD risk gene, and its expression in the brain is restricted to microglia.4–6”
From Microglial INPP5D limits plaque formation and glial reactivity in the PSAPP mouse model of Alzheimer's disease (2023) · cites this paper as [6]
Experimental — accuracy not yet measuredIn the citing paper
“Perfusion buffer, dissection buffer and digestion buffer were freshly prepared as previously described (Marsh et al., 2022).”
From Mild respiratory COVID can cause multi-lineage neural cell and myelin dysregulation (2022) · cites this paper as Marsh et al., 2022
Citations
Cites
Moderated estimation of fold change and dispersion for RNA-seq data with DESeq2
Love, M. I., Huber, W., & Anders, S. (2014) · Genome Biology · doi:10.1186/s13059-014-0550-8 · Cited by 95,106
Integrated analysis of multimodal single-cell data
Hao, Y., Hao, S., Andersen-Nissen, E., Mauck, W. M., Zheng, S., Butler, A., Lee, M. J., Wilk, A. J., Darby, C., Zagar, M., et al. (2020) · doi:10.1101/2020.10.12.335331 · Cited by 15,508
Comprehensive Integration of Single-Cell Data
Stuart, T., Butler, A., Hoffman, P., Hafemeister, C., Papalexi, E., Mauck, W. M., Hao, Y., Stoeckius, M., Smibert, P., & Satija, R. (2019) · Cell · doi:10.1016/j.cell.2019.05.031 · Cited by 15,453
Integrating single-cell transcriptomic data across different conditions, technologies, and species
Butler, A., Hoffman, P., Smibert, P., Papalexi, E., & Satija, R. (2018) · Nature Biotechnology · doi:10.1038/nbt.4096 · Cited by 13,174
A Unique Microglia Type Associated with Restricting Development of Alzheimer’s Disease
Keren-Shaul, H., Spinrad, A., Weiner, A., Matcovitch-Natan, O., Dvir-Szternfeld, R., Ulland, T. K., David, E., Baruch, K., Lara-Astaiso, D., Toth, B., et al. (2017) · Cell · doi:10.1016/j.cell.2017.05.018 · Cited by 5,493
Dissecting the multicellular ecosystem of metastatic melanoma by single-cell RNA-seq
Tirosh, I., Izar, B., Prakadan, S. M., Wadsworth, M. H., Treacy, D., Trombetta, J. J., Rotem, A., Rodman, C., Lian, C., Murphy, G., et al. (2016) · Science · doi:10.1126/science.aad0501 · Cited by 4,944
Finak, G., McDavid, A., Yajima, M., Deng, J., Gersuk, V., Shalek, A. K., Slichter, C. K., Miller, H. W., McElrath, M. J., Prlic, M., et al. (2015) · Genome Biology · doi:10.1186/s13059-015-0844-5 · Cited by 3,159
Simultaneous epitope and transcriptome measurement in single cells
Stoeckius, M., Hafemeister, C., Stephenson, W., Houck-Loomis, B., Chattopadhyay, P. K., Swerdlow, H., Satija, R., & Smibert, P. (2017) · Nature Methods · doi:10.1038/nmeth.4380 · Cited by 3,098
Krasemann, S., Madore, C., Cialic, R., Baufeld, C., Calcagno, N., El Fatimy, R., Beckers, L., O’Loughlin, E., Xu, Y., Fanek, Z., et al. (2017) · Immunity · doi:10.1016/j.immuni.2017.08.008 · Cited by 2,979
Molecular Architecture of the Mouse Nervous System
Zeisel, A., Hochgerner, H., Lönnerberg, P., Johnsson, A., Memic, F., van der Zwan, J., Häring, M., Braun, E., Borm, L. E., La Manno, G., et al. (2018) · Cell · doi:10.1016/j.cell.2018.06.021 · Cited by 2,552
Cited by
Sorted by citations
Items 101–200 of 477
Defining Microglial States and Nomenclature: A Roadmap to 2030Preprint
Paolicelli, R. C., Sierra, A., Stevens, B., Tremblay, M., Aguzzi, A., Ajami, B., Amit, I., Audinat, É., Bechmann, I., Bennett, M. L., et al. (2022) · SSRN Electronic Journal · doi:10.2139/ssrn.4065080 · Cited by 33
Self-citationJones, H. E., Coelho‐Santos, V., Bonney, S. K., Abrams, K. A., Shih, A. Y., & Siegenthaler, J. A. (2023) · Development · doi:10.1242/dev.201805 · Cited by 35
“A recent single-cell RNA-sequencing study shows that microglia and macrophages express PDGFB in the adult mouse brain (Marsh et al., 2022); these cell types may also act as a source of ligand attracting PVFs into PVSs.”
BackgroundPreman, P., Moechars, D., Fertan, E., Wolfs, L., Serneels, L., Shah, D., Lamote, J., Poovathingal, S., Snellinx, A., Mancuso, R., et al. (2024) · EMBO Molecular Medicine · doi:10.1038/s44321-024-00162-7 · Cited by 32
“…5 μ M ActD and spun at 300 rcf for 15 min at 4 °C. Note that 5 μ M ActD was kept during collection and enzymatic dissociation of the tissue to preserve transcriptional state and prevent arti fi cial induction stress-response genes during tissue dissociation (Marsh et al, 2022; Perocchi et al, 2007).”
Montserrat-Ayuso, T., & Esteve‐Codina, A. (2024) · BMC Genomics · doi:10.1186/s12864-024-11015-5 · Cited by 37
Gumbs, S. B. H., Kübler, R., Gharu, L., Schipper, P. J., Borst, A. L., Snijders, G. J. L., Ormel, P. R., van Berlekom, A. B., Wensing, A. M. J., de Witte, L. D., et al. (2022) · Journal of NeuroVirology · doi:10.1007/s13365-021-01049-w · Cited by 34
The Role of Oxytocin in Abnormal Brain Development: Effect on Glial Cells and Neuroinflammation
Knoop, M. S., Possovre, M.-L., Jacquens, A., Charlet, A., Baud, O., & Darbon, P. (2022) · Cells · doi:10.3390/cells11233899 · Cited by 35
Schwann cell-secreted PGE2 promotes sensory neuron excitability during development
Kantarci, H., Elvira, P. D., Thottumkara, A. P., O’Connell, E. M., Iyer, M., Donovan, L. J., Dugan, M. Q., Ambiel, N., Granados, A. A., Zeng, H., et al. (2024) · Cell · doi:10.1016/j.cell.2024.07.033 · Cited by 34
Aisenberg, W. H., O’Brien, C. A., Sangster, M., Yaqoob, F., Zhang, Y., Temsamrit, B., Thom, S., Gosse, L., Chaluvadi, V. S., Elfayomi, B., et al. (2025) · Immunity · doi:10.1016/j.immuni.2025.03.019 · Cited by 31
Vecchiarelli, H. A., & Tremblay, M. (2023) · Annual Review of Genetics · doi:10.1146/annurev-genet-022223-093643 · Cited by 32
CB2 expression in mouse brain: from mapping to regulation in microglia under inflammatory conditions
Grabon, W., Ruiz, A., Gasmi, N., Dégletagne, C., Georges, B., Belmeguenaï, A., Bodennec, J., Rheims, S., Marcy, G., & Bezin, L. (2024) · Journal of Neuroinflammation · doi:10.1186/s12974-024-03202-8 · Cited by 33
“To prevent this activation, buffers can be supplemented with transcriptional and translational inhibitors such as actinomycin D (ActD), triptolide (Trip), and anisomycine (Anis) [24].”
BackgroundMethodInfluentialHeterogeneity of Astrocyte Reactivity
Clayton, B. L. L., & Liddelow, S. A. (2025) · Annual Review of Neuroscience · doi:10.1146/annurev-neuro-112723-031738 · Cited by 33
Hohsfield, L. A., Tsourmas, K. I., Ghorbanian, Y., Syage, A. R., Kim, S. J., Cheng, Y., Furman, S., Inlay, M. A., Lane, T. E., & Green, K. N. (2022) · Glia · doi:10.1002/glia.24144 · Cited by 25
Cell-subtype specific effects of genetic variation in the aging and Alzheimer cortex
Fujita, M., Gao, Z., Zeng, L., McCabe, C., White, C. C., Ng, B., Green, G. S., Rozenblatt-Rosen, O., Phillips, D., Amir-Zilberstein, L., et al. (2022) · doi:10.1101/2022.11.07.515446 · Cited by 36
A single‐cell RNA labeling strategy for measuring stress response upon tissue dissociation
Neuschulz, A., Bakina, O., Lisakowski, V. B., Olivares‐Chauvet, P., Conrad, T., Gotthardt, M., Kettenmann, H., & Junker, J. P. (2022) · Molecular Systems Biology · doi:10.15252/msb.202211147 · Cited by 27
Tran, K. M., Kwang, N. E., Butler, C. A., Gomez-Arboledas, A., Kawauchi, S., Mar, C., Chao, D., Barahona, R. A., Da Cunha, C., Tsourmas, K. I., et al. (2025) · Molecular Neurodegeneration · doi:10.1186/s13024-024-00793-x · Cited by 28
“This method enables single-cell level gene expression analysis in microglia, overcoming limitations associated with single-cell and nucleus RNA-seq, such as technique-induced expression changes [52–56].”
Self-citationAstrocyte diversity and subtypes: aligning transcriptomics with multimodal perspectives
Hennes, M., Richter, M. L., Fischer-Sternjak, J., & Götz, M. (2025) · EMBO Reports · doi:10.1038/s44319-025-00529-y · Cited by 35
“However, single-cell methods often induce arti fi cial transcriptomic perturbations as cells are vulnerable to the dissociation protocols (Marsh et al, 2022; Mattei et al, 2020).”
Cellular Localization of Kynurenine 3-Monooxygenase in the Brain: Challenging the Dogma
Sathyasaikumar, K. V., de la Cruz, V. P., Pineda, B., Cervantes, G. I. V., Ortega, D. R., Donley, D. W., Severson, P. L., West, B. L., Giorgini, F., Fox, J. H., et al. (2022) · Antioxidants · doi:10.3390/antiox11020315 · Cited by 30
The Role of Oxytocin in Early-Life-Stress-Related Neuropsychiatric Disorders
Jin, Y., Song, D. F., Yan, Y., Quan, Z., & Qing, H. (2023) · International Journal of Molecular Sciences · doi:10.3390/ijms241310430 · Cited by 30
A Drosophila glial cell atlas reveals a mismatch between transcriptional and morphological diversity
Lago‐Baldaia, I., Cooper, M., Seroka, A. Q., Trivedi, C. A., Powell, G. T., Wilson, S. W., Ackerman, S. D., & Fernandes, V. M. (2023) · PLoS Biology · doi:10.1371/journal.pbio.3002328 · Cited by 30
Zhu, Y., Zhang, Y., He, S., Yi, S., Feng, H., Xia, X., Fang, X., Gong, X., & Zhao, P. (2024) · Journal of Neuroinflammation · doi:10.1186/s12974-024-03161-0 · Cited by 30
“This is essential to comprehend intricate neurological mechanisms and identify specific cell types that may contribute to disease processes [71].”
BackgroundGene expression and chromatin conformation of microglia in virally suppressed people with HIV
Schlachetzki, J. C. M., Gianella, S., Ouyang, Z., Lana, A. J., Yang, X., O’Brien, S., Challacombe, J. F., Gaskill, P. J., Jordan‐Sciutto, K. L., Chaillon, A., et al. (2024) · Life Science Alliance · doi:10.26508/lsa.202402736 · Cited by 32
“Specimens from the DLPFC were received within a postmorteminterval of 4 h. Approximately 500mgof the DLPFC tissue was dissociated at 4°C without using enzymes to avoid arti fi cial activation of microglia and other immune cells (Gosselin et al, 2017; Marsh et al, 2022).”
Hasegawa, Y., Kim, J., Ursini, G., Jouroukhin, Y., Zhu, X., Miyahara, Y., Xiong, F., Madireddy, S., Obayashi, M., Lutz, B., et al. (2023) · Nature Communications · doi:10.1038/s41467-023-42276-5 · Cited by 28
“Giventhatenzymaticdissociationofbraintissueduring the process of cell isolation affects molecular expression in microglia 59 – 62 , interpreting such data requires caution.”
Comparative transcriptional analysis of satellite glial cell injury response
Jager, S. E., Pallesen, L. T., Lin, L., Izzi, F., Pinheiro, A. M., Villa‐Hernández, S., Cesare, P., Vægter, C. B., & Denk, F. (2022) · Wellcome Open Research · doi:10.12688/wellcomeopenres.17885.1 · Cited by 25
St‐Pierre, M., VanderZwaag, J., Loewen, S. M., & Tremblay, M. (2022) · Frontiers in Cellular Neuroscience · doi:10.3389/fncel.2022.932572 · Cited by 27
FixNCut: single-cell genomics through reversible tissue fixation and dissociation
Jiménez-Gracia, L., Marchese, D., Nieto, J. C., Caratù, G., Melón-Ardanaz, E., Gudiño, V., Roth, S., Wise, K., Ryan, N. K., Jensen, K. B., et al. (2024) · Genome biology · doi:10.1186/s13059-024-03219-5 · Cited by 25
“Alternatively, inhibitors of transcription and translation have been shown to reduce gene expression artifacts by minimizing the impact of dissociation-induced stress (5).”
BackgroundAre we there yet? Exploring astrocyte heterogeneity one cell at a time
O’Dea, M. R., & Hasel, P. (2024) · Glia · doi:10.1002/glia.24621 · Cited by 27
Goldman, D. H., Dykstra, T., Smirnov, I., Blackburn, S. M., Mesquita, S. D., Kipnis, J., & Herz, J. (2022) · Nature Aging · doi:10.1038/s43587-022-00268-y · Cited by 24
Single-cell dissection of tumor microenvironmental response and resistance to cancer therapy
Luo, Y., & Liang, H. (2023) · Trends in Genetics · doi:10.1016/j.tig.2023.07.005 · Cited by 25
An integral blood–brain barrier in adulthood relies on microglia-derived PDGFB
Weng, Y., Chen, N., Zhang, R., He, J., Ding, X., Cheng, G., Bi, Q., Lu, Y., Shen, X. Z., Wan, S., et al. (2023) · Brain Behavior and Immunity · doi:10.1016/j.bbi.2023.11.023 · Cited by 25
Hemonnot-Girard, A.-L., Meersseman, C., Pastore, M., Garcia, V., Linck, N., Rey, C., Chebbi, A., Jeanneteau, F., Ginsberg, S. D., Lachuer, J., et al. (2022) · Journal of Neuroinflammation · doi:10.1186/s12974-022-02581-0 · Cited by 24
Human microglial models to study host–virus interactions
McMillan, R. E., Wang, E. Y., Carlin, A. F., & Coufal, N. G. (2023) · Experimental Neurology · doi:10.1016/j.expneurol.2023.114375 · Cited by 24
The age-dependent immune response to ischemic stroke
Tuohy, M. C., Hillman, E. M. C., Marshall, R. S., & Agalliu, D. (2022) · Current Opinion in Neurobiology · doi:10.1016/j.conb.2022.102670 · Cited by 23
Plasticity of human microglia and brain perivascular macrophages in aging and Alzheimer’s disease
Lee, D., Vicari, J. M., Porras, C., Spencer, C., Pjanic, M., Wang, X., Kinrot, S., Weiler, P., Kosoy, R., Bendl, J. M., et al. (2026) · Nature Genetics · doi:10.1038/s41588-026-02716-6 · Cited by 32
“7a, Supplementary Table 14 and Methods).”
InfluentialYou, Y., Chen, Z., & Hu, W. (2024) · Pharmacology & Therapeutics · doi:10.1016/j.pharmthera.2024.108606 · Cited by 25
Adameyko, I. I., Bakken, T. E., Bhaduri, A., Chhatbar, C., Filbin, M. G., Gate, D., Hochgerner, H., Kim, C. N., Krull, J. E., Manno, G. L., et al. (2024) · Nature Neuroscience · doi:10.1038/s41593-024-01827-9 · Cited by 26
“Dissociation methods 66 , reporting 144 Experimental design Multiplexing?”
Investigative needle core biopsies support multimodal deep-data generation in glioblastoma
Yu, K. K. H., Basu, S., Baquer, G., Ahn, R., Gantchev, J. K., Jindal, S., Regan, M. S., Abou-Mrad, Z., Prabhu, M. C., Williams, M. J., et al. (2025) · Nature Communications · doi:10.1038/s41467-025-58452-8 · Cited by 28
“A recent study by Marsh et al. suggested that enzymatic dissociation is associated with an ex vivo activation signature (ExAM) which was absent in mechanical dissociation and is abrogated using protein translational inhibitors 37 .”
Krylov, A., Yu, S., Veen, K., Newton, A. H., Ye, A., Qin, H., He, J., & Jusuf, P. R. (2023) · Frontiers in Molecular Neuroscience · doi:10.3389/fnmol.2023.1087136 · Cited by 19
Dissing‐Olesen, L., Walker, A. J., Feng, Q., Barr, H. J., Walker, A. C., Xie, L., Wilton, D. K., Das, I., Benowitz, L. I., & Stevens, B. (2023) · Nature Communications · doi:10.1038/s41467-023-41448-7 · Cited by 27
“1, 2) and as we and others have done previously 19 – 21 .”
Self-citationMontanari, M., Burattini, S., Ciacci, C., Ambrogini, P., Carloni, S., Balduini, W., Lopez, D., Panza, G., Papa, S., & Canonico, B. (2022) · Biomolecules · doi:10.3390/biom12050701 · Cited by 22
“Furthermore, enzymatic reactions can attack surface markers and cause alterations in gene expression profiles [54,74,76].”
BackgroundAnderson, K. G., Braun, D. A., Buqué, A., Gitto, S. B., Guerriero, J. L., Horton, B. L., Keenan, B. P., Kim, T. S., Overacre-Delgoffe, A. E., Ruella, M., et al. (2023) · Journal for ImmunoTherapy of Cancer · doi:10.1136/jitc-2022-006533 · Cited by 22
“142 Finally, current high-dimensional analysis methods have a substantially higher financial cost than conventional ‘bulk’ sequencing approaches or traditional IHC/immunofluorescence.”
Güvenek, A., Parikshak, N., Zamolodchikov, D., Gelfman, S., Moscati, A., Dobbyn, L., Stahl, E. A., Shuldiner, A. R., & Coppola, G. (2024) · Communications Biology · doi:10.1038/s42003-024-06684-7 · Cited by 23
“Finally, thedatasets utilized in our study are derived from human postmortem brain tissue, which can introduce additional confounders compared to freshly isolated tissue 53 .”
Erasure of Biologically Meaningful Signal by Unsupervised scRNAseq Batch-correction MethodsPreprint
Tyler, S. R., Guccione, E., & Schadt, E. E. (2021) · bioRxiv (Cold Spring Harbor Laboratory) · doi:10.1101/2021.11.15.468733 · Cited by 20
Relapse to cocaine seeking is regulated by medial habenula NR4A2/NURR1 in mice
Childs, J. E., Morabito, S., Das, S., Santelli, C., Pham, V., Kusche, K. M., Vera, V. A., Reese, F., Campbell, R. R., Matheos, D. P., et al. (2024) · Cell Reports · doi:10.1016/j.celrep.2024.113956 · Cited by 21
“66 .”
Joshi, R., Brezáni, V., Mey, G. M., Guixé‐Muntet, S., Ortega‐Ribera, M., Zhuang, Y., Zivny, A., Werneburg, S., Gracia‐Sancho, J., & Szabó, G. (2024) · Journal of Neuroinflammation · doi:10.1186/s12974-024-03203-7 · Cited by 22
“Microglia and astrocyte flow cytometry: Microglia and astrocytes were flow sorted as described previously [89].”
MethodType I interferon signalling and interferon‐responsive microglia in health and disease
López‐Atalaya, J. P., & Bhojwani-Cabrera, A. M. (2025) · FEBS Journal · doi:10.1111/febs.70126 · Cited by 23
Herron, S., Delpech, J.-C., Madore, C., & Ikezu, T. (2022) · STAR Protocols · doi:10.1016/j.xpro.2022.101670 · Cited by 24
Implementation and validation of single-cell genomics experiments in neuroscience
Colonna, M., Konopka, G., Liddelow, S. A., Nowakowski, T. J., Awatramani, R. B., Bateup, H. S., Cadwell, C. R., Caglayan, E., Chen, J. L., Gillis, J., et al. (2024) · Nature Neuroscience · doi:10.1038/s41593-024-01814-0 · Cited by 22
Self-citationTuddenham, J. F., Taga, M. F., Haage, V. C., Roostaei, T., White, C. C., Lee, A., Fujita, M., Khairallah, A., Green, G., Hyman, B. T., et al. (2022) · bioRxiv (Cold Spring Harbor Laboratory) · doi:10.1101/2022.06.04.494709 · Cited by 20
Patir, A., Barrington, J., Szymkowiak, S., Brezzo, G., Straus, D., Alfieri, A., Lefèvre, L., Liu, Z., Ginhoux, F., Henderson, N. C., et al. (2024) · Cell Reports · doi:10.1016/j.celrep.2024.114250 · Cited by 19
Alzheimer’s disease transcriptional landscape in ex vivo human microglia
Kosoy, R., Fullard, J. F., Bendl, J. M., Kleopoulos, S. P., Shao, Z., Argyriou, S., Mathur, D. D., Psychogyiou, K., Malakates, P., Vicari, J. M., et al. (2025) · Nature Neuroscience · doi:10.1038/s41593-025-02020-2 · Cited by 22
“Micro-glia signatures associated with ex vivo activation from Marsh et al. 20 are available at https://pmc.ncbi.nlm.nih.gov/articles/instance/11645269/ bin/41593_2022_1022_MOESM15_ESM.csv. Raw data for the in vitro associated microglial changes from Gosselin et al. 26 Extended Data Fig.”
Single-cell RNA sequencing identifies hippocampal microglial dysregulation in diet-induced obesity
Henn, R. E., Guo, K., Elzinga, S. E., Noureldein, M. H., Mendelson, F. E., Hayes, J. M., Rigan, D. M., Savelieff, M. G., Hur, J., & Feldman, E. L. (2023) · iScience · doi:10.1016/j.isci.2023.106164 · Cited by 18
“showed that transcriptional inhibition prevented a processing-associated cluster, which has appeared in other microglial scRNA-seq.(53) Overall, we showed, for the first time, that ll OPEN ACCESS”
BackgroundMethodPericytes orchestrate a tumor-restraining microenvironment in glioblastoma
Braun, S., Bolívar, P., Oudenaarden, C., Sjölund, J., Bocci, M., Harbst, K., Talkhoncheh, M. S., Phung, B., Cordero, E., Rosberg, R., et al. (2025) · Nature Communications · doi:10.1038/s41467-025-66985-1 · Cited by 21
“1.2) 131 for visualization of the results, including UMAP, feature plots, and clustered dot plots of selected top DEG. scCustomize uses the k-means method for clustering dot plots.”
InfluentialBordt, E. A., Moya, H., Jo, Y. C., Ravichandran, C. T., Bankowski, I. M., Ceasrine, A. M., McDougle, C. J., Carlezon, W. A., & Bilbo, S. D. (2022) · Brain Behavior and Immunity · doi:10.1016/j.bbi.2023.11.010 · Cited by 21
Role of Microglia in Central Nervous System Development and PlasticityPreprint
Schafer, D. P., Stevens, B., Bennett, M. L., & Bennett, F. C. (2024) · Cold Spring Harbor Perspectives in Biology · doi:10.1101/cshperspect.a041810 · Cited by 19
Self-citationSingle‐Nucleus RNA‐Sequencing in Brain Tissue
Waag, R., & Bohacek, J. (2023) · Current Protocols · doi:10.1002/cpz1.919 · Cited by 15
“Several adjustments to the dissociation process, such as the use of cold-active enzymes, dissociation at lower temperatures, or the use of transcription inhibitors during dissociation have been shown to alleviate these artifacts (Adam et al., 2017; Marsh et al., 2022; Wu et al., 2017).”
BackgroundMapping the peripheral immune landscape of Parkinson’s disease patients with single-cell sequencing
Moquin‐Beaudry, G., Andriamboavonjy, L., Audet, S., Hamilton, L. K., Duquette, A., Chouinard, S., Panisset, M., & Tétreault, M. (2025) · Brain · doi:10.1093/brain/awaf066 · Cited by 23
Zheng, C., Hervé, B., Meijer, M., Kirby, L. A., Guerreiro‐Cacais, A. O., Kukanja, P., Kabbe, M., Jimenez-Beristain, T., Olsson, T. P., Agirre, E., et al. (2025) · Nature Neuroscience · doi:10.1038/s41593-025-02100-3 · Cited by 20
“The finding that microglia are more sensitive than other CNS cell types has also been confirmed before in another study 86 .”
TREM2 signaling in Parkinson’s disease: Regulation of microglial function and α-synuclein pathology
Yin, S., Chi, X., Wan, F. J., Li, Y., Zhou, Q., Kou, L., Sun, Y., Wu, J., Zou, W., Wang, Y., et al. (2024) · International Immunopharmacology · doi:10.1016/j.intimp.2024.113446 · Cited by 17
Hume, D. A. (2025) · Trends in Neurosciences · doi:10.1016/j.tins.2025.06.006 · Cited by 19
Wenzel, T. J., Le, J., He, J., Alcorn, J., & Mousseau, D. D. (2022) · Journal of Neurochemistry · doi:10.1111/jnc.15741 · Cited by 17
Quantitative MRI maps of human neocortex explored using cell type-specific gene expression analysis
Edwards, L., McColgan, P., Helbling, S., Zarkali, A., Vaculčiaková, L., Pine, K., Dick, F., & Weiskopf, N. (2022) · Cerebral Cortex · doi:10.1093/cercor/bhac453 · Cited by 15
Myeloid lineage C3 induces reactive gliosis and neuronal stress during CNS inflammation
Garton, T. P., Smith, M. D., Kesharwani, A., Gharagozloo, M., Oh, S., Na, C. H., Absinta, M., Reich, D. S., Zack, D. J., & Calabresi, P. A. (2025) · Nature Communications · doi:10.1038/s41467-025-58708-3 · Cited by 18
SHIP1 and its role for innate immune regulation—Novel targets for immunotherapy
Yeoh, W. J., & Krebs, P. (2023) · European Journal of Immunology · doi:10.1002/eji.202350446 · Cited by 14
Differential usage of DNA modifications in neurons, astrocytes, and microglia
Tooley, K. B., Chucair‐Elliott, A. J., Ocañas, S. R., Machalinski, A. H., Pham, K. D., Hoolehan, W., Kulpa, A. M., Stanford, D. R., & Freeman, W. M. (2023) · Epigenetics & Chromatin · doi:10.1186/s13072-023-00522-6 · Cited by 13
“Transgenic labeling approaches (such as RiboTag, TRAP, INTACT, and NuTRAP) provide the desired cell type specificity and avoid these activa-tional confounds of sorting [92–94].”
MethodHe, Z., Chen, Q., Wang, K., Lin, J., Peng, Y., Zhang, J., Yan, X., & Yan, J. (2024) · European Journal of Neuroscience · doi:10.1111/ejn.16242 · Cited by 18
“First, the enzymatic dissociation on brain tissue may induce abnormal ex vivo gene expression, which mainly occurs in microglia and other brain myeloid cells (Marsh et al., 2022).”
BackgroundZhou, L., Wang, N., Feng, W., Liu, X., Wu, Q., Chen, J., Jiao, X., Ning, X., Qi, Z., Xu, Z., et al. (2024) · Glia · doi:10.1002/glia.24606 · Cited by 14
“Binding of microglia to A β plaques results in the acquisition of an activated transcriptional profile, commonly referred to as disease-associated microglia (DAMs) (Marsh et al., 2022).”
Refining the interactions between microglia and astrocytes in Alzheimer’s disease pathology
Chen, J., Xu, S., Wang, L., Liu, X., Liu, G., Tan, Q., Li, W., Zhang, S., & Du, Y. (2025) · Neuroscience · doi:10.1016/j.neuroscience.2025.03.033 · Cited by 17
Neuroimmunomodulatory properties of polysialic acid
Gretenkort, L., Thiesler, H., & Hildebrandt, H. (2023) · Glycoconjugate Journal · doi:10.1007/s10719-023-10120-z · Cited by 16
Srinivasan, S., Kancheva, D., Ren, S. D., Saito, T., Jans, M., Boone, F., Vandendriessche, C., Paesmans, I., Maurin, H., Vandenbroucke, R. E., et al. (2024) · Frontiers in Immunology · doi:10.3389/fimmu.2024.1323409 · Cited by 16
MAVS signaling shapes microglia responses to neurotropic virus infection
Gern, O. L., Pavlou, A., Mulenge, F., Busker, L. M., Ghita, L., Aringo, A., Costa, B., Spanier, J., Waltl, I., Stangel, M., et al. (2024) · Journal of Neuroinflammation · doi:10.1186/s12974-024-03258-6 · Cited by 15
“Moreover, several enzymes used for tissue digestion, including collagenase, can cleave surface markers, which potentially affects readouts [77].”
BackgroundLiu, D., Zinski, A. L., Mishra, A., Noh, H., Park, G.-H., Qin, Y., Olorife, O., Park, J. M., Abani, C. P., Park, J. S., et al. (2022) · Molecular Psychiatry · doi:10.1038/s41380-022-01654-z · Cited by 15
“Also, recent studies showed confounder introduced by trypsinization during scRNA-seq sample preparation [111].”
BackgroundTuddenham, J. F., Fujita, M., Lee, E., Nimmagadda, N., Khairallah, A., Harbison, C., Flowers, X. E., Coronas‐Samano, G., Maniatis, S., Daly, A. C., et al. (2025) · Acta Neuropathologica · doi:10.1007/s00401-025-02913-3 · Cited by 16
Yang, J.-X., Zhu, J., Ni, K., Yang, H., Zhang, H., & Ma, Z. (2023) · Neuroreport · doi:10.1097/wnr.0000000000001935 · Cited by 13
Comparative analysis of methods to reduce activation signature gene expression in PBMCs
Andriamboavonjy, L., MacDonald, A., Hamilton, L. K., Labrecque, M., Boivin, M., Karamchandani, J., Stratton, J. A., & Tétreault, M. (2023) · Scientific Reports · doi:10.1038/s41598-023-49611-2 · Cited by 13
“Recently, Marsh et al.(10) demonstrated that TTis effectively suppress an ex vivo triggered 236 response, which represents artificial changes in the transcriptomic profile of cells upon their 237 removal from the body and that this suppression occurs through an AP-1-mediated 238 mechanism.”
BackgroundInfluentialMicroglial sex differences in innate high anxiety and modulatory effects of minocycline
Ugursu, B., Sah, A., Sartori, S. B., Popp, O., Mertins, P., Dunay, I. R., Kettenmann, H., Singewald, N., & Wolf, S. A. (2024) · Brain Behavior and Immunity · doi:10.1016/j.bbi.2024.03.035 · Cited by 14
“Microglia isolated from HAB male and female brains do not show a major ex vivo activation signature due to the cell isolation procedure. tSNE plots show expression of the genes, which increase their level of expression in response to ex vivo activation ( Fos, Jun, Egr-1, Hsp1a, Junb ) 101 .”
Gharibani, P. M., Abramson, E., Shanmukha, S., Smith, M. D., Godfrey, W. H., Lee, J. J., Hu, J., Baydyuk, M., Dorion, M., Deng, X., et al. (2025) · Science Translational Medicine · doi:10.1126/scitranslmed.adk3434 · Cited by 15
Shea, J. M., & Villeda, S. (2025) · eLife · doi:10.7554/elife.97671.3 · Cited by 13
Multifaceted microglia during brain development: Models and tools
Bridlance, C., & Thion, M. S. (2023) · Frontiers in Neuroscience · doi:10.3389/fnins.2023.1125729 · Cited by 14
Deciphering microglia phenotypes in health and disease
Balak, C. D., Han, C. Z., & Glass, C. K. (2024) · Current Opinion in Genetics & Development · doi:10.1016/j.gde.2023.102146 · Cited by 14
Shea, J. M., & Villeda, S. (2024) · eLife · doi:10.7554/elife.97671 · Cited by 18
Hajkarim, M. C., May, M. S., Amin, A. D., Jamison, J. K. R., Tagore, S., D’Souza, E. K., Caprio, L., Walsh, Z. H., Fan, J. L., Zhang, M., et al. (2025) · Nature Genetics · doi:10.1038/s41588-025-02345-5 · Cited by 13
“We included 91,872 high-quality nuclei, largely free of artifactual gene expression 27,29,30 (Extended Data Fig.”
Cen, Y., Alves, S. R., Song, D., Felice, C., Preall, J. B., Aelst, L. V., & Tonks, N. K. (2026) · Proceedings of the National Academy of Sciences · doi:10.1073/pnas.2521944123 · Cited by 14
Neutrophil-inflicted vasculature damage suppresses immune-mediated optic nerve regeneration
Passino, R., Finneran, M. C., Hafner, H., Feng, Q., Huffman, L. D., Zhao, X., Johnson, C. N., Kawaguchi, R., Osés-Prieto, J. A., Burlingame, A. L., et al. (2024) · Cell Reports · doi:10.1016/j.celrep.2024.113931 · Cited by 13
Mulenge, F., Gern, O. L., Busker, L. M., Aringo, A., Ghita, L., Waltl, I., Pavlou, A., & Kalinke, U. (2024) · Journal of Neuroinflammation · doi:10.1186/s12974-024-03197-2 · Cited by 12
“A , UMAP plot showing clustering of microglia from Von Hove et al. [23], Tepe et al. [26], Hammond et al. [31], and Marsh et al. [27] after QC and data filtering using Harmony integration.”
BackgroundMethodResultInfluentialRetinal Organoid Microenvironment Enhanced Bioactivities of Microglia-Like Cells Derived From HiPSCs
Gao, M., Wang, T.-Y., Lin, X. B., Chun, T., Li, M., Bai, Z., Liu, Z.-C., Chen, L., Kong, Q., Pan, S., et al. (2024) · Investigative Ophthalmology & Visual Science · doi:10.1167/iovs.65.12.19 · Cited by 12
TGFβ signaling mediates microglial resilience to spatiotemporally restricted myelin degeneration
Zhu, K., Liu, Y., Min, J.-H., Joshua, V., Lin, J., Li, Y., Kreutzmann, J. C., Guo, Y., Xia, W., Mohammadi, E., et al. (2026) · Nature Neuroscience · doi:10.1038/s41593-025-02161-4 · Cited by 11
“This approach involved snap freezing and mechanical dissociation of the tissues to obtain nuclei for sequencing, providing a more accurate representation of the cellular landscape and minimizing gene expression artifacts induced by enzymatic digestion 35,36 .”
The evolution of gene regulation in mammalian cerebellum development
Sarropoulos, I., Sepp, M., Yamada, T., Schäfer, P. S. L., Trost, N., Schmidt, J., Schneider, C., Drummer, C., Mißbach, S., Taskiran, I. I., et al. (2026) · Science · doi:10.1126/science.adw9154 · Cited by 13
Parkinson’s disease in the single-cell era
Arenas, E. (2022) · Nature Neuroscience · doi:10.1038/s41593-022-01069-7 · Cited by 12
Circulatory proteins shape microglia state and boost phagocytosisPreprint
Lu, N., Losada, P. M., Hahn, O., Saksena, A., Tapp, E., Chadarevian, J. P., Dong, W., Shi, S. M., Shuken, S. R., Guldner, I. H., et al. (2024) · bioRxiv (Cold Spring Harbor Laboratory) · doi:10.1101/2024.09.30.615861 · Cited by 12
Transcription factors that define the epigenome structures and transcriptomes in microglia
Saeki, K., & Ozato, K. (2025) · Experimental Hematology · doi:10.1016/j.exphem.2025.104814 · Cited by 11
Schmitt, M. J., Dramaretska, Y., Serresi, M., Kertalli, S., Jiang, B., Yin, J., Aguzzi, A., Barozzi, I., & Gargiulo, G. (2024) · Nature Communications · doi:10.1038/s41467-024-45069-6 · Cited by 13
“Moreover, bona fi de cell states identi fi ed by single-cell data ex vivo require in vivo validation, as artefactual signatures may be confounding 50 .”
BackgroundAn integrated toolkit for human microglia functional genomics
Haq, I., Ngo, J. C., Roy, N., Pan, R., Nawsheen, N., Chiu, R., Zhang, Y., Fujita, M., Soni, R. K., Wu, X., et al. (2024) · Stem Cell Research & Therapy · doi:10.1186/s13287-024-03700-9 · Cited by 10
“We compared chromatin profiling of iMG to primary microglia (pMG) purified from aged human dorsolateral prefrontal cortex, using an established protocol [27, 44].”
MethodRapid phagosome isolation enables unbiased multiomic analysis of human microglial phagosomes
Wogram, E., Sümpelmann, F., Dong, W., Rawat, E. S., Fernández-Maestre, I., Fu, D., Braswell, B., Khalil, A. S., Buescher, J. M., Mittler, G., et al. (2024) · Immunity · doi:10.1016/j.immuni.2024.07.019 · Cited by 11
SenMayo transcriptomic senescence panel highlights glial cells in the ageing mouse and human retina
Suresh, S., Karthik, G., Ouyang, J. F., Chrysostomou, V., Tang, S. A., Petretto, E. G., Crowston, J. G., & Bell, K. C. (2024) · npj Aging · doi:10.1038/s41514-024-00187-9 · Cited by 10
“Since some microglial AP1 pathway genes have been implicated to be activated during tissue dissociation 71 , we removed these genes from the list of all genes expressed in retinal microglia in our dataset, human retina and Saban mouse retinal microglia and re-ran the GSEA pathway analysis and did…”
InfluentialPropagation of neuronal micronuclei regulates microglial characteristics
Yano, S., Asami, N., Kishi, Y., Takeda, I., Kubotani, H., Hattori, Y., Kitazawa, A., Hayashi, K., Kubo, K., Saeki, M., et al. (2025) · Nature Neuroscience · doi:10.1038/s41593-024-01863-5 · Cited by 15
“We expect to obtain detailed information on MN-induced changes in the microglial state by conducting large-scale omics analysis using time-and region-specific single-cell RNA-seq analysis, paying careful attention to experimental procedures 55 .”
Astrocyte transcriptomic changes along the spatiotemporal progression of Alzheimer’s diseasePreprint
Serrano‐Pozo, A., Li, Z., Woodbury, M. E., Muñoz‐Castro, C., Wachter, A., Jayakumar, R., Bryant, A. G., Noori, A., Welikovitch, L. A., Hu, M., et al. (2022) · bioRxiv (Cold Spring Harbor Laboratory) · doi:10.1101/2022.12.03.518999 · Cited by 10
Emerging Models to Study Human Microglia In vitro
Jäntti, H., Kistemaker, L., Buonfiglioli, A., de Witte, L. D., Malm, T., & Hol, E. M. (2024) · Advances in neurobiology · doi:10.1007/978-3-031-55529-9_30 · Cited by 8
Transcriptional Regulation of Microglial Metabolic and Activation States by P2RY12
Lopez‐Ortiz, A. O., Doceti, M., Thomas, J., Duffy, A., Coburn, M., Okojie, A. K., Lee, A., Sou, E. A., Gaultier, A., & Eyo, U. B. (2025) · Glia · doi:10.1002/glia.70078 · Cited by 12
Ramirez, J. J., Hardin, E. J., Sakers, K., Kim, J., Ortiz, C. K. C., Savage, J. T., Hanamsagar, R., Block, C. L., Singh, S. K., Bilbo, S. D., et al. (2026) · Neuron · doi:10.1016/j.neuron.2025.12.028 · Cited by 14
Lee, J., Villarreal, O. D., Wang, Y. C., Ragoussis, J., Rivest, S., Gosselin, D., & Richard, S. (2022) · Life Science Alliance · doi:10.26508/lsa.202201467 · Cited by 10
“We did not find evidence that expression of CCL3, CCL4, JUN, and HSPA1A mRNAs, which are markers of spurious transcriptional induction associated with enzymatic-based isolation of microglia (Marsh et al, 2022) drove a specific cluster based on single-cell RNAseq data.”
Background
Metadata
- Authors
- Marsh, S. E., Walker, A. J., Kamath, T., Dissing-Olesen, L., Hammond, T. R., de Soysa, T. Y., Young, A. M. H., Murphy, S., Abdulraouf, A., Nadaf, N., Dufort, C., Walker, A. C., Lucca, L. E., Kozareva, V., Vanderburg, C., Hong, S., Bulstrode, H., Hutchinson, P. J., Gaffney, D. J., Hafler, D. A., Franklin, R. J. M., Macosko, E. Z., & Stevens, B.
- Affiliations
- Broad Institute (US)
- Wellcome/MRC Cambridge Stem Cell Institute (GB)
- Boston Children's Hospital (US)
- Yale University (US)
- UK Dementia Research Institute (GB)
- University of Cambridge (GB)
- Wellcome Sanger Institute (GB)
- Corresponding author
- Stevens, Beth
- ORCID
- Venue
- Nature Neuroscience
- Published
- 2022-03
- Volume
- 25
- Issue
- 3
- Pages
- 306-316
- ISSN
- 1097-6256 (ISSN-L)
- 1546-1726
- PMC
- PMC11645269
- OpenAlex
- W4220661922
- Cited by
- 431
- References
- 108
- Citations by year
- 2026: 102 · 2025: 71 · 2024: 103 · 2023: 83 · 2022: 61
- FWCI
- 26.69
- Type
- journal article
- Language
- en
- Update notices
- correction (2024-12-13)
- Open access
- hybrid
- doi.org
- Locations
- Nature Neuroscience (publishedVersion, cc-by)
- bioRxiv (Cold Spring Harbor Laboratory) (submittedVersion, cc-by-nd)
- PubMed Central (publishedVersion, cc-by)
- PubMed (publishedVersion)
- UCL Discovery (University College London) (submittedVersion)
- Funders
- Dr. Miriam and Sheldon G. Adelson Medical Research Foundation (203151/Z/16/Z)
- Cure Alzheimer's Fund
- Rush University (P30AG10161, R01AG36042, R01 AG15819, R01AG30146)
- Wellcome Trust (203151/Z/16/Z, 203151/Z/16, 203151)
- Cancer Research UK (24423)
- National Institute for Health and Care Research (R01AG15819, CL-2016-14-005, P30AG10161)
- Royal College of Surgeons of England
- Multiple Sclerosis Society
- Academy of Medical Sciences (SGL017\1009)
- Lundbeckfonden (R182-2014-2844, R193-2015-4103)
- H. Lundbeck A/S
- University of California, Irvine
- Medical Research Council (203151/Z/16/Z)
- National Institute on Aging (R01AG017917, R01AG030146, R01AG036836, R01AG048015, U01AG046152, R01AG036042, R01AG015819, P30AG010161, U01AG032984, U01AG061356, RC2AG036547, U01AG046161, RF1AG057473)
- National Institute of General Medical Sciences (T32GM008313)
- National Institute of Neurological Disorders and Stroke (T32NS007473)
- Topics
- Life Sciences › Biochemistry, Genetics and Molecular Biology › Molecular Biology › Single-cell and spatial transcriptomics
- Life Sciences › Neuroscience › Neurology › Neuroinflammation and Neurodegeneration Mechanisms
- Life Sciences › Biochemistry, Genetics and Molecular Biology › Molecular Biology › Molecular Biology Techniques and Applications
- Keywords
- microglia, enzymatic tissue dissociation, single-nucleus RNA sequencing, human brain
- MeSH terms
- Brain, Humans, Neuroglia, Sequence Analysis, RNA, Microglia, Single-Cell Analysis, Transcriptome
About these checks
Registry, retraction, Cites and statistics results are computed, not judged, with one exception: a printed reference that no index lists is read once by a model before it counts as a citation error. Claims are extracted by a model and kept only when their quote appears verbatim in the text; each cited source is then checked, with a model’s help, for whether it says what the claim relies on. Those verdicts can be wrong — read the claim’s quote and the cited source before relying on one.
A language model drew the claims from the paper on 2026-10-10, under version 3 of the claim definition (model deepseek-v4.1-flash, prompt extract-v3).
A second model labelled each claim on 2026-10-10 (model jev-1.13-20260917, definition revision gold-guideline-v0.2).
Cited sources are checked with a language model’s help (gpt-6-sol).
Statistics and arithmetic are recomputed, not judged.
Confidence bands are shown only for fields calibrated on our annotated test set. None is calibrated yet, so no band is shown.
What counts as a claim ›How we measure confidence ›How we check this ›
Are you an author, or do you see a problem with this page? Request a review
