

Imbalanced functional link between executive control network and reward network explain the online-game seeking behaviors in Internet gaming disorder
Open accessThe DOI matches its Crossref record; 61 of the 61 references it cites were found in a registry or an index.
Abstract
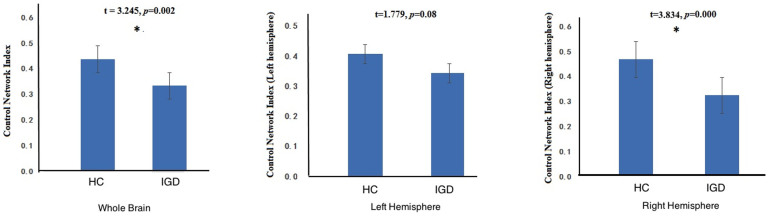
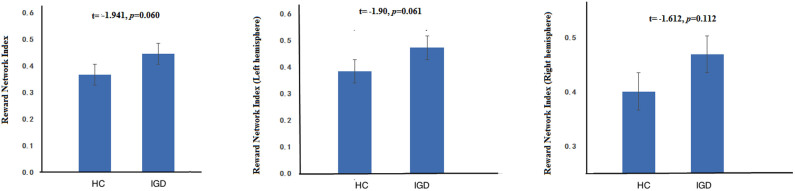
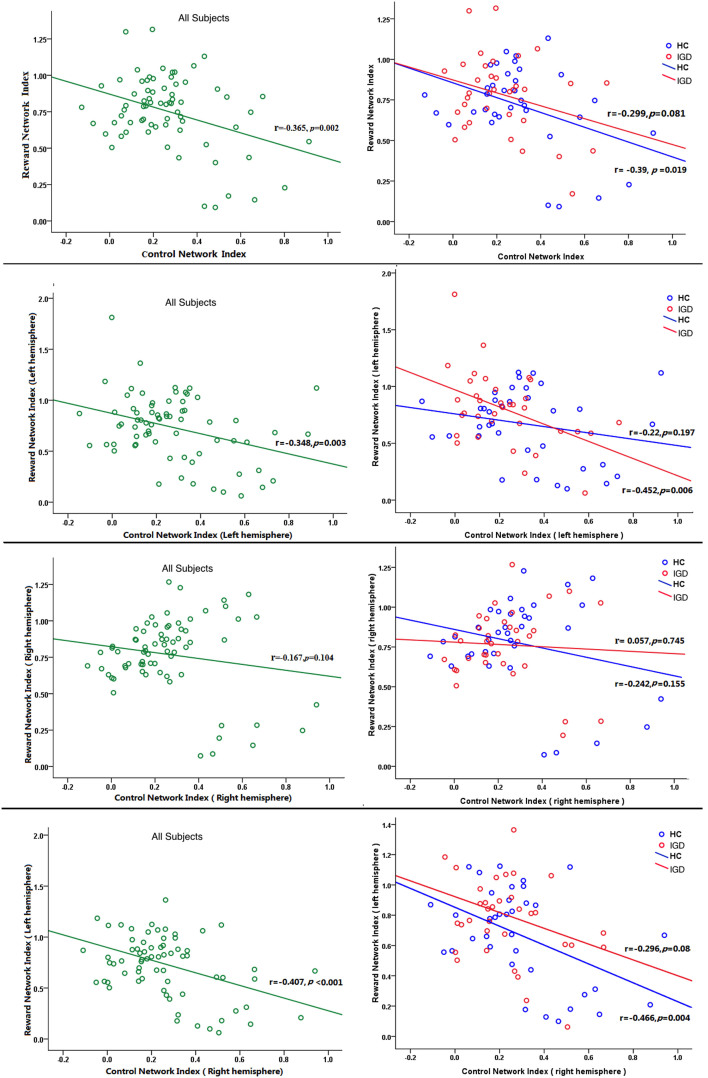
Literatures have shown that Internet gaming disorder (IGD) subjects show impaired executive control and enhanced reward sensitivities than healthy controls. However, how these two networks jointly affect the valuation process and drive IGD subjects' online-game-seeking behaviors remains unknown. Thirty-five IGD and 36 healthy controls underwent a resting-states scan in the MRI scanner. Functional connectivity (FC) was examined within control and reward network seeds regions, respectively. Nucleus accumbens (NAcc) was selected as the node to find the interactions between these two networks. IGD subjects show decreased FC in the executive control network and increased FC in the reward network when comparing with the healthy controls. When examining the correlations between the NAcc and the executive control/reward networks, the link between the NAcc - executive control network is negatively related with the link between NAcc - reward network. The changes (decrease/increase) in IGD subjects' brain synchrony in control/reward networks suggest the inefficient/overly processing within neural circuitry underlying these processes. The inverse proportion between control network and reward network in IGD suggest that impairments in executive control lead to inefficient inhibition of enhanced cravings to excessive online game playing. This might shed light on the mechanistic understanding of IGD.
Overview
The claims and statistics of this paper haven’t been checked yet.
Free: it reads the open-access text and checks the first 5 claims that cite a source we can check. Create a free account to check every claim.
Integrity signals
Registry
Cites
Statistics
Figures

Verification
Claims the paper makes
The claims and statistics of this paper haven’t been checked yet.
Free: it reads the open-access text and checks the first 5 claims that cite a source we can check. Create a free account to check every claim.
Claims other papers make about this one
Each is checked against this paper’s own text: does it say what the citing paper says it does?
The source backs part of the claim, not all of it — or backs it for a different population, condition or comparison.
In the citing paper
“the fMRI study by Dong et al. (2015) have shown that individuals with internet gaming disorders are in a state of imbalance between executive control and the reward network, and a decrease in executive control leads to an increase in motivation-seeking and craving.”
From The effect of short-form video addiction on undergraduates' academic procrastination: a moderated mediation model (2023) · cites this paper as Dong et al., 2015
Experimental — accuracy not yet measuredThe cited source says what the claim attributes to it.
In the citing paper
“Dong and colleagues propose that the imbalance between executive control and reward networks represent a mechanism seen in individuals with Internet-gaming disorder, with reductions in executive control leading to a diminished inhibition of motivation-seeking and craving, resulting in excessive Internet gaming.”
From Integrating psychological and neurobiological considerations regarding the development and maintenance of specific Internet-use disorders: An Interaction of Person-Affect-Cognition-Execution (I-PACE) model (2016) · cites this paper as Dong et al., 2015
The cited source says what the claim attributes to it.
In the citing paper
“In addition, the individuals with Internet-gaming disorder showed increased functional connectivity in reward-associated networks (including ventral striatum and orbitofrontal cortex).”
From Integrating psychological and neurobiological considerations regarding the development and maintenance of specific Internet-use disorders: An Interaction of Person-Affect-Cognition-Execution (I-PACE) model (2016) · cites this paper as Dong et al., 2015
Self-check
Percentages, sums and reported differences re-computed from the paper’s own numbers.
The self-check needs the paper’s full text.
Citations
Cites
Diagnostic and Statistical Manual of Mental Disorders
American Psychiatric Association (2013) · doi:10.1176/appi.books.9780890425596 · Cited by 116,369
An inventory for measuring depression
BECK, A. T. (1961) · Archives of General Psychiatry · doi:10.1001/archpsyc.1961.01710120031004 · Cited by 38,032 · cited 1×
“We further assessed ‘depression’ with the Beck Depression Inventory 34 and only participants scoring less than 5 were included.”
An Integrative Theory of Prefrontal Cortex Function
Miller, E. K., & Cohen, J. D. (2001) · Annual Review of Neuroscience · doi:10.1146/annurev.neuro.24.1.167 · Cited by 12,803 · cited 1×
“These two network interact in a pull and push fashion where strong motivation will lead to the disturbance of the executive control circuit, and the strong executive control will lead to the inhibition of the motivational desires 53 .”
The organization of the human cerebral cortex estimated by intrinsic functional connectivity
Thomas Yeo, B. T., Krienen, F. M., Sepulcre, J., Sabuncu, M. R., Lashkari, D., Hollinshead, M., Roffman, J. L., Smoller, J. W., Zöllei, L., Polimeni, J. R., et al. (2011) · Journal of Neurophysiology · doi:10.1152/jn.00338.2011 · Cited by 9,182
Dissociable intrinsic connectivity networks for salience processing and executive control
Seeley, W. W., Menon, V., Schatzberg, A. F., Keller, J., Glover, G. H., Kenna, H., Reiss, A. L., & Greicius, M. D. (2007) · The Journal of Neuroscience · doi:10.1523/jneurosci.5587-06.2007 · Cited by 7,426 · cited 3×
“These temporal correlations are presumed to reflect intrinsic functional connectivity (FC) and have been demonstrated across several distinct networks 28–30 .”
Scoville, W. B. (1949) · Journal of neurosurgery · doi:10.3171/jns.1949.6.1.0065 · Cited by 7,380
The organization of the human cerebellum estimated by intrinsic functional connectivity
Buckner, R. L., Krienen, F. M., Castellanos, A., Diaz, J. C., & Yeo, B. T. T. (2011) · Journal of Neurophysiology · doi:10.1152/jn.00339.2011 · Cited by 7,304
Spontaneous fluctuations in brain activity observed with functional magnetic resonance imaging
Fox, M. D., & Raichle, M. E. (2007) · Nature Reviews Neuroscience · doi:10.1038/nrn2201 · Cited by 6,700
Consistent resting-state networks across healthy subjects
Damoiseaux, J. S., Rombouts, S. A. R. B., Barkhof, F., Scheltens, P., Stam, C. J., Smith, S. M., & Beckmann, C. F. (2006) · Proceedings of the National Academy of Sciences · doi:10.1073/pnas.0601417103 · Cited by 4,326
Neural systems of reinforcement for drug addiction: from actions to habits to compulsion
Everitt, B. J., & Robbins, T. W. (2005) · Nature Neuroscience · doi:10.1038/nn1579 · Cited by 3,785
Lecrubier, Y., Sheehan, D., Weiller, E., Amorim, P., Bonora, I., Sheehan, K. H., Janavs, J., & Dunbar, G. (1997) · European Psychiatry · doi:10.1016/s0924-9338(97)83296-8 · Cited by 3,513
DPARSF: a MATLAB toolbox for “pipeline” data analysis of resting-state fMRI
Yan (2010) · Frontiers in System Neuroscience · doi:10.3389/fnsys.2010.00013 · Cited by 3,475
Dynamic predictions: Oscillations and synchrony in top–down processing
Engel, A. K., Fries, P., & Singer, W. (2001) · Nature Reviews Neuroscience · doi:10.1038/35094565 · Cited by 3,454 · cited 2×
“The temporal binding model suggests that the synchronization of brain signals between brain regions is crucial in facilitating neural communications 31 .”
Predicting human resting-state functional connectivity from structural connectivity
Honey, C. J., Sporns, O., Cammoun, L., Gigandet, X., Thiran, J. P., Meuli, R., & Hagmann, P. (2009) · Proceedings of the National Academy of Sciences · doi:10.1073/pnas.0811168106 · Cited by 3,307 · cited 1×
“These temporal correlations are presumed to reflect intrinsic functional connectivity (FC) and have been demonstrated across several distinct networks 28–30 .”
Dysfunction of the prefrontal cortex in addiction: neuroimaging findings and clinical implications
Goldstein, R. Z., & Volkow, N. D. (2011) · Nature Reviews Neuroscience · doi:10.1038/nrn3119 · Cited by 2,749 · cited 1×
“Previous studies have demonstrated that the executive control system promotes cognitive and behavioral control over motivational drives and may enable individuals to inhibit desires and reward-seeking behaviors 54–56 .”
Goldstein, R. Z., & Volkow, N. D. (2002) · American Journal of Psychiatry · doi:10.1176/appi.ajp.159.10.1642 · Cited by 2,667 · cited 1×
“…on a meta-analysis 44,45 , which suggesting two distinct lateral OFC functional sub-regions, one involved in motivation-independent reinforcer representations ( 2 23, 30, 2 12 and 16, 29, 2 13) and another in evaluation of punishers leading to change in behaviour ( 2 32, 40, 2 11 and 33, 39, 2 11).”
Regional homogeneity approach to fMRI data analysis.
Zang, Y., Jiang, T., Lu, Y., He, Y., & Tian, L. (2004) · NeuroImage · doi:10.1016/j.neuroimage.2003.12.030 · Cited by 2,614 · cited 1×
“Participantswererequiredtokeepstill,close theireyes,remainawakeandnottothinkofanythingsystematically 38,39 .”
Resting-State Functional Connectivity Reflects Structural Connectivity in the Default Mode Network
Greicius, M. D., Supekar, K., Menon, V., & Dougherty, R. F. (2009) · Cerebral Cortex · doi:10.1093/cercor/bhn059 · Cited by 2,175 · cited 1×
“They found that the neural activities during resting state are correlated across cortical regions with specific functional properties, but not random 25–27 .”
KRINGELBACH, M. (2004) · Progress in Neurobiology · doi:10.1016/j.pneurobio.2004.03.006 · Cited by 1,977 · cited 1×
“Take all, although a few of these correlations do not reach statistical significance, we can still infer that control network is negatively related with reward network.”
Decoding subject-driven cognitive states with whole-brain connectivity patterns
Shirer, W. R., Ryali, S., Rykhlevskaia, E., Menon, V., & Greicius, M. D. (2012) · Cerebral Cortex · doi:10.1093/cercor/bhr099 · Cited by 1,843 · cited 1×
“Literatures on functional networks have shown to have separable right and left hemisphere components 47–49 .”
Intrinsic functional architecture in the anaesthetized monkey brain
Vincent, J. L., Patel, G. H., Fox, M. D., Snyder, A. Z., Baker, J. T., Van Essen, D. C., Zempel, J. M., Snyder, L. H., Corbetta, M., & Raichle, M. E. (2007) · Nature · doi:10.1038/nature05758 · Cited by 1,786 · cited 1×
“…on a meta-analysis 44,45 , which suggesting two distinct lateral OFC functional sub-regions, one involved in motivation-independent reinforcer representations ( 2 23, 30, 2 12 and 16, 29, 2 13) and another in evaluation of punishers leading to change in behaviour ( 2 32, 40, 2 11 and 33, 39, 2 11).”
Spreng, R. N., Stevens, W. D., Chamberlain, J. P., Gilmore, A. W., & Schacter, D. L. (2010) · NeuroImage · doi:10.1016/j.neuroimage.2010.06.016 · Cited by 1,256
Distinct cerebellar contributions to intrinsic connectivity networks
Habas, C., Kamdar, N., Nguyen, D., Prater, K., Beckmann, C. F., Menon, V., & Greicius, M. D. (2009) · Journal of Neuroscience · doi:10.1523/jneurosci.1868-09.2009 · Cited by 1,115 · cited 1×
“Literatures on functional networks have shown to have separable right and left hemisphere components 47–49 .”
The psychometric properties of the Internet addiction test
Widyanto, L., & McMurran, M. (2004) · CyberPsychology & Behavior · doi:10.1089/cpb.2004.7.443 · Cited by 1,073 · cited 2×
“Third, the present study only revealed the current states existed in IAD subjects, we cannot draw causal conclusions between these factors.”
Neural Economics and the Biological Substrates of Valuation
Montague, P. R., & Berns, G. S. (2002) · Neuron · doi:10.1016/s0896-6273(02)00974-1 · Cited by 994 · cited 1×
“Forrewardvaluationnetwork,plentyofstudieshavesuggestedthattheorbito-frontalstriatalcircuitsupporttheconversionofdisparatetypesoffuturerewardsintoakindofinternalcurrency 18,20,21 .”
Time Discounting for Primary Rewards
McClure, S. M., Ericson, K. M., Laibson, D. I., Loewenstein, G., & Cohen, J. D. (2007) · The Journal of Neuroscience · doi:10.1523/jneurosci.4246-06.2007 · Cited by 971
Internet Addiction or Excessive Internet Use
Weinstein, A., & Lejoyeux, M. (2010) · The American Journal of Drug and Alcohol Abuse · doi:10.3109/00952990.2010.491880 · Cited by 929
'Behavioral' Addictions: Do They Exist?
Holden, C. (2001) · Science · doi:10.1126/science.294.5544.980 · Cited by 746 · cited 1×
“Further preprocessing include (1) band-pass filtering between 0.”
Brain activities associated with gaming urge of online gaming addiction
Ko, C.-H., Liu, G.-C., Hsiao, S., Yen, J.-Y., Yang, M.-J., Lin, W.-C., Yen, C.-F., & Chen, C.-S. (2009) · Journal of Psychiatric Research · doi:10.1016/j.jpsychires.2008.09.012 · Cited by 666 · cited 1×
“…on a meta-analysis 44,45 , which suggesting two distinct lateral OFC functional sub-regions, one involved in motivation-independent reinforcer representations ( 2 23, 30, 2 12 and 16, 29, 2 13) and another in evaluation of punishers leading to change in behaviour ( 2 32, 40, 2 11 and 33, 39, 2 11).”
Decision-making and addiction (part II): myopia for the future or hypersensitivity to reward?
Bechara, A., Dolan, S., & Hindes, A. (2002) · Neuropsychologia · doi:10.1016/s0028-3932(02)00016-7 · Cited by 580
Characterizing Dynamic Brain Responses with fMRI: A Multivariate Approach
Friston, K. J., Frith, C. D., Frackowiak, R. S. J., & Turner, R. (1995) · NeuroImage · doi:10.1006/nimg.1995.1019 · Cited by 568 · cited 1×
“Thetimeseriesofimagesofeachsubjectweremotion-correctedusingaleastsquaresapproachandasix-parameter(rigidbody)lineartransformation 41 .”
Dong, G., & Potenza, M. N. (2014) · Journal of Psychiatric Research · doi:10.1016/j.jpsychires.2014.07.005 · Cited by 559 · cited 1×
“In addition, reward-seeking behaviors may be reinforced through short-term online experiences, leading to a vicious cycle of addictive online game playing 7 .”
Self-citationInternet gaming disorder and the DSM‐5
Petry, N. M., & O'Brien, C. P. (2013) · Addiction · doi:10.1111/add.12162 · Cited by 521
Widyanto, L., Griffiths, M. D., & Brunsden, V. (2011) · Cyberpsychology, Behavior, and Social Networking · doi:10.1089/cyber.2010.0151 · Cited by 298 · cited 1×
“The IAT was proved to be a valid and reliable instrument that can be used in classifying IAD 36,37 .”
Cognitive enhancement as a treatment for drug addictions
Sofuoglu, M., DeVito, E. E., Waters, A. J., & Carroll, K. M. (2013) · Neuropharmacology · doi:10.1016/j.neuropharm.2012.06.021 · Cited by 298
Dong, G., Lu, Q., Zhou, H., & Zhao, X. (2010) · Neuroscience Letters · doi:10.1016/j.neulet.2010.09.002 · Cited by 296 · cited 1×
“Task based fMRI studies also demonstrated that IGD subjects showed reduced response inhibitions than healthy controls 8,9,11,12 .”
Self-citationCognitive control of drug craving inhibits brain reward regions in cocaine abusers
Volkow, N. D., Fowler, J. S., Wang, G.-J., Telang, F., Logan, J., Jayne, M., Ma, Y., Pradhan, K., Wong, C., & Swanson, J. M. (2010) · NeuroImage · doi:10.1016/j.neuroimage.2009.10.088 · Cited by 283
Dong, G., Huang, J., & Du, X. (2011) · Journal of Psychiatric Research · doi:10.1016/j.jpsychires.2011.06.017 · Cited by 258 · cited 1×
“Task based fMRI studies have shown evidences that the reward sensitivity is elevated among IGD subjects when comparing to healthy controls 2,9,14,15 in both mild and extreme situations.”
Self-citationPrecursor or Sequela: Pathological Disorders in People with Internet Addiction Disorder
Dong, G., Lu, Q., Zhou, H., & Zhao, X. (2011) · PLoS ONE · doi:10.1371/journal.pone.0014703 · Cited by 217
Self-citationYoung, K. S. (2015) · PsycTESTS Dataset · doi:10.1037/t41898-000 · Cited by 210
Dong, G., Lin, X., Zhou, H., & Lu, Q. (2014) · Addictive Behaviors · doi:10.1016/j.addbeh.2013.11.028 · Cited by 206
Self-citationKo, C.-H., Liu, G.-C., Yen, J.-Y., Yen, C.-F., Chen, C.-S., & Lin, W.-C. (2013) · Journal of Psychiatric Research · doi:10.1016/j.jpsychires.2012.11.008 · Cited by 186
Pawlikowski, M., & Brand, M. (2011) · Psychiatry Research · doi:10.1016/j.psychres.2011.05.017 · Cited by 178
Dong, G., Zhou, H., & Zhao, X. (2011) · Neuroscience Letters · doi:10.1016/j.neulet.2011.05.047 · Cited by 167
Self-citationDong, G., Hu, Y., Lin, X., & Lu, Q. (2013) · Biological Psychology · doi:10.1016/j.biopsycho.2013.07.009 · Cited by 159 · cited 2×
“Studies revealed that IGD subjects show diminished consideration of experiential outcomes when making future decisions 52 .”
Self-citationLittel, M., van den Berg, I., Luijten, M., van Rooij, A. J., Keemink, L., & Franken, I. H. A. (2012) · Addiction Biology · doi:10.1111/j.1369-1600.2012.00467.x · Cited by 154 · cited 1×
“…on a meta-analysis 44,45 , which suggesting two distinct lateral OFC functional sub-regions, one involved in motivation-independent reinforcer representations ( 2 23, 30, 2 12 and 16, 29, 2 13) and another in evaluation of punishers leading to change in behaviour ( 2 32, 40, 2 11 and 33, 39, 2 11).”
Zhou, Z., Yuan, G., & Yao, J. (2012) · PLoS ONE · doi:10.1371/journal.pone.0048961 · Cited by 153 · cited 3×
“Such response tendencies appear to be influenced by online-gaming related stimuli, with worse performance seen in IGD than in non-IGD subjects 9 .”
Dong, G., DeVito, E., Huang, J., & Du, X. (2012) · Journal of Psychiatric Research · doi:10.1016/j.jpsychires.2012.05.015 · Cited by 140
Self-citationThe Orbital Prefrontal Cortex and Drug Addiction in Laboratory Animals and Humans
EVERITT, B. J., HUTCHESON, D. M., ERSCHE, K. D., PELLOUX, Y., DALLEY, J. W., & ROBBINS, T. W. (2007) · Annals of the New York Academy of Sciences · doi:10.1196/annals.1401.022 · Cited by 139
Enhanced cue reactivity and fronto-striatal functional connectivity in cocaine use disorders
Wilcox, C. E., Teshiba, T. M., Merideth, F., Ling, J., & Mayer, A. R. (2011) · Drug and Alcohol Dependence · doi:10.1016/j.drugalcdep.2011.01.009 · Cited by 133 · cited 1×
“For the OFC, seeds were defined based on a meta-analysis 44,45 , which suggesting two distinct lateral OFC functional sub-regions, one involved in motivation-independent reinforcer representations ( 2 23, 30, 2 12 and 16, 29, 2 13) and another in evaluation of punishers leading to change in…”
Resting-State Neural Activity across Face-Selective Cortical Regions Is Behaviorally Relevant
Zhu, Q., Zhang, J., Luo, Y. L. L., Dilks, D. D., & Liu, J. (2011) · Journal of Neuroscience · doi:10.1523/jneurosci.0873-11.2011 · Cited by 126 · cited 1×
“Literatures have also proved that the resting FC can be a predictor of behavioral performance 26,32 .”
Reward/punishment sensitivities among internet addicts: Implications for their addictive behaviors
Dong, G., Hu, Y., & Lin, X. (2013) · Progress in Neuro-Psychopharmacology and Biological Psychiatry · doi:10.1016/j.pnpbp.2013.07.007 · Cited by 117
Self-citationThe central extended amygdala network as a proposed circuit underlying reward valuation
Waraczynski, M. A. (2005) · Neuroscience & Biobehavioral Reviews · doi:10.1016/j.neubiorev.2005.09.001 · Cited by 117
Barrós‐Loscertales, A., Bustamante, J. C., Ventura‐Campos, N., Llopis, J., Parcet, M. A., & Ávila, C. (2011) · Psychiatry Research Neuroimaging · doi:10.1016/j.pscychresns.2011.05.001 · Cited by 87
Neuroeconomics and the Study of Addiction
Monterosso, J. R., Piray, P., & LUO, S. H. (2012) · Biological Psychiatry · doi:10.1016/j.biopsych.2012.03.012 · Cited by 79 · cited 1×
“Forrewardvaluationnetwork,plentyofstudieshavesuggestedthattheorbito-frontalstriatalcircuitsupporttheconversionofdisparatetypesoffuturerewardsintoakindofinternalcurrency 18,20,21 .”
Dong, G., Shen, Y., Huang, J., & Du, X. (2013) · European Addiction Research · doi:10.1159/000346783 · Cited by 73 · cited 3×
“Apparent set-shifting and cognitive control deficits in IGD may be related to the inefficient processing within neural circuitry underlying these processes, with some of these neural measures relating to IGD severity 12 .”
Self-citationKrmpotich, T. D., Tregellas, J. R., Thompson, L. L., Banich, M. T., Klenk, A. M., & Tanabe, J. L. (2013) · Drug and Alcohol Dependence · doi:10.1016/j.drugalcdep.2013.01.021 · Cited by 70
Your Resting Brain CAREs about Your Risky Behavior
Cox, C. L., Gotimer, K., Roy, A. K., Castellanos, F. X., Milham, M. P., & Kelly, C. (2010) · PLoS ONE · doi:10.1371/journal.pone.0012296 · Cited by 52
Altered regional homogeneity in motor cortices in patients with multiple system atrophy
You, H., Wang, J., Wang, H., Zang, Y., Zheng, F., Meng, C., & Feng, F. (2011) · Neuroscience Letters · doi:10.1016/j.neulet.2011.07.015 · Cited by 47 · cited 2×
“Participantswererequiredtokeepstill,close theireyes,remainawakeandnottothinkofanythingsystematically 38,39 .”
Patterns of Choices on Video Game Genres and Internet Addiction
Floros, G., & Siomos, K. (2012) · Cyberpsychology, Behavior, and Social Networking · doi:10.1089/cyber.2012.0064 · Cited by 42
Imbalanced functional link between valuation networks in abstinent heroin-dependent subjects
Xie, C., Shao, Y., Ma, L., Zhai, T., Ye, E., Fu, L., Bi, G., Chen, G., Cohen, A., Li, W., et al. (2014) · Molecular Psychiatry · doi:10.1038/mp.2012.169 · Cited by 41 · cited 2×
“In this study, we selected the nucleus accumbens (NAcc) region as a connective node or a ‘seed’ region tolink between the control and reward networks because the NAcc has an important role in addiction 46 , and were proved to be a valuable connective node in addiction studies 21 .”
Self-citation
Cited by
Brand, M., Young, K. S., Laier, C., Wölfling, K., & Potenza, M. N. (2016) · Neuroscience & Biobehavioral Reviews · doi:10.1016/j.neubiorev.2016.08.033 · Cited by 2,416
“…by eeking a short-term attractive behavior that results in the expeience of gratification despite negative long-term consequences. his hypothesized type of dysfunctional interaction between exective control and reward-seeking has been emphasized recently y the fMRI study of Dong et al. (2015).”
Neuroscience of Internet Pornography Addiction: A Review and Update
Love, T., Laier, C., Brand, M., Hatch, L., & Hajela, R. (2015) · Behavioral Sciences · doi:10.3390/bs5030388 · Cited by 262
“Categorized by technology, these brain studies comprise 44 fMRI studies [103,132,134,135,160–199],”
MethodSugaya, N., Shirasaka, T., Takahashi, K., & Kanda, H. (2019) · BioPsychoSocial Medicine · doi:10.1186/s13030-019-0144-5 · Cited by 194
Dong, G., & Potenza, M. N. (2016) · Journal of Psychiatric Research · doi:10.1016/j.jpsychires.2015.11.011 · Cited by 163
Self-citationDong, G., Li, H., Wang, L., & Potenza, M. N. (2017) · European Psychiatry · doi:10.1016/j.eurpsy.2017.03.004 · Cited by 139
“Studies suggest enhanced reward sensitivity and decreased loss sensitivity in IGD subjects [28,41–43].”
BackgroundResultInfluentialSelf-citation
Metadata
- Authors
- Dong, G., Lin, X., Hu, Y., Xie, C., & Du, X.
- Affiliations
- Zhejiang Normal University (CN)
- University of Reading (GB)
- Southeast University (CN)
- East China Normal University (CN)
- Corresponding author
- Dong, Guangheng
- Venue
- Scientific Reports
- Published
- 2015-03-17
- Volume
- 5
- Issue
- 1
- Pages
- 9197-9197
- ISSN
- 2045-2322 (ISSN-L)
- PMC
- PMC4361884
- OpenAlex
- W1983375484
- Cited by
- 76
- References
- 61
- Citations by year
- 2026: 6 · 2025: 9 · 2024: 3 · 2023: 5 · 2022: 9 · 2021: 4 · 2020: 6 · 2019: 9 · 2018: 3 · 2017: 10 · 2016: 8 · 2015: 4
- FWCI
- 27.65
- Type
- journal article
- Language
- en
- Open access
- gold
- doi.org
- Licence
- cc-by
- creativecommons.org/licenses/by/4.0 (tdm)
- creativecommons.org/licenses/by/4.0 (vor)
- Locations
- Scientific Reports (publishedVersion, cc-by)
- PubMed Central (publishedVersion, cc-by)
- PubMed (publishedVersion)
- CentAUR (University of Reading) (acceptedVersion)
- London Met Repository (London Metropolitan University) (acceptedVersion)
- Funders
- National Natural Science Foundation of China (31371023)
- Topics
- Social Sciences › Sociology and Political Science › Impact of Technology on Adolescents
- Life Sciences › Neuroscience › Cognitive Neuroscience › Functional Brain Connectivity Studies
- Social Sciences › Psychology › Clinical Psychology › Gambling Behavior and Treatments
- Keywords
- internet gaming disorder, frontoparietal network, reward network, functional connectivity, nucleus accumbens, craving, resting-state functional connectivity, reward sensitivity
- MeSH terms
- Adult, Mental Disorders, Brain, Brain Mapping, Humans, Magnetic Resonance Imaging, Male, Play and Playthings, Case-Control Studies, Behavior, Addictive, Internet, Young Adult, Executive Function
About these checks
Registry, retraction, Cites and statistics results are computed, not judged, with one exception: a printed reference that no index lists is read once by a model before it counts as a citation error. Claims are extracted by a model and kept only when their quote appears verbatim in the text; each cited source is then checked, with a model’s help, for whether it says what the claim relies on. Those verdicts can be wrong — read the claim’s quote and the cited source before relying on one.
Statistics and arithmetic are recomputed, not judged.
Confidence bands are shown only for fields calibrated on our annotated test set. None is calibrated yet, so no band is shown.
What counts as a claim ›How we measure confidence ›How we check this ›
Are you an author, or do you see a problem with this page? Request a review
Data sources
Bibliographic data: Semantic Scholar, OpenAlex, Crossref.
Contains information from the Semantic Scholar Academic Graph Datasets, made available under the ODC Attribution License (ODC-BY 1.0).
Semantic Scholar’s data is described in: Kinney, R., et al. (2023). The Semantic Scholar Open Data Platform. arXiv:2301.10140.
