

Pericentromeric noncoding RNA changes DNA binding of CTCF and inflammatory gene expression in senescence and cancer
Open accessThe DOI matches its Crossref record; 53 of the 53 references it cites were found in a registry or an index.
Abstract
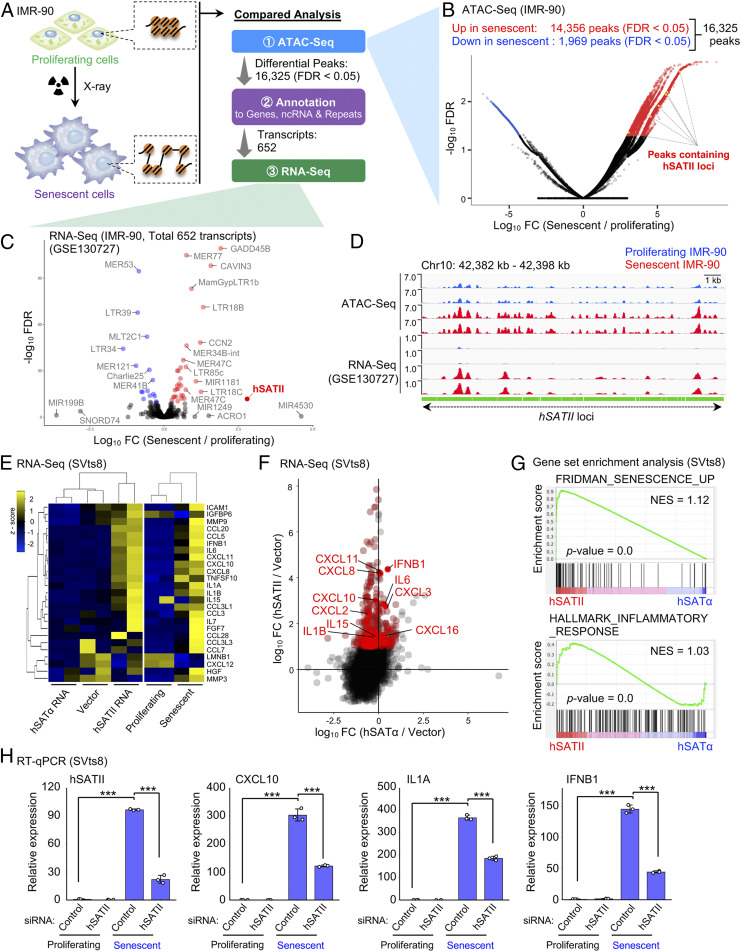
Significance: During the aging process, senescent cells secrete inflammatory factors, causing various age-related pathologies. Thus, controlling the senescence-associated secretory phenotype (SASP) can tremendously benefit human health. Although SASP seems to be induced by the alteration of chromosomal organization, its underlying mechanism remains unclear. Here, it has been revealed that noncoding RNA (ncRNA) transcribed from pericentromeric repetitive elements impairs the DNA binding of CCCTC-binding factor, resulting in the alteration of chromosomal accessibility and the activation of SASP-like inflammatory genes. Notably, the ncRNA was transferred into surrounding cells via small extracellular vesicles, acting as a tumorigenic SASP factor. Our study highlights a novel mechanism regulating chromatin interaction and inflammatory gene expression in senescence and cancer.
Overview
The claims and statistics of this paper haven’t been checked yet.
Free: it reads the open-access text and checks the first 5 claims that cite a source we can check. Create a free account to check every claim.
Integrity signals
Registry
Cites
Statistics
Figures


Verification
Claims the paper makes
The claims and statistics of this paper haven’t been checked yet.
Free: it reads the open-access text and checks the first 5 claims that cite a source we can check. Create a free account to check every claim.
Claims other papers make about this one
Each is checked against this paper’s own text: does it say what the citing paper says it does?
The source backs part of the claim, not all of it — or backs it for a different population, condition or comparison.
In the citing paper
“Since previous studies have shown that elevated SASP in CAFs contributes to the development of cancers (11, 21, 41, 42), chromatin conformational changes at hSATII might promote the malignant transformation or cancer progression (Fig. 4E).”
From Chromatin conformational changes at human satellite II contribute to the senescence phenotype in the tumor microenvironment (2023) · cites this paper as [11]
Experimental — accuracy not yet measuredThe source backs part of the claim, not all of it — or backs it for a different population, condition or comparison.
In the citing paper
“We previously showed that the hSATII RNA transcribed from the pericentromeric region itself promotes the development of the cellular senescence phenotype (11).”
From Chromatin conformational changes at human satellite II contribute to the senescence phenotype in the tumor microenvironment (2023) · cites this paper as [11]
Experimental — accuracy not yet measuredThe cited source says what the claim attributes to it.
In the citing paper
“Recent studies revealed that besides cancer cells (7), other cells in the tumor microenvironment (TME), such as fibroblasts (8–11) and endothelial cells (12–14), undergo cellular senescence or display senescence-like phenotypic alterations that promote cancer progression.”
From Chromatin conformational changes at human satellite II contribute to the senescence phenotype in the tumor microenvironment (2023) · cites this paper as [11]
The cited source says what the claim attributes to it.
In the citing paper
“which can result in tumorigenic SASP-like inflammatory gene expression by altering chromosome interactions through the direct disruption of the binding of CCCTC-binding factor (CTCF) to DNA (11, 21).”
From Chromatin conformational changes at human satellite II contribute to the senescence phenotype in the tumor microenvironment (2023) · cites this paper as [11]
The cited source says what the claim attributes to it.
In the citing paper
“Increased chromatin accessibility of the pericentromeric hSATII loci in senescent fibroblasts as determined by formaldehyde-assisted isolation of regulatory element sequencing (23) and assay for transposase-accessible chromatin with sequencing (ATAC-seq) validated this distention (11, 21).”
From Chromatin conformational changes at human satellite II contribute to the senescence phenotype in the tumor microenvironment (2023) · cites this paper as [11]
5 more claims about this paper
Create a free account to see every claim other papers make about this one.
Self-check
Percentages, sums and reported differences re-computed from the paper’s own numbers.
The self-check needs the paper’s full text.
Citations
Cites
The biology , function , and biomedical applications of exosomes
Kalluri, R., & LeBleu, V. S. (2020) · Science · doi:10.1126/science.aau6977 · Cited by 10,770 · cited 1×
“We and others recently reported that small EVs secreted from cancer cells and/or senescent stromal cells dynamically contribute to tumor incidence and progression in a non – cell-autonomous manner in the tumor microenvironment (38 – 41).”
A 3D Map of the Human Genome at Kilobase Resolution Reveals Principles of Chromatin Looping
Rao, S. S. P., Huntley, M. H., Durand, N. C., Stamenova, E. K., Bochkov, I. D., Robinson, J. T., Sanborn, A. L., Machol, I., Omer, A. D., Lander, E. S., et al. (2014) · Cell · doi:10.1016/j.cell.2014.11.021 · Cited by 9,212 · cited 1×
“F ) (34).”
Reassessment of exosome composition
Jeppesen, D. K., Fenix, A. M., Franklin, J. L., Higginbotham, J. N., Zhang, Q., Zimmerman, L. J., Liebler, D. C., Ping, J., Liu, Q., Evans, R., et al. (2019) · Cell · doi:10.1016/j.cell.2019.02.029 · Cited by 2,975 · cited 1×
“From an analysis of recently published RNA-seq data (42), we discovered that hSATII RNA could be detected in exosomes, a type of EV, secreted from cells of different human colon cancer cell lines (SI Appendix, Fig.”
Cellular senescence: from physiology to pathology
Muñoz-Espín, D., & Serrano, M. (2014) · Nature Reviews Molecular Cell Biology · doi:10.1038/nrm3823 · Cited by 2,818
Cohesin Loss Eliminates All Loop Domains
Rao, S. S. P., Huang, S.-C., Glenn St Hilaire, B., Engreitz, J. M., Perez, E. M., Kieffer-Kwon, K.-R., Sanborn, A. L., Johnstone, S. E., Bascom, G. D., Bochkov, I. D., et al. (2017) · Cell · doi:10.1016/j.cell.2017.09.026 · Cited by 1,883 · cited 14×
“We conclude that pericentromeric satellite RNA plays a prominent role in tumorigenesis by cell-autonomous and non – cell-autonomous pathways in vivo: 1) DNA damage caused by various oncogenic stresses induces cellular senescence of normal epithelial cells, thereby acting as a tumor-suppressor mechanism.”
InfluentialSenescence in Health and Disease
He, S., & Sharpless, N. E. (2017) · Cell · doi:10.1016/j.cell.2017.05.015 · Cited by 1,766
Chromosomal instability drives metastasis through a cytosolic DNA response
Bakhoum, S. F., Ngo, B., Laughney, A. M., Cavallo, J.-A., Murphy, C. J., Ly, P., Shah, P., Sriram, R. K., Watkins, T. B. K., Taunk, N. K., et al. (2018) · Nature · doi:10.1038/nature25432 · Cited by 1,593 · cited 13×
“Together, these findings show that pericentromeric hSATII RNA in small EVs secreted from senescent cells promote SASP-like inflammatory gene expression and CIN in neighboring cells in the tumor microenvironment.”
InfluentialCytoplasmic chromatin triggers inflammation in senescence and cancer
Dou, Z., Ghosh, K., Vizioli, M. G., Zhu, J., Sen, P., Wangensteen, K. J., Simithy, J., Lan, Y., Lin, Y., Zhou, Z., et al. (2017) · Nature · doi:10.1038/nature24050 · Cited by 1,335
L1 drives IFN in senescent cells and promotes age-associated inflammation
De Cecco, M., Ito, T., Petrashen, A. P., Elias, A. E., Skvir, N. J., Criscione, S. W., Caligiana, A., Brocculi, G., Adney, E. M., Boeke, J. D., et al. (2019) · Nature · doi:10.1038/s41586-018-0784-9 · Cited by 1,255 · cited 1×
“Recent studies have reported that abnormal nuclear morphologies, observed as micronuclei or nuclear buds, induce SASP gene expression via the activation of the DNA-sensing pathway during cellular senescence (8 – 12).”
Innate immune sensing of cytosolic chromatin fragments through cGAS promotes senescence
Glück, S., Guey, B., Gulen, M. F., Wolter, K., Kang, T.-W., Schmacke, N. A., Bridgeman, A., Rehwinkel, J., Zender, L., & Ablasser, A. (2017) · Nature Cell Biology · doi:10.1038/ncb3586 · Cited by 1,196
Cited by
Cai, Y., Song, W., Li, J., Jing, Y., Liang, C., Zhang, L., Zhang, X., Zhang, W., Liu, B., An, Y., et al. (2022) · Science China Life Sciences · doi:10.1007/s11427-022-2161-3 · Cited by 408
Cellular rejuvenation: molecular mechanisms and potential therapeutic interventions for diseases
Ji, S., Xiong, M., Chen, H., Liu, Y., Zhou, L., Hong, Y., Wang, M., Wang, C., Fu, X., & Sun, X. (2023) · Signal Transduction and Targeted Therapy · doi:10.1038/s41392-023-01343-5 · Cited by 159
“The pericentromeric ncRNAs can be transported into neighboring cells via extracellular vesicles (EVs), and impaired the DNA binding of the CCCTC-binding factor to modify chromosomal accessibility and trigger an SASP-like inflammatory response.(38)”
BackgroundStress, epigenetics, and aging: Unraveling the intricate crosstalk
Wu, Z., Qu, J. T., Zhang, W., & Liu, G. (2023) · Molecular Cell · doi:10.1016/j.molcel.2023.10.006 · Cited by 152
CTCF shapes chromatin structure and gene expression in health and disease
Dehingia, B., Milewska, M., Janowski, M., & Pękowska, A. (2022) · EMBO Reports · doi:10.15252/embr.202255146 · Cited by 149
“Global transcriptional inhibition blocks CTCF binding primarily at promoters, which suggests a positive role of RNA in CTCF binding at these locations (Hansen et al , 2019; Salda ~ na-Meyer et al , 2019; Miyata et al , 2021).”
Epigenetic Regulation of Inflammatory Signaling and Inflammation-Induced Cancer
Tan, S. Y. X., Zhang, J., & Tee, W. (2022) · Frontiers in Cell and Developmental Biology · doi:10.3389/fcell.2022.931493 · Cited by 91
“In a similar vein, human lung fibroblasts exposed to X-rayinduced senescence elicited a dramatic increase in ncRNA expression from pericentromeric repetitive loci known as human satellite II (hSATII), which are usually repressed in healthy cells (Miyata et al., 2021).”
BackgroundInfluential
Metadata
- Authors
- Miyata, K., Imai, Y., Hori, S., Nishio, M., Loo, T. M., Okada, R., Yang, L., Nakadai, T., Maruyama, R., Fujii, R., Ueda, K., Jiang, L., Zheng, H., Toyokuni, S., Sakata, T., Shirahige, K., Kojima, R., Nakayama, M., Oshima, M., Nagayama, S., Seimiya, H., Hirota, T., Saya, H., Hara, E., & Takahashi, A.
- Affiliations
- Japanese Foundation For Cancer Research (JP)
- Nagoya University (JP)
- Institute for Quantitative Biosciences, The University of Tokyo (JP)
- Japan Science and Technology Agency (JP)
- Kanazawa University (JP)
- The Cancer Institute Hospital (JP)
- Keio University (JP)
- Research Institute for Microbial Diseases, The University of Osaka (JP)
- Japan Agency for Medical Research and Development (JP)
- Corresponding author
- Takahashi, Akiko
- ORCID
- Venue
- Proceedings of the National Academy of Sciences
- Publisher
- National Academy of Sciences
- Published
- 2021-08-23
- Volume
- 118
- Issue
- 35
- ISSN
- 0027-8424 (ISSN-L)
- 1091-6490
- PMC
- PMC8536346
- OpenAlex
- W3195865705
- Cited by
- 74
- References
- 53
- Citations by year
- 2026: 15 · 2025: 8 · 2024: 15 · 2023: 19 · 2022: 17
- FWCI
- 8.00
- Type
- journal article
- Language
- en
- Open access
- hybrid
- doi.org
- Licence
- Locations
- Proceedings of the National Academy of Sciences (publishedVersion, cc-by-nc-nd)
- Europe PMC (PubMed Central) (publishedVersion, other-oa)
- PubMed Central (publishedVersion, cc-by-nc-nd)
- PubMed (publishedVersion)
- Funders
- PRESTO, Japan Science and Technology Agency (JPMJPR17H7)
- PRIME, Japan Agency of Medical Research and Development (19gm6110023h0001)
- Japan Society for the Promotion of Science (19H03507, 18K15254, 19J00796, 20K16344)
- Princess Takamatsu Cancer Research Fund (12-24412)
- Mitsubishi Foundation (201910023)
- Takeda Science Foundation (1967333-1)
- Moonshot R&D, Japan Science and Technology Agency (JPMJPS2022)
- Topics
- Life Sciences › Biochemistry, Genetics and Molecular Biology › Cell Biology › Telomeres, Telomerase, and Senescence
- Life Sciences › Biochemistry, Genetics and Molecular Biology › Molecular Biology › Genomics and Chromatin Dynamics
- Life Sciences › Biochemistry, Genetics and Molecular Biology › Aging › Genetics, Aging, and Longevity in Model Organisms
- Keywords
- CTCF, cellular senescence, senescence-associated secretory phenotype, inflammatory gene expression, chromatin accessibility, small extracellular vesicles, carcinogenesis, aging, chromosomal instability
- MeSH terms
- Senescence-Associated Secretory Phenotype, Aging, Animals, Centromere, DNA, DNA-Binding Proteins, DNA, Neoplasm, Female, Gene Expression Regulation, Humans, Inflammation, Mice, Inbred BALB C, Neoplasms, Protein Binding, Cellular Senescence, RNA, Untranslated, Mice, HEK293 Cells
About these checks
Registry, retraction, Cites and statistics results are computed, not judged, with one exception: a printed reference that no index lists is read once by a model before it counts as a citation error. Claims are extracted by a model and kept only when their quote appears verbatim in the text; each cited source is then checked, with a model’s help, for whether it says what the claim relies on. Those verdicts can be wrong — read the claim’s quote and the cited source before relying on one.
Statistics and arithmetic are recomputed, not judged.
Confidence bands are shown only for fields calibrated on our annotated test set. None is calibrated yet, so no band is shown.
What counts as a claim ›How we measure confidence ›How we check this ›
Are you an author, or do you see a problem with this page? Request a review
How to cite
Cite CoChat for the checks on this page, and the paper for its own findings.
- This page
- CoChat. (2026). Citation check: Pericentromeric noncoding RNA changes DNA binding of CTCF and inflammatory gene expression in senescence and cancer. https://app.cochat.ai/papers/10.1073/pnas.2025647118
- The paper
- Miyata, K., Imai, Y., Hori, S., Nishio, M., Loo, T. M., Okada, R., Yang, L., Nakadai, T., Maruyama, R., Fujii, R., Ueda, K., Jiang, L., Zheng, H., Toyokuni, S., Sakata, T., Shirahige, K., Kojima, R., Nakayama, M., Oshima, M., . . . Takahashi, A. (2021). Pericentromeric noncoding RNA changes DNA binding of CTCF and inflammatory gene expression in senescence and cancer. Proceedings of the National Academy of Sciences. https://doi.org/10.1073/pnas.2025647118
Data sources
Bibliographic data: Semantic Scholar, OpenAlex, Crossref.
Contains information from the Semantic Scholar Academic Graph Datasets, made available under the ODC Attribution License (ODC-BY 1.0).
Semantic Scholar’s data is described in: Kinney, R., et al. (2023). The Semantic Scholar Open Data Platform. arXiv:2301.10140.
