

The DOI matches its Crossref record; 65 of the 65 references it cites were found in a registry or an index; 19 of the 62 sources its claims cite were checked for support.
Saliva microbiome alterations in dental fluorosis population
Open accessAbstract
Background We aimed to explore saliva microbiome alterations in dental fluorosis population.Methods The prevalence of dental fluorosis was examined in 957 college students. Dean’s fluorosis index was used to evaluate the dental fluorosis status. Changes in the composition of the salivary microbiome were assessed in a subset of these patients (100 healthy controls, 100 dental fluorosis patients).Results Dental fluorosis affected 47% of the student sample, and incidence was unrelated to gender. Compared with healthy controls, the microbiota of patients with dental fluorosis exhibited increased diversity, with increased abundance of Treponema lecithinolyticum, Vibrio metschnikovii, Cupriavidus pauculus, Pseudomonas, Pseudomonadaceae, Pseudomonadales, and decreased abundance of Streptococcus mutans, Streptococcus sanguinis, Gemella, and Staphylococcales. Function analyses showed increases in arginine biosynthesis in patients affected by dental fluorosis, together with reductions in amino sugar and nucleotide sugar metabolism, fructose and mannose metabolism, and starch and sucrose metabolism.Conclusions These results suggest that there are striking differences in salivary microbiome between healthy controls and dental fluorosis patients. Dental fluorosis may contribute to periodontitis and systemic lung diseases. There is a need for cohort studies to determine whether altering the salivary microbiota in dental fluorosis patients can alter the development of oral or systemic diseases.
Overview
AI snapshot
Written from the paper’s full text.
TL;DR
Salivary microbiome profiling in college students found dental fluorosis prevalence of 47% and distinct oral microbial composition in affected individuals, including higher richness and altered taxa. The authors suggest these changes may relate to periodontitis and systemic lung disease risk, but cohort studies are needed.
Key findings
- Among 957 college students, dental fluorosis prevalence was 47% (n = 450), with no significant difference by gender (P = 0.114) or severity by gender (P = 0.976).
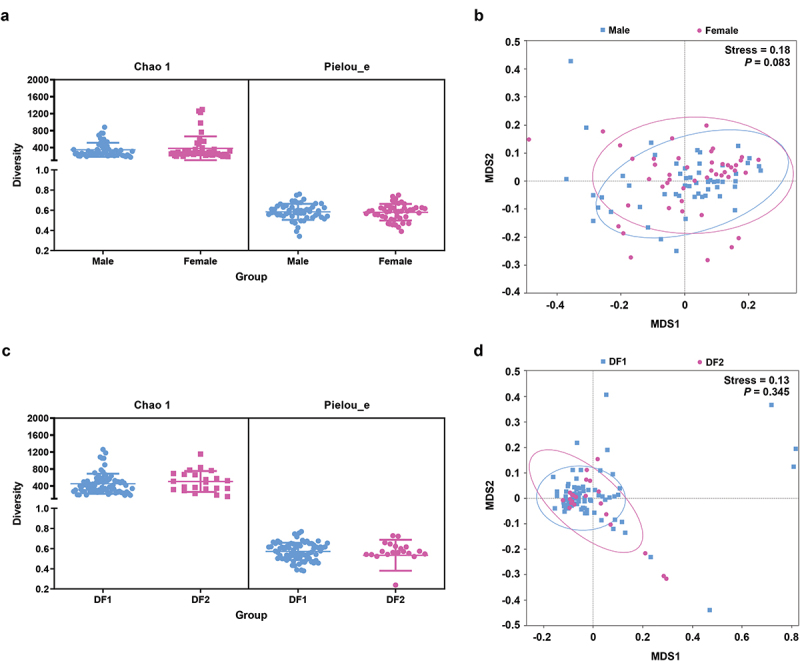
- The dental fluorosis group had increased salivary α-diversity richness (Chao1, P < 0.001) but no significant evenness difference (Pielou_e, P = 0.364); β-diversity differed significantly (Bray-Curtis, P = 0.001).
- Increased taxa in dental fluorosis included Treponema lecithinolyticum, Vibrio metschnikovii, Cupriavidus pauculus, Pseudomonas, Pseudomonadaceae, and Pseudomonadales; decreased taxa included Streptococcus mutans (P = 0.004), Streptococcus sanguinis, Gemella, and Staphylococcales.
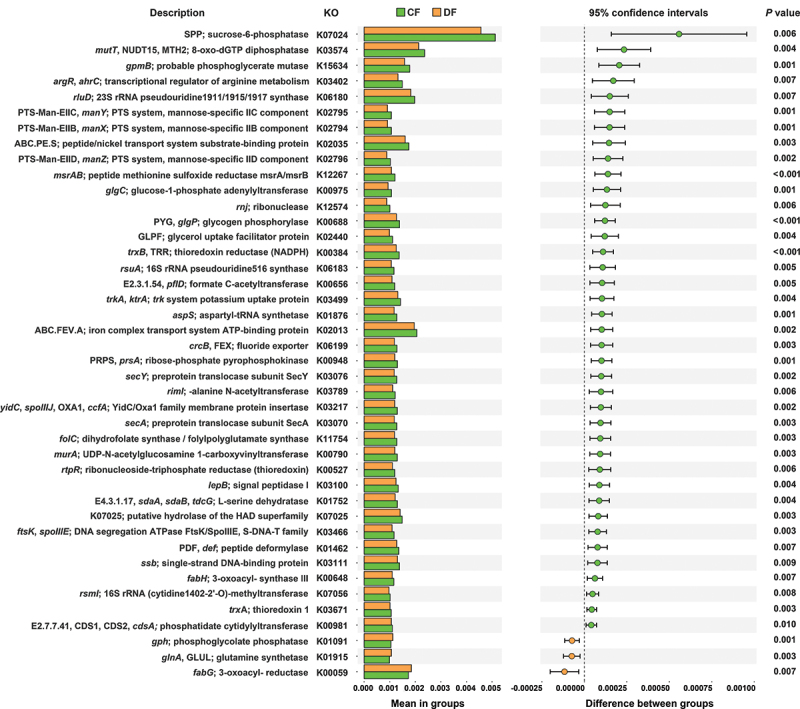
- PICRUSt2 predicted increased arginine biosynthesis and reductions in amino sugar/nucleotide sugar metabolism, fructose/mannose metabolism, and starch/sucrose metabolism; >90% of functional genes were under-represented in the dental fluorosis group.
Methods
- Cross-sectional study at Bengbu Medical College, China: 957 students screened for dental fluorosis using Dean’s fluorosis index; microbiome analyses used a subset of 100 healthy controls and 100 dental fluorosis patients (abstract), with Results/Discussion describing 199 samples (100 controls, 99 dental fluorosis).
- Saliva samples underwent 16S rRNA V3–V4 sequencing; taxonomic classification used SILVA v138.1 and NCBI; analyses included Chao1, Pielou_e, NMDS on Bray-Curtis distances, Metastats, random forest with ROC curves, and PICRUSt2.
- Statistics used SPSS 20.0 with Pearson chi-square, continuity correction, or Fisher’s exact test (P < 0.05); microbiome differential abundance used Metastats with corrected P < 0.05.
Limitations
- Stated: only college students were recruited, potentially limiting accuracy and generalizability of dental fluorosis prevalence; the authors note the need for long-term cohort studies to understand mechanisms and disease incidence.
- Evident: the cross-sectional design cannot establish whether salivary microbiome changes contribute to or result from dental fluorosis.
- Evident: the text contains a sample-count inconsistency—the abstract states 100 dental fluorosis patients, while Results/Discussion describe 199 samples (100 controls, 99 dental fluorosis).
Model-written summary. Check it against the paper before relying on it.
Integrity signals
Registry
Cites
Statistics
Figures
Verification
Claims the paper makes
25 Own result · 18 Not checked yet · 11 Own interpretation · 8 No full text of the sources · 4 Partly supported · 3 Own method · 2 Supported · 2 No basis given · 1 Supported so far · accuracy not yet measured
Every source the paper cites for this claim was checked and supports it.
In the paper
“The specific differences in bacterial species observed in this study are inconsistent with those in the article published by Wang et al [23].”
§ Saliva microbiome alterations in dental fluorosis population > Discussion
What the sources say
- Supportedcites [23] Wang Q, Chen X, Hu H, et al. Structural changes in the oral microbiome of the adolescent patients with moderate or severe dental fluorosis. Sci Rep. 2021; 11: 2897. 33536555 PMC7859183 source
The Results section (‘Differentially represented species in M&S and healthy groups’) identifies specific bacterial species enriched in adolescents with moderate or severe dental fluorosis and others associated with the healthy group. The statement that these differ from the citing study’s findings is the citing authors’ comparison, not a finding attributed to Wang et al. (LLM, conf=0.88)
plainn = 199- Asserted: passes — The authors put it forward as true.
- Checkable: passes — It can be checked against evidence.
- Load-bearing: unclear — It is unclear whether the paper’s conclusions depend on it.
- Based: passes — The paper gives a reason why it holds.
- Rests on an assumption: The V3-V4 region of 16S rRNA provides sufficient taxonomic resolution to identify bacterial species and genera.
- Supported
Every source the paper cites for this claim was checked and supports it.
In the paper
“both of these species have been reported in lung isolates from humans suffering from severe lung infections [51–54].”
§ Saliva microbiome alterations in dental fluorosis population > Discussion
What the sources say
- Supportedcites [51] Huda SA, Yadava S, Kahlown S, et al. A rare case of ventilator-associated pneumonia caused by Cupriavidus Pauculus. Cureus. 2020; 12: e8573. 32670709 PMC7358901 source
The Case presentation reports C. pauculus in a tracheal aspirate culture from a patient with ventilator-associated pneumonia, fever and worsening hypoxia. This supports the C. pauculus portion of the sentence; the paper is not offered as evidence for V. metschnikovii, which the sentence cites alongside other sources. (LLM, conf=0.92)
- Supportedcites [52] Almasy E, Szederjesi J, Rad P, et al. A fatal case of community acquired Cupriavidus Pauculus Pneumonia. J Crit Care Med (Targu Mures). 2016; 2: 201– 204. 29967861 PMC5953259 source
The Case report identifies C. pauculus in a tracheal aspirate from a patient with pneumonia and sepsis. The Discussions also describe the patient as being in respiratory distress before admission. This paper supports the C. pauculus part of the multi-citation sentence; it is not offered as evidence for V. metschnikovii. (LLM, conf=0.92)
- Supportedcites [53] Yahya R, Alyousef W, Omara A, et al. First case of pneumonia caused by Cupriavidus pauculus in an infant in the gulf cooperation council. J Infect Dev Ctries. 2017; 11: 196– 198. 28248683 source
The Case report describes C. pauculus identified in sputum collected through an endotracheal tube from an infant with pneumonia; a second sputum specimen had identical findings. The reported PICU course and critical deterioration support the description of a severe lung infection. This paper supports the C. pauculus example in the multi-citation sentence, not the V. metschnikovii example. (LLM, conf=0.91)
- Supportedcites [54] Wallet F, Tachon M, Nseir S, et al. Vibrio metschnikovii pneumonia. Emerg Infect Dis. 2005; 11: 1641– 1642. 16355507 PMC3366744 source
The paper’s case report, “Vibrio metschnikovii Pneumonia,” describes V. metschnikovii isolated from a bronchial aspirate in a patient with pneumonia and acute respiratory failure. This supports the V. metschnikovii part of the multi-citation sentence; the paper is not being used here as evidence for C. pauculus. (LLM, conf=0.92)
plain- Asserted: passes — The authors put it forward as true.
- Checkable: passes — It can be checked against evidence.
- Load-bearing: passes — The paper’s conclusions depend on it.
- Based: passes — The paper gives a reason why it holds.
- Supported
A result the paper reports from its own data — it cites no other source for it, so there is none to check. The quote shows it is in the paper.
In the paper
“Dental fluorosis severity was also found not to be correlated with gender (P = 0.976).”
§ Saliva microbiome alterations in dental fluorosis population > Results > Dental fluorosis prevalence rates and its relationship to gender
plain- Asserted: passes — The authors put it forward as true.
- Checkable: passes — It can be checked against evidence.
- Load-bearing: unclear — It is unclear whether the paper’s conclusions depend on it.
- Based: passes — The paper gives a reason why it holds.
A result the paper reports from its own data — it cites no other source for it, so there is none to check. The quote shows it is in the paper.
In the paper
“Dental fluorosis affected 47% of the student sample”
- Also stated in: § Dental fluorosis prevalence rates and its relationship to gender · plain
“The dental fluorosis prevalence among the 957 surveyed college students in Bengbu was 47% (n = 450)”
§ Saliva microbiome alterations in dental fluorosis population > Abstract > Results
plainn = 450- Asserted: passes — The authors put it forward as true.
- Checkable: passes — It can be checked against evidence.
- Load-bearing: unclear — It is unclear whether the paper’s conclusions depend on it.
- Based: passes — The paper gives a reason why it holds.
- Also stated in: § Dental fluorosis prevalence rates and its relationship to gender · plain
A result the paper reports from its own data — it cites no other source for it, so there is none to check. The quote shows it is in the paper.
In the paper
“incidence was unrelated to gender”
- Also stated in: § Dental fluorosis prevalence rates and its relationship to gender · plain
“No differences in dental fluorosis rates were observed as a function of gender (P = 0.114).”
§ Saliva microbiome alterations in dental fluorosis population > Abstract > Results
plainn = 450- Asserted: passes — The authors put it forward as true.
- Checkable: passes — It can be checked against evidence.
- Load-bearing: unclear — It is unclear whether the paper’s conclusions depend on it.
- Based: passes — The paper gives a reason why it holds.
- Also stated in: § Dental fluorosis prevalence rates and its relationship to gender · plain
A result the paper reports from its own data — it cites no other source for it, so there is none to check. The quote shows it is in the paper.
In the paper
“our study also showed a relative high abundance of Treponema lecithinolyticum in the DF group compared with the HC group”
§ Saliva microbiome alterations in dental fluorosis population > Discussion
plaincorrelational- Asserted: passes — The authors put it forward as true.
- Checkable: passes — It can be checked against evidence.
- Load-bearing: passes — The paper’s conclusions depend on it.
- Based: passes — The paper gives a reason why it holds.
A result the paper reports from its own data — it cites no other source for it, so there is none to check. The quote shows it is in the paper.
In the paper
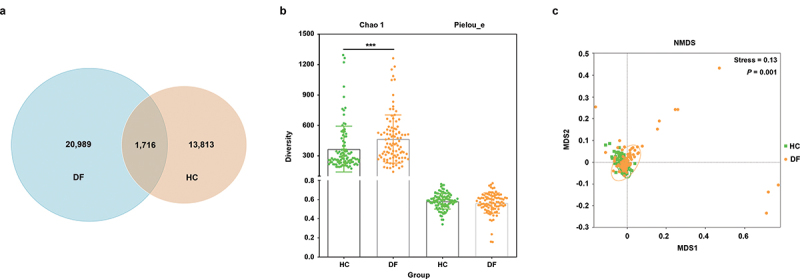
“β diversity was additionally analyzed based on Bray-Curtis distance values, revealing significant differences in the composition of the oral microbiota in these two groups (P = 0.001)”
- Also stated in: § Discussion · plain
“Analyses of β diversity revealed significant differences between control individuals and dental fluorosis patients”
§ Saliva microbiome alterations in dental fluorosis population > Results > Dental fluorosis patients exhibit substantial variations in the composition of the oral microbiome
plaincorrelationaln = 199 ·- Asserted: passes — The authors put it forward as true.
- Checkable: passes — It can be checked against evidence.
- Load-bearing: passes — The paper’s conclusions depend on it.
- Based: passes — The paper gives a reason why it holds.
- Also stated in: § Discussion · plain
A result the paper reports from its own data — it cites no other source for it, so there is none to check. The quote shows it is in the paper.
In the paper
“Compared with healthy controls, the microbiota of patients with dental fluorosis exhibited increased diversity”
- Also stated in: § Dental fluorosis patients exhibit substantial variations in the composition of the oral microbiome · plain
“The α diversity richness index Chao 1 showed increased diversity in the DF group (P < 0.001)”
- Also stated in: § Discussion · plain
“In the present study, a significant increase in the α diversity in richness of the salivary microbiome was observed in dental fluorosis patients compared with that of control individuals.”
§ Saliva microbiome alterations in dental fluorosis population > Abstract > Results
plaincorrelationaln = 199 ·- Asserted: passes — The authors put it forward as true.
- Checkable: passes — It can be checked against evidence.
- Load-bearing: passes — The paper’s conclusions depend on it.
- Based: passes — The paper gives a reason why it holds.
- Also stated in: § Dental fluorosis patients exhibit substantial variations in the composition of the oral microbiome · plain
The paper states this without a source or data behind it here, so there is nothing to check it against. The quote shows it is in the paper.
In the paper
“A negative relationship between dental fluorosis incidence and the abundance of cariogenic bacteria was observed.”
§ Saliva microbiome alterations in dental fluorosis population > Discussion
plaincorrelational- Asserted: passes — The authors put it forward as true.
- Checkable: passes — It can be checked against evidence.
- Load-bearing: passes — The paper’s conclusions depend on it.
- Based: unclear — It is unclear why the paper says it holds.
A result the paper reports from its own data — it cites no other source for it, so there is none to check. The quote shows it is in the paper.
In the paper
“Certain opportunistic pathogens associated with lung infections were also observed at high abundance levels in patients with dental fluorosis.”
§ Saliva microbiome alterations in dental fluorosis population > Discussion
plaincorrelational- Asserted: passes — The authors put it forward as true.
- Checkable: passes — It can be checked against evidence.
- Load-bearing: unclear — It is unclear whether the paper’s conclusions depend on it.
- Based: passes — The paper gives a reason why it holds.
- Probably not a substantial claim. 25
- It may state two separate claims as one. 15
- The quote only partly states this claim. 1
None of the sources cited for this claim have been checked yet.
In the paper
“Arginine biosynthesis is essentially negatively regulated by ArgR/AhrC family proteins.”
- Also stated in: § Discussion · plain
“These repressors inhibit arginine synthesis by inhibiting the expression of arginine biosynthetic genes at the transcriptional level [63,64].”
§ Saliva microbiome alterations in dental fluorosis population > Discussion
What the sources say
- Could not verifycites [63] Fulde M, Willenborg J, de Greeff A, et al. ArgR is an essential local transcriptional regulator of the arcABC operon in Streptococcus suis and is crucial for biological fitness in an acidic environment. Microbiology (Reading). 2011; 157: 572– 582. 20947575 sourceExperimental — accuracy not yet measured
The available passages labeled Abstract contain bibliographic information, keywords, and the paper title, but no account of how ArgR/AhrC regulates arginine biosynthesis. Searches for negative regulation, arginine biosynthesis, and inhibition of biosynthetic-gene transcription found no passage addressing the claim. (LLM, conf=0.70)
- Not checked yetcites [64] Maas WK. The arginine repressor of Escherichia coli. Microbiol Rev. 1994; 58: 631– 640. 7854250 PMC372985
plaindirect- Asserted: passes — The authors put it forward as true.
- Checkable: passes — It can be checked against evidence.
- Load-bearing: fails — The paper’s conclusions may not depend on it.
- Based: passes — The paper gives a reason why it holds.
Probably not a substantial claim. The paper’s conclusions may not depend on it.
- Also stated in: § Discussion · plain
The cited sources support only part of this claim — read each source’s verdict below.
In the paper
“Although it is a micronutrient required for normal growth, excessive long-term fluoride intake can lead to its deposition in the bones and teeth, resulting in chronic skeletal and dental fluorosis [2,3].”
§ Saliva microbiome alterations in dental fluorosis population > Background
What the sources say
- Partly supportedcites [2] Li Q, Shen J, Qin T, et al. A qualitative and comprehensive analysis of caries susceptibility for dental fluorosis patients. Antibiotics (Basel). 2021; 10: 1047. 34572628 PMC8464924 sourceExperimental — accuracy not yet measured
The Introduction states that chronic excessive fluoride intake during tooth development causes dental fluorosis. The Conclusions also link excessive fluoride intake to skeletal fluorosis and suggest a cumulative effect. The paper does not establish the claimed mechanism of fluoride deposition in both bones and teeth. (LLM, conf=0.86)
- Partly supportedcites [3] Qiao L, Liu X, He Y, et al. Progress of signaling pathways, stress pathways and epigenetics in the pathogenesis of skeletal fluorosis. Int J Mol Sci. 2021; 22: 11932. 34769367 PMC8584317 sourceExperimental — accuracy not yet measured
The Introduction states that fluoride accumulates in bone tissue and can lead to skeletal fluorosis. It also identifies dental fluorosis as a manifestation of fluorosis associated with long-term high fluoride intake, but does not say that fluoride deposits in teeth or that such deposition causes dental fluorosis. (LLM, conf=0.84)
plaindirect- Asserted: passes — The authors put it forward as true.
- Checkable: passes — It can be checked against evidence.
- Load-bearing: fails — The paper’s conclusions may not depend on it.
- Based: passes — The paper gives a reason why it holds.
Probably not a substantial claim. The paper’s conclusions may not depend on it.
- Partly supported
The cited sources support only part of this claim — read each source’s verdict below.
In the paper
“V. metschnikovii is an opportunistic pathogen that rarely causes disease onset in humans”
§ Saliva microbiome alterations in dental fluorosis population > Discussion
What the sources say
- Could not verifycites [51] Huda SA, Yadava S, Kahlown S, et al. A rare case of ventilator-associated pneumonia caused by Cupriavidus Pauculus. Cureus. 2020; 12: e8573. 32670709 PMC7358901 sourceExperimental — accuracy not yet measured
The Conclusions and Discussion describe rare human infection by C. pauculus, not V. metschnikovii. Searches for “V. metschnikovii” and “Vibrio metschnikovii” found no passage in our copy addressing the claimed organism. (LLM, conf=0.78)
- Could not verifycites [52] Almasy E, Szederjesi J, Rad P, et al. A fatal case of community acquired Cupriavidus Pauculus Pneumonia. J Crit Care Med (Targu Mures). 2016; 2: 201– 204. 29967861 PMC5953259 sourceExperimental — accuracy not yet measured
The Introduction says that Cupriavidus pauculus has rarely been identified as a pathogen in patients, especially immunocompromised patients. A search for “Vibrio metschnikovii” found no passage about that species, so the paper does not verify the claim about V. metschnikovii. (LLM, conf=0.78)
- Could not verifycites [53] Yahya R, Alyousef W, Omara A, et al. First case of pneumonia caused by Cupriavidus pauculus in an infant in the gulf cooperation council. J Infect Dev Ctries. 2017; 11: 196– 198. 28248683 sourceExperimental — accuracy not yet measured
The Introduction and Discussion discuss Cupriavidus pauculus as an opportunistic pathogen, not V. metschnikovii. A search for V. metschnikovii returned no passage addressing whether it rarely causes human disease. (LLM, conf=0.78)
- Partly supportedcites [54] Wallet F, Tachon M, Nseir S, et al. Vibrio metschnikovii pneumonia. Emerg Infect Dis. 2005; 11: 1641– 1642. 16355507 PMC3366744 sourceExperimental — accuracy not yet measured
In the discussion of “Vibrio metschnikovii Pneumonia” (page unavailable), the authors explicitly state that human clinical infections are rare. They describe pneumonia in a patient with chronic obstructive pulmonary disease who was taking prednisolone, but do not characterize the bacterium as an opportunistic pathogen or establish that its infections are opportunistic. (LLM, conf=0.82)
plain- Asserted: passes — The authors put it forward as true.
- Checkable: passes — It can be checked against evidence.
- Load-bearing: passes — The paper’s conclusions depend on it.
- Based: passes — The paper gives a reason why it holds.
Probably not a substantial claim.
- Could not verify
The cited sources support only part of this claim — read each source’s verdict below.
In the paper
“prior work has revealed that certain diseases are associated with changes in the α diversity of the microbiome, while others are not [35–38].”
§ Saliva microbiome alterations in dental fluorosis population > Discussion
What the sources say
- Could not verifycites [35] Fan X, Alekseyenko AV, Wu J, et al. Human oral microbiome and prospective risk for pancreatic cancer: a population-based nested case-control study. Gut. 2018; 67: 120– 127. 27742762 PMC5607064 sourceExperimental — accuracy not yet measured
The Methods (Statistical Analysis; page unavailable) describe comparisons of overall oral microbiome composition, and the Results (page unavailable) report no case–control difference in those measures. The Methods (Measurements; page unavailable) mention within-subject diversity indices only for quality control. Our copy does not report whether pancreatic cancer, or other diseases, are associated with changes in alpha diversity (searched: alpha diversity, Shannon, Simpson, cases and controls). (LLM, conf=0.76)
- Partly supportedcites [36] Kageyama Y, Shimokawa Y, Kawauchi K, et al. Dysbiosis of oral microbiota associated with palmoplantar pustulosis. Dermatology. 2021; 237: 347– 356. 33279897 PMC8117382 sourceExperimental — accuracy not yet measured
In “PPP Patients Have Dysbiosis of Oral Microbiota,” the paper reports no significant difference in oral microbiome α-diversity between patients with palmoplantar pustulosis and healthy controls. This supports the claim that some diseases are not associated with a detected change in α-diversity, but the paper does not establish the contrasting claim that other diseases are associated with such changes. (LLM, conf=0.87)
- Not checked — no full text of the sourcecites [37] Wang J, Qian T, Jiang J, et al. Gut microbial profile in biliary atresia: a case-control study. J Gastroenterol Hepatol. 2020; 35: 334– 342. 31271681 source
- Partly supportedcites [38] Bobin-Dubigeon C, Luu HT, Leuillet S, et al. Faecal microbiota composition varies between patients with breast cancer and healthy women: a comparative case-control study. Nutrients. 2021; 13: 2705. 34444865 PMC8399700 sourceExperimental — accuracy not yet measured
The Results (§3.2.2) report significantly lower Shannon α-diversity in breast cancer patients than in healthy controls. The Chao1 index was not significantly different in those same groups, but the paper does not identify a disease unassociated with changes in α-diversity. It therefore supports only the first part of the broader claim. (LLM, conf=0.85)
plaincorrelational- Asserted: passes — The authors put it forward as true.
- Checkable: passes — It can be checked against evidence.
- Load-bearing: fails — The paper’s conclusions may not depend on it.
- Based: passes — The paper gives a reason why it holds.
Probably not a substantial claim. The paper’s conclusions may not depend on it. It may state two separate claims as one.
- Could not verify
The cited sources support only part of this claim — read each source’s verdict below.
In the paper
“the dysbiosis of this microbial community has been linked to diseases of the oral cavity (dental caries, gingivitis, periodontitis, oral lichen planus, oral cancer), respiratory system (pneumonia, asthma, chronic obstructive pulmonary disease, lung cancer), gastrointestinal system (Crohn’s disease, ulcerative colitis, colonic carcinoma), and other systems [22,39–41].”
§ Saliva microbiome alterations in dental fluorosis population > Discussion
What the sources say
- Not checked — no full text of the sourcecites [22] Pathak JL, Yan Y, Zhang Q, et al. The role of oral microbiome in respiratory health and diseases. Respir med. 2021; 185: 106475. 34049183 source
- Not checked yetcites [39] Yu FY, Wang QQ, Li M, et al. Dysbiosis of saliva microbiome in patients with oral lichen planus. BMC Microbiol. 2020; 20: 75. 32245419 PMC7118920
- Supportedcites [40] Huang C, Shi G. Smoking and microbiome in oral, airway, gut and some systemic diseases. J Transl Med. 2019; 17: 225. 31307469 PMC6632217 source
The “Smoking and oral microbiome in diseases” section links oral microbiota dysbiosis to periodontal and respiratory diseases and to cancers beyond the oral cavity. Its “Other” subsection also discusses associations of the oral microbiome with gastrointestinal cancer and other systemic diseases. These passages support the broad claim of links across the named body systems. (LLM, conf=0.91)
- Partly supportedcites [41] De Luca F, Shoenfeld Y. The microbiome in autoimmune diseases. Clin Exp Immunol. 2019; 195: 74– 85. 29920643 PMC6300652 sourceExperimental — accuracy not yet measured
The Introduction (page unavailable) reports oral dysbiosis in patients with Sjögren’s syndrome and discusses bacteria associated with periodontal disease. It links Crohn’s disease and ulcerative colitis to gut microbiome dysbiosis, not oral dysbiosis. The cited paper does not establish the claimed links between oral dysbiosis and the listed respiratory diseases or the other specified oral and gastrointestinal diseases. (LLM, conf=0.86)
plaincorrelational- Asserted: passes — The authors put it forward as true.
- Checkable: passes — It can be checked against evidence.
- Load-bearing: fails — The paper’s conclusions may not depend on it.
- Based: passes — The paper gives a reason why it holds.
Probably not a substantial claim. The paper’s conclusions may not depend on it.
The sources with a verdict support this claim; the rest weren’t checked yet, have no full text we could read, or their verdicts aren’t rated yet.
In the paper
“The makeup of the oral microbiota is closely associated with both oral and systemic health”
§ Saliva microbiome alterations in dental fluorosis population > Discussion
What the sources say
- Not checked — no full text of the sourcecites [22] Pathak JL, Yan Y, Zhang Q, et al. The role of oral microbiome in respiratory health and diseases. Respir med. 2021; 185: 106475. 34049183 source
- Not checked yetcites [39] Yu FY, Wang QQ, Li M, et al. Dysbiosis of saliva microbiome in patients with oral lichen planus. BMC Microbiol. 2020; 20: 75. 32245419 PMC7118920
- Supportedcites [40] Huang C, Shi G. Smoking and microbiome in oral, airway, gut and some systemic diseases. J Transl Med. 2019; 17: 225. 31307469 PMC6632217 source
In the Background section, the paper says the oral microbiome helps maintain oral health and associates oral microbiota dysbiosis with periodontal and systemic diseases. Its discussion of systemic diseases also states that oral microbiome community composition may be associated with periodontitis, cancer, and diabetes. This supports the claim as an association, not a causal assertion. (LLM, conf=0.93)
- Supportedcites [41] De Luca F, Shoenfeld Y. The microbiome in autoimmune diseases. Clin Exp Immunol. 2019; 195: 74– 85. 29920643 PMC6300652 source
The Introduction (page not available) links oral bacteria to periodontitis and reports associations between periodontal disease and rheumatoid arthritis, while also noting a study that found no correlation. It reports altered oral flora in patients with Sjögren’s syndrome. Together, these passages support the broad association with oral and systemic health, without establishing that every oral condition is associated with systemic disease. (LLM, conf=0.86)
plaincorrelational- Asserted: passes — The authors put it forward as true.
- Checkable: passes — It can be checked against evidence.
- Load-bearing: fails — The paper’s conclusions may not depend on it.
- Based: passes — The paper gives a reason why it holds.
Probably not a substantial claim. The paper’s conclusions may not depend on it.
A result the paper reports from its own data — it cites no other source for it, so there is none to check. The quote shows it is in the paper.
In the paper
“Of the 450 patients with dental fluorosis, 290 were also affected by dental caries.”
§ Saliva microbiome alterations in dental fluorosis population > Results > Dental fluorosis prevalence rates and its relationship to gender
plainn = 450- Asserted: passes — The authors put it forward as true.
- Checkable: passes — It can be checked against evidence.
- Load-bearing: fails — The paper’s conclusions may not depend on it.
- Based: passes — The paper gives a reason why it holds.
Probably not a substantial claim. The paper’s conclusions may not depend on it.
A result the paper reports from its own data — it cites no other source for it, so there is none to check. The quote shows it is in the paper.
In the paper
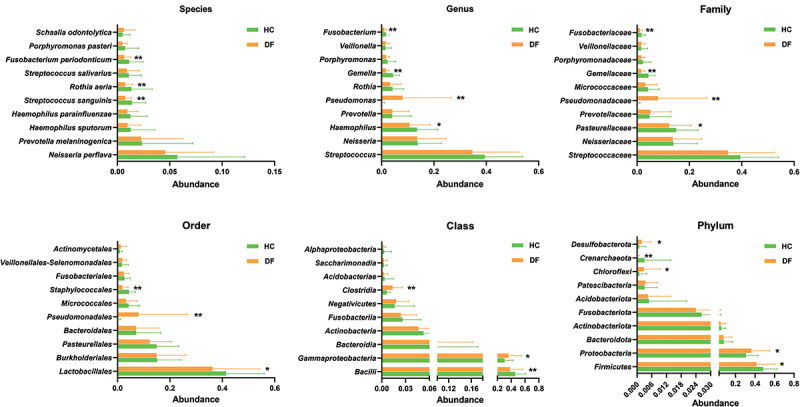
“together with reduced Streptococcus sanguinis, Rothia aeria, Fusobacterium periodonticum, Haemophilus, Gemella, Fusobacterium, Gemellaceae, Fusobacteriaceae, Pasteurellaceae, Lactobacillales, and Staphylococcales abundance relative to the HC group”
§ Saliva microbiome alterations in dental fluorosis population > Results > Changes in the salivary microbiome in dental fluorosis population
plaincorrelational- Asserted: passes — The authors put it forward as true.
- Checkable: passes — It can be checked against evidence.
- Load-bearing: passes — The paper’s conclusions depend on it.
- Based: passes — The paper gives a reason why it holds.
It may state two separate claims as one.
- Rests on an assumption: The V3-V4 region of 16S rRNA provides sufficient taxonomic resolution to identify bacterial species and genera.
None of the sources cited for this claim have been checked yet.
In the paper
“KO analysis showed a significant difference between the two groups, with most of the functional genes under-represented in the DF group.”
§ Saliva microbiome alterations in dental fluorosis population > Results > Functional differences in the salivary microbiome of study groups
What the sources say
- Not checked yetcites [33] Douglas GM, Maffei VJ, Zaneveld JR, et al. Picrust2 for prediction of metagenome functions. Nat Biotechnol. 2020; 38: 685– 688. 32483366 PMC7365738 source
Checked before — its earlier verdict is held back until a new check runs.
plaincorrelational- Asserted: passes — The authors put it forward as true.
- Checkable: passes — It can be checked against evidence.
- Load-bearing: passes — The paper’s conclusions depend on it.
- Based: passes — The paper gives a reason why it holds.
It may state two separate claims as one.
- Rests on an assumption: PICRUSt2-predicted functional profiles accurately represent the actual functional capabilities of the salivary microbiome.
- Not checked yet
A result the paper reports from its own data — it cites no other source for it, so there is none to check. The quote shows it is in the paper.
In the paper
“Here, significant decreases in the abundance of these species were observed in the DF group, consistent with a lower risk of future caries development.”
§ Saliva microbiome alterations in dental fluorosis population > Discussion
plaincorrelational- Asserted: passes — The authors put it forward as true.
- Checkable: passes — It can be checked against evidence.
- Load-bearing: passes — The paper’s conclusions depend on it.
- Based: passes — The paper gives a reason why it holds.
The quote only partly states this claim.
A result the paper reports from its own data — it cites no other source for it, so there is none to check. The quote shows it is in the paper.
In the paper
“Function analyses showed increases in arginine biosynthesis in patients affected by dental fluorosis, together with reductions in amino sugar and nucleotide sugar metabolism, fructose and mannose metabolism, and starch and sucrose metabolism.”
§ Saliva microbiome alterations in dental fluorosis population > Abstract > Results
plaindirect- Asserted: passes — The authors put it forward as true.
- Checkable: passes — It can be checked against evidence.
- Load-bearing: passes — The paper’s conclusions depend on it.
- Based: passes — The paper gives a reason why it holds.
It may state two separate claims as one.
- Rests on an assumption: PICRUSt2-predicted functional profiles accurately represent the actual functional capabilities of the salivary microbiome.
A result the paper reports from its own data — it cites no other source for it, so there is none to check. The quote shows it is in the paper.
In the paper
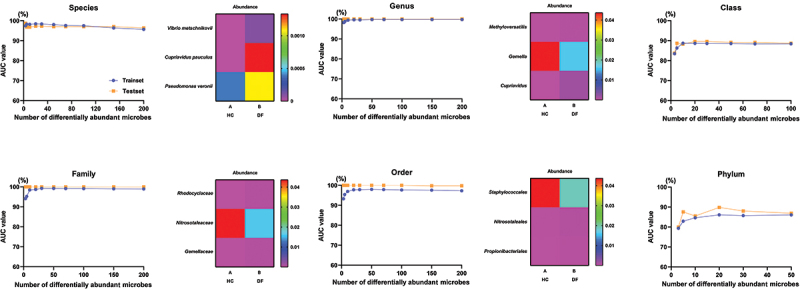
“Vibrio metschnikovii (V. metschnikovii) and Cupriavidus pauculus (C. pauculus) were dominant species that were more abundant in DF patients and able to discriminate between these patients and those in the HC group.”
§ Saliva microbiome alterations in dental fluorosis population > Discussion
plaincorrelational- Asserted: passes — The authors put it forward as true.
- Checkable: passes — It can be checked against evidence.
- Load-bearing: passes — The paper’s conclusions depend on it.
- Based: passes — The paper gives a reason why it holds.
It may state two separate claims as one.
What the paper did — it cites no source for this, so there is none to check. The quote shows it is in the paper.
In the paper
“Thus, the sample size was expanded from 178 to 957 to decrease the experimental error.”
§ Saliva microbiome alterations in dental fluorosis population > Discussion
plaindirect- Asserted: passes — The authors put it forward as true.
- Checkable: passes — It can be checked against evidence.
- Load-bearing: fails — The paper’s conclusions may not depend on it.
- Based: passes — The paper gives a reason why it holds.
Probably not a substantial claim. The paper’s conclusions may not depend on it.
In the paper
“Moreover, arginine is a promising agent for caries management [62].”
§ Saliva microbiome alterations in dental fluorosis population > Discussion
What the sources say
- Not checked — no full text of the sourcecites [62] Li J, Huang Z, Mei L, et al. Anti-caries effect of arginine-containing formulations in vivo: a systematic review and meta-analysis. Caries Res. 2015; 49: 606– 617. 26536588 source
plain- Asserted: passes — The authors put it forward as true.
- Checkable: passes — It can be checked against evidence.
- Load-bearing: fails — The paper’s conclusions may not depend on it.
- Based: passes — The paper gives a reason why it holds.
Probably not a substantial claim. The paper’s conclusions may not depend on it.
None of the sources cited for this claim have been checked yet.
In the paper
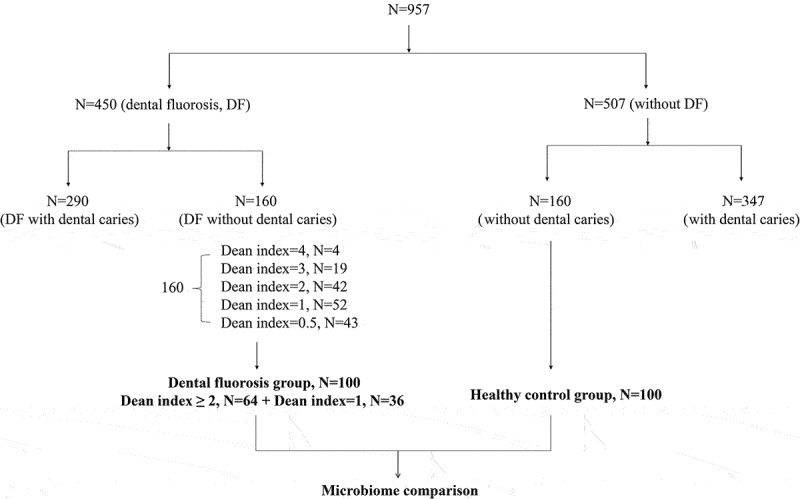
“Dean’s index was used to record the incidence and severity of dental fluorosis as follows: 0 (normal), 0.5 (questionable), 1 (very mild), 2 (mild), 3 (moderate), and 4 (severe) [24,25].”
§ Saliva microbiome alterations in dental fluorosis population > Materials and methods > Study population
What the sources say
- Not checked — no full text of the sourcecites [24] Zhou Y, Chen DR, Zhi QH, et al. The prevalence and associated risk indicators of dental fluorosis in china: findings from the 4th national oral health survey. Chin J Dent Res. 2018; 21: 205– 211. 30255171 source
- Not checked yetcites [25] Dong H, Yang X, Zhang S, et al. Associations of low level of fluoride exposure with dental fluorosis among U.S. children and adolescents, NHANES 2015-2016. Ecotoxicol Environ Saf. 2021; 221: 112439. 34166938 source
Checked before — its earlier verdict is held back until a new check runs.
plain- Asserted: passes — The authors put it forward as true.
- Checkable: passes — It can be checked against evidence.
- Load-bearing: passes — The paper’s conclusions depend on it.
- Based: passes — The paper gives a reason why it holds.
Probably not a substantial claim.
None of the sources cited for this claim have been checked yet.
In the paper
“Arginine deiminase system (ADS)-positive bacteria can contribute to the alkalization of the oral microenvironment via arginine and proline metabolism, and can inhibit the growth of acidic cariogenic bacterial species such as S. mutans [61].”
§ Saliva microbiome alterations in dental fluorosis population > Discussion
What the sources say
- Not checked yetcites [61] Abranches J, Zeng L, Kajfasz JK, et al. Biology of Oral Streptococci. Microbiol Spectr. 2018; 6. DOI: 10.1128/microbiolspec.GPP3-0042-2018. PMC6287261 30338752 source
Checked before — its earlier verdict is held back until a new check runs.
plaindirect- Asserted: passes — The authors put it forward as true.
- Checkable: passes — It can be checked against evidence.
- Load-bearing: fails — The paper’s conclusions may not depend on it.
- Based: passes — The paper gives a reason why it holds.
Probably not a substantial claim. The paper’s conclusions may not depend on it. It may state two separate claims as one.
- Not checked yet
In the paper
“The necessary sample size for this study was calculated using the formula N=(Zα/2/δ)2P(1-P) in order to ensure that this study was adequately powered to assess dental fluorosis prevalence as per the results of the 4th National Oral Health Survey in China [24]. When the values of α, Zα/2, δ, and P were set as 0.05, 1.96, 5%, and 13.4%, the minimum sample size required for this study was calculated”
§ Saliva microbiome alterations in dental fluorosis population > Materials and methods > Study population
What the sources say
- Not checked — no full text of the sourcecites [24] Zhou Y, Chen DR, Zhi QH, et al. The prevalence and associated risk indicators of dental fluorosis in china: findings from the 4th national oral health survey. Chin J Dent Res. 2018; 21: 205– 211. 30255171 source
plain- Asserted: passes — The authors put it forward as true.
- Checkable: passes — It can be checked against evidence.
- Load-bearing: unclear — It is unclear whether the paper’s conclusions depend on it.
- Based: passes — The paper gives a reason why it holds.
It may state two separate claims as one.
In the paper
“Zhong et al reported the microbial diversity in fecal samples from rat models of dental fluorosis, revealing an initial increase in such diversity (ACE and Chao indices) with rising NaF levels (25 or 50 mg/L for 12 weeks), whereas this diversity fell when higher levels of NaF were provided in the water given to these rats (100 and 150 mg/L groups) [21].”
§ Saliva microbiome alterations in dental fluorosis population > Discussion
What the sources say
- Not checked — no full text of the sourcecites [21] Zhong N, Ma Y, Meng X, et al. Effect of fluoride in drinking water on fecal microbial community in rats. Biol Trace Elem Res. 2022; 200: 238– 246. 33576944 source
plaindirect- Asserted: passes — The authors put it forward as true.
- Checkable: passes — It can be checked against evidence.
- Load-bearing: fails — The paper’s conclusions may not depend on it.
- Based: passes — The paper gives a reason why it holds.
Probably not a substantial claim. The paper’s conclusions may not depend on it.
None of the sources cited for this claim have been checked yet.
In the paper
“C. pauculus is a non-fermentative, aerobic bacillus that is relatively rare”
§ Saliva microbiome alterations in dental fluorosis population > Discussion
What the sources say
- Not checked yetcites [51] Huda SA, Yadava S, Kahlown S, et al. A rare case of ventilator-associated pneumonia caused by Cupriavidus Pauculus. Cureus. 2020; 12: e8573. 32670709 PMC7358901 source
Checked before — its earlier verdict is held back until a new check runs.
- Not checked yetcites [52] Almasy E, Szederjesi J, Rad P, et al. A fatal case of community acquired Cupriavidus Pauculus Pneumonia. J Crit Care Med (Targu Mures). 2016; 2: 201– 204. 29967861 PMC5953259 source
Checked before — its earlier verdict is held back until a new check runs.
- Not checked yetcites [53] Yahya R, Alyousef W, Omara A, et al. First case of pneumonia caused by Cupriavidus pauculus in an infant in the gulf cooperation council. J Infect Dev Ctries. 2017; 11: 196– 198. 28248683 source
Checked before — its earlier verdict is held back until a new check runs.
- Not checked yetcites [54] Wallet F, Tachon M, Nseir S, et al. Vibrio metschnikovii pneumonia. Emerg Infect Dis. 2005; 11: 1641– 1642. 16355507 PMC3366744 source
Checked before — its earlier verdict is held back until a new check runs.
plain- Asserted: passes — The authors put it forward as true.
- Checkable: passes — It can be checked against evidence.
- Load-bearing: fails — The paper’s conclusions may not depend on it.
- Based: passes — The paper gives a reason why it holds.
Probably not a substantial claim. The paper’s conclusions may not depend on it. It may state two separate claims as one.
- Not checked yet
In the paper
“While exposure to a 100 mg/L dose of fluoride does not impact the diversity of the rat fecal microbiome, the richness of these intestinal communities initially rises and then falls as the levels of fluoride in the water rise [21].”
§ Saliva microbiome alterations in dental fluorosis population > Background
What the sources say
- Not checked — no full text of the sourcecites [21] Zhong N, Ma Y, Meng X, et al. Effect of fluoride in drinking water on fecal microbial community in rats. Biol Trace Elem Res. 2022; 200: 238– 246. 33576944 source
plaindirect- Asserted: passes — The authors put it forward as true.
- Checkable: passes — It can be checked against evidence.
- Load-bearing: fails — The paper’s conclusions may not depend on it.
- Based: passes — The paper gives a reason why it holds.
Probably not a substantial claim. The paper’s conclusions may not depend on it. It may state two separate claims as one.
In the paper
“Dental fluorosis results from the intake of excessively high fluoride levels through water, soil, brick tea, and coal-based sources via the digestive or respiratory tract, in turn impacting ameloblast development and altering the morphology and mechanical properties of teeth [9].”
§ Saliva microbiome alterations in dental fluorosis population > Background
What the sources say
- Not checked — no full text of the sourcecites [9] Li Q, Zhao ZJ. Prevalence of brick tea-type fluorosis in children aged 8-12 years in Qinghai Province, China. Biomed Environ Sci. 2021; 34: 334– 336. 33894815 source
plaindirect- Asserted: passes — The authors put it forward as true.
- Checkable: passes — It can be checked against evidence.
- Load-bearing: fails — The paper’s conclusions may not depend on it.
- Based: passes — The paper gives a reason why it holds.
Probably not a substantial claim. The paper’s conclusions may not depend on it. It may state two separate claims as one.
None of the sources cited for this claim have been checked yet.
In the paper
“Jing et al reported that AhrC is also an important transcription factor that negatively regulates arginine biosynthesis gene expression and biofilm formation in S. mutans [65].”
§ Saliva microbiome alterations in dental fluorosis population > Discussion
What the sources say
- Not checked yetcites [65] Jing M, Zheng T, Gong T, et al. AhrC negatively regulates Streptococcus mutans arginine biosynthesis. Microbiol Spectr. 2022; 10: e0072122. 35938859 PMC9430756 source
Checked before — its earlier verdict is held back until a new check runs.
plaindirect- Asserted: passes — The authors put it forward as true.
- Checkable: passes — It can be checked against evidence.
- Load-bearing: fails — The paper’s conclusions may not depend on it.
- Based: passes — The paper gives a reason why it holds.
Probably not a substantial claim. The paper’s conclusions may not depend on it. It may state two separate claims as one.
- Not checked yet
In the paper
“Streptococcus mutans (S. mutans) is the bacterium largely responsible for caries formation [42].”
§ Saliva microbiome alterations in dental fluorosis population > Discussion
What the sources say
- Not checked yetcites [42] Loesche WJ. Role of Streptococcus mutans in human dental decay. Microbiol Rev. 1986; 50: 353– 380. 3540569 PMC373078
plaindirect- Asserted: passes — The authors put it forward as true.
- Checkable: passes — It can be checked against evidence.
- Load-bearing: fails — The paper’s conclusions may not depend on it.
- Based: passes — The paper gives a reason why it holds.
Probably not a substantial claim. The paper’s conclusions may not depend on it.
None of the sources cited for this claim have been checked yet.
In the paper
“These pathways are associated with active carbohydrate metabolism in the context of cariogenesis [58–60].”
§ Saliva microbiome alterations in dental fluorosis population > Discussion
What the sources say
- Not checked — no full text of the sourcecites [58] Dashper SG, Reynolds EC. Lactic acid excretion by Streptococcus mutans. Microbiology (Reading). 1996; 142: 33– 39. 33657745 source
- Not checked — no full text of the sourcecites [59] Zeng L, Chakraborty B, Farivar T, et al. Coordinated regulation of the EII(Man) and fruRKI Operons of Streptococcus mutans by global and fructose-specific pathways. Appl Environ Microbiol. 2017; 83. DOI: 10.1128/AEM.01403-17 PMC5648919 28821551 source
- Not checked yetcites [60] Klein MI, DeBaz L, Agidi S, et al. Dynamics of Streptococcus mutans transcriptome in response to starch and sucrose during biofilm development. PLoS ONE. 2010; 5: e13478. 20976057 PMC2957427 source
plaincorrelational- Asserted: passes — The authors put it forward as true.
- Checkable: passes — It can be checked against evidence.
- Load-bearing: fails — The paper’s conclusions may not depend on it.
- Based: passes — The paper gives a reason why it holds.
Probably not a substantial claim. The paper’s conclusions may not depend on it.
- Rests on an assumption: The functional genes K07024, K00688, and K00975 are involved in starch and sucrose metabolism.
- Rests on an assumption: The functional genes K02794, K02795, and K02796 are involved in fructose and mannose metabolism and amino sugar and nucleotide sugar metabolism.
None of the sources cited for this claim have been checked yet.
In the paper
“Several studies showed that Streptococcus sanguinis (S. sanguinis) may play an antagonistic role against S. mutans colonization and is usually associated with tooth surfaces free of caries [43–45].”
§ Saliva microbiome alterations in dental fluorosis population > Discussion
What the sources say
- Not checked yetcites [43] Becker MR, Paster BJ, Leys EJ, et al. Molecular analysis of bacterial species associated with childhood caries. J Clin Microbiol. 2002; 40: 1001– 1009. 11880430 PMC120252 source
Checked before — its earlier verdict is held back until a new check runs.
- Not checked — no full text of the sourcecites [44] Marchant S, Brailsford SR, Twomey AC, et al. The predominant microflora of nursing caries lesions. Caries Res. 2001; 35: 397– 406. 11799279 source
- Not checked — no full text of the sourcecites [45] Giacaman RA, Torres S, Gomez Y, et al. Correlation of Streptococcus mutans and Streptococcus sanguinis colonization and ex vivo hydrogen peroxide production in carious lesion-free and high caries adults. Arch Oral Biol. 2015; 60: 154– 159. 25455129 source
hedgedconditional- Asserted: passes — The authors put it forward as true.
- Checkable: passes — It can be checked against evidence.
- Load-bearing: fails — The paper’s conclusions may not depend on it.
- Based: passes — The paper gives a reason why it holds.
Probably not a substantial claim. The paper’s conclusions may not depend on it. It may state two separate claims as one.
- Not checked yet
None of the sources cited for this claim have been checked yet.
In the paper
“High fluoride doses can lead to DNA damage, mitochondrial damage, endoplasmic reticulum (ER) stress, and apoptotic death, thereby impairing ameloblast function and disrupting the normal synthesis and secretion of enamel-associated proteins via the impairment of normal ER function [10–13].”
§ Saliva microbiome alterations in dental fluorosis population > Background
What the sources say
- Not checked — no full text of the sourcecites [10] Liu X, Huang R, Gao Y, et al. Calcium mitigates fluoride-induced kallikrein 4 inhibition via PERK/eIf2alpha/ATF4/CHOP endoplasmic reticulum stress pathway in ameloblast-lineage cells. Arch Oral Biol. 2021; 125: 105093. 33667956 source
- Not checked — no full text of the sourcecites [11] Zhou X, Chen Z, Zhong W, et al. Effect of fluoride on PERK-Nrf2 signaling pathway in mouse ameloblasts. Hum Exp Toxicol. 2019; 38: 833– 845. 30977402 source
- Not checked yetcites [12] Aulestia FJ, Groeling J, Bomfim GHS, et al. Fluoride exposure alters Ca(2+) signaling and mitochondrial function in enamel cells. Sci Signal. 2020; 13. DOI: 10.1126/scisignal.aay0086. PMC7173621 32071168 source
Checked before — its earlier verdict is held back until a new check runs.
- Not checked yetcites [13] Suzuki M, Bandoski C, Bartlett JD. Fluoride induces oxidative damage and SIRT1/autophagy through ROS-mediated JNK signaling. Free Radic Biol Med. 2015; 89: 369– 378. 26431905 PMC4684823 source
Checked before — its earlier verdict is held back until a new check runs.
plaindirect- Asserted: passes — The authors put it forward as true.
- Checkable: passes — It can be checked against evidence.
- Load-bearing: fails — The paper’s conclusions may not depend on it.
- Based: passes — The paper gives a reason why it holds.
Probably not a substantial claim. The paper’s conclusions may not depend on it. It may state two separate claims as one.
None of the sources cited for this claim have been checked yet.
In the paper
“which makes periodontal bacteria easier to colonize on the tooth surface and difficult for scaling and root planning”
§ Saliva microbiome alterations in dental fluorosis population > Discussion
What the sources say
- Not checked yetcites [49] Singh P, Gupta ND, Bey A. Dental fluorosis and periodontium: a game of shadows? J Oral Biol Craniofac Res. 2014; 4: 47– 48. 25737919 PMC4252631 source
Checked before — its earlier verdict is held back until a new check runs.
plaindirect- Asserted: passes — The authors put it forward as true.
- Checkable: passes — It can be checked against evidence.
- Load-bearing: passes — The paper’s conclusions depend on it.
- Based: passes — The paper gives a reason why it holds.
It may state two separate claims as one.
- Not checked yet
None of the sources cited for this claim have been checked yet.
In the paper
“Vandana et al reported that there is a strong association of occurrence of periodontal disease and dental fluorosis [48].”
§ Saliva microbiome alterations in dental fluorosis population > Discussion
What the sources say
- Not checked yetcites [48] Vandana KL, Reddy MS. Assessment of periodontal status in dental fluorosis subjects using community periodontal index of treatment needs. Indian J Dent Res. 2007; 18: 67– 71. 17502711 source
Checked before — its earlier verdict is held back until a new check runs.
boostedcorrelational- Asserted: passes — The authors put it forward as true.
- Checkable: passes — It can be checked against evidence.
- Load-bearing: fails — The paper’s conclusions may not depend on it.
- Based: passes — The paper gives a reason why it holds.
Probably not a substantial claim. The paper’s conclusions may not depend on it.
- Not checked yet
What the paper did — it cites no source for this, so there is none to check. The quote shows it is in the paper.
In the paper
“For these 200 patients, exclusion criteria included the presence of dental caries, recurrent oral ulcers, periodontitis, other oral diseases, systemic or genetic diseases, or the use of any antibiotics, tobacco, and probiotics within the past six months.”
§ Saliva microbiome alterations in dental fluorosis population > Materials and methods > Study population
plainn = 200- Asserted: passes — The authors put it forward as true.
- Checkable: passes — It can be checked against evidence.
- Load-bearing: passes — The paper’s conclusions depend on it.
- Based: passes — The paper gives a reason why it holds.
Probably not a substantial claim. It may state two separate claims as one.
None of the sources cited for this claim have been checked yet.
In the paper
“Many studies have explored the association between gender and salivary microbiome, and reported that there was gender-specific difference in the salivary microbiome [56,57].”
§ Saliva microbiome alterations in dental fluorosis population > Discussion
What the sources say
- Not checked yetcites [56] Ortiz S, Herrman E, Lyashenko C, et al. Sex-specific differences in the salivary microbiome of caries-active children. J Oral Microbiol. 2019; 11: 1653124. 31497256 PMC6720314 source
Checked before — its earlier verdict is held back until a new check runs.
- Not checked yetcites [57] Nearing JT, DeClercq V, Van Limbergen J, et al. Assessing the variation within the oral microbiome of healthy adults. mSphere. 2020; 5. DOI: 10.1128/mSphere.00451-20 PMC7529435 32999079 source
Checked before — its earlier verdict is held back until a new check runs.
plaincorrelational- Asserted: passes — The authors put it forward as true.
- Checkable: passes — It can be checked against evidence.
- Load-bearing: passes — The paper’s conclusions depend on it.
- Based: passes — The paper gives a reason why it holds.
Probably not a substantial claim.
- Not checked yet
In the paper
“Hu et al. found that tooth biofilm formation in individuals with moderate to severe dental fluorosis (Dean index = 3–4) was associated with differences in S. mutans adherence relative to the ability of these microbes to bind the surface of sound enamel [47].”
§ Saliva microbiome alterations in dental fluorosis population > Discussion
What the sources say
- Not checked — no full text of the sourcecites [47] Hu D, Gong J, He B, et al. Surface properties and Streptococcus mutans - Streptococcus sanguinis adhesion of fluorotic enamel. Arch Oral Biol. 2021; 121: 104970. 33202357 source
plaincorrelational- Asserted: passes — The authors put it forward as true.
- Checkable: passes — It can be checked against evidence.
- Load-bearing: fails — The paper’s conclusions may not depend on it.
- Based: passes — The paper gives a reason why it holds.
Probably not a substantial claim. The paper’s conclusions may not depend on it.
In the paper
“For example, the intake of elevated fluoride levels (80 mg/L) can alter both the makeup and diversity of the gut microbiota in common carp, resulting in reduced Actinobacteria abundance with a concomitant increase in Firmicutes and Fusobacterium abundance [20].”
§ Saliva microbiome alterations in dental fluorosis population > Background
What the sources say
- Not checked — no full text of the sourcecites [20] Yu H, Zhang Y, Zhang P, et al. Effects of fluorine on intestinal structural integrity and microbiota composition of common carp. Biol Trace Elem Res. 2021; 199: 3489– 3496. 33119815 source
plaindirect- Asserted: passes — The authors put it forward as true.
- Checkable: passes — It can be checked against evidence.
- Load-bearing: fails — The paper’s conclusions may not depend on it.
- Based: passes — The paper gives a reason why it holds.
Probably not a substantial claim. The paper’s conclusions may not depend on it.
The paper relies on this without support.
PICRUSt2-predicted functional profiles accurately represent the actual functional capabilities of the salivary microbiome.
“PICRUSt 2 algorithm was used to assess the predicted biological functions of the microbiome in DF and HC group participants, providing a comprehensive overview of differences in salivary ecological characteristics in these groups.”
The paper relies on this without support.
The V3-V4 region of 16S rRNA provides sufficient taxonomic resolution to identify bacterial species and genera.
“Thus, we chose the V3-V4 hypervariable 16S rRNA gene sequences for analysis in the current study.”
“At the species level, Streptococcus mutans, an important cariogenic bacterium, was present at significantly lower abundance in the DF group relative to the HC group (P = 0.004).”
The paper relies on this without support.
The functional genes K07024, K00688, and K00975 are involved in starch and sucrose metabolism.
“K07024 (SPP, sucrose-6-phosphatase), K00688 (glgP, glycogen phosphorylase), K00975 (glgC, glucose-1-phosphate adenylyltransferase) are involved in starch and sucrose metabolism.”
The paper relies on this without support.
The functional genes K02794, K02795, and K02796 are involved in fructose and mannose metabolism and amino sugar and nucleotide sugar metabolism.
“K02794 (manX, mannose PTS system EIIAB component), K02795 (manY, mannose PTS system EIIC component), and K02796 (manZ, mannose PTS system EIID component) are involved in fructose and mannose metabolism and amino sugar and nucleotide sugar metabolism.”
The paper relies on this without support.
The argR and ahrC genes (K03402) are transcriptional regulators of arginine metabolism.
“argR and ahrC (K03402; argR, ahrC; transcriptional regulator of arginine metabolism)”
Self-check
Percentages, sums and reported differences re-computed from the paper’s own numbers.
Each contradiction between two passages listed here was confirmed by an independent check.
Rated minor: it would not touch a result — a value no result rests on, a p-value that stays on the same side of the significance level, or a conflict that is clerical, resolved elsewhere in the paper, or outside its own findings.
In the paper
§ Saliva microbiome alterations in dental fluorosis population > Discussion
“mild, Dean index = 1–2, n = 76; moderate/severe, Dean index = 3–4, n = 23”
§ Saliva microbiome alterations in dental fluorosis population > Results > Dental fluorosis prevalence rates and its relationship to gender
“Of the remaining 160 patients, 43, 52, 42, 19, and 4 exhibited respective Dean index values of 0.5, 1, 2, 3, and 4. A total of 65 patients had a dental fluorosis index greater than or equal to 2, and one of them failed in the sample quality control. The saliva samples of the remaining 64 patients were included in the subsequent microbiome analyses, and 36 patients with a Dean index of 1 were selected at random”
Citations
Cites
DADA2: High–resolution sample inference from Illumina amplicon data
Callahan, B. J., McMurdie, P. J., Rosen, M. J., Han, A. W., Johnson, A. J. A., & Holmes, S. P. (2016) · Nature Methods · doi:10.1038/nmeth.3869 · Cited by 35,698
The SILVA ribosomal RNA gene database project: improved data processing and web-based tools
Quast, C., Pruesse, E., Yilmaz, P., Gerken, J., Schweer, T., Yarza, P., Peplies, J., & Glöckner, F. O. (2012) · Nucleic Acids Research · doi:10.1093/nar/gks1219 · Cited by 33,055
Reproducible, interactive, scalable and extensible microbiome data science using QIIME 2
Bolyen, E., Rideout, J. R., Dillon, M. R., Bokulich, N. A., Abnet, C. C., Al-Ghalith, G. A., Alexander, H., Alm, E. J., Arumugam, M., Asnicar, F., et al. (2019) · Nature Biotechnology · doi:10.1038/s41587-019-0209-9 · Cited by 23,742
Self-citationFLASH: fast length adjustment of short reads to improve genome assemblies
Magoč, T., & Salzberg, S. L. (2011) · Bioinformatics · doi:10.1093/bioinformatics/btr507 · Cited by 15,366
VSEARCH: a versatile open source tool for metagenomics
(2016) · doi:10.7717/peerj.2584 · Cited by 10,773
PICRUSt2 for prediction of metagenome functions
Douglas, G. M., Maffei, V. J., Zaneveld, J. R., Yurgel, S. N., Brown, J. R., Taylor, C. M., Huttenhower, C., & Langille, M. G. I. (2020) · Nature Biotechnology · doi:10.1038/s41587-020-0548-6 · Cited by 6,709
Role of Streptococcus mutans in human dental decay
Loesche, W. J. (1986) · Microbiological Reviews · doi:10.1128/mr.50.4.353-380.1986 · Cited by 3,364
Statistical Methods for Detecting Differentially Abundant Features in Clinical Metagenomic Samples
White, J. R., Nagarajan, N., & Pop, M. (2009) · PLoS Computational Biology · doi:10.1371/journal.pcbi.1000352 · Cited by 1,602
Fan, X., Alekseyenko, A. V., Wu, J., Peters, B. A., Jacobs, E. J., Gapstur, S. M., Purdue, M. P., Abnet, C. C., Stolzenberg-Solomon, R., Miller, G., et al. (2018) · Gut · doi:10.1136/gutjnl-2016-312580 · Cited by 702
The role of the microbiota in periodontal disease
Curtis, M. A., Diaz, P. I., & Van Dyke, T. E. (2020) · Periodontology 2000 · doi:10.1111/prd.12296 · Cited by 698
Cited by
Sorted by citations
Does fluoride exposure impact on the human microbiome?
Moran, G. P., Zgaga, L., Daly, B., Harding, M., & Montgomery, T. (2023) · Toxicology Letters · doi:10.1016/j.toxlet.2023.03.001 · Cited by 18
Wu, J., Liu, F., Sun, J., Wei, Q., Kang, W., Wang, F., Zhang, C., Zhao, M., Xu, S., & Han, B. (2024) · Chemosphere · doi:10.1016/j.chemosphere.2024.142207 · Cited by 16
Self-citationWorldwide Variations in Fluoride Content in Beverages for Infants
Vélez-León, E. M., Pacheco-Quito, E.-M., Díaz‐Dosque, M., & Tobar-Almache, D. (2023) · Children · doi:10.3390/children10121896 · Cited by 11
Li, Y., Yang, F., Liu, J., Jiang, M., Ye, Y., Zhou, Q., Sun, L., Zhang, Z., & Zhou, L. (2024) · Ecotoxicology and Environmental Safety · doi:10.1016/j.ecoenv.2024.116284 · Cited by 11
Zaazou, M. H., Saleh, R. S., Hassan, S. N., Abdelnabi, A., Zaki, Z. M., Hamdy, T. M., Zaki, D. Y., & Moharam, L. M. (2024) · Bulletin of the National Research Centre/Bulletin of the National Research Center · doi:10.1186/s42269-024-01219-w · Cited by 8
Biosensors in dental, oral and craniofacial applications
Tai, Y., Li, Y., Mornay, K. M., Woodard, M., Wang, W., Yang, X., & Pan, J. (2026) · npj Biosensing · doi:10.1038/s44328-026-00079-w · Cited by 8
Study on improving the fluorine removal performance of Chitosan-Al2(SO4)3 modified bauxite
Liu, X., Li, H., Zhang, S., Zhong, Y., Chen, X., & Cao, J. (2024) · Journal of Solid State Chemistry · doi:10.1016/j.jssc.2024.124916 · Cited by 5
Shi, X., Liu, W., Ma, L., Liu, M., Xu, T., Shu, X., Gao, L., Wang, R., Chen, Y., Li, L., et al. (2025) · Pathogens · doi:10.3390/pathogens14121294 · Cited by 3
Liu, S., Ding, L., Li, Z., Wang, Q., Xu, L., Ma, Q., Zhao, B. L., Liu, H., Guan, J., & Zhang, K. (2025) · Chemical Engineering Journal · doi:10.1016/j.cej.2025.162426 · Cited by 3
Self-citationJianhui, F. A. N., Xuebing, W., & Guo, S. (2023) · Materials Science · doi:10.5755/j02.ms.33694 · Cited by 2
A comparison of three whitening protocols for mild-to-moderate dental fluorosis in anterior teeth
Zhou, M. (2025) · American Journal of Translational Research · doi:10.62347/rkqx9577 · Cited by 2
Wang, Q., Zhai, Y., Zhang, Y., Li, Z., Wang, Q., & Liu, S. (2026) · International Dental Journal · doi:10.1016/j.identj.2026.109461 · Cited by 2
Self-citationBroad-based targeted lipidomic analysis of dental fluorosis population in an adult population
Kong, H., Liu, S., Li, Z., Xu, L., Zhang, K., & Wang, Y. (2025) · Chemistry and Physics of Lipids · doi:10.1016/j.chemphyslip.2025.105471 · Cited by 2
Self-citationFeasibility of salivary lipid screening for caries biomarkers in young adults
Li, Z., Zhang, K., Wang, D., Hu, J., Liu, S., & Xu, L. (2025) · BMC Oral Health · doi:10.1186/s12903-025-07319-x · Cited by 1
Self-citationOral and dental health of adolescents with fluorosis. A case report
Angelova, S. T. (2023) · Известия на Съюза на учените – Варна Серия „Медицина и екология” · doi:10.14748/isuvsme.v28i2.9585
Linking Nutrition and Dental Health
Dedebayraktar, D., & Buyuktuncer, Z. (2025) · Springer eBooks · doi:10.1007/978-3-031-32047-7_149-1
Li, Z., Peng, X., Wang, Q., Guo, L., Liu, S., & Xu, L. (2025) · Frontiers in Microbiology · doi:10.3389/fmicb.2025.1732083
Self-citationMandetta, A. R. H. (2023) · LA Referencia (Red Federada de Repositorios Institucionales de Publicaciones Científicas)
Шнайдер, Д. С., Dienga, A. E., Глазунов, О. А., Skulska, S. V., Diieva, T. V., Tsevukh, L. B., & Осадча, А. О. (2025) · World of Medicine and Biology · doi:10.26724/2079-8334-2025-4-94-140-144
Zhao, Y., Kuang, B.-F., Dusenge, M. A., Liu, Q., Zhang, F., & Zhou, Y. (2026) · Frontiers in Genetics · doi:10.3389/fgene.2026.1791446
Analysis of salivary metabolites and microbial characteristics in patients with dental fluorosis
Zhai, Y., Wang, D. N., Li, Z., Cui, T., Zhang, R., Liu, Y., Liu, H. W., & Liu, S. (2026) · Clinical Oral Investigations · doi:10.1007/s00784-026-06957-x
Self-citationLiu, L., Wang, Q., Zhang, Y., Zhai, Y., Liu, S., & Chen, W. (2026) · Scientific Reports · doi:10.1038/s41598-026-62911-7
Self-citationZhang, Y., Wang, Q., Zhai, Y., Wang, Q., Li, Z., Liu, Y., & Liu, S. (2026) · Journal of Oral Microbiology · doi:10.1080/20002297.2026.2711156
Self-citationШнайдер, Д. С., Dienga, A. E., Gorokhivskiy, V. N., Mirchuk, B. M., Yefremova, O. V., Kordonets, O. L., & Suslova, O. V. (2026) · World of Medicine and Biology · doi:10.26724/2079-8334-2026-3-97-166-171
Metadata
- Authors
- Liu, S., Song, Q., Zhang, C., Li, M., Li, Z., Liu, Y., Xu, L., Xie, X., Zhao, L., Zhang, R., Wang, Q., Zeng, G., Zhang, Y., & Zhang, K.
- Affiliations
- Bengbu Medical College (CN)
- Department of Stomatology, Huaiyuan county people’s Hospital, Bengbu, China
- First Affiliated Hospital of Bengbu Medical College (CN)
- Department of Stomatology, The First Affiliated Hospital of Bengbu Medical College, Bengbu, China
- Corresponding author
- Zhang, Kai
- ORCID
- Venue
- Journal of Oral Microbiology
- Publisher
- Informa UK Limited
- Published
- 2023-02-20
- Volume
- 15
- Issue
- 1
- Pages
- 2180927-2180927
- ISSN
- 2000-2297 (ISSN-L)
- PMC
- PMC9946311
- OpenAlex
- W4321458033
- Semantic Scholar
- 3f1a9183cfd6ba6676871f4b416061cbf4f91736
- Cited by
- 24
- References
- 65
- Citations by year
- 2026: 7 · 2025: 8 · 2024: 4 · 2023: 5
- FWCI
- 4.26
- Type
- journal article
- Language
- en
- Open access
- gold
- doi.org
- Locations
- Journal of Oral Microbiology (publishedVersion, cc-by)
- PubMed Central (publishedVersion, cc-by)
- PubMed (publishedVersion)
- DOAJ (DOAJ: Directory of Open Access Journals) (submittedVersion, cc-by-sa)
- Funders
- National Natural Science Foundation of China (32000386)
- the First Affiliated Hospital of Bengbu Medical College Science Fund for Outstanding Young Scholars (2019byyfyyq07)
- the University Synergy Innovation Program of Anhui Province, China (GXXT-2021-056)
- Key project of natural science of Bengbu Medical College (2020byzd058)
- Topics
- Health Sciences › Dentistry › Periodontics › Oral microbiology and periodontitis research
- Health Sciences › Dentistry › General Dentistry › Dental Health and Care Utilization
- Life Sciences › Biochemistry, Genetics and Molecular Biology › Molecular Biology › Gut microbiota and health
- Keywords
- dental fluorosis, salivary microbiome, oral microbiota, microbial diversity, Dean's fluorosis index, Vibrio metschnikovii, Pseudomonas, Streptococcus mutans, arginine biosynthesis, carbohydrate metabolism, periodontitis, university students
About these checks
Registry, retraction, Cites and statistics results are computed, not judged, with one exception: a printed reference that no index lists is read once by a model before it counts as a citation error. Claims are extracted by a model and kept only when their quote appears verbatim in the text; each cited source is then checked, with a model’s help, for whether it says what the claim relies on. Those verdicts can be wrong — read the claim’s quote and the cited source before relying on one.
A language model drew the claims from the paper on 2026-11-10, under version 3 of the claim definition (model deepseek-v4.1-flash, prompt extract-v3).
A second model labelled each claim on 2026-11-10 (model jev-1.13-20260917, definition revision gold-guideline-v0.2).
Cited sources are checked with a language model’s help (gpt-6-sol).
Statistics and arithmetic are recomputed, not judged.
Confidence bands are shown only for fields calibrated on our annotated test set. None is calibrated yet, so no band is shown.
What counts as a claim ›How we measure confidence ›How we check this ›
Are you an author, or do you see a problem with this page? Request a review
