

Mapping gene regulatory networks from single-cell omics data
Open accessThe DOI matches its Crossref record; 102 of the 102 references it cites were found in a registry or an index; 43 of the 104 sources its claims cite were checked for support.
Abstract
Single-cell techniques are advancing rapidly and are yielding unprecedented insight into cellular heterogeneity. Mapping the gene regulatory networks (GRNs) underlying cell states provides attractive opportunities to mechanistically understand this heterogeneity. In this review, we discuss recently emerging methods to map GRNs from single-cell transcriptomics data, tackling the challenge of increased noise levels and data sparsity compared with bulk data, alongside increasing data volumes. Next, we discuss how new techniques for single-cell epigenomics, such as single-cell ATAC-seq and single-cell DNA methylation profiling, can be used to decipher gene regulatory programmes. We finally look forward to the application of single-cell multi-omics and perturbation techniques that will likely play important roles for GRN inference in the future.
Overview
CoChat Summary
TL;DR
This review surveys emerging computational and experimental approaches for mapping gene regulatory networks (GRNs) from single-cell omics, focusing on scRNA-seq, single-cell epigenomics, multi-omics, and perturbation assays. It argues that single-cell data can already infer regulatory associations despite noise and sparsity, while epigenomic and multi-omics methods remain less mature.
Key findings
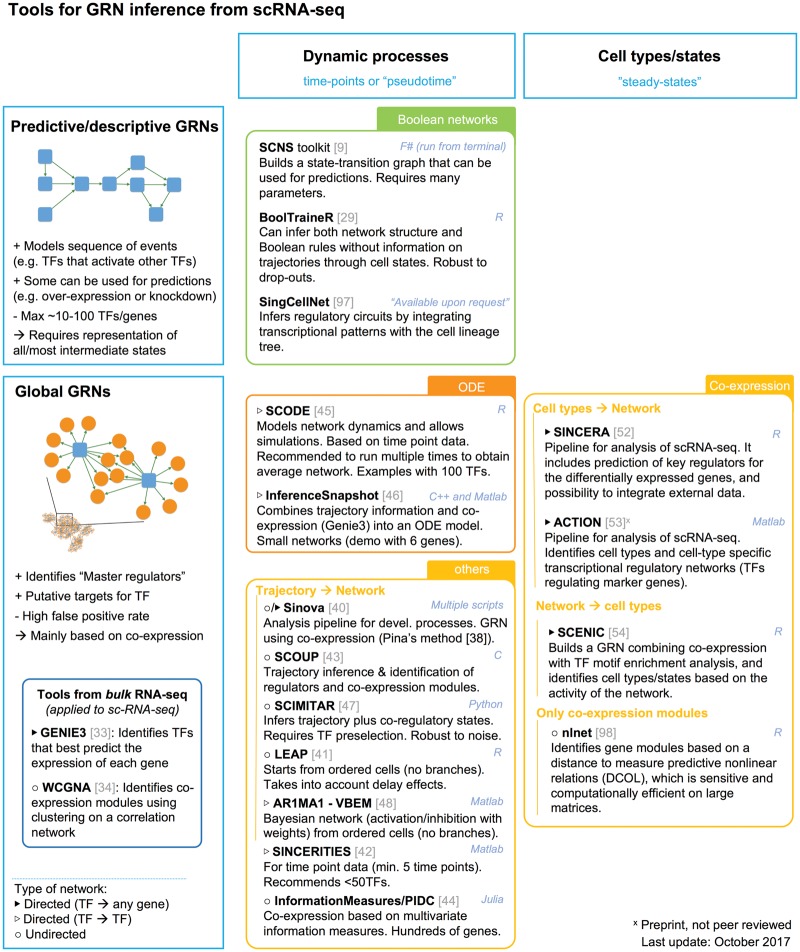
- GRN inference from scRNA-seq can identify co-regulated genes, master regulators, and dynamic state transitions; methods include Boolean networks (e.g., SCNS, BoolTraineR), co-expression-based approaches, ODE models, and SCENIC, which integrates co-expression with motif enrichment. Boolean networks can model only a small number of genes (<100).
- scATAC-seq methods differ in throughput and coverage: combinatorial indexing yields 500–1500 single cells per run versus 96 cells with microfluidics, but median reads per cell are 2503 for combinatorial indexing versus 73,000 for the microfluidic approach. Single-cell chromatin accessibility data are even sparser than scRNA-seq and require specialized methods such as chromVAR, Cicero, scABC, and latent semantic indexing.
- Single-cell methylation methods vary in coverage: scRRBS detects only 10% of all CpG sites (0.5–1.5 CpGs per single cell), scCGI-seq detects up to 76% of all CGIs on average per cell, and scBS-seq can detect up to 48% of CpG sites. DeepCpG is described as a deep neural network approach to predict missing methylation states and link methylation states to motifs.
- CRISPR-based perturbation methods (CRISP-seq, Perturb-seq, CROP-seq, Mosaic-seq) typically target 10–30 genes, TFs, or enhancers per experiment, with an average of three gRNAs per target; single-cell multi-omics techniques still have high cost per cell and limited throughput.
Methods
- Review article; no primary experimental data or new analysis are presented. It synthesizes published single-cell omics and computational GRN inference methods.
- Covers scRNA-seq, single-cell epigenomics (scATAC-seq and DNA methylation profiling), single-cell multi-omics, and CRISPR-based perturbation assays, citing examples and tools.
- No formal systematic review, meta-analysis, sample size, or statistical analysis is described.
Limitations
- Stated: single-cell transcriptomes are less sensitive and informative than bulk data because of biological variation and technical limitations, including dropouts; TFs are typically lowly expressed. scATAC-seq data are even sparser and nearly binary, and multi-omics methods have high cost and limited throughput.
- Stated: CRISPR perturbation methods face challenges with gRNA specificity and efficiency and accurate detection of gRNA barcodes; benchmarking studies are needed to determine best-performing methods.
- Evident from the text: as a review, it provides no new data or quantitative benchmarking, and its conclusions reflect the authors’ synthesis and perspective on cited literature.
Model-written summary. Check it against the paper before relying on it.
Integrity signals
Registry
Cites
Statistics
Figures

Verification
Claims the paper makes
28 Valid · 5 Not valid · 43 Not checked · 41 Own results and interpretations
Every source the paper cites for this claim was checked and supports it.
In the paper
“by Gaublomme et al. [37] to identify pathogenicity regulators that co-vary with pro-inflammatory genes”
§ Mapping gene regulatory networks from single-cell omics data > GRN inference from scRNA-seq data
What the sources say
- Supportedcites [37] Gaublomme, 2015, Single-cell genomics unveils critical regulators of Th17 cell pathogenicity, Cell source
In Results, the authors describe analyzing transcript co-variation across single Th17 cells and finding a module that co-varies with pro-inflammatory cytokines. They then use the modules to prioritize putative pathogenicity regulators for functional follow-up. (LLM, conf=0.94)
plainstates an association- Asserted: passes — The authors put it forward as true.
- Checkable: passes — It can be checked against evidence.
- Load-bearing: unclear — It is unclear whether the paper’s conclusions depend on it.
- Based: passes — The paper gives a reason why it holds.
- Rests on 2 assumptions not shown here.
- Supported
Every source the paper cites for this claim was checked and supports it.
In the paper
“In addition, these methods are sensitive to normalization and batch-effects, which may introduce artificial co-variation [39].”
§ Mapping gene regulatory networks from single-cell omics data > GRN inference from scRNA-seq data
What the sources say
- Supportedcites [39] Crow, 2016, Exploiting single-cell expression to characterize co-expression replicability, Genome Biol source
The Results and discussion section says sample-level standardization can induce artefactual co-variation and examines how co-variation across batches affects co-expression networks. The Conclusions also state that rank standardization can induce strong artefactual correlations. Page numbers are not available in our copy. (LLM, conf=0.88)
hedgedstates a possible cause- Asserted: passes — The authors put it forward as true.
- Checkable: passes — It can be checked against evidence.
- Load-bearing: unclear — It is unclear whether the paper’s conclusions depend on it.
- Based: passes — The paper gives a reason why it holds.
- Supported
Every source the paper cites for this claim was checked and supports it.
In the paper
“The activity of this GRN in each cell is then used to identify cell types/states, and key TFs that characterize each state with higher accuracy.”
§ Mapping gene regulatory networks from single-cell omics data > GRN inference from scRNA-seq data
What the sources say
- Supportedcites [54] Aibar, 2017, SCENIC: single-cell regulatory network inference and clustering, Nat Methods source
The SCENIC description says that activity of inferred regulons is scored in each cell and used to identify cell types and states. In the mouse-brain evaluation (passage 4), regulon activity revealed expected cell types and potential master regulators; clustering accuracy exceeded many dedicated methods, and transcription-factor predictions outperformed standard pipelines. (LLM, conf=0.91)
plainstates a cause- Asserted: passes — The authors put it forward as true.
- Checkable: passes — It can be checked against evidence.
- Load-bearing: passes — The paper’s conclusions depend on it.
- Based: passes — The paper gives a reason why it holds.
- Supported
Every source the paper cites for this claim was checked and supports it.
In the paper
“Finally, SCENIC [54]—developed in our laboratory—infers a GRN directly from the data, identifying direct regulatory interactions between TFs and targets by integrating co-expression with motif enrichment analysis.”
§ Mapping gene regulatory networks from single-cell omics data > GRN inference from scRNA-seq data
What the sources say
- Supportedcites [54] Aibar, 2017, SCENIC: single-cell regulatory network inference and clustering, Nat Methods source
The SCENIC workflow passage in Online Methods says GENIE3 identifies potential TF targets from co-expression and RcisTarget uses TF-motif enrichment to identify direct targets. The paper’s description of the first two workflow steps also explains that motif analysis prunes co-expression modules to remove indirect targets. (LLM, conf=0.93)
plainstates a cause- Asserted: passes — The authors put it forward as true.
- Checkable: passes — It can be checked against evidence.
- Load-bearing: passes — The paper’s conclusions depend on it.
- Based: passes — The paper gives a reason why it holds.
- Rests on 2 assumptions not shown here.
- Supported
Every source the paper cites for this claim was checked and supports it.
In the paper
“and by Pina et al. [38] to reconstruct a GRN of haematopoiesis based on pairwise associations.”
§ Mapping gene regulatory networks from single-cell omics data > GRN inference from scRNA-seq data
What the sources say
- Supportedcites [38] Pina, 2015, Single-cell network analysis identifies DDIT3 as a nodal lineage regulator in hematopoiesis, Cell Rep source
The Experimental Procedures section 'Classification and Network Inference' states that 'Single-cell transcriptional networks were inferred by calculating significant pairwise associations using both continuous (Spearman rank correlations) and binary (OR) components of linearly transformed expression data,' i.e. a co-expression-like pairwise approach. The Results (Figure 2E passage) confirm they 'combined gene associations obtained by both methodologies to infer putative regulatory networks characterizing SR states and the different modes of lineage commitment,' and the Introduction frames this as exploring 'gene expression networks around the erythroid versus myelo-monocytic lineage choice of multipotent hematopoietic progenitor cells' to gain insight into 'the evolution of GRNs relevant to lineage specification.' The only mild stretch is scope — the reconstructed network concerns the erythro-myeloid bifurcation in mouse progenitors rather than hematopoiesis as a whole — but the paper itself describes its output in GRN terms for hematopoietic lineage specification, so the attribution holds. (LLM, conf=0.86)
plainstates an association- Asserted: passes — The authors put it forward as true.
- Checkable: passes — It can be checked against evidence.
- Load-bearing: unclear — It is unclear whether the paper’s conclusions depend on it.
- Based: passes — The paper gives a reason why it holds.
- Rests on 2 assumptions not shown here.
- Supported
46 more claims · 11 with their cited sources checked
Create a free account to see all 117 claims and to verify the 61 references still open.
- Probably not a substantial claim. 37
- It may state two separate claims as one. 42
Claims other papers make about this one
Each is checked against this paper’s own text: does it say what the citing paper says it does?
The cited source says what the claim attributes to it.
In the citing paper
“In this respect, gene-regulatory network (GRN) modelling approaches are promising as they reconstruct systematic gene–gene associations from unperturbed single-cell omics data6–11.”
From Dissecting cell identity via network inference and in silico gene perturbation (2023) · cites this paper as [6]
The check wasn’t confident either way, so it gives no verdict — never disputed.
In the citing paper
“However, these methods could not be generalized to unseen perturbations.”
From A systematic comparison of single-cell perturbation response prediction models (2026) · cites this paper as [11]
Experimental — accuracy not yet measured
Self-check
Percentages, sums and reported differences re-computed from the paper’s own numbers.
Each contradiction between two passages listed here was confirmed by an independent check.
Rated minor: it would not touch a result — a value no result rests on, a p-value that stays on the same side of the significance level, or a conflict that is clerical, resolved elsewhere in the paper, or outside its own findings.
In the paper
§ Mapping gene regulatory networks from single-cell omics data > Single-cell epigenomics
“single-cell CpG island sequencing (scCGI-seq) [71]”
§ Mapping gene regulatory networks from single-cell omics data > Single-cell epigenomics
“The same is true for scGCI-seq, which combines methylation-sensitive restriction enzyme digestion and multiple displacement amplification”
Citations
Cites
WGCNA: an R package for weighted correlation network analysis
Langfelder, P., & Horvath, S. (2008) · BMC Bioinformatics · doi:10.1186/1471-2105-9-559 · Cited by 27,252
Takahashi, K., & Yamanaka, S. (2006) · Cell · doi:10.1016/j.cell.2006.07.024 · Cited by 26,673
Massively parallel digital transcriptional profiling of single cells
Zheng, G. X. Y., Terry, J. M., Belgrader, P., Ryvkin, P., Bent, Z. W., Wilson, R., Ziraldo, S. B., Wheeler, T. D., McDermott, G. P., Zhu, J., et al. (2017) · Nature Communications · doi:10.1038/ncomms14049 · Cited by 7,353
Highly parallel genome-wide expression profiling of individual cells using nanoliter droplets.
Macosko, E. Z., Basu, A., Satija, R., Nemesh, J., Shekhar, K., Goldman, M., Tirosh, I., Bialas, A. R., Kamitaki, N., Martersteck, E. M., et al. (2015) · Cell · doi:10.1016/j.cell.2015.05.002 · Cited by 7,110
Scenic: single-cell regulatory network inference and clustering.
Aibar, S., González-Blas, C. B., Moerman, T., Huynh-Thu, V. A., Imrichova, H., Hulselmans, G., Rambow, F., Marine, J.-C., Geurts, P., Aerts, J., et al. (2017) · Nature Methods · doi:10.1038/nmeth.4463 · Cited by 6,520
Self-citationFunctions of DNA methylation: islands, start sites, gene bodies and beyond
Jones, P. A. (2012) · Nature Reviews Genetics · doi:10.1038/nrg3230 · Cited by 6,061
Reversed graph embedding resolves complex single-cell trajectories
Qiu, X., Mao, Q., Tang, Y., Wang, L., Chawla, R., Pliner, H. A., & Trapnell, C. (2017) · Nature Methods · doi:10.1038/nmeth.4402 · Cited by 5,070
Single-cell RNA-seq highlights intratumoral heterogeneity in primary glioblastoma
Patel, A. P., Tirosh, I., Trombetta, J. J., Shalek, A. K., Gillespie, S. M., Wakimoto, H., Cahill, D. P., Nahed, B. V., Curry, W. T., Martuza, R. L., et al. (2014) · Science · doi:10.1126/science.1254257 · Cited by 5,063
mRNA-Seq whole-transcriptome analysis of a single cell
Tang, F., Barbacioru, C., Wang, Y., Nordman, E., Lee, C., Xu, N., Wang, X., Bodeau, J., Tuch, B. B., Siddiqui, A., et al. (2009) · Nature Methods · doi:10.1038/nmeth.1315 · Cited by 3,969
Cell types in the mouse cortex and hippocampus revealed by single-cell RNA-seq
Zeisel, A., Muñoz-Manchado, A. B., Codeluppi, S., Lönnerberg, P., La Manno, G., Juréus, A., Marques, S., Munguba, H., He, L., Betsholtz, C., et al. (2015) · Science · doi:10.1126/science.aaa1934 · Cited by 3,124
DNA methylation: roles in mammalian development
Smith, Z. D., & Meissner, A. (2013) · Nature Reviews Genetics · doi:10.1038/nrg3354 · Cited by 3,045
DNA methylation and human disease
Robertson, K. D. (2005) · Nature Reviews Genetics · doi:10.1038/nrg1655 · Cited by 2,864
Direct reprogramming of fibroblasts into functional cardiomyocytes by defined factors
Ieda, M., Fu, J.-D., Delgado-Olguin, P., Vedantham, V., Hayashi, Y., Bruneau, B. G., & Srivastava, D. (2010) · Cell · doi:10.1016/j.cell.2010.07.002 · Cited by 2,454 · cited 1×
“other reprogramming routes that steer a GRN from one state to another using specific combinations of TFs [3, 4] and recent attempts in cancer therapy, in which cancer cells are pushed into a state that is vulnerable to a particular drug [5, 6].”
BackgroundSingle-cell chromatin accessibility reveals principles of regulatory variation
Buenrostro, J. D., Wu, B., Litzenburger, U. M., Ruff, D., Gonzales, M. L., Snyder, M. P., Chang, H. Y., & Greenleaf, W. J. (2015) · Nature · doi:10.1038/nature14590 · Cited by 2,308
Inferring Regulatory Networks from Expression Data Using Tree-Based Methods
Huynh-Thu, V. A., Irrthum, A., Wehenkel, L., & Geurts, P. (2010) · PLoS ONE · doi:10.1371/journal.pone.0012776 · Cited by 2,131
Dixit, A., Parnas, O., Li, B., Chen, J., Fulco, C. P., Jerby-Arnon, L., Marjanovic, N. D., Dionne, D., Burks, T., Raychowdhury, R., et al. (2016) · Cell · doi:10.1016/j.cell.2016.11.038 · Cited by 1,863
Adult mouse cortical cell taxonomy revealed by single cell transcriptomics
Tasic, B., Menon, V., Nguyen, T. N., Kim, T. K., Jarsky, T., Yao, Z., Levi, B., Gray, L. T., Sorensen, S. A., Dolbeare, T., et al. (2016) · Nature Neuroscience · doi:10.1038/nn.4216 · Cited by 1,714
chromVAR: inferring transcription-factor-associated accessibility from single-cell epigenomic data
Schep, A. N., Wu, B., Buenrostro, J. D., & Greenleaf, W. J. (2017) · Nature Methods · doi:10.1038/nmeth.4401 · Cited by 1,680
Wisdom of crowds for robust gene network inference
The DREAM5 Consortium, Marbach, D., Costello, J. C., Küffner, R., Vega, N. M., Prill, R. J., Camacho, D. M., Allison, K. R., Kellis, M., Collins, J. J., et al. (2012) · Nature Methods · doi:10.1038/nmeth.2016 · Cited by 1,667
A census of human transcription factors: function, expression and evolution
Vaquerizas, J. M., Kummerfeld, S. K., Teichmann, S. A., & Luscombe, N. M. (2009) · Nature Reviews Genetics · doi:10.1038/nrg2538 · Cited by 1,573
Comparative Analysis of Single-Cell RNA Sequencing Methods
Ziegenhain, C., Vieth, B., Parekh, S., Reinius, B., Guillaumet-Adkins, A., Smets, M., Leonhardt, H., Heyn, H., Hellmann, I., & Enard, W. (2017) · Molecular Cell · doi:10.1016/j.molcel.2017.01.023 · Cited by 1,494
Modelling and analysis of gene regulatory networks
Karlebach, G., & Shamir, R. (2008) · Nature Reviews Molecular Cell Biology · doi:10.1038/nrm2503 · Cited by 1,296
Multiplex single-cell profiling of chromatin accessibility by combinatorial cellular indexing
Cusanovich, D. A., Daza, R., Adey, A., Pliner, H. A., Christiansen, L., Gunderson, K. L., Steemers, F. J., Trapnell, C., & Shendure, J. (2015) · Science · doi:10.1126/science.aab1601 · Cited by 1,248
Adamson, B., Norman, T. M., Jost, M., Cho, M. Y., Nuñez, J. K., Chen, Y., Villalta, J. E., Gilbert, L. A., Horlbeck, M. A., Hein, M. Y., et al. (2016) · Cell · doi:10.1016/j.cell.2016.11.048 · Cited by 1,193
Computational and analytical challenges in single-cell transcriptomics
Stegle, O., Teichmann, S. A., & Marioni, J. C. (2015) · Nature Reviews Genetics · doi:10.1038/nrg3833 · Cited by 1,170
Corces, M. R., Buenrostro, J. D., Wu, B., Greenside, P. G., Chan, S. M., Koenig, J. L., Snyder, M. P., Pritchard, J. K., Kundaje, A., Greenleaf, W. J., et al. (2016) · Nature Genetics · doi:10.1038/ng.3646 · Cited by 1,151
Buettner, F., Natarajan, K. N., Casale, F. P., Proserpio, V., Scialdone, A., Theis, F. J., Teichmann, S. A., Marioni, J. C., & Stegle, O. (2015) · Nature Biotechnology · doi:10.1038/nbt.3102 · Cited by 1,136
Oligodendrocyte heterogeneity in the mouse juvenile and adult central nervous system
Marques, S., Zeisel, A., Codeluppi, S., van Bruggen, D., Mendanha Falcão, A., Xiao, L., Li, H., Häring, M., Hochgerner, H., Romanov, R. A., et al. (2016) · Science · doi:10.1126/science.aaf6463 · Cited by 1,132
Single-cell genome-wide bisulfite sequencing for assessing epigenetic heterogeneity
Smallwood, S. A., Lee, H. J., Angermueller, C., Krueger, F., Saadeh, H., Peat, J., Andrews, S. R., Stegle, O., Reik, W., & Kelsey, G. (2014) · Nature Methods · doi:10.1038/nmeth.3035 · Cited by 1,125
Pooled CRISPR screening with single-cell transcriptome readout.
Datlinger, P., Rendeiro, A. F., Schmidl, C., Krausgruber, T., Traxler, P., Klughammer, J., Schuster, L. C., Kuchler, A., Alpar, D., & Bock, C. (2017) · Nature Methods · doi:10.1038/nmeth.4177 · Cited by 1,096
Single-cell RNA-seq reveals dynamic paracrine control of cellular variation
Shalek, A. K., Satija, R., Shuga, J., Trombetta, J. J., Gennert, D., Lu, D., Chen, P., Gertner, R. S., Gaublomme, J. T., Yosef, N., et al. (2014) · Nature · doi:10.1038/nature13437 · Cited by 1,000
Gene co-expression analysis for functional classification and gene–disease predictions
van Dam, S., Võsa, U., van der Graaf, A., Franke, L., & de Magalhães, J. P. (2017) · Briefings in Bioinformatics · doi:10.1093/bib/bbw139 · Cited by 995
Neuronal subtypes and diversity revealed by single-nucleus RNA sequencing of the human brain
Lake, B. B., Ai, R., Kaeser, G. E., Salathia, N. S., Yung, Y. C., Liu, R., Wildberg, A., Gao, D., Fung, H.-L., Chen, S., et al. (2016) · Science · doi:10.1126/science.aaf1204 · Cited by 957
Single-cell ChIP-seq reveals cell subpopulations defined by chromatin state
Rotem, A., Ram, O., Shoresh, N., Sperling, R. A., Goren, A., Weitz, D. A., & Bernstein, B. E. (2015) · Nature Biotechnology · doi:10.1038/nbt.3383 · Cited by 854
Beyond editing: repurposing CRISPR-Cas9 for precision genome regulation and interrogation
Dominguez, A. A., Lim, W. A., & Qi, L. S. (2016) · Nature Reviews Molecular Cell Biology · doi:10.1038/nrm.2015.2 · Cited by 832
Buganim, Y., Faddah, D. A., Cheng, A. W., Itskovich, E., Markoulaki, S., Ganz, K., Klemm, S. L., van Oudenaarden, A., & Jaenisch, R. (2012) · Cell · doi:10.1016/j.cell.2012.08.023 · Cited by 793
Dissecting Immune Circuits by Linking CRISPR-Pooled Screens with Single-Cell RNA-Seq
Jaitin, D. A., Weiner, A., Yofe, I., Lara-Astiaso, D., Keren-Shaul, H., David, E., Salame, T. M., Tanay, A., van Oudenaarden, A., & Amit, I. (2016) · Cell · doi:10.1016/j.cell.2016.11.039 · Cited by 777
How to infer gene networks from expression profiles
Bansal, M., Belcastro, V., Ambesi‐Impiombato, A., & di Bernardo, D. (2007) · Molecular Systems Biology · doi:10.1038/msb4100120 · Cited by 766
The origin and evolution of cell types
Arendt, D., Musser, J. M., Baker, C. V. H., Bergman, A., Cepko, C., Erwin, D. H., Pavlicev, M., Schlosser, G., Widder, S., Laubichler, M. D., et al. (2016) · Nature Reviews Genetics · doi:10.1038/nrg.2016.127 · Cited by 764 · cited 1×
“in an interplay with chromatin structure—to produce a specific gene expression profile [1].”
BackgroundG&T-seq: parallel sequencing of single-cell genomes and transcriptomes
Macaulay, I. C., Haerty, W., Kumar, P., Li, Y. I., Hu, T. X., Teng, M. J., Goolam, M., Saurat, N., Coupland, P., Shirley, L. M., et al. (2015) · Nature Methods · doi:10.1038/nmeth.3370 · Cited by 750
Single-cell barcoding and sequencing using droplet microfluidics
Zilionis, R., Nainys, J., Veres, A., Savova, V., Zemmour, D., Klein, A. M., & Mazutis, L. (2017) · Nature Protocols · doi:10.1038/nprot.2016.154 · Cited by 727
Parallel single-cell sequencing links transcriptional and epigenetic heterogeneity
Angermueller, C., Clark, S. J., Lee, H. J., Macaulay, I. C., Teng, M. J., Hu, T. X., Krueger, F., Smallwood, S. A., Ponting, C. P., Voet, T., et al. (2016) · Nature Methods · doi:10.1038/nmeth.3728 · Cited by 717
Clark, S. J., Argelaguet, R., Kapourani, C.-A., Stubbs, T. M., Lee, H. J., Alda-Catalinas, C., Krueger, F., Sanguinetti, G., Kelsey, G., Marioni, J. C., et al. (2018) · Nature Communications · doi:10.1038/s41467-018-03149-4 · Cited by 657
Hou, Y., Guo, H., Cao, C., Li, X., Hu, B., Zhu, P., Wu, X., Wen, L., Tang, F., Huang, Y., et al. (2016) · Cell Research · doi:10.1038/cr.2016.23 · Cited by 647
Revealing the vectors of cellular identity with single-cell genomics
Wagner, A., Regev, A., & Yosef, N. (2016) · Nature Biotechnology · doi:10.1038/nbt.3711 · Cited by 632
Gene Regulatory Network Inference from Single-Cell Data Using Multivariate Information Measures
Chan, T. E., Stumpf, M. P. H., & Babtie, A. C. (2017) · Cell Systems · doi:10.1016/j.cels.2017.08.014 · Cited by 578
Single-cell genomics unveils critical regulators of Th17 cell pathogenicity
Gaublomme, J. T., Yosef, N., Lee, Y., Gertner, R. S., Yang, L. V., Wu, C., Pandolfi, P. P., Mak, T., Satija, R., Shalek, A. K., et al. (2015) · Cell · doi:10.1016/j.cell.2015.11.009 · Cited by 575
Power analysis of single-cell RNA-sequencing experiments
Svensson, V., Natarajan, K. N., Ly, L.-H., Miragaia, R. J., Labalette, C., Macaulay, I. C., Cvejic, A., & Teichmann, S. A. (2017) · Nature Methods · doi:10.1038/nmeth.4220 · Cited by 568
DeepCpG: accurate prediction of single-cell DNA methylation states using deep learning
Angermueller, C., Lee, H. J., Reik, W., & Stegle, O. (2017) · Genome Biology · doi:10.1186/s13059-017-1189-z · Cited by 536
Guo, H., Zhu, P., Wu, X., Li, X., Wen, L., & Tang, F. (2013) · Genome Research · doi:10.1101/gr.161679.113 · Cited by 518
Integrated genome and transcriptome sequencing of the same cell
Dey, S. S., Kester, L., Spanjaard, B., Bienko, M., & van Oudenaarden, A. (2015) · Nature Biotechnology · doi:10.1038/nbt.3129 · Cited by 502
Genome-wide Maps of Nuclear Lamina Interactions in Single Human Cells
Kind, J., Pagie, L., de Vries, S. S., Nahidiazar, L., Dey, S. S., Bienko, M., Zhan, Y., Lajoie, B., de Graaf, C. A., Amendola, M., et al. (2015) · Cell · doi:10.1016/j.cell.2015.08.040 · Cited by 482
Single-cell multiomics: multiple measurements from single cells
Macaulay, I. C., Ponting, C. P., & Voet, T. (2017) · Trends in Genetics · doi:10.1016/j.tig.2016.12.003 · Cited by 451
Matsumoto, H., Kiryu, H., Furusawa, C., Ko, M. S. H., Ko, S. B. H., Gouda, N., Hayashi, T., & Nikaido, I. (2017) · Bioinformatics · doi:10.1093/bioinformatics/btx194 · Cited by 439
Single-cell DNA methylome sequencing and bioinformatic inference of epigenomic cell-state dynamics
Farlik, M., Sheffield, N. C., Nuzzo, A., Datlinger, P., Schönegger, A., Klughammer, J., & Bock, C. (2015) · Cell Reports · doi:10.1016/j.celrep.2015.02.001 · Cited by 422
Characterizing transcriptional heterogeneity through pathway and gene set overdispersion analysis
Fan, J., Salathia, N., Liu, R., Kaeser, G. E., Yung, Y. C., Herman, J. L., Kaper, F., Fan, J.-B., Zhang, K., Chun, J., et al. (2016) · Nature Methods · doi:10.1038/nmeth.3734 · Cited by 392
Moignard, V., Woodhouse, S., Haghverdi, L., Lilly, A. J., Tanaka, Y., Wilkinson, A. C., Buettner, F., Macaulay, I. C., Jawaid, W., Diamanti, E., et al. (2015) · Nature Biotechnology · doi:10.1038/nbt.3154 · Cited by 380
SINCERA: A Pipeline for Single-Cell RNA-Seq Profiling Analysis
Guo, M., Wang, H., Potter, S. S., Whitsett, J. A., & Xu, Y. (2015) · PLOS Computational Biology · doi:10.1371/journal.pcbi.1004575 · Cited by 354
Multiplex genome engineering in human cells using all-in-one CRISPR/Cas9 vector system
Sakuma, T., Nishikawa, A., Kume, S., Chayama, K., & Yamamoto, T. (2014) · Scientific Reports · doi:10.1038/srep05400 · Cited by 352
Direct Lineage Conversion of Terminally Differentiated Hepatocytes to Functional Neurons
Marro, S., Pang, Z. P., Yang, N., Tsai, M.-C., Qu, K., Chang, H. Y., Südhof, T. C., & Wernig, M. (2011) · Cell Stem Cell · doi:10.1016/j.stem.2011.09.002 · Cited by 341
Multiplexed Engineering and Analysis of Combinatorial Enhancer Activity in Single Cells
Xie, S., Duan, J., Li, B., Zhou, P., & Hon, G. C. (2017) · Molecular Cell · doi:10.1016/j.molcel.2017.03.007 · Cited by 334
Genome-wide detection of DNase I hypersensitive sites in single cells and FFPE tissue samples
Jin, W., Tang, Q., Wan, M., Cui, K., Zhang, Y., Ren, G., Ni, B., Sklar, J., Przytycka, T. M., Childs, R., et al. (2015) · Nature · doi:10.1038/nature15740 · Cited by 332
Simultaneous profiling of transcriptome and DNA methylome from a single cell
Hu, Y., Huang, K., An, Q., Du, G., Hu, G., Xue, J., Zhu, X., Wang, C.-Y., Xue, Z., & Fan, G. (2016) · Genome Biology · doi:10.1186/s13059-016-0950-z · Cited by 300
Clark, S. J., Smallwood, S. A., Lee, H. J., Krueger, F., Reik, W., & Kelsey, G. (2017) · Nature Protocols · doi:10.1038/nprot.2016.187 · Cited by 270
A review on the computational approaches for gene regulatory network construction
Chai, L. E., Loh, S. K., Low, S. T., Mohamad, M. S., Deris, S., & Zakaria, Z. (2014) · Computers in Biology and Medicine · doi:10.1016/j.compbiomed.2014.02.011 · Cited by 265
Identifying cell populations with scRNASeq
Andrews, T. S., & Hemberg, M. (2018) · Molecular Aspects of Medicine · doi:10.1016/j.mam.2017.07.002 · Cited by 248
Papili Gao, N., Ud-Dean, S. M. M., Gandrillon, O., & Gunawan, R. (2018) · Bioinformatics · doi:10.1093/bioinformatics/btx575 · Cited by 235
Pott, S. (2017) · eLife · doi:10.7554/elife.23203 · Cited by 230
Computational methods for trajectory inference from single‐cell transcriptomics
Cannoodt, R., Saelens, W., & Saeys, Y. (2016) · European Journal of Immunology · doi:10.1002/eji.201646347 · Cited by 208
Specht, A. T., & Li, J. (2017) · Bioinformatics · doi:10.1093/bioinformatics/btw729 · Cited by 193
Comparing Statistical Methods for Constructing Large Scale Gene Networks
Allen, J. D., Xie, Y., Chen, M., Girard, L., & Xiao, G. (2012) · PLoS ONE · doi:10.1371/journal.pone.0029348 · Cited by 186
Comparative Analysis of Gene Regulatory Networks: From Network Reconstruction to Evolution
Thompson, D., Regev, A., & Roy, S. (2015) · Annual Review of Cell and Developmental Biology · doi:10.1146/annurev-cellbio-100913-012908 · Cited by 176
Reconstructing gene regulatory dynamics from high-dimensional single-cell snapshot data
Ocone, A., Haghverdi, L., Mueller, N. S., & Theis, F. J. (2015) · Bioinformatics · doi:10.1093/bioinformatics/btv257 · Cited by 155
Navigating cancer network attractors for tumor-specific therapy
Creixell, P., Schoof, E. M., Erler, J. T., & Linding, R. (2012) · Nature Biotechnology · doi:10.1038/nbt.2345 · Cited by 153
Sanchez-Castillo, M., Blanco, D., Tienda-Luna, I. M., Carrion, M. C., & Huang, Y. (2018) · Bioinformatics · doi:10.1093/bioinformatics/btx605 · Cited by 151
Rapid and efficient one-step generation of paired gRNA CRISPR-Cas9 libraries
Vidigal, J. A., & Ventura, A. (2015) · Nature Communications · doi:10.1038/ncomms9083 · Cited by 146
Multi-omics of single cells: strategies and applications
Bock, C., Farlik, M., & Sheffield, N. C. (2016) · Trends in Biotechnology · doi:10.1016/j.tibtech.2016.04.004 · Cited by 146
Tracing dynamic changes of DNA methylation at single cell resolution
Stelzer, Y., Shivalila, C. S., Soldner, F., Markoulaki, S., & Jaenisch, R. (2015) · Cell · doi:10.1016/j.cell.2015.08.046 · Cited by 141
Welch, J. D., Hartemink, A. J., & Prins, J. F. (2017) · Genome Biology · doi:10.1186/s13059-017-1269-0 · Cited by 140
Logic-based models in systems biology: a predictive and parameter-free network analysis method
Wynn, M. L., Consul, N., Merajver, S. D., & Schnell, S. D. (2012) · Integrative Biology · doi:10.1039/c2ib20193c · Cited by 136
An Automated Microwell Platform for Large-Scale Single Cell RNA-Seq
Yuan, J., & Sims, P. A. (2016) · Scientific Reports · doi:10.1038/srep33883 · Cited by 132
Unsupervised clustering and epigenetic classification of single cells
Zamanighomi, M., Lin, Z., Daley, T., Chen, X., Duren, Z., Schep, A., Greenleaf, W. J., & Wong, W. H. (2018) · Nature Communications · doi:10.1038/s41467-018-04629-3 · Cited by 120
Single-cell epigenomic variability reveals functional cancer heterogeneity
Litzenburger, U. M., Buenrostro, J. D., Wu, B., Shen, Y., Sheffield, N. C., Kathiria, A., Greenleaf, W. J., & Chang, H. Y. (2017) · Genome Biology · doi:10.1186/s13059-016-1133-7 · Cited by 115
Single-cell ATAC-seq: strength in numbers
Pott, S., & Lieb, J. D. (2015) · Genome Biology · doi:10.1186/s13059-015-0737-7 · Cited by 81
BTR: training asynchronous Boolean models using single-cell expression data
Lim, C. Y., Wang, H., Woodhouse, S., Piterman, N., Wernisch, L., Fisher, J., & Göttgens, B. (2016) · BMC Bioinformatics · doi:10.1186/s12859-016-1235-y · Cited by 81
Exploiting single-cell expression to characterize co-expression replicability
Crow, M., Paul, A., Ballouz, S., Huang, Z. J., & Gillis, J. (2016) · Genome Biology · doi:10.1186/s13059-016-0964-6 · Cited by 76
Single-cell network analysis identifies DDIT3 as a nodal lineage regulator in hematopoiesis
Pina, C., Teles, J., Fugazza, C., May, G., Wang, D., Guo, Y., Soneji, S., Brown, J., Edén, P., Ohlsson, M., et al. (2015) · Cell Reports · doi:10.1016/j.celrep.2015.05.016 · Cited by 72
Matsumoto, H., & Kiryu, H. (2016) · BMC Bioinformatics · doi:10.1186/s12859-016-1109-3 · Cited by 72
Systematic Reconstruction of Molecular Cascades Regulating GP Development Using Single-Cell RNA-Seq
Li, J., Luo, H., Wang, R., Lang, J., Zhu, S., Zhang, Z., Fang, J., Qu, K., Lin, Y.-T., Long, H., et al. (2016) · Cell Reports · doi:10.1016/j.celrep.2016.04.043 · Cited by 64
Han, L., Wu, H.-J., Zhu, H., Kim, K.-Y., Marjani, S. L., Riester, M., Euskirchen, G., Zi, X., Yang, J., Han, J., et al. (2017) · Nucleic Acids Research · doi:10.1093/nar/gkx026 · Cited by 53
A geometric approach to characterize the functional identity of single cells
Mohammadi, S., Ravindra, V., Gleich, D. F., & Grama, A. (2018) · Nature Communications · doi:10.1038/s41467-018-03933-2 · Cited by 51
Chen, H., Guo, J., Mishra, S. K., Robson, P., Niranjan, M., & Zheng, J. (2015) · Bioinformatics · doi:10.1093/bioinformatics/btu777 · Cited by 45
Single-cell transcriptogenomics reveals transcriptional exclusion of ENU-mutated alleles
Li, W., Calder, R. B., Mar, J. C., & Vijg, J. (2015) · Mutation Research - Fundamental and Molecular Mechanisms of Mutagenesis · doi:10.1016/j.mrfmmm.2015.01.002 · Cited by 34
Gao, N. P., Ud-Dean, S. M. M., & Gunawan, R. (2016) · bioRxiv (Cold Spring Harbor Laboratory) · doi:10.1101/089110 · Cited by 30
TRACING CO-REGULATORY NETWORK DYNAMICS IN NOISY, SINGLE-CELL TRANSCRIPTOME TRAJECTORIES
Cordero, P., & Stuart, J. M. (2016) · Pacific Symposium on Biocomputing (PSB) · doi:10.1142/9789813207813_0053 · Cited by 25
Clark, S. J., Argelaguet, R., Kapourani, C.-A., Stubbs, T. M., Lee, H. J., Alda-Catalinas, C., Krueger, F., Sanguinetti, G., Kelsey, G., Marioni, J. C., et al. (2017) · bioRxiv (Cold Spring Harbor Laboratory) · doi:10.1101/138685 · Cited by 21
Unsupervised clustering and epigenetic classification of single cellsPreprint
Zamanighomi, M., Lin, Z., Daley, T., et al. (2017) · bioRxiv (Cold Spring Harbor Laboratory) · doi:10.1101/143701 · Cited by 19
Synthesising executable gene regulatory networks from single-cell gene expression data
Fisher, J., Köksal, A. S., Piterman, N., & Woodhouse, S. (2015) · Lecture Notes in Computer Science · doi:10.1007/978-3-319-21690-4_38 · Cited by 18
Liu, H., Li, P., Zhu, M., Wang, X., Lu, J., & Yu, T. (2016) · PLOS ONE · doi:10.1371/journal.pone.0158247 · Cited by 17
Chromatin accessibility dynamics of myogenesis at single cell resolution
Pliner, H. A., Packer, J., McFaline-Figueroa, J. L., Cusanovich, D. A., Daza, R., Srivatsan, S., Qiu, X., Jackson, D., Minkina, A., Adey, A., et al. (2017) · doi:10.1101/155473 · Cited by 16
Decoding transcriptional states in cancer
Wouters, J., Atak, Z. K., & Aerts, S. (2017) · Current Opinion in Genetics & Development · doi:10.1016/j.gde.2017.01.003 · Cited by 13
Self-citationTake ACTION to characterize the functional identity of single cellsPreprint
Mohammadi, S., Ravindra, V., Gleich, D. F., et al. (2016) · bioRxiv (Cold Spring Harbor Laboratory) · doi:10.1101/081273 · Cited by 1
Cited by
A scalable SCENIC workflow for single-cell gene regulatory network analysis
Van de Sande, B., Flerin, C., Davie, K., De Waegeneer, M., Hulselmans, G., Aibar, S., Seurinck, R., Saelens, W., Cannoodt, R., Rouchon, Q., et al. (2020) · Nature Protocols · doi:10.1038/s41596-020-0336-2 · Cited by 1,494
Self-citationBenchmarking algorithms for gene regulatory network inference from single-cell transcriptomic data
Pratapa, A., Jalihal, A. P., Law, J. N., Bharadwaj, A., & Murali, T. M. (2020) · Nature Methods · doi:10.1038/s41592-019-0690-6 · Cited by 792
Dissecting cell identity via network inference and in silico gene perturbation
Kamimoto, K., Stringa, B., Hoffmann, C. M., Jindal, K., Solnica-Krezel, L., & Morris, S. A. (2023) · Nature · doi:10.1038/s41586-022-05688-9 · Cited by 677
Gene regulatory network inference in the era of single-cell multi-omics
Badia-i-Mompel, P., Wessels, L., Müller-Dott, S., Trimbour, R., Ramirez Flores, R. O., Argelaguet, R., & Saez-Rodriguez, J. (2023) · Nature Reviews Genetics · doi:10.1038/s41576-023-00618-5 · Cited by 469
cisTopic: cis-regulatory topic modeling on single-cell ATAC-seq data
Bravo González-Blas, C., Minnoye, L., Papasokrati, D., Aibar, S., Hulselmans, G., Christiaens, V., Davie, K., Wouters, J., & Aerts, S. (2019) · Nature Methods · doi:10.1038/s41592-019-0367-1 · Cited by 456
Self-citation
Metadata
- Authors
- Fiers, M. W. E. J., Minnoye, L., Aibar, S., Bravo González-Blas, C., Kalender Atak, Z., & Aerts, S.
- Affiliations
- VIB-KU Leuven Center for Brain & Disease Research (BE)
- VIB Center for Brain & Disease Research, Laboratory of Computational Biology, Leuven, Belgium
- Corresponding author
- Aerts, Stein
- Venue
- Briefings in Functional Genomics
- Publisher
- Oxford University Press (OUP)
- Published
- 2018-01-12
- Volume
- 17
- Issue
- 4
- Pages
- 246-254
- ISSN
- 2041-2647 (ISSN-L)
- 2041-2649
- 2041-2657
- PMC
- PMC6063279
- OpenAlex
- W2783975438
- Cited by
- 235
- References
- 99
- Citations by year
- 2026: 13 · 2025: 15 · 2024: 23 · 2023: 35 · 2022: 42 · 2021: 28 · 2020: 34 · 2019: 22 · 2018: 21
- FWCI
- 1.97
- Type
- journal article
- Language
- en
- Open access
- hybrid
- doi.org
- Licence
- Locations
- Briefings in Functional Genomics (publishedVersion, cc-by)
- Europe PMC (PubMed Central) (publishedVersion, cc-by)
- PubMed Central (publishedVersion, cc-by)
- PubMed (publishedVersion)
- Lirias (KU Leuven) (submittedVersion, other-oa)
- Funders
- The Research Foundation – Flanders (G.0640.13, G.0791.14, G092916N)
- Special Research Fund
- KU Leuven (PF/10/016, OT/13/103)
- Foundation Against Cancer (2012-F2, 2016-070, 2015-143)
- ERC Consolidator (724226_cis-CONTROL)
- Topics
- Life Sciences › Biochemistry, Genetics and Molecular Biology › Molecular Biology › Gene Regulatory Network Analysis
- Life Sciences › Biochemistry, Genetics and Molecular Biology › Molecular Biology › Single-cell and spatial transcriptomics
- Life Sciences › Biochemistry, Genetics and Molecular Biology › Molecular Biology › Genomics and Chromatin Dynamics
- Keywords
- gene regulatory networks, single-cell transcriptomics, single-cell epigenomics, single-cell ATAC-seq, cellular heterogeneity, data sparsity, single-cell multi-omics, perturbation experiments
- MeSH terms
- Sequence Analysis, RNA, Gene Expression Profiling, Gene Regulatory Networks, Epigenomics, Single-Cell Analysis
About these checks
Registry, retraction, Cites and statistics results are computed, not judged, with one exception: a printed reference that no index lists is read once by a model before it counts as a citation error. Claims are extracted by a model and kept only when their quote appears verbatim in the text; each cited source is then checked, with a model’s help, for whether it says what the claim relies on. Those verdicts can be wrong — read the claim’s quote and the cited source before relying on one.
The claim verdicts this report counts are experimental: their accuracy is not yet measured.
A language model drew the claims from the paper on 2026-10-05, under version 3 of the claim definition (model deepseek-v4.1-flash, prompt extract-v3).
A second model labelled each claim on 2026-10-05 (model jev-1.13-20260917, definition revision gold-guideline-v0.2).
Cited sources are checked with a language model’s help (gpt-6-sol and qwen3.8-omni-flash).
Statistics and arithmetic are recomputed, not judged.
Confidence bands are shown only for fields calibrated on our annotated test set. None is calibrated yet, so no band is shown.
What counts as a claim ›How we measure confidence ›How we check this ›
Are you an author, or do you see a problem with this page? Request a review
Data sources
Bibliographic data: Semantic Scholar, OpenAlex, Crossref.
Contains information from the Semantic Scholar Academic Graph Datasets, made available under the ODC Attribution License (ODC-BY 1.0).
Semantic Scholar’s data is described in: Kinney, R., et al. (2023). The Semantic Scholar Open Data Platform. arXiv:2301.10140.
